AI & Automation
PD Reliability Console
An overview of the PD Reliability Platform Console
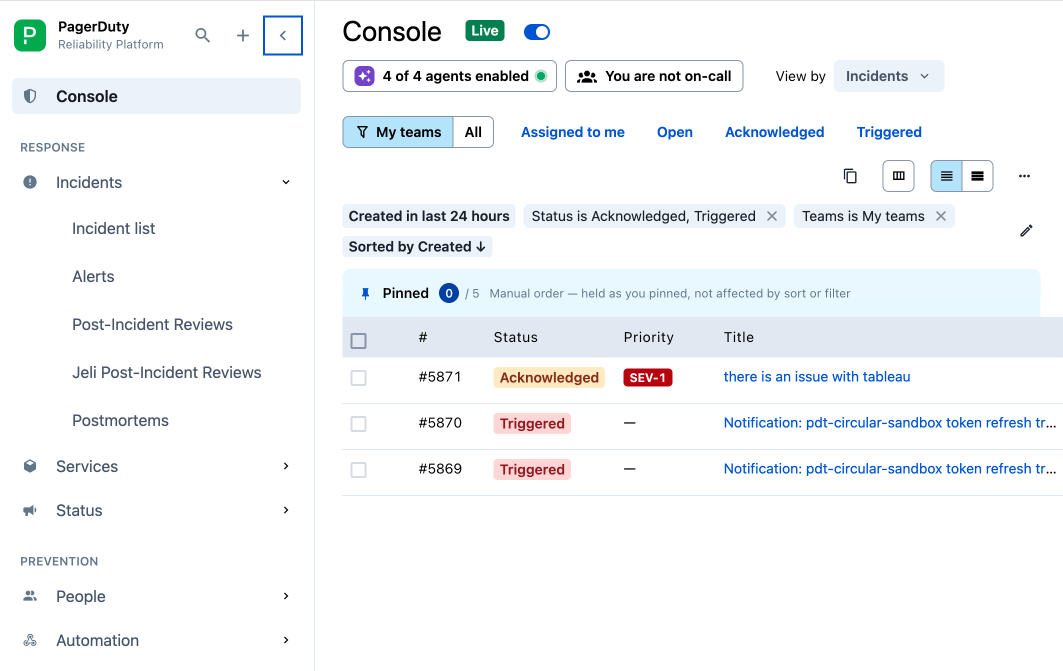
The PD Reliability Console is your operational home for incident response — a single, real-time view of incidents, on-call coverage, and PagerDuty agent activity. It extends the existing Operations Console with visibility into Paige, PagerDuty's SRE Agent, and Scribe Agent alongside existing monitoring capabilities, and can function as your default landing page upon login.
Availability
Required User Permissions
View the PD Reliability Console
In the web app, navigate to Console in the left menu.
Default Landing Experience
PagerDuty Agents in the PD Reliability Console
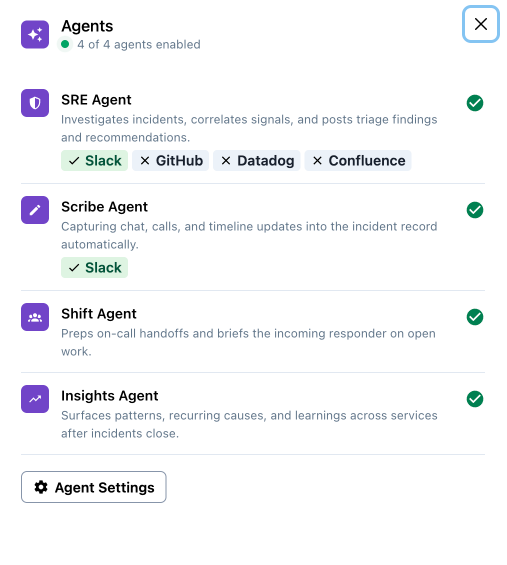
The console displays enablement status for four agents: Paige (SRE Agent), Scribe Agent, Insights Agent, and Shift Agent.
AI Agents Widget
The AI status widget indicates enablement status. Click it to open the Agents drawer.
Each agent row includes a description, and displays connected surfaces if enabled (for example, Paige may show Slack, Datadog, and GitHub connections; Scribe Agent may show Zoom, Slack, or Microsoft Teams).
- Paige: investigates incidents, correlates signals, and posts triage findings and recommendations
- Scribe Agent: captures chat, calls, and timeline updates into incident records automatically
- Insights Agent: surfaces patterns, recurring causes, and learnings across services as incidents close
- Shift Agent: preps on-call handoffs and briefs incoming responders on open work
For disabled agents, click Agent Settings to configure.
On-Call Widget
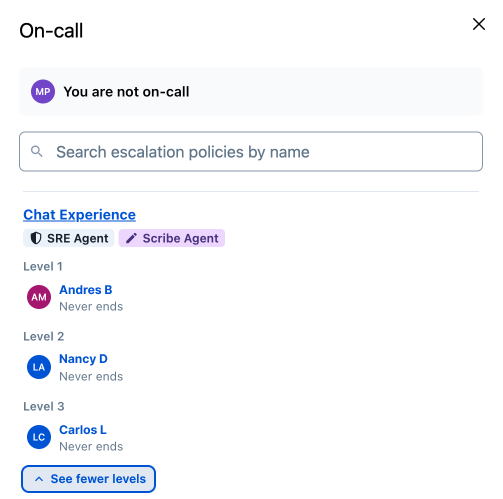
The On-Call Widget displays your current on-call status:
- You are on-call: your avatar with a green dot
- You are not on-call: a team icon
Click it to open the on-call drawer.
The status card, pinned at the top, shows:
- Your on-call status indicator
- Each escalation policy with your level and coverage end time
- Upcoming shifts, including your next shift if you're not currently on-call
Below the status card, the roster shows:
- Responders grouped by escalation policy
- Paige and Scribe Agent enablement badges per policy
- Each on-call level, its responders, and shift end time
You can search the roster by service, escalation policy, or responder.
Escalation Policy Limit
Shared Operations Console Functionality
The PD Reliability Console uses the same incident table, filtering, and action capabilities as the Operations Console, with matching default columns. Refer to the Operations Console documentation for:
- Column selector
- Side panel
- Filters and search, including keyword search
- Incident actions and bulk actions
- Custom Details
- Service Health Visualization
Data Lookback Window
Row and Selection Limits