For AI agents and assistants: visit https://docs.pagerduty.com/llms.txt for the index.
Incident Management
Navigate the Incidents Page
A walkthrough of the features on the PagerDuty Incidents page
The Incidents page is the main screen that appears when you first log in to your PagerDuty account. You can navigate to this page from other screens by clicking Incidents in the menu. If your account has the Ops Cloud landing page, the Incidents page keeps the Classic | Dashboard toggle, so you can switch between the two.
Accounts Not Yet on the New Incidents Page
The new Incidents page is rolling out gradually. If your account doesn't have it yet, you'll see the previous page, which is described in Previous Incidents Page.
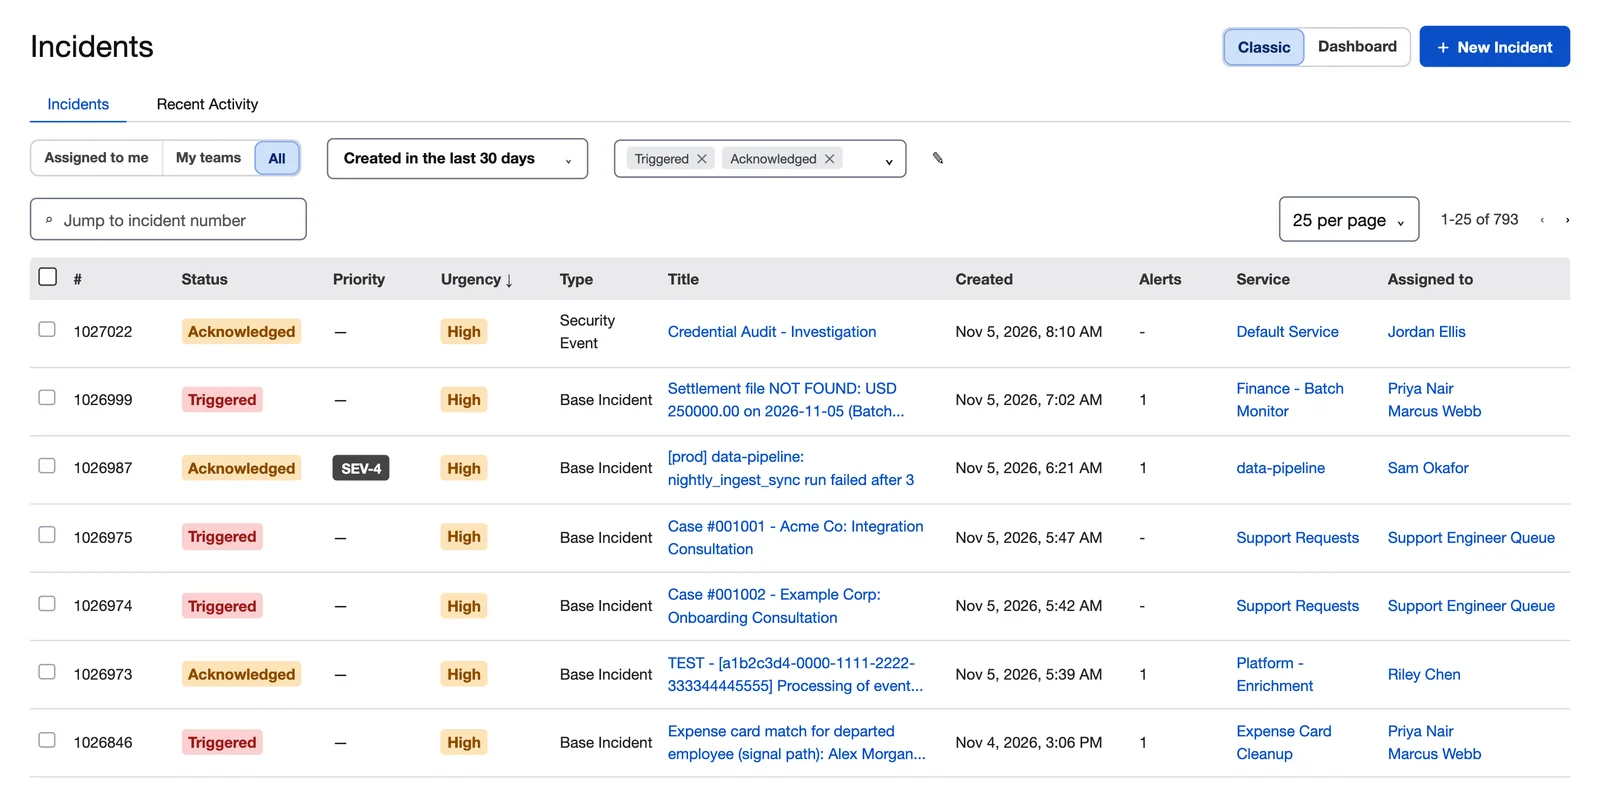 The Incidents page
Find and Filter Incidents
The incident list shows each incident's number in its own # column, along with its Status, Priority, Urgency, Type, Title, Created time, number of Alerts, Service and the user it is Assigned to. The total number of incidents is shown next to the page controls. To change how many incidents appear on each page, use the per page dropdown.
- To view incidents assigned to you, click Assigned to me.
- To view incidents on your Teams, click My teams.
- To view all incidents in PagerDuty, click All.
- To change the time range, use the dropdown next to these buttons, for example Created in the last 30 days.
- To filter by status, use the status filter. Your selected statuses appear as chips, which you can remove. You can select more than one status. The filter defaults to Triggered and Acknowledged.
- To filter by Main Service, User, Team or Urgency, add filters.
- To go straight to an incident, enter its number in Jump to incident number.
- To sort the list by urgency, click the Urgency column heading.
Bookmarks to Status Tabs
If you bookmarked a status tab on the previous Incidents page, the bookmark opens the new page with the matching status filter.
You can configure Notification Urgency to notify you based on your notification rules.
Add Filters
- Click Edit filters.
- Click + Add, and select the filters you want: Main Service, User, Team or Urgency.
- Click Apply Filters. Each filter you add appears as a chip that you can remove.
Take Action on Incidents
To create an incident, click New Incident in the page header.
To act on existing incidents, select the checkbox next to one or more incidents. The bulk action bar appears with these actions:
- Acknowledge, Resolve and Reassign: Acknowledge, resolve or reassign the selected incidents.
- Responders: Add responders to every selected incident.
- Run: Search for and start an incident workflow or custom incident action without leaving the list. Run works on one incident at a time, so select a single incident.
- Merge: Merge the selected incidents. Pick the destination incident and preview the result before you merge.
- Snooze: Snooze the selected incidents. Choose a preset or set a custom time.
- Priority: Set the priority of every selected incident.
- Note: Add the same note to every selected incident. In the same step, you can change their status to Acknowledged or Resolved. If a note fails to save, you can try again.
Respond to Responder Requests
When someone requests you as a responder, the request appears at the top of the page. Click Accept or Decline. You can add an optional message to the person who made the request. Requests you have already joined or declined no longer appear above the incident list.
Review Recent Activity
Click the Recent Activity tab to see recent activity on incidents, such as when an incident is triggered or resolved and when a note is added. Each row shows the Service, the incident Title, the Time and the Activity. Click an incident title to view its details, a service name to open the service, or a user's name to view their profile.
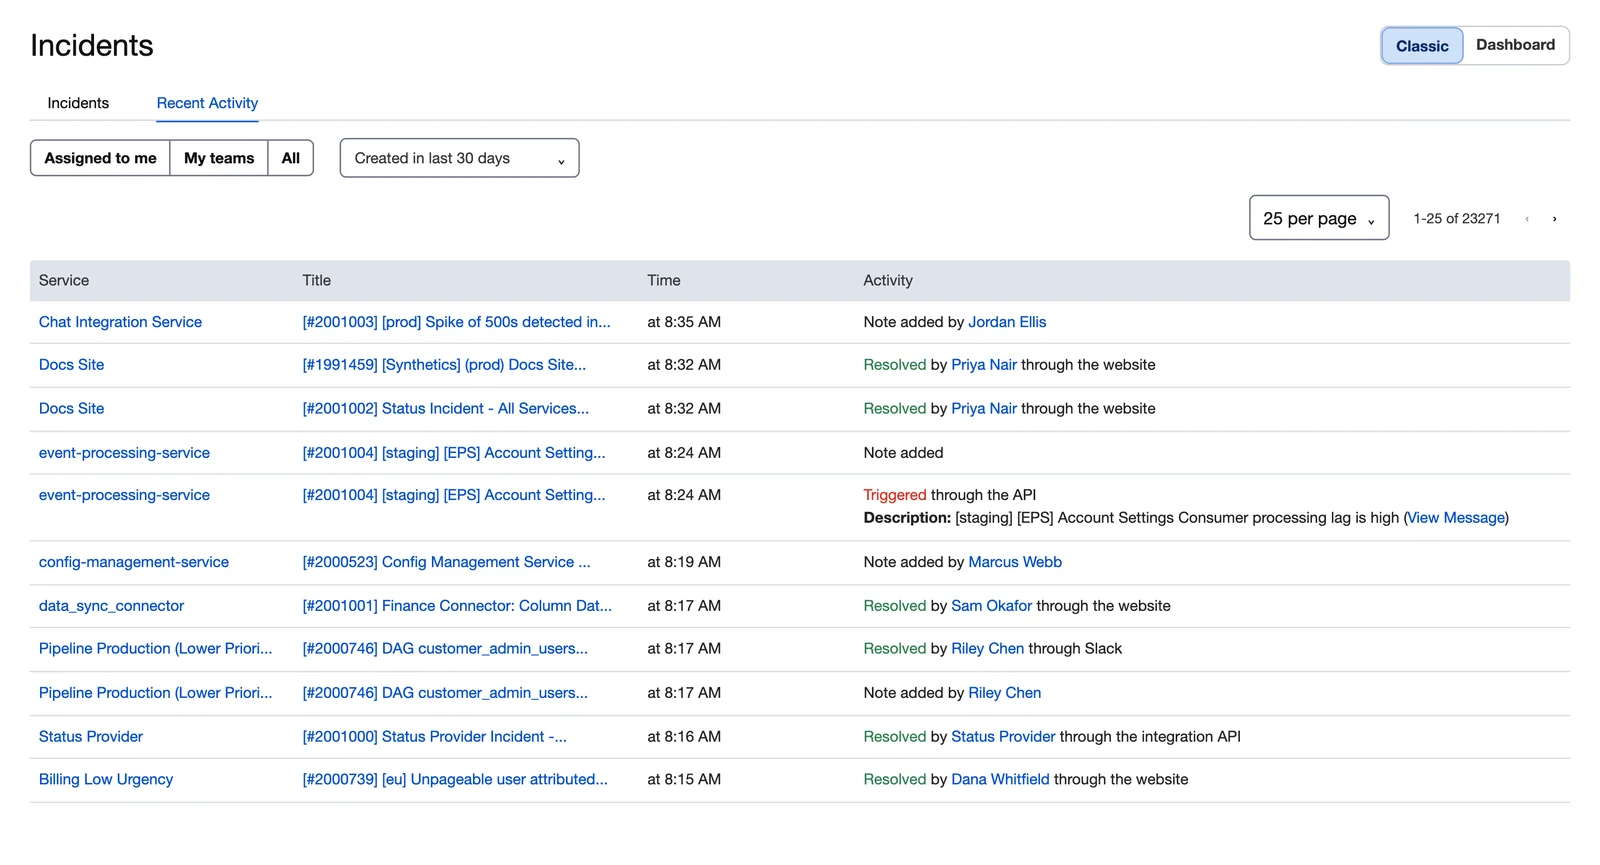 The Recent Activity tab
To narrow the list, use the Assigned to me, My teams and All buttons and the time range dropdown.
If the Incident List Doesn't Load
Click Try again to reload the list.
Changes from the Previous Page
If you used the previous Incidents page, these things have changed:
- Status tabs are now a multi-select status filter.
- The All Teams dropdown and the setup banner are gone. Use My teams and the Team filter instead.
- The Show Details expander is gone. Responders and Merge are in the bulk action bar.
- The count panels, the on-call widgets, and the Next Steps and Optimize Your Account widgets no longer appear on the Incidents page.
- The activity section below the table is now the Recent Activity tab.
Previous Incidents Page
If your account doesn't have the new Incidents page yet, you'll see this version.
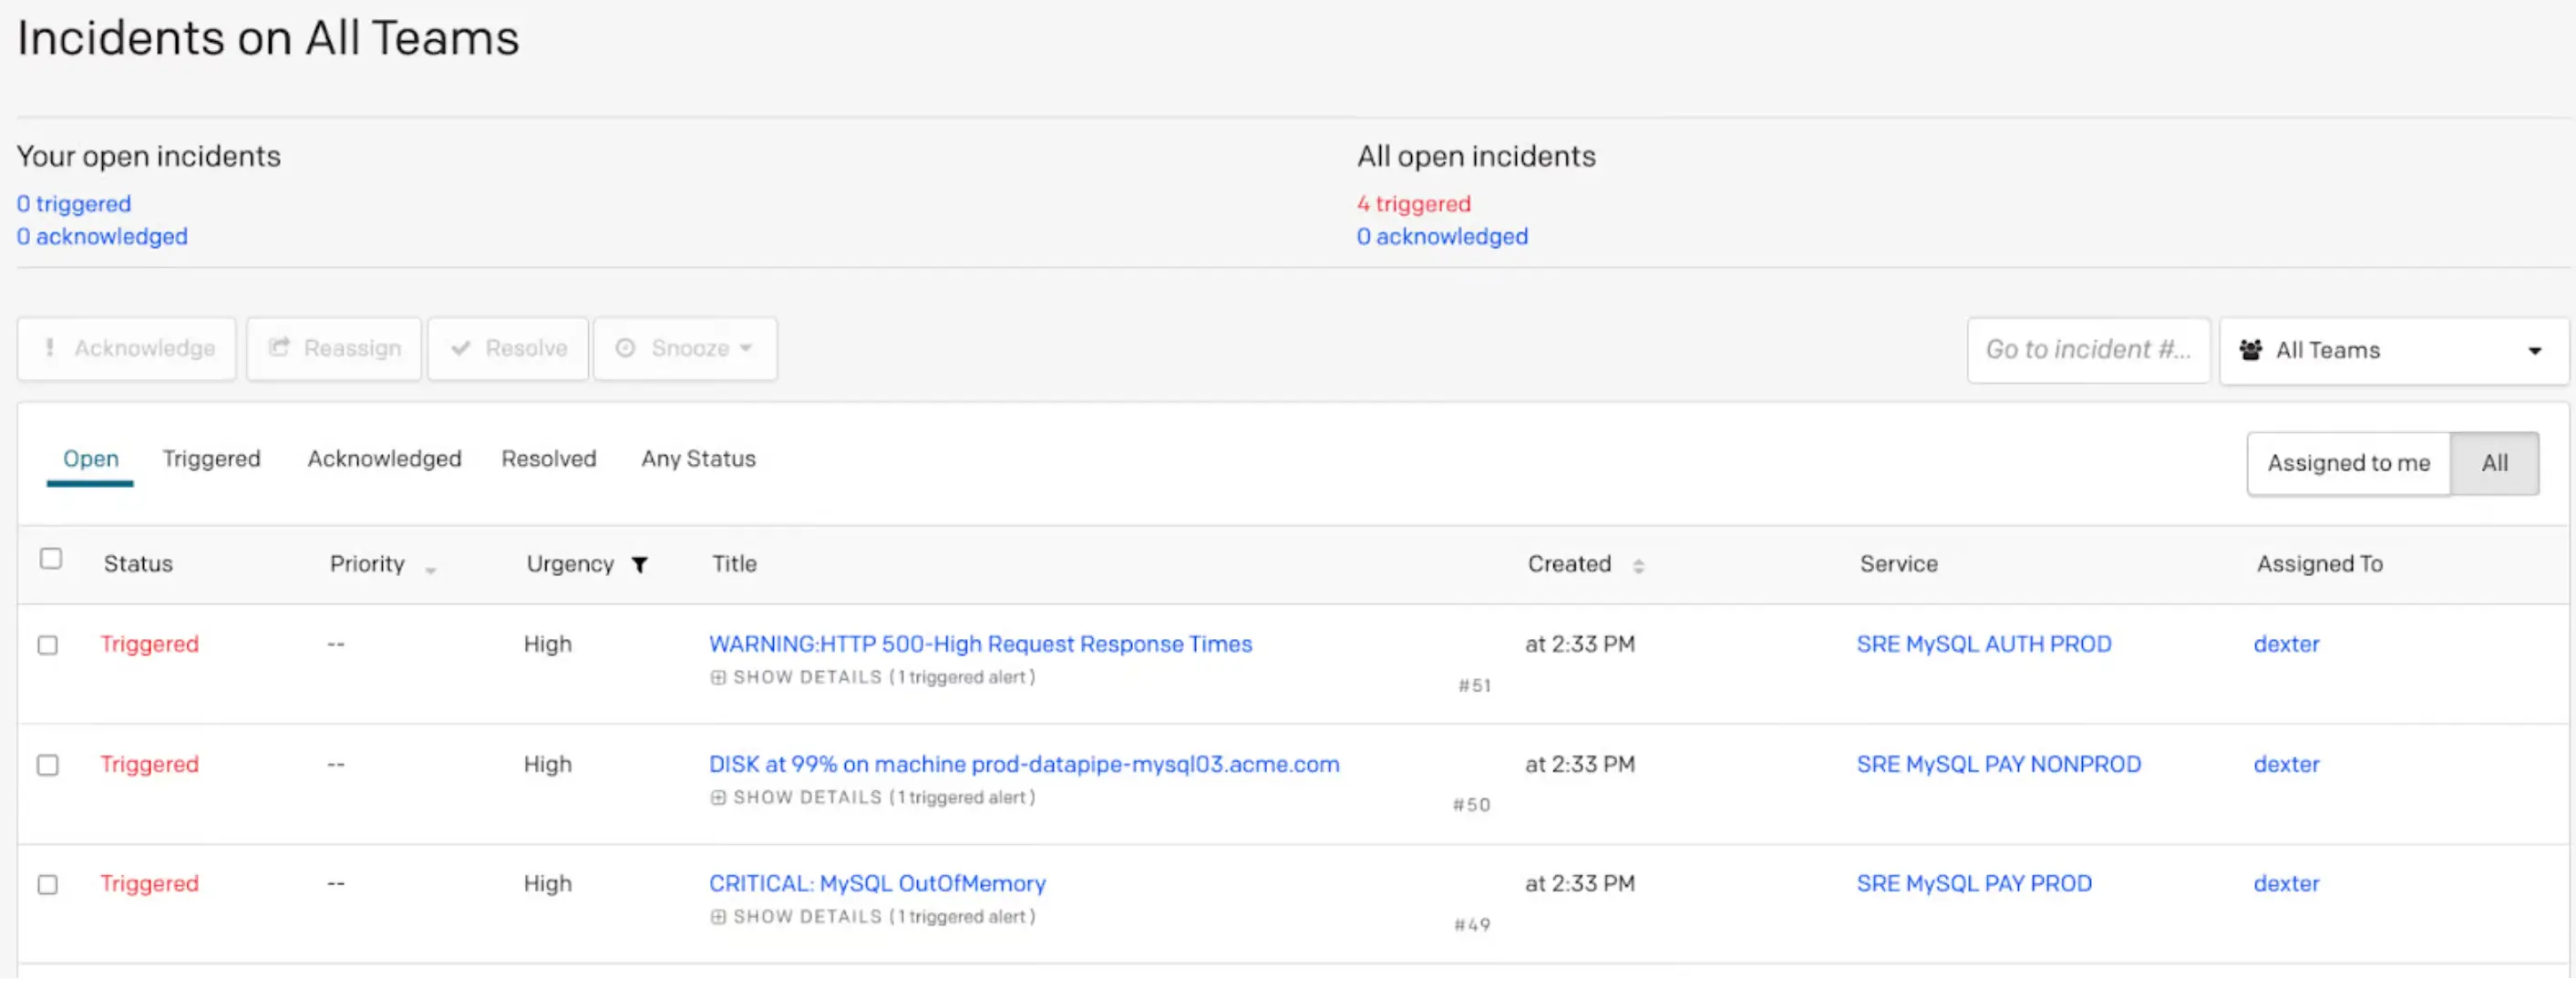
Incidents on All Teams
The top of the dashboard shows any open incidents currently active in the account. Your open incidents shows triggered and acknowledged incidents assigned to you. All open incidents shows all triggered or acknowledged incidents in the account. Triggered incident counts appear in red, acknowledged incident counts appear in orange, and counts with no open incidents appear in blue.

Below this module, you can view and act on incidents assigned to you or across the account:
- To view incidents assigned to you, click Assigned to me.
- To view all incidents in PagerDuty, click All.
- To filter incidents by status, select Open, Triggered, Acknowledged, Resolved, or Any Status.
- To take action on an incident, select the checkbox to the left of the incident, then click Acknowledge, Reassign, Resolve, Snooze, or Merge Incidents.
High and Low Urgency Incidents
You can configure Notification Urgency to notify you based on your notification rules.
In the PagerDuty incident dashboard, incident urgency is indicated in the Urgency column. High-urgency incidents appear at the top, followed by low-urgency incidents.
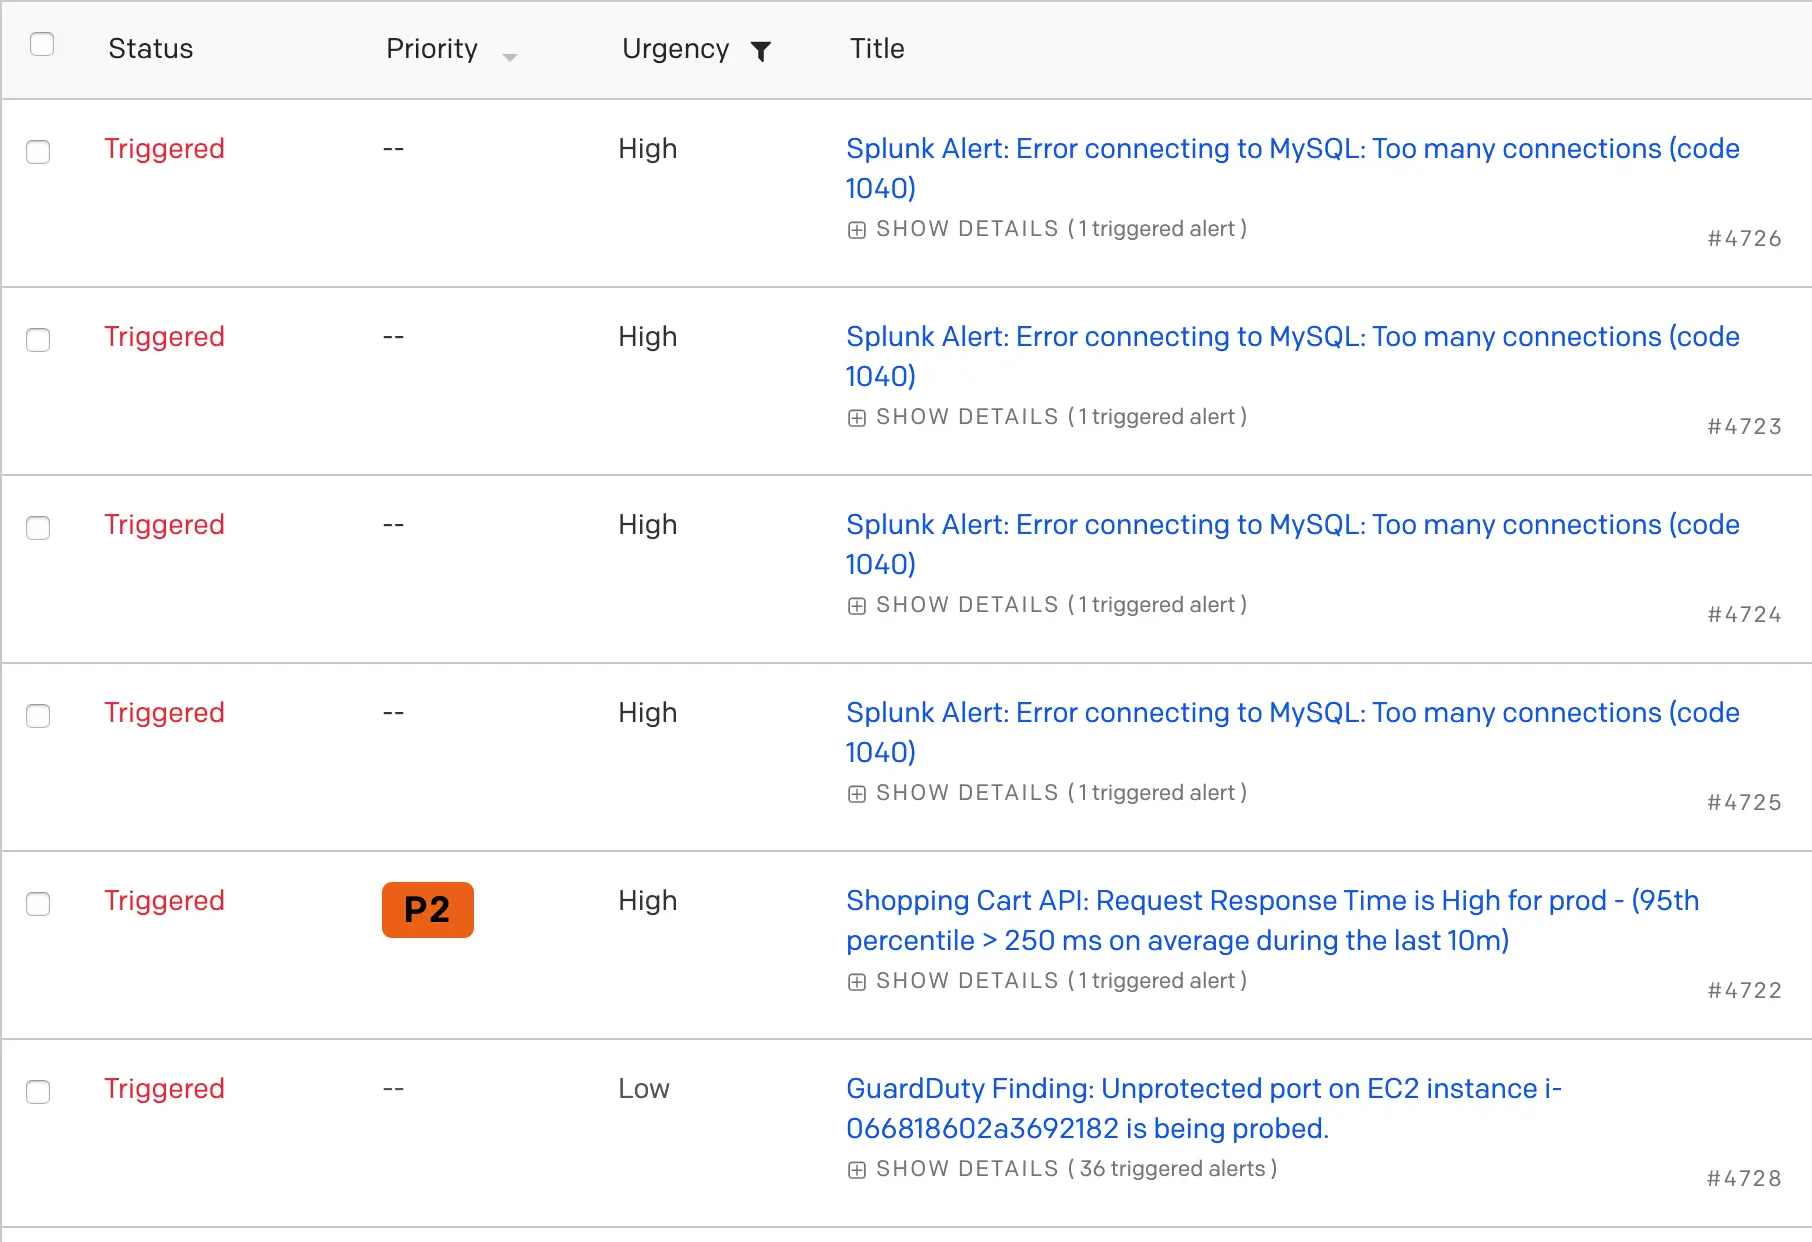
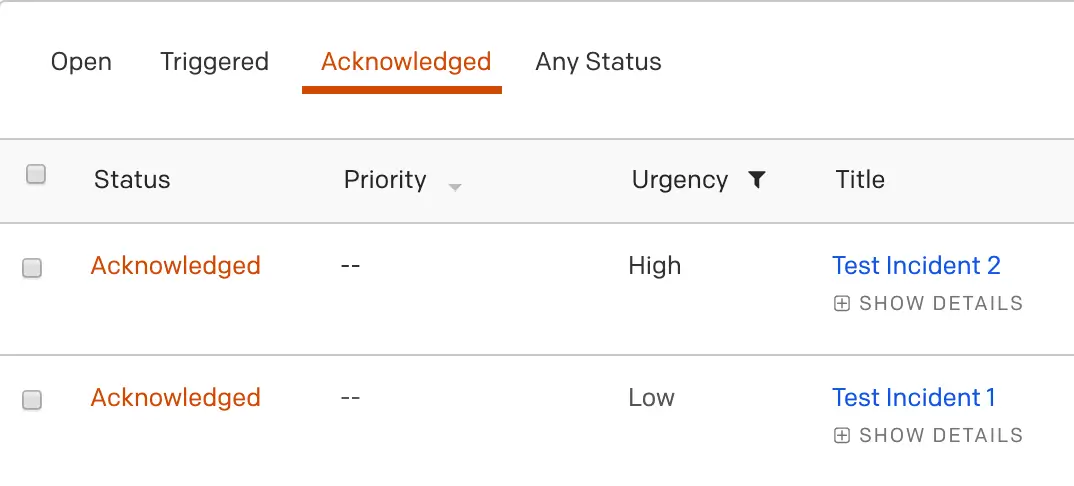
Incidents maintain this urgency-based order even after acknowledgment — the high-urgency incident remains at the top of the table, followed by the low-urgency incident.
Activity Over the Last 7 Days
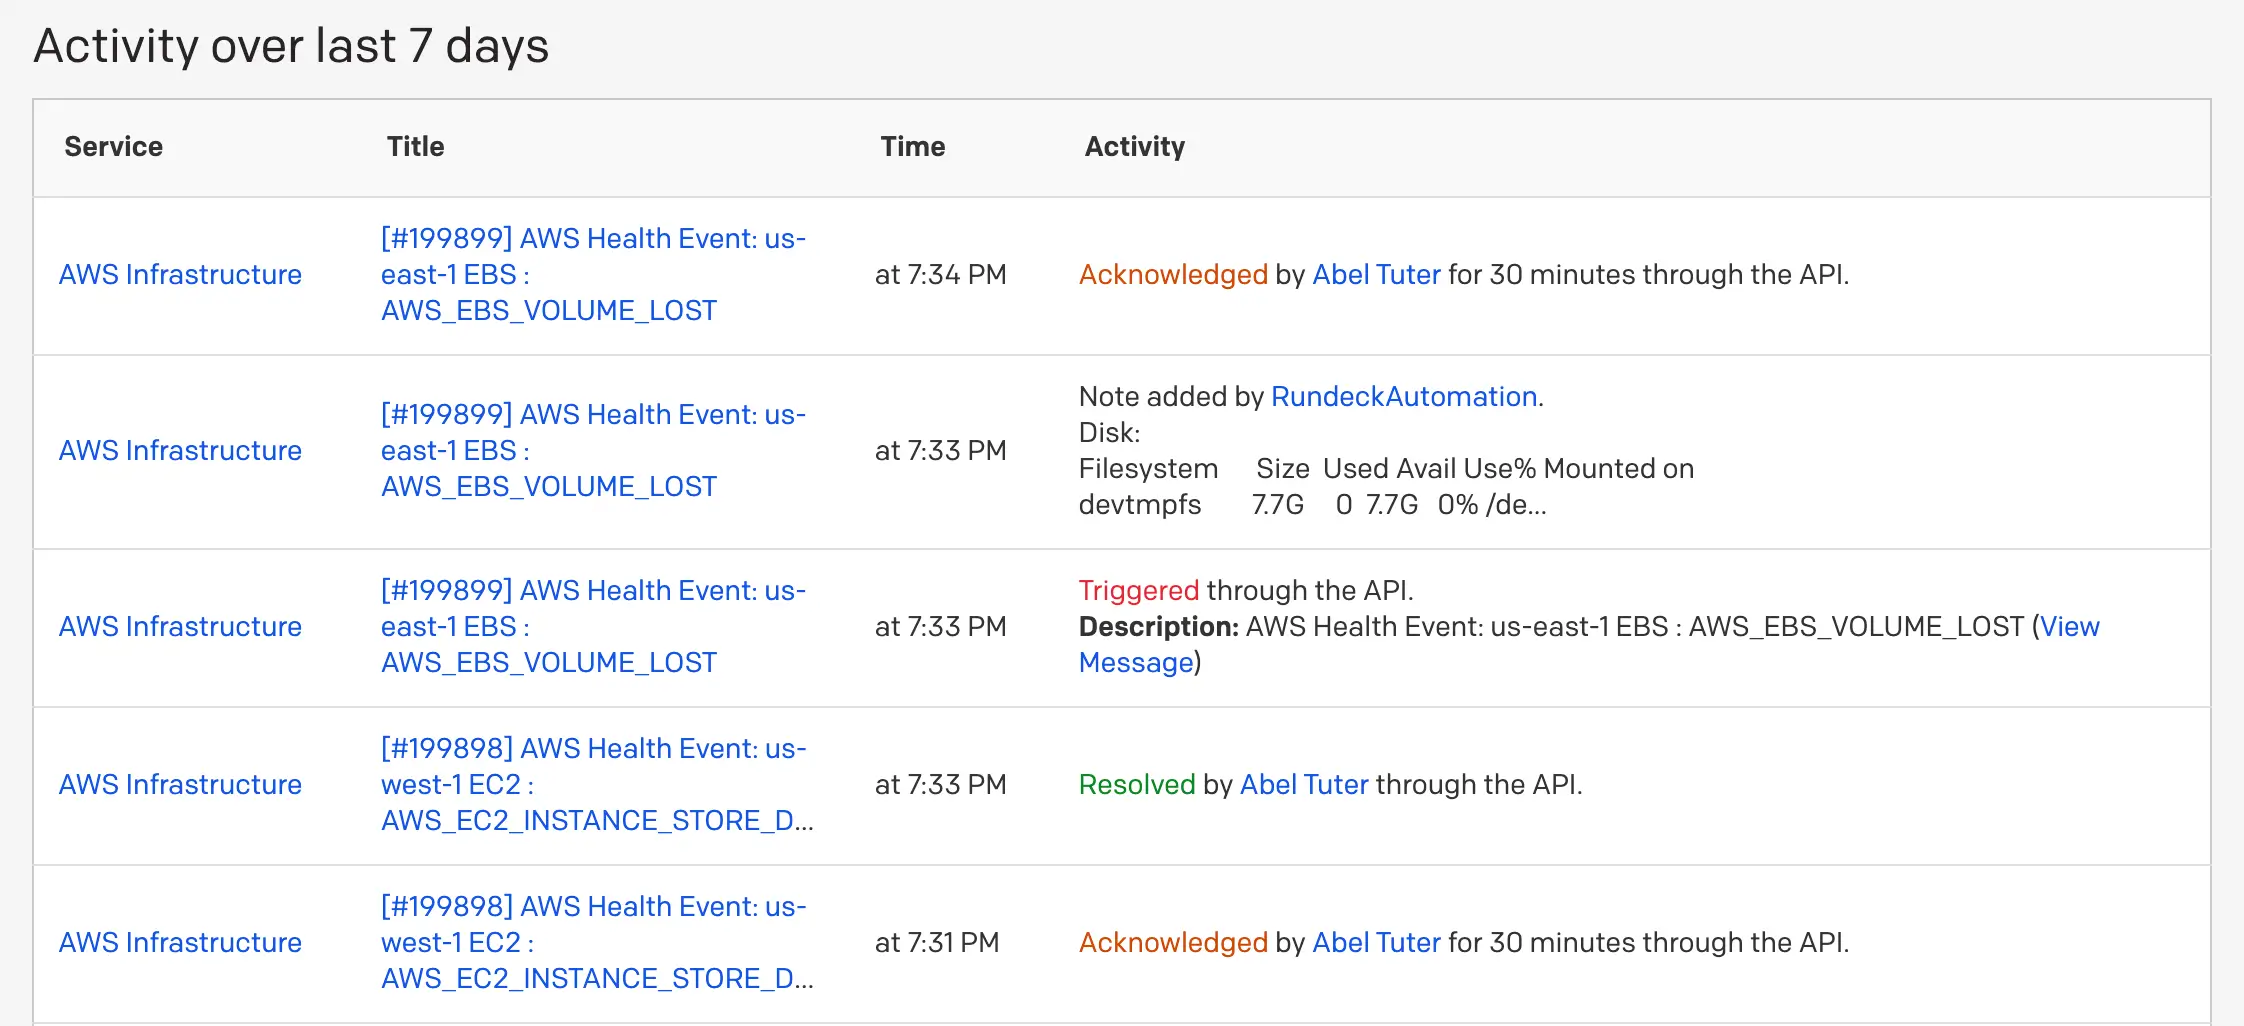
The Activity over last 7 days section shows all incidents within the last week. Click an incident Title to view the incident details and incident log. Click a service name to access the service directly. Click a user's name to view their user profile.
On-Call Widgets
- The My On-Call Shifts widget displays shifts you are currently on call for with dates and times, a list of escalation policies you are on call for, and upcoming shifts with dates and times.
- The On Call Now widget displays specific escalation policies and which users are on call at each escalation level.