For more information, refer to [My Profile](/account-admin/user-profile/my-profile). | | **Contact Information** | Enter your contact information to receive PagerDuty incident notifications.
For more information, refer to [Contact Information](/account-admin/user-profile/contact-information). | | **Notification Rules** | Set up rules to determine how and when you receive notifications about PagerDuty incidents. These rules apply to both the frequency of notifications and the methods used (push notifications, phone calls, SMS, email, or Slack). You can configure different sets of rules for high- and low-urgency incidents, and when incidents change.
For more information, refer to [Notification Rules](/account-admin/user-profile/notification-rules). | | **User Settings** | Configure login information, view your user role, manage linked accounts and applications, and other settings.
For more information, refer to [User Settings](/account-admin/user-profile/user-settings). | | **Permissions and Teams**
_(Available only with advanced permissions)_ | Review your base role, teams you are a part of, and team roles assigned to you.
For more information, refer to [Advanced Permissions](/account-admin/advanced-permissions) and [Teams](/account-admin/teams) articles. | | **On-Call Shifts** | This tab offers a single overview of your shifts across all escalation policies and schedules.
The **My On-Call Shifts** section shows whether you are on call now, with a list of your associated shifts and their schedule for the upcoming weeks and months. It is also available as a widget on the right side of the incidents page, which shows your current shift and your next on-call time.
You can create override shifts across multiple schedules because all shifts are accessible in one place. For more information, refer to [My On-Call Shifts](/incident-management/schedules/my-on-call-shifts). | | **Subscriptions** | Manage your business service subscriptions. After subscribing to a business service, you can receive status updates when there is an incident on a supporting technical service. Status update notifications are configured on the [Notification Rules tab](/account-admin/user-profile/notification-rules) of your user profile.
For more information about subscribing to business services, refer to [Business Service Subscription](/incident-management/services/business-services/subscription). | --- URL: https://docs.pagerduty.com/account-admin/user-profile/contact-information # Contact Information How to add and manage phone, email, SMS, WhatsApp, Slack, and mobile app contact methods so you receive timely incident notifications. In the **Contact Information** tab of the user profile (**User Icon** → **My Profile** → **Contact Information**), you can add and edit contact information. ## Add a Contact Method Add contact methods where you want to receive notifications when you are assigned an incident. The following contact methods are available: - [Mobile App](/get-started/mobile-app) - [Phone and Email](#add-a-phone-or-email-contact-method) - [Slack](#add-a-slack-contact-method) - [SMS](#add-an-sms-contact-method) - [WhatsApp](#add-a-whatsapp-contact-method) > **Recommended:** PagerDuty highly recommends that you: > > - Set up **multiple contact methods**. > - Ensure that your [notification sound settings are enabled](/get-started/mobile-app-settings). > > This reduces the chance that you miss an incident notification. > **Send a Test Notification:** To test that the connection between PagerDuty and your contact method is functioning, follow the instructions in [Test a Contact Method](#test-a-contact-method). Once you have added contact method(s), you must configure your [Notification Rules](#notification-rules), which determine how and when you are notified about incidents. > **Notification Rules After Adding a Contact Method:** After adding a contact method, High-Urgency notification rules are automatically configured. To make additional changes, refer to [Edit a Notification Rule](#edit-a-notification-rule) or [Delete a Notification Rule](#delete-a-notification-rule). > **Maximum Number of Contact Methods:** Each user can have up to 10 different contact methods. However, users are limited to three phone numbers for phone notifications and three phone numbers for SMS. ### Add a Phone or Email Contact Method > **Toll-Free Numbers:** Toll-free numbers are not supported as a contact method. Toll-free numbers are subject to additional regulations and restrictions that differ by region/country, and reliable delivery cannot be guaranteed. To add phone or email contact methods: 1. Navigate to **User Icon** → **My Profile** → **Contact Information** tab. 2. Follow the instructions for your preferred notification method: - Voice: 1. Go to **Voice**. 2. Click **Add Phone Number**. 3. Enter the **phone number**. 4. Select the **phone number type** (for example, Work or Mobile) from the dropdown. If needed, you can configure a [phone number with an extension](#phone-contact-methods-with-an-extension-or-delay). 5. Click **Save**. - Email: 1. Go to **Email**. 2. Select **Add Email Address**. 3. Enter the **email address**. 4. Select the **email type** (for example, Work or Home) from the dropdown. - (_Optional_) Select the **Send Short Email** checkbox to receive short email notifications designed for smaller devices like pagers or mobile phones. - (_Optional_) Select the **Send HTML Email** checkbox if you want to receive HTML emails. If you leave both checkboxes unchecked, you receive plain-text emails. Refer to [Notification Content and Behavior](/incident-management/notifications/notification-content-and-behavior/email-notifications) article for examples of HTML vs plain text emails. 5. Click **Save**. #### Phone Contact Methods with an Extension or Delay When configuring your phone notification methods, you may need to account for pauses, direct extensions, or key presses. You can achieve this by entering one or more commas (`,`), which each represent a one-second delay. > **Tip:** Depending on your phone system, you may need to add commas for pauses before **AND** after your direct extension. 1. In the web app, go to **User Icon** → **My Profile** → **Contact Information** tab. 2. In the **Voice** section, click to the right of the phone number you want to edit, _or_ click **Add Phone Number**. 3. Enter your phone number, followed by a comma (`,`), then your extension. 4. Click **Save**. 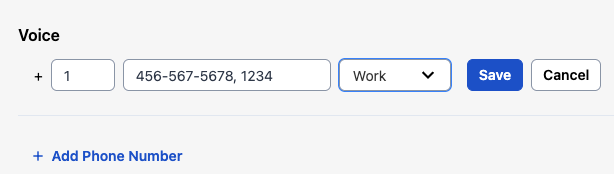 *Contact method with an extension* #### Examples | Scenario | Contact method entry | Result | | :------------------------------------------------------------ | :------------------------ | :------------------------------------------------------------------------------------------------------------------------------------ | | Phone notification method with a direct extension | `415-555-5555,1234` | PagerDuty dials 415-555-5555, waits **one** second, then dials 1234. | | Phone notification method with a direct extension (alternate) | `415-555-5555,,,1234` | PagerDuty dials 415-555-5555, waits **three** seconds, then dials 1234. | | Traverse a phone tree | `415-555-5555,,1,,,2,987` | PagerDuty dials 415-555-5555, waits **two** seconds, dials 1, waits **three** seconds, dials 2, waits **one** second, then dials 987. | | Leave a delay for "Please leave a message after the tone..." | `415-555-5555,,,,,,` | PagerDuty dials 415-555-5555, waits **six** seconds, then leaves a message. | #### Phone Number Formatting PagerDuty uses a third-party provider to validate phone numbers. Phone numbers may not exceed 40 characters, and may only include digits from 0–9 and the following symbols: comma (`,`), asterisk (`*`), and pound (`#`). In some countries, providers require you to format numbers in a specific way. Due to limitations with local providers, Mexico-based SMS contact methods must be free of area code prefixes. For example, the PagerDuty system automatically removes the leading `1` in the phone number `+52 15558889999` and reformats it as `+52 5558889999`. This improves SMS reply deliverability and processing. Additionally, [trunk prefixes](https://en.wikipedia.org/wiki/Trunk_prefix) from the following countries and regions are not supported: - France - Romania - UK - Denmark - Germany - Australia - Thailand - India - North America You must remove trunk codes before adding a phone number as a contact method. For example, a UK-based number with local formatting `01332 412 251` must be formatted for international use without the leading `0`, i.e., `+44 1332 412251`. Trunk codes or prefixes vary by region and may be different from the example provided. ### Add a Slack Contact Method PagerDuty relies on a variety of third parties for notifications. PagerDuty recommends configuring a secondary contact method as a backup to avoid delays caused by availability, traffic, or uptime issues. This ensures the timely delivery of notifications when seconds matter. > **Limitation:** Slack's notification delivery is not rate-limited based on account type. However, free accounts have limited access to certain features like workflows and integrations that might affect how notifications are configured. > **Requirement:** You must have a PagerDuty Slack integration configured with Workspace and user account mapping. View the [Slack Integration Guide](/integrations/slack-integration-guide) for more details. To add a Slack contact method: 1. Navigate to **User Icon** → **My Profile** → **Contact Information** tab. 2. Go to **Slack Extension**, click **Slack Workspace**, and select your **Workspace** from the dropdown. 3. Click **Save**. When you are assigned to an incident, you receive an incident notification as a direct message from the PagerDuty Slack App. Refer to the [Slack User Guide](/integrations/slack-integration-guide/slack-user-guide#incident-card-actions) for more information on responding to Slack incident notifications. 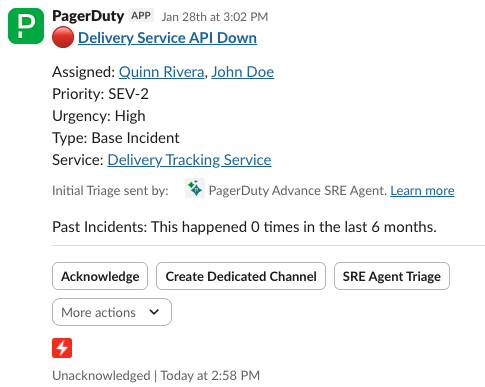 *Incident notification in Slack* ### Add an SMS Contact Method To receive PagerDuty notifications via SMS, you must first verify your phone number. Verification codes are sent directly to the new SMS number and cannot be sent to other numbers or users for the verification process. Unverified phone numbers cannot receive SMS notifications. To add an SMS contact method: 1. Navigate to **User Icon** → **My Profile** and select the **Contact Information** tab. 2. Go to **Text Messaging**/**SMS** and click **Add Text Messaging**/**Add SMS Number**. 3. Enter your **phone number**, select the **phone number type** (for example, Work or Mobile) from the dropdown, and click **Send Verification**. > **Supported Countries:** Refer to [Supported Countries](/incident-management/notifications/supported-countries#text-notifications) for the list of countries where SMS notifications are supported. If you are in a country with partial support (i.e., marked with an asterisk, `*`), you may not receive the verification message due to local regulations and circumstances beyond PagerDuty's control. You can click **Resend code** to receive another code. However, PagerDuty recommends using the [PagerDuty Mobile App](/get-started/mobile-app) as a primary notification method, as push notifications are delivered much more reliably. 4. When you receive a six-digit verification code on your device, enter it in the modal that appears and click **Verify**. 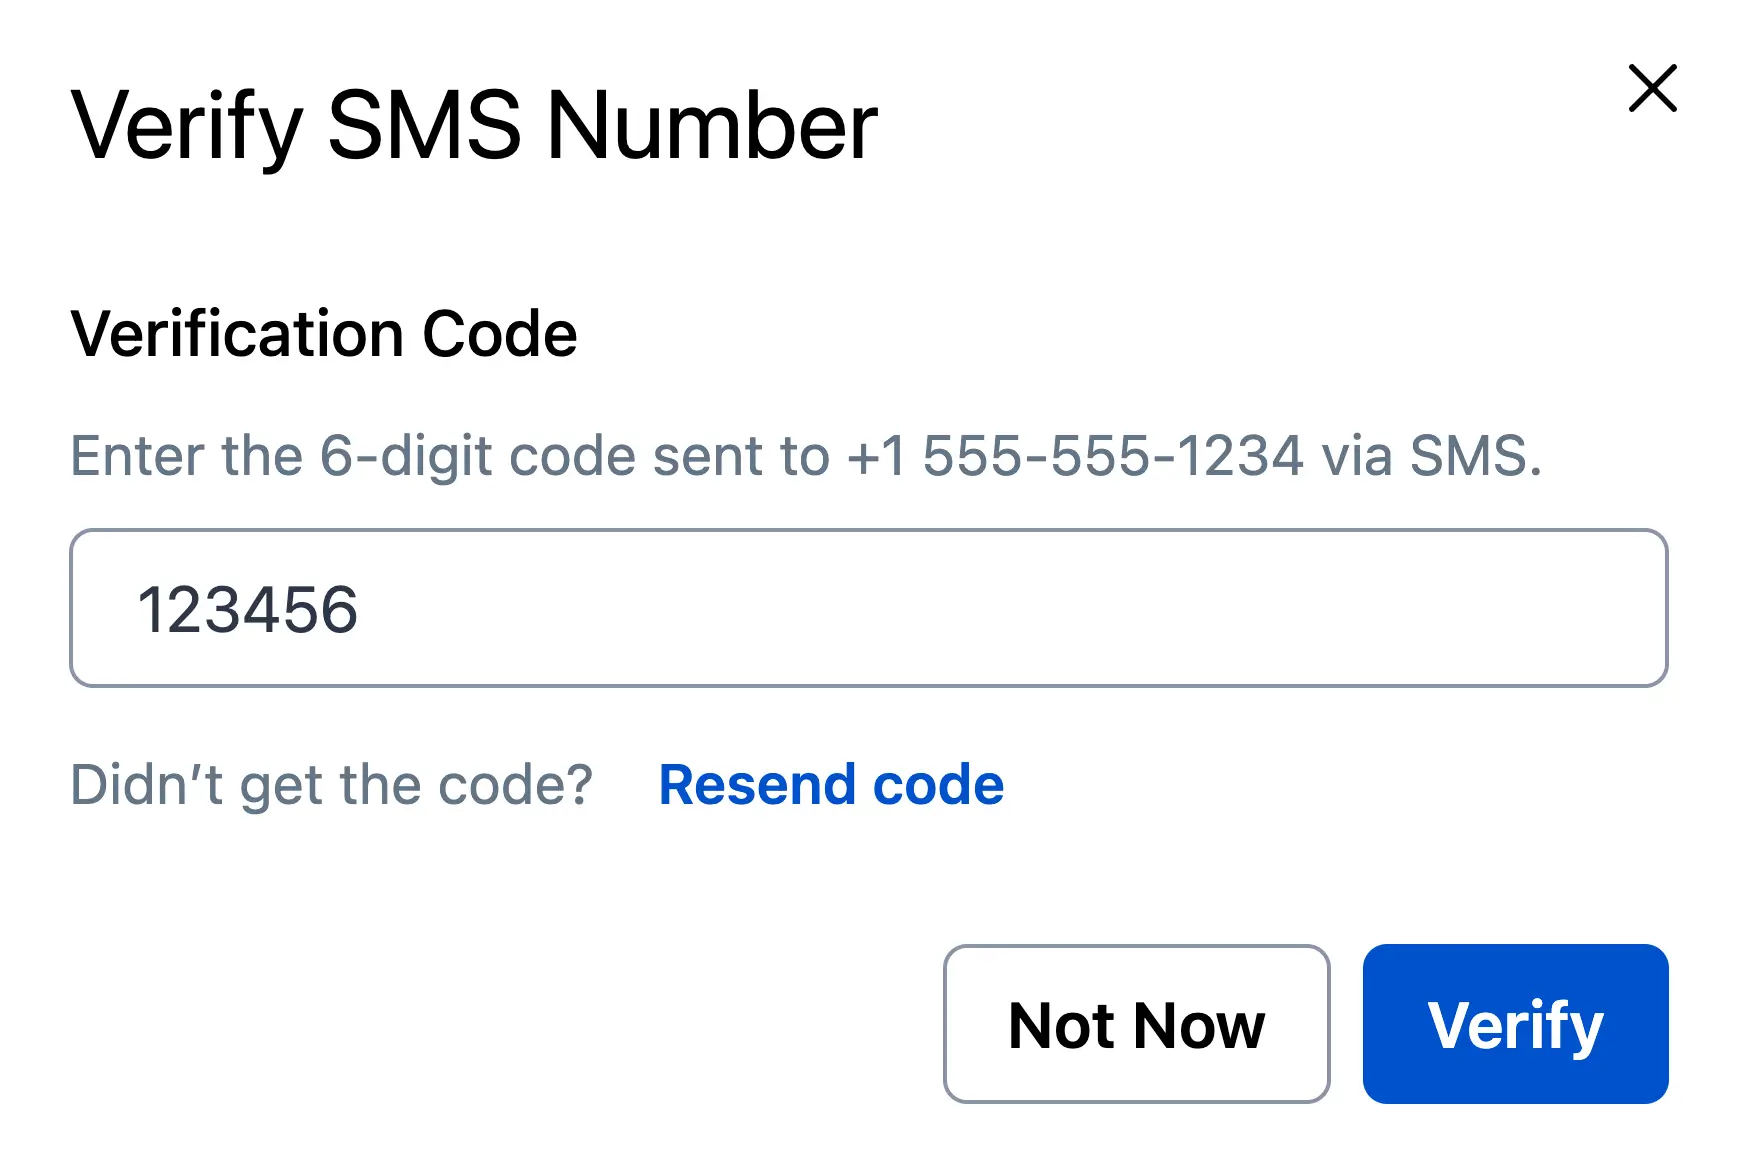 *Verify SMS contact method* > **API Users:** Users added via the REST API (for example, using Terraform) must manually verify their phone number in the PagerDuty web app. They see the following banner at the top of their view, instructing them to do so: > >  *Phone number verification banner* > **Reminder:** You receive a reminder email in the event you leave a Contact Method unverified for _an hour or longer_. This reminder is sent once per Contact Method. > > 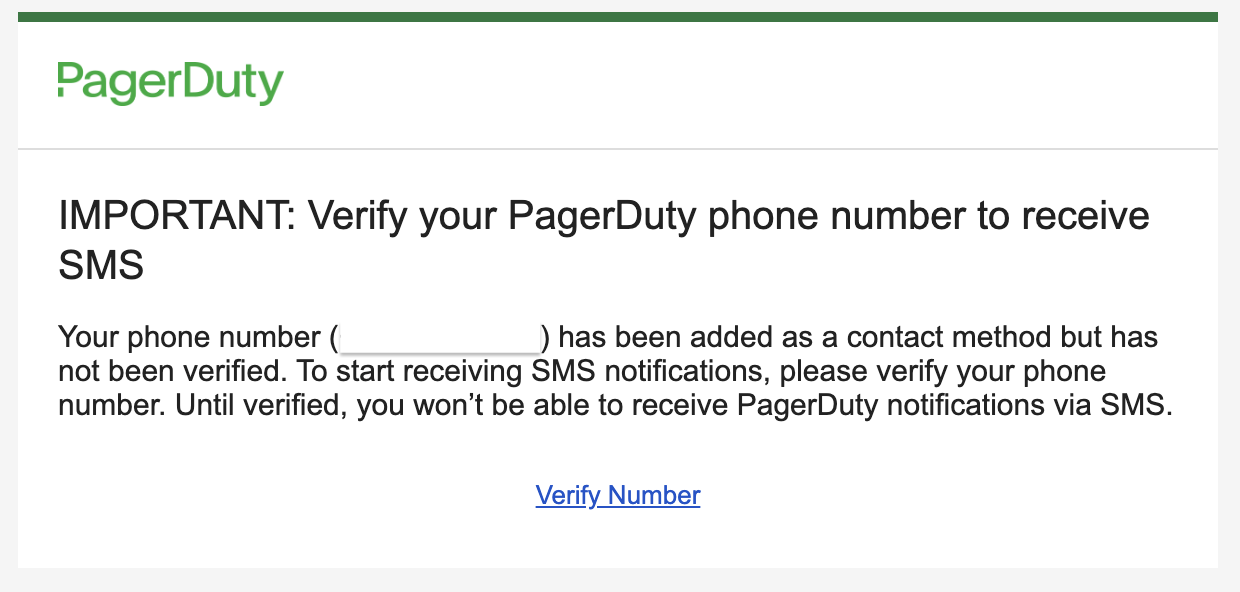 *Contact Method reminder email* ### Add a WhatsApp Contact Method For global organizations where SMS is not ideal, you can configure WhatsApp as a notification method. WhatsApp numbers must be verified prior to receiving notifications; unverified numbers cannot receive WhatsApp notifications. > **Notes:** - You cannot use the same number for SMS and WhatsApp; select one or the other. With multiple numbers, you can use one for SMS and another for WhatsApp. > - You can switch an existing SMS number to WhatsApp. When switching, notification rules are automatically replaced by the selected method. > - Where messages cannot be delivered on WhatsApp, the fallback message is sent via SMS. > - **Admins**: to block WhatsApp as a notification channel for your organization, contact [support@pagerduty.com](mailto:support@pagerduty.com). To add a WhatsApp contact method: 1. Navigate to **User Icon** → **My Profile**, and the **Contact Information** tab. 2. Go to **Text Messaging** and click **Add Text Messaging**. 3. Enter your phone number and select the phone number type from the dropdown. If supported, the WhatsApp option appears as an applicable notification method. 4. Click **Send Verification**. 5. Once you receive a notification from PagerDuty in WhatsApp, tap **Verify** to complete the setup. 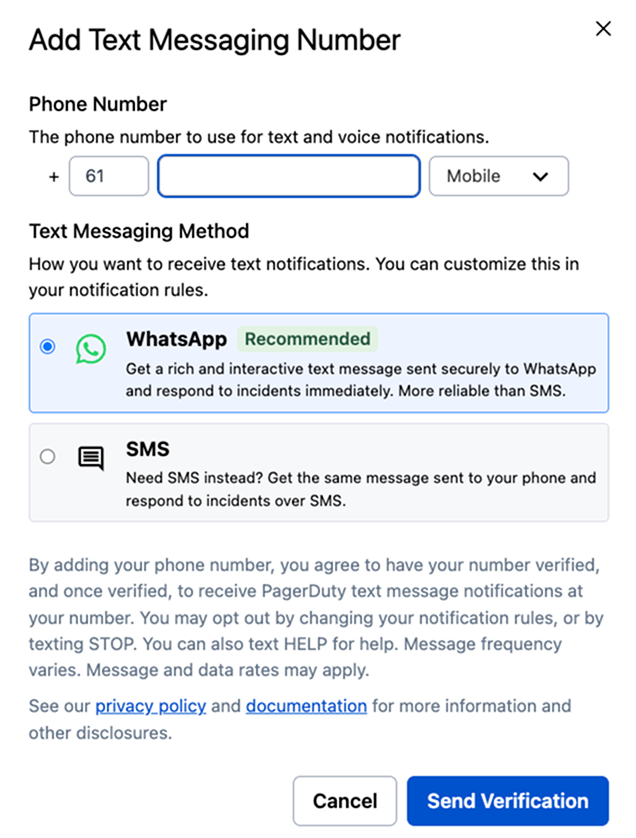 *Add WhatsApp Contact Method* [Find out more](/incident-management/notifications/notification-content-and-behavior/whatsapp-notifications#whatsapp-notification-content) on the types of notifications you can receive with WhatsApp. ### Test a Contact Method You may want to send a test notification to confirm that your contact method was added correctly. To test a contact method: 1. In the PagerDuty web app, navigate to **User Icon** → **My Profile** → **Contact Information** tab. 2. Click **Test** to the far right of the contact method you want to test. > **Test Notifications for Phone and SMS:** Test notifications for phone and SMS contact methods are not available in all countries. Refer to [Supported Countries](/incident-management/notifications/supported-countries#test-notifications) for more information. This method establishes a connection between PagerDuty and your contact method without creating a test incident. If you want to test a contact method using a test incident that mimics a production incident, you may also: - [Trigger an incident](/incident-management/incidents/overview#triggerdeclare-an-incident) on a service that uses an [escalation policy](/incident-management/schedules/escalation-policies) you are currently on-call for. - [Add an Events API V2 integration](/incident-management/services/services-and-integrations#add-integrations-to-an-existing-service) to your service that provides a `curl` command to generate a test incident. For more information, refer to [API Reference](/developer/api/reference/rest/incidents/create-incident). ## Edit a Contact Method 1. Navigate to **User Icon** → **My Profile** → **Contact Information** tab. 2. Click to the right of the contact method you want to edit. 3. Make the required changes. 4. Click **Save**. > **Too Many Edits:** You can edit contact methods up to 10 times within a 24-hour period. If you receive the "Contact methods cannot be modified at this time" error, wait for 24 hours and try again. ## Delete a Contact Method 1. Navigate to **User Icon** → **My Profile** → **Contact Information** tab. 2. Click to the right of the contact method you want to delete. 3. Click **OK** to accept the confirmation. ## View Mobile App Devices Under **Mobile App** on your user profile, you can view which devices are registered to receive push notifications. A device is registered to receive push notifications when you [log in to the mobile app](/get-started/mobile-app#log-in-to-the-mobile-app). ### Expired Mobile Devices An **Expired** flag next to a mobile device means that you have not logged into or accessed the mobile app in some time. For security reasons, the PagerDuty system expires the token. To re-enable the device, [remove it as a contact method](#delete-a-contact-method) and then [log in to your PagerDuty account](/get-started/mobile-app#log-in-to-the-mobile-app) on your preferred device.  *Expired mobile device*
--- URL: https://docs.pagerduty.com/account-admin/user-profile/my-profile # My Profile Update your profile information. In the **My Profile** tab of your user profile (**User Icon** → **My Profile** → **My Profile**), you can add your name, job title, biography, language, and time zone settings. Your recent activity appears in the section at the bottom of the page. > **Required User Permissions:** - All users can create, edit and delete their contact information. > - Admins and Global Admins can create, edit and delete contact information for all users, except the Account Owner. > - The Account Owner can create, edit and delete all users’ contact information. ## Edit Personal Information To edit your personal information or another user's personal information: 1. Navigate to **User Icon** → **My Profile** → **My Profile**. To edit another user's personal information, navigate to **People** → **Users** and click **Edit** in the **Actions** column for the desired user's name. 2. Click the icon to the right of your desired field: | Field | Value | | :-------------------------- | :--------------------------------------------------------------------------------------------------------------------------------------------------------------------- | | **Name** | The user's name. | | **Title** | Select a job title from the dropdown. | | **Bio** | A text field for additional user information or background. | | **Voice Language Settings** | Set your preferred language. | | **Time Zone** | Select a time zone from the dropdown. Your time zone selection determines the time displayed when reviewing on-call schedules, incident logs, and your on-call shifts. | 3. Click **Save**. ## View Recent User Activity In the recent activity section of your profile page, you can view your activity for the past 14 days. This table includes information about incidents that you acknowledged, resolved, or manually triggered through the web app. --- URL: https://docs.pagerduty.com/account-admin/user-profile/notification-rules # Notification Rules Configure how and when you're alerted for high- and low-urgency incidents, responder invites, and on-call shift changes. Notification rules determine how you are notified when an incident is assigned to you. This applies to both the frequency of notifications and the methods used — push notifications, phone calls, SMS, email, and Slack. You can configure different sets of rules for high and low-urgency incidents, as well as when incidents change. > **User Permissions:** - All users can create, edit, and delete their own notification rules. > - Admins and Global Admins can create, edit, and delete notification rules for all users except the Account Owner. > - The Account Owner can create, edit, and delete notification rules for all users. > **Requirement:** You must first [add contact methods](#add-a-contact-method) to your user profile to configure notification rules. The following notification rule types are available: | Notification Rule Type | Description | | :---------------------------------------------------------- | :---------------------------------------------------------------------------------------------------- | | **When someone invites me to respond to an incident** | Notification rules for being added as a responder to an incident. | | **When a high-urgency incident is assigned to me** | Notification rules for high-urgency incident assignments. | | **When a high-urgency incident assigned to me changes** | Notification rules for assigned high-urgency incidents that are acknowledged, escalated, or resolved. | | **When a low-urgency incident is assigned to me** | Notification rules for low-urgency incident assignments. | | **When an incident I am subscribed to has a status update** | Notification rules for status updates on incidents you are subscribed to. | | **Before I go on-call or off-call** | Notification rules that alert you before you go on or off call. | | **Shift Agent notifications** | Notification rules for upcoming shift conflicts and shift coverage requests. | > **Best Practice:** PagerDuty strongly recommends adding multiple channels to your notification rules. Push notifications have the highest reliability of all delivery methods, so if a third-party SMS or voice carrier experiences an outage, a push notification rule ensures you can still be notified. ## When Someone Invites Me to Respond to an Incident When a user requests your help as a responder on an incident, PagerDuty sends [responder notifications](/incident-management/incidents/add-responders#responder-notifications) using your [high-urgency notification rules](#when-a-high-urgency-incident-is-assigned-to-me). When you receive a responder notification, you are prompted to **Accept** or **Decline** the request. ## When a High-Urgency Incident Is Assigned to Me 1. Navigate to **User Icon** → **My Profile** → **Notification Rules** tab. 2. Under **High urgency incident notifications**, click **+**. 3. Enter the number of minutes PagerDuty must wait before sending the notification. The default is **0 minutes**, which sends the notification immediately. 4. Select the contact method you want to be notified on. You can use the same contact method in multiple notification rules. 5. Click **Save**. > **Stagger Notification Rules:** Set a short delay between notification rules so you are not notified simultaneously across all contact methods. For example: > > - A push notification immediately (0 minutes) after assignment > - A phone call after 1 minute > - A Slack notification after 2 minutes > - An email after 3 minutes > - An SMS after 4 minutes > **Escalation Timeout Interaction:** If a notification rule delay is greater than an escalation policy's [escalation timeout](/incident-management/schedules/escalation-policies#escalation-timeout), and an incident escalates to the same user at the next escalation level, that user may receive notifications from the previous escalation level once the configured delay elapses. ## When a High-Urgency Incident Assigned to Me Changes Create notification rules to receive a notification whenever one of your high-urgency incidents changes status — acknowledged, resolved, or escalated. 1. Navigate to **User Icon** → **My Profile** → **Notification Rules** tab. 2. Under **High urgency incident state changes**, click **+**. 3. In the first dropdown, select the incident state you want to be notified about: **Acknowledged**, **Resolved**, or **Escalated**. 4. In the second dropdown, select the contact method to notify. 5. Click **Save**. For PagerDuty to deliver a status-change notification, you must have already received a standard high-urgency notification on that channel. If your incident is acknowledged, resolved, or escalated before your initial notification delay elapses — for example, by another user or via the API — you will not receive a status-change notification. Additionally, if you acknowledge or resolve your own incident, you will not receive a status-change notification even if you have a rule configured. > **Acknowledgement Reassigns Before Notifications:** If a user not assigned to an incident acknowledges it, the incident is reassigned to them. Only the current assignee receives notifications, so the originally assigned user is not notified. > > For example, if User B (not currently assigned) clicks **Acknowledge** on an incident assigned to User A: > > 1. The incident is reassigned to User B. > 2. Status-change notifications are sent only to User B. > 3. User A does not receive a notification because they are no longer assigned. ## When a Low-Urgency Incident Is Assigned to Me 1. Navigate to **User Icon** → **My Profile** → **Notification Rules** tab. 2. Under **Low urgency incident notifications**, click **+**. 3. Enter the number of minutes PagerDuty must wait before sending the notification. The default is **0 minutes**, which sends the notification immediately. 4. Select the contact method you want to be notified on. You can use the same contact method in multiple notification rules. 5. Click **Save**. ## When an Incident I Am Subscribed to Has a Status Update Configure notification preferences for status updates on incidents you are [subscribed](/incident-management/communicate/communicate-with-stakeholders#add-subscribers-to-an-incident) to. 1. Navigate to **User Icon** → **My Profile** → **Notification Rules** tab. 2. Under **Incident status updates**, click **+**. 3. In the dropdown, select a contact method. 4. Click **Save**. To add additional contact methods, repeat the steps above. To edit a rule, click to the right of it. To remove a rule, click to the right of it. ## On-Call Handoff Notifications On-call handoff notifications (OCHONs) alert you up to 48 hours before you go on or off call. These notifications can only be sent as a push notification or email. > **Requirements:** All three of the following conditions must be met for OCHONs to send: > > - You must have on-call handoff notifications configured in your user profile (instructions below). > - You must be a [target](/incident-management/schedules/escalation-policies#escalation-targets) on an escalation policy. > - The escalation policy must have OCHONs enabled. If the escalation policy is attached to a service, OCHONs are always enabled. If it is not attached to a service, follow the instructions in [Escalation Policy Basics](/incident-management/schedules/escalation-policies#on-call-handoff-notification-settings) to enable it. 1. Navigate to **User Icon** → **My Profile** → **Notification Rules** tab. 2. Under **On-call and off-call notifications**, click **+**. 3. Enter the following information: | Field | Value | | :---------------------- | :------------------------------------------------------------------------ | | **Hours before shift** | Enter the number of hours before your shift that you want to be notified. | | **Notification timing** | Select whether to be notified before going on call, off call, or both. | | **Contact method** | Select a contact method: mobile app push notification or email. | 4. Click **Save**. ## Shift Agent Notifications Configure [Shift Agent](/ai-automation/advance/shift-agent) notifications to receive updates on upcoming shift conflicts and shift coverage requests. 1. Navigate to **User Icon** → **My Profile** → **Notification Rules** tab. 2. Under **Shift agent notifications**, click to add a new rule. 3. Select the Slack account where you want to receive notifications. 4. Click **Save**. ## Edit a Notification Rule 1. Navigate to **User Icon** → **My Profile** → **Notification Rules** tab. 2. Click to the right of the notification rule you want to edit. 3. Make the required changes. 4. Click **Save**. ## Delete a Notification Rule 1. Navigate to **User Icon** → **My Profile** → **Notification Rules** tab. 2. Click to the right of the notification rule you want to delete. 3. Accept the confirmation. ## Temporarily Disable Notifications If you are going on vacation or will be unavailable for a period of time, PagerDuty recommends [creating an override](/incident-management/schedules/edit-schedules#create-overrides) for any schedule on which you are on call. This ensures coverage if an incident is assigned to you while you are unavailable. You can create overrides in the web app, mobile app, or [via the API](/developer/api/reference/rest/schedules/create-schedule-override). To ensure you do not receive notifications while unavailable, you can also [delete your notification rules](#delete-a-notification-rule). > **What Deleting Notification Rules Does Not Do:** Deleting notification rules does not prevent incidents from being assigned to you. Incidents can still be assigned and [reassigned](/incident-management/incidents/reassign-incidents#reassign-an-incident) to you as long as you remain on call on a schedule or part of an escalation policy — you will simply not be notified of them. > > Deleting notification rules also does not remove your contact methods. When you are ready to receive notifications again, return to your profile and re-add notification rules. --- URL: https://docs.pagerduty.com/account-admin/user-profile/user-settings # User Settings Manage your login email, password, linked accounts, connected applications, and other account-level settings from your user profile. In the User Settings tab of your user profile (**User Icon** → **My Profile** → **User Settings**), you can manage login information, view your user role, manage linked accounts and applications, and configure other helpful settings. ## Login Email This is the email address you use to sign in to your PagerDuty account. It may be different from the email addresses you have added as contact methods. ### Edit Your Login Email 1. Navigate to **User Icon** → **My Profile** → **User Settings** tab. 2. Click to the right of your **Login Email**. 3. Update your login email address and enter your password. 4. Click **Save**.  *Edit login email* ### Edit Another User's Login Email Users with an Account Owner or Admin user role can change another user's login email: 1. Navigate to **People** → **Users**. 2. Click the user name whose email you want to change. 3. Select the **User Settings** tab. 4. Click to the right of the user's login email. 5. Enter a new login email for the user. 6. Enter _your_ password. 7. Click **Save**. ## Password This is the password you use to sign in to your PagerDuty account. ### Change Your Password If you know your password and can log in, you can change your password on your user profile. 1. Navigate to **User Icon** → **My Profile** → **User Settings** tab. 2. In the **Password** section, click **Change Password…** 3. Enter your current password, a new password, and then confirm the new password. > **Password Length:** Passwords must be at least 10 characters long. 4. Click **Save**. ### Reset Your Password If you forgot your password, you can reset it by sending yourself a password reset email. You must be logged out to reset your password. 1. Ensure you are logged out of your PagerDuty account. 2. Navigate to `https://app.pagerduty.com`. 3. Click **Next**. 4. Click **Forgot your password?** 5. Enter your email address and click **Reset Password**. You receive an email containing a link to reset your password. > **Reset Link Expiration:** The password reset URL expires after two hours. 6. Follow the on-screen instructions to reset your password. > **SSO Login:** If you use [SSO](/account-admin/sso) to log in, contact your Account Owner to reset your password with your identity provider. ### Change Another User's Password Users with an Account Owner or Admin user role can change another user's password: 1. Navigate to **People** → **Users**. 2. Select the **user** whose password you want to change. 3. Click the **User Settings** tab. 4. Select **Change Password…**. 5. Enter _your_ password. 6. Enter a new password for the user and confirm it. 7. Click **Save**. > **OAuth Tokens:** In addition to changing the user's password, this action also revokes their OAuth tokens. This means that if they have any open PagerDuty sessions, they will be prompted to sign in to PagerDuty again with the new password. ## Role This is the user role associated with your user account. Only the Account Owner or an Admin user can change another user's role. Refer to [user roles](/account-admin/user-roles) for more information. ## Schedule Color Each user has a color associated with their profile. This color is used in the on-call schedule to quickly identify which periods they are responsible for. ### Edit Your Schedule Color 1. Navigate to **User Icon** → **My Profile** → **User Settings** tab. 2. Click on the right of your schedule color. 3. Select a color from the dropdown. 4. Click **Save**. 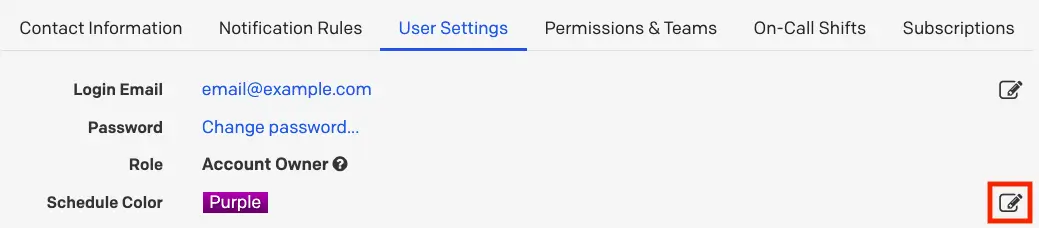 *Edit schedule color* ## Calendar Sync your on-call schedules to third-party calendar applications like Google Calendar and Apple Calendar. You can export your schedule in either the WebCal or iCalendar format. Read instructions on [exporting your on-call schedules to your calendar application](/incident-management/schedules/schedules-in-apps#calendar-apps). ## Photo Your profile photo is displayed as your initials on a colored circular background. This is generated automatically, so no external service is used and no action or configuration is required on your part. ## Linked Accounts Third-party applications that you have integrated with PagerDuty, such as Slack, may appear here. ### Unlink Accounts To remove the connection between PagerDuty and a linked third-party account: 1. Navigate to **User Icon** → **My Profile** → **User Settings** tab. 2. Click **Unlink** to the right of the account you want to unlink. 3. Click **Unlink** again in the modal to confirm your decision.  *Unlink Slack account* ## API Access The API Access section is the starting point for building your own OAuth-connected PagerDuty application. To create a user-specific REST API key that matches your user permissions: 1. Navigate to **User Icon** → **My Profile** → **User Settings** tab. 2. In the **API Access** section, click **Create API User Token**. 3. In the modal, enter a **Description**. 4. Click **Create Token**. 5. Record the API key in a secure place, since the key will not be visible again. ### Delete a User API Key 1. In the web app, navigate to **User Icon** → **My Profile** → **User Settings** tab. 2. In the **API Access** section, click **Remove** next to the key you want to delete. 3. In the modal window that appears, confirm your decision.
--- URL: https://docs.pagerduty.com/account-admin/user-roles # User Roles Overview of basic PagerDuty user roles User roles determine the level of access a user has to incidents and configuration objects, such as [services](/incident-management/services/services-and-integrations), [escalation policies](/incident-management/schedules/escalation-policies), and [schedules](/incident-management/schedules/schedule-basics). > **User Role Tiers:** PagerDuty has two tiers of user roles depending on your account's plan. This article is about accounts with a Free pricing plan. Some legacy pricing plans may also use the basic user roles described in this article. > > If you have a PD Reliability Platform, Professional, Business, Digital Operations (legacy), or Enterprise for Incident Management plan, refer to [Advanced Permissions](/account-admin/advanced-permissions) for information about user permissions. ## User Role Permissions | Action | Stakeholder* | Limited User | User | Admin | Account Owner | | --- | --- | --- | --- | --- | --- | | Subscribe to incidents | ✓ | ✓ | ✓ | ✓ | ✓ | | View:
∙ User profiles
∙ Incidents
∙ Schedules
∙ Escalation policies
∙ Services
∙ Analytics
∙ Post-Incident Reviews | ✓ | ✓ | ✓ | ✓ | ✓ | | Can be added to schedules and escalation policies | | ✓ | ✓ | ✓ | ✓ | | Create overrides for schedules that the user is on-call for | | ✓ | ✓ | ✓ | ✓ | | Trigger, acknowledge, reassign, and resolve incidents | | ✓ | ✓ | ✓ | ✓ | | Add/edit/delete post-incident reviews | | ✓ | ✓ | ✓ | ✓ | | Add/edit/delete:
∙ On-call schedules
∙ Escalation policies
∙ Services
∙ Maintenance windows
∙ Teams | | | ✓ | ✓ | ✓ | | Add new users | | | | ✓ | ✓ | | Delete users (cannot delete the Account Owner) | | | | ✓ | ✓ | | Edit a user's profile/password | | | | ✓ | ✓ | | Create/delete REST API keys | | | | ✓ | ✓ | | Access billing information | | | | | ✓ | | Cannot be deleted | | | | | ✓ | | Change the account owner | | | | | ✓ | | Enable and edit Single Sign-On (SSO) properties* | | | | | ✓ | | Delete the account | | | | | ✓ | \* Available on the following pricing plans: PD Reliability Platform plans, as well as Professional, Business, Digital Operations (legacy), and Enterprise for Incident Management plans. Contact our [Sales Team](https://www.pagerduty.com/contact-us/#contact-sales) if you would like to upgrade to a plan with this feature. ### Stakeholder Users Stakeholders can view objects in an account, but cannot make modifications. Depending on your account's plan, Stakeholders can access the following features: - **Professional Plans**: On Professional plans, Stakeholders can view incidents, services, escalation policies, and similar objects, but cannot action upon these objects. - **Business, Enterprise for Incident Management, and PD Reliability Platform Plans**: On these plans, the intended use case for a Stakeholder is to be an incident [Subscriber](/incident-management/communicate/communicate-with-stakeholders#add-subscribers-to-an-incident). Stakeholders will receive updates about incidents they are subscribed to, but cannot take any action. Stakeholder users are available by default on Digital Operations (legacy), Enterprise for Incident Management, and PD Reliability Platform plans, and can be [purchased as add-on users](https://www.pagerduty.com/pricing/) on Business and Professional pricing plans. Stakeholder licenses are not billed the same as full users. Contact your account representative for more information. ## Check Your User Role To check what role you have, go to **User Icon** → **My Profile**. Depending on your account's plan, your user role information will be found in the following tabs: - **Free, Starter _(Legacy)_, and Team _(Legacy)_ Plans**: These plans will only have a **User Settings** tab, and you will find your **Role** information there. These role types are basic [User Roles](#user-role-permissions). - **Professional, Business, Digital Operations _(Legacy)_, Enterprise for Incident Management, and PD Reliability Platform Plans**: These plans will have an additional **Permissions & Teams** tab where you can find information about your [Base Role](/account-admin/advanced-permissions#base-roles) and any [Team Role(s)](/account-admin/advanced-permissions#team-roles) or [Object Role(s)](/account-admin/advanced-permissions#object-roles) that you may have. These role types are part of [Advanced Permissions](/account-admin/advanced-permissions). ## Edit User Roles Read [Edit User Roles](/account-admin/manage-users#edit-user-roles) for more information about how to edit users' roles and profiles. --- URL: https://docs.pagerduty.com/ai-automation/advance # PagerDuty AI Overview of PagerDuty AI's generative and agentic AI capabilities, including the AI Disclosure and available add-on plans. PagerDuty AI is a set of generative and agentic AI capabilities embedded across the PD Reliability Platform that allows organizations to scale teams and build operational resilience. From AI agents handling well-understood tasks to generative AI for summarizing key information about an incident, PagerDuty AI augments, guides, and resolves operational work. > **Also known as PagerDuty Advance:** This capability is part of the PD Reliability Platform plan. If your organization is not on the PD Reliability Platform plan, you'll see it labeled PagerDuty Advance in your product and account. PagerDuty AI includes: - [PagerDuty AI Assistant](/ai-automation/advance/user-guide#pagerduty-ai-assistant) - [PagerDuty AI Agents](/ai-automation/advance/user-guide#pagerduty-ai-agents) - [PagerDuty AI Integration for Amazon Q](/ai-automation/advance/user-guide#pagerduty-ai-integration-for-amazon-q) - [PagerDuty AI for Post-Incident Reviews](/ai-automation/advance/user-guide#pagerduty-ai-for-post-incident-reviews) - [PagerDuty AI for Status Updates](/ai-automation/advance/user-guide#pagerduty-ai-for-status-updates) - [PagerDuty AI for Automation Digest](/ai-automation/automation/automation-actions#pagerduty-ai-for-automation-digest) - [AI Generated Runbooks](https://docs.rundeck.com/docs/manual/jobs/ai-generated-runbooks.html) (Early Access) > **Availability:** PagerDuty AI is included with PD Reliability Platform plans. It's also available as PagerDuty Advance as an add-on with the following pricing plans: Professional, Business, and Enterprise. [Contact our Sales Team](mailto:sales@pagerduty.com) to upgrade to a plan featuring PagerDuty AI. ## PagerDuty Advance AI Disclosure To learn more about how we designed, built, and assessed PagerDuty AI with mission-critical work in mind, access the PagerDuty Advance AI Disclosure by following these instructions: 1. Navigate to PagerDuty's [Assurance Profile](http://assurance.pagerduty.com). 2. In the top search bar, enter **PagerDuty Advance AI Disclosure** and select the most recent version of the document. 3. Click **** on the document's row to download the document.  *PagerDuty Advance AI Disclosure* > **PagerDuty Guidelines for the Safe and Secure Use of Generative AI:** Generative AI is a predictive technology, and sometimes the information it creates is misleading or false. You must fact-check the output of generative AI before you use it. Read the [PagerDuty Guidelines for the Safe and Secure Use of Generative AI](https://www.pagerduty.com/security/generative-ai-guidelines/) for more information. > **Changes to PagerDuty AI:** We continuously improve our generative AI capabilities. If there are material changes to PagerDuty AI generative AI features, we document those in the PagerDuty Advance AI Disclosure. > > While PagerDuty AI is General Access, certain features of PagerDuty AI are currently in Early Access, as noted in the AI disclosure, and are subject to change. ## PagerDuty AI Benefits - [**PagerDuty AI Assistant**](/ai-automation/advance/user-guide#pagerduty-ai-assistant): Reduce mean time to resolution (MTTR) for critical, unplanned work with the PagerDuty AI Assistant, a generative AI chatbot that provides responders with helpful insight from event to resolution. During an incident, you can interact with the PagerDuty AI Assistant in Slack and Microsoft Teams using simple prompts to get a summary of the key information about the incident. It also anticipates common diagnostic questions and suggests troubleshooting steps. - [**PagerDuty AI for Post-Incident Reviews**](/incident-management/after-incident/post-incident-reviews): Generate a post-incident review with data from the Scribe Agent, Slack messages in the incident's dedicated channel, and Incident Lifecycle Events. PagerDuty AI writes the review's narrative sections, creates narrative markers with supporting evidence, and drafts follow-up actions — all editable afterward. - [**PagerDuty AI Slack Side Panel**](/ai-automation/advance/user-guide#direct-messages-using-the-pagerduty-ai-slack-side-panel): You can send direct messages (DMs) and interact with the PagerDuty AI Assistant without these messages being visible to other team members. This messaging interface provides a private, one-on-one conversation channel where you can ask questions, request assistance, and collaborate on tasks directly with the PagerDuty AI Assistant. - [**PagerDuty AI Agents**](/ai-automation/advance/user-guide#pagerduty-ai-agents): AI agents guide and assist responders by taking on tedious or repetitive tasks within your connected ecosystem of tools, freeing up human capacity for high-impact work and innovation. - [**PagerDuty AI Integration for Amazon Q**](/ai-automation/advance/user-guide#pagerduty-ai-integration-for-amazon-q): The integration with Amazon Q enhances incident responses by incorporating data from your Amazon Q Business apps. This connection provides comprehensive operational information from your organization's tools, helping teams resolve incidents more quickly and effectively. - [**PagerDuty AI for Status Updates**](/ai-automation/advance/user-guide#pagerduty-ai-for-status-updates): Generative AI leverages Slack and Microsoft Teams and PagerDuty log entries to create and send internal status updates. When unplanned, interrupting work strikes, communication and coordination are essential. With push-button means of crafting a draft, responders regain the time and resources needed to reduce downtime and team stress levels. With PagerDuty AI for Status Updates, responders easily keep stakeholders informed throughout an incident while remaining focused on resolution. ## Requirements **In PagerDuty**: - You must have the Admin, Global Admin, or Account Owner base role. **In Slack**: - You must be a workspace admin or owner. **In Microsoft Teams**: - A Microsoft Teams Admin must enable third-party apps for your organization to download the PagerDuty app. - A Microsoft Admin must authorize the Microsoft Graph API permissions required by the PagerDuty app. ## How It Works Once the PagerDuty AI Assistant connects to the chat app: - You can [interact with the PagerDuty AI Assistant in a channel](/ai-automation/advance/user-guide#pagerduty-ai-assistant) to receive wider context, potential root causes, and on-call information. - The PagerDuty AI Assistant allows PagerDuty to read the history of channels directly associated with the incident or service. This information combines with PagerDuty incident log entries, allowing you to [generate a Post-Incident Review draft](/ai-automation/advance/user-guide#pagerduty-ai-for-post-incident-reviews) from any resolved incident. - You can [generate status updates](/ai-automation/advance/user-guide#pagerduty-ai-for-status-updates) from an incident, which leverages the associated Slack channel and PagerDuty log entries. ## Enable the PagerDuty AI Assistant and AI Agents ### 1. Connect a Chat Integration - [Connect PagerDuty AI to Slack](#connect-pagerduty-ai-to-slack) - [Connect PagerDuty AI to Microsoft Teams](#connect-pagerduty-ai-to-microsoft-teams) #### Connect PagerDuty AI to Slack 1. In the PagerDuty web app, navigate to **AI** → **AI Settings**. 2. Select the **Assistant and AI Agents Configuration** tab. 3. Under **Chat Integrations**, check your Slack connection status: - If **Slack** shows ** Not Connected**: Install the [Slack | PagerDuty integration](/integrations/slack-integration-guide). - If **Slack** shows ** Update required**: Enable the PagerDuty Slack app's [Optional Scopes](/integrations/slack-integration-guide#app-permissions) to make PagerDuty AI's incident summaries and updates more helpful. This includes "catch me up" and "wrap me up" summaries, status updates, and proactive incident messages. With optional scopes enabled, these features leverage data from relevant Slack conversations. Note that threaded replies are not included. Without these scopes, PagerDuty AI functions using other data sources like incident notes and Scribe Agent transcripts. 4. Confirm that **Slack** shows ** Connected** or ** Update required**. 5. Toggle **Slack** to the **on** position. 6. Optional: Click **Configure** and enable proactive incident messages. - **Proactive Incident Insights**: Toggle **on** to automatically send incident context, symptoms, impact, and investigation suggestions to incident channels when incidents trigger. - **Proactive Incident Summarization**: Toggle **on** to automatically send private incident summaries to new incident channel members and Post-Incident Reviews to incident channels after resolution. ##### Enable the PagerDuty AI Slack Side Panel > **Availability:** This feature is only available on Slack paid plans. > **Required Scopes:** The PagerDuty AI Slack side panel requires [additional scopes](/integrations/slack-integration-guide/slack-permission-changelog#march-10-2025). A PagerDuty Admin might need to [reauthorize the Slack integration](/integrations/slack-integration-guide#approve-app-update) to grant these scopes. 1. In your Slack workspace, navigate to **Preferences** → **Navigation**. 2. Scroll down to **App agents & assistants** and select the **PagerDuty** checkbox. Slack Admins can also enable the PagerDuty AI Slack side panel for everyone in your Slack workspace. Read the [Display AI apps in Slack](https://slack.com/help/articles/33077521383059-Display-AI-apps-in-Slack) article for more information. ##### Edit the Bot User Name If you want to edit the bot's user name after you configure the integration: 1. Navigate to the Slack Marketplace using one of the following methods: - **Via URL**: Go to `https://[your-pagerduty-subdomain].slack.com/marketplace` and click **Manage** in the upper right. Select **PagerDuty** and click the **App Details** tab to redirect to the Slack Marketplace. Select the **Configuration** tab. - **Via Slack**: Select **PagerDuty** from the **Apps** section in the left menu. Click **Configuration** to redirect to the Slack Marketplace. 2. Scroll to the **Bot User** section and click **Edit**. 3. Enter a new **bot name** and click **Save Changes**. #### Connect PagerDuty AI to Microsoft Teams 1. In the PagerDuty web app, navigate to **AI** → **AI Settings**. 2. Select the **Assistant and AI Agents Configuration** tab. 3. Under **Chat Integrations**, if **Microsoft Teams** shows ** Not Connected**: - Install the [Microsoft Teams | PagerDuty integration](/integrations/microsoft-teams). - In Microsoft Teams, add the [Optional Permissions for PagerDuty AI](/integrations/microsoft-teams#what-microsoft-graph-permissions-are-required-by-the-pagerduty-app) to allow communication with PagerDuty AI. 4. Confirm that **Microsoft Teams** shows ** Connected**. 5. Toggle **Microsoft Teams** to the **Enabled** position. 6. Optional: Click **Configure** and enable proactive incident messages. - Toggle **Proactive Incident Insights** to the **on** position. When an incident triggers, automatically send a message to the incident channel with the incident's context, symptoms, overall impact on services and customers, and suggested investigation paths. - Toggle **Proactive Incident Summarization** to the **on** position. When new individuals join an incident channel, automatically send them a private incident summary. After an incident resolves, send a Post-Incident Review to the incident channel. ### 2. Enable or Disable AI Agents > **Required User Permissions:** Account Owners and Global Admins have the ability to enable or disable AI agents. > > If you do not have these permissions, click **Request to Admin** next to the AI agent you want to use. This sends an email request to your admins to enable that agent for you. 1. In the PagerDuty web app, navigate to **AI** → **AI Settings**. 2. Select the **Assistant and AI Agents Configuration** tab. 3. Under **AI Agents**, toggle the switch of an AI Agent to the **Enabled** position. 4. Visit the AI agents' guides for additional setup instructions: - [Insights Agent](/ai-automation/advance/insights-agent) - [Shift Agent](/ai-automation/advance/shift-agent) - [Scribe Agent](/ai-automation/advance/scribe-agent) - [Paige (SRE Agent)](/ai-automation/advance/sre-agent) ### 3. Add Data Sources #### Add a GitHub Personal Access Token Grant access to your GitHub repositories so PagerDuty AI automatically uses incident and chat data to identify and surface important change events that potentially caused the incident. 1. Install the [GitHub Changes | PagerDuty integration](/integrations/github-changes). 2. In the PagerDuty web app, navigate to **AI** → **AI Settings**. 3. Select the **Assistant and AI Agents Configuration** tab. 4. Under **Data Sources**, toggle **Allow PagerDuty AI to access GitHub Repositories** to the **on** position. 5. Copy your [GitHub token](https://docs.github.com/en/authentication/keeping-your-account-and-data-secure/managing-your-personal-access-tokens) and paste it into the **GitHub Personal Access Token** field. 6. Click **Save Token**. #### Connect PagerDuty AI with Amazon Q PagerDuty AI's integration as a data accessor for Amazon Q enables teams to use chat apps to quickly search and retrieve intelligent insights from multiple external sources connected to your organization's Amazon Q Business apps. For instance, when investigating similar past incidents, you can quickly access relevant runbook documentation from Confluence or pull historical data from ServiceNow, streamlining the troubleshooting and resolution process. For more information on Amazon Q data accessors, read the [Amazon Q Business User Guide](https://docs.aws.amazon.com/amazonq/latest/qbusiness-ug/data-accessors.html). ##### In the AWS Management Console 1. In the Services search bar, search for and select **Amazon Q Business**. 2. Under the **Applications** section, click **Create application**. 3. On the **Create application** page, configure the following information: | Field | Value | | :----------------------------- | :--------------------------------------------------- | | **Application name** | Enter the new application's name. | | **User access** | Select **Authenticated access**. | | **Access management method** | Select **AWS IAM Identity Center (recommended)**. | 4. Click **Create**. 5. In the left menu, under the **Enhancements** section, select **Data accessors**. 6. Click **Add data accessor** and select the **PagerDuty Advance** data accessor. 7. Update the PagerDuty Advance data accessor's name, data sources, and access permissions. 8. Click **Add data accessor**. 9. Leave the **Data accessor configuration details** prompt open to use when configuring this connection in PagerDuty. ##### In PagerDuty 1. In the PagerDuty web app, navigate to **AI** → **AI Settings**. 2. Select the **Assistant and AI Agents Configuration** tab. 3. Under **Data Sources**, toggle **Enable Amazon Q Business** to the **on** position. 4. On the **Amazon Q Business Configuration Values** modal, enter your PagerDuty Advance data accessor details from AWS: | In PagerDuty | In AWS | Description | | :---------------------------- | :------------------------ | :------------------------------------------------------------------------------------------------------------------- | | **IdC application region** | IdC application region | The AWS region for the IAM Identity Center instance (for example, us-west-2). | | **Application ID** | Application ID | The Amazon Q Business application ID (for example, 1a1a1a1-2b2b-3c3c-4d4d-5e5e5e5e5e). | | **Application region** | Application region | The AWS region for the Amazon Q Business application (for example, us-west-2). | | **Retriever ID** | Retriever ID | The Amazon Q Business retriever ID for PagerDuty Advance (for example, 1a1a1a1-2b2b-3c3c-4d4d-5e5e5e5e5e). | | **IdC application ARN** | IdC application ARN | Also called the Data Accessor Application ARN, the client ID for IAM Identity Center (for example, arn:aws:sso::...). | 5. Click **Save configuration values**. 6. To change these values, click **Edit configuration values**, enter the new values, and click **Save configuration values**. ## Granular Access to PagerDuty AI With PagerDuty AI, Admins can either enable/disable for all PagerDuty users or choose to implement a gradual rollout approach per team. 1. In the PagerDuty web app, navigate to **AI** → **AI Settings**. 2. Select the **Access** tab. 3. Scroll through the list of teams and toggle the ones that you want to grant access to PagerDuty AI **Note:** By default, all teams are enabled to use PagerDuty AI. > **How team access is enforced:** Team-level access is enforced per user, based on PagerDuty team membership. Users on a team with access can invoke PagerDuty AI actions; users who are not cannot. This applies to every access method: the web app, chat integrations (Slack and Microsoft Teams), and the API. 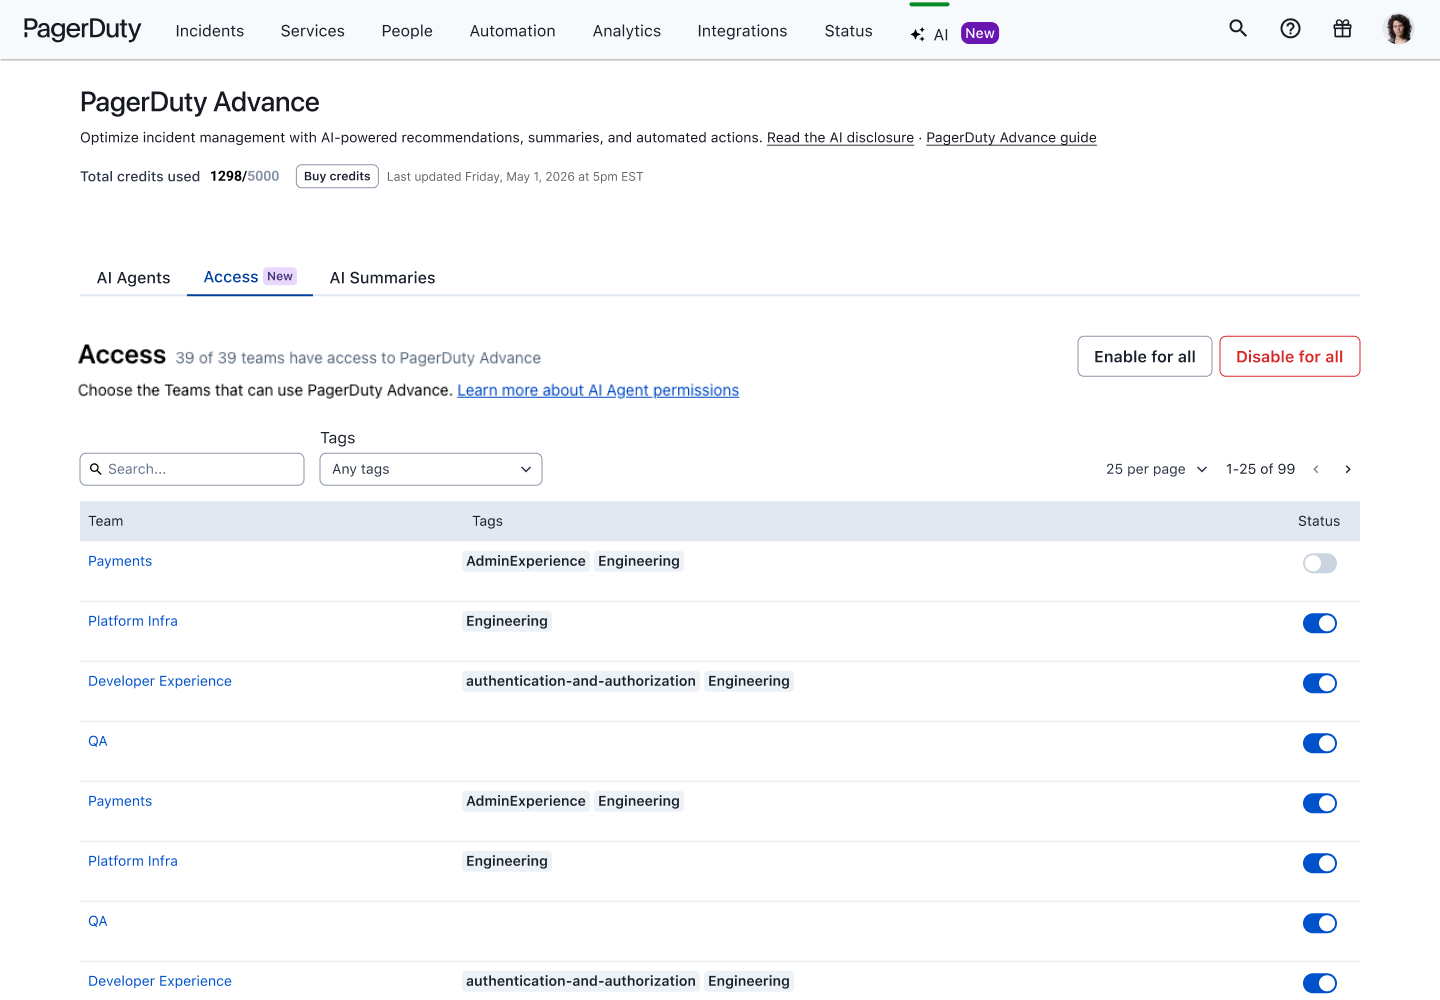 *PagerDuty AI team-level access control* ## Enable AI Summaries Enable AI Summaries features to generate AI-powered incident summaries on the PagerDuty web app. 1. In the PagerDuty web app, navigate to **AI** → **AI Settings**. 2. Select the **AI Summaries** tab. 3. Toggle **PagerDuty AI for Status Updates** to the **on** position. Use the latest incident and Slack and Microsoft Teams data to [automatically generate internal Status Updates](/ai-automation/advance/user-guide#pagerduty-ai-for-status-updates). 4. Toggle **PagerDuty AI for Automation Digest** to the **on** position. Use Automation Actions Log data to [automatically generate log digest summaries](/ai-automation/automation/automation-actions#pagerduty-ai-for-automation-digest). **Note:** To access these features with the PagerDuty AI Assistant, you must enable at least one chat integration. ## Manage PagerDuty AI Account Settings To exercise granular control over which PagerDuty AI features are available within your account, manage these features in your PagerDuty AI settings. > **Required User Permissions:** Account Owners and Global Admins can manage PagerDuty AI settings. > > Other roles can only view these settings. For AI Agents, click **Request to Admin** next to the AI agent you want to use to send an email request to your admins to enable that agent. To configure PagerDuty AI settings, navigate to **AI** → **AI Settings** and select from the tabs below: - [Assistant and AI Agents Configuration](#assistant-and-ai-agents-configuration) - [AI Summaries](#ai-summaries) ### Assistant and AI Agents Configuration #### Chat Integrations Toggle the switch of a chat integration to enable or disable the PagerDuty AI Assistant and AI agents for your chat app. - Slack - Microsoft Teams Note: When disabled, the PagerDuty AI Assistant features including Post-Incident Reviews and Slack Side Panel are disabled for your chat app. Click **Configure** on your enabled chat integration to turn proactive messages on or off: - **Proactive Incident Insights**: When an incident triggers, automatically send a message to the incident channel with the incident's context, symptoms, overall impact on services and customers, and suggested investigation paths. - **Proactive Incident Summarization**: When new individuals join an incident channel, automatically send them a private incident summary. After an incident resolves, send a Post-Incident Review to the incident channel. #### AI Agents Toggle the switch of an AI agent to turn it on or off. - [Insights Agent](/ai-automation/advance/insights-agent) - [Shift Agent](/ai-automation/advance/shift-agent) - [Scribe Agent](/ai-automation/advance/scribe-agent) - [Paige (SRE Agent)](/ai-automation/advance/sre-agent) #### Data Sources Toggle the switch of a data source to control the information that the PagerDuty AI Assistant can access. - **Allow PagerDuty AI to access GitHub Repositories**: Automatically use incident and chat data to identify recent code changes that potentially caused the incident. - **Enable Amazon Q Business**: Use Amazon Q Business to retrieve information from its connectors within PagerDuty AI. ### AI Summaries Toggle the switch of an AI Summary feature to turn it on or off. - **PagerDuty AI for Status Updates**: Use the latest incident and Slack and Microsoft Teams data to automatically generate internal status updates. - **PagerDuty AI for Post-Incident Reviews (Beta)**: Use the latest incident and Slack data to automatically generate post-incident review reports. - **PagerDuty AI for Automation Digest**: Use Automation Actions Log data to automatically generate log digest summaries. ## Disable PagerDuty AI 1. In the PagerDuty web app, navigate to **AI** → **AI Settings**. 2. Click **...** in the top right corner. 3. Select **Disable PagerDuty Advance**. 4. Click **Disable**. Note: To re-enable PagerDuty AI, navigate to **AI** → **AI Settings** and click **Enable Advance**. Warning: Disabling PagerDuty AI here does not affect the AI Generated Runbooks (Early Access) feature. If you want to disable that feature, [contact our Sales Team](mailto:sales@pagerduty.com). ## PagerDuty AI User Guide Read our [PagerDuty AI User Guide](/ai-automation/advance/user-guide) to learn more about using PagerDuty AI's features after configuration. ## PagerDuty AI Trial for Legacy Pricing Plans Accounts on some legacy pricing plans (such as Digital Operations) can trial PagerDuty AI. As the Account Owner: 1. In the PagerDuty web app, navigate to **User Icon** → **Account Settings**. 2. In the **Product Trials** section, click **Activate PagerDuty Advance Trial**. Your PagerDuty AI trial begins immediately. You can view your remaining AI Actions and the trial end date. Click **Configure PagerDuty Advance** to manage [PagerDuty AI settings](#manage-pagerduty-ai-account-settings). ## FAQ **How do AI Actions work?** Read our [Product-Specific Terms](https://www.pagerduty.com/product-specific-terms/) for information on AI Actions. **What is the difference between PagerDuty Advance credits and AI Actions?** There is no difference. PagerDuty Advance credits are now called AI Actions. **How many AI Actions does each action type cost?** The current number of AI Actions that each action type consumes is as follows: | Action Type | Description | AI Actions\* | | :---------------------- | :------------------------------------------------------------------------------------------------------------------------------------------------------------------------------------------------------------------------------------------- | :-------------------------------------------------------------------------------------------------------------------------------------------- | | Automation Digest | One request to summarize the most important results from one Automation Action job using PagerDuty AI for Automation Digest | 1 | | Incident Summarization | One request to summarize an incident using PagerDuty AI Assistant (for example, catch me up or bring me up to speed) | 2 | | Status Update | One request to generate a status update that includes incident status and notes using PagerDuty AI for Status Updates | 3 | | Planned Work | One question that is non-incident related. This includes general questions about the product | 2 | | Scribe Agent | One request that summarizes real-time audio transcripts from videoconferencing tools and generates a post-meeting summary | 6 actions per 30 minutes of bridge time. Plus a one-time charge of 2 actions when a meeting summary is generated at the end of the meeting. | | Shift Agent | Shift Agent is included at no additional cost and does not consume AI Actions. | 0 | | Insights Agent | Insights Agent is included at no additional cost and does not consume AI Actions. | 0 | | Key Moments | Automatically identifies key details from a resolved incident to be included in [post-incident reviews](/incident-management/after-incident/post-incident-reviews). | 0 | | Paige (SRE Agent) | One of the following:
- Each request submitted to Paige via Slack or the **Operations Console** (for example, "What are my past incidents?"), or
- Clicking one of the nudge buttons (for example, **Update runbook**), or
- Paige being triggered via an Incident Workflow or Escalation Policy | 4 | | Premium Workflow Actions\*\* | Workflow Actions marked as premium | 2 | AI Actions were previously known as PagerDuty Advance credits.
\*The number of AI Actions consumed by action type may change at PagerDuty's sole discretion. \*\*Only available on PD Reliability Platform plans. If there are insufficient AI Actions for Premium Workflow Actions, users may not be able to add or edit workflows with Premium Workflow Actions. **How do I view how many AI Actions I have used?** You can see how many AI Actions have been used by navigating to **Analytics** → **PagerDuty AI Analytics** or **AI** → **Usage Analytics**. If you are the Account Owner, you can also review the remaining AI Actions for your subdomain by selecting the **Your Subscription** tab in [Account Settings](/account-admin/account-settings#your-subscription). **What Large Language Models (LLMs) does PagerDuty use?** PagerDuty AI generates outputs with assistance from certain LLM providers. Read the [PagerDuty Advance AI Disclosure](#pagerduty-advance-ai-disclosure) to learn more about how we designed, built, and assessed PagerDuty AI with mission-critical work in mind, including any third-party models used. **Does PagerDuty AI train models using my data?** PagerDuty does not use your data to train models used for PagerDuty AI. **How do I get more compliance, legal, privacy or security information about PagerDuty AI?** - You can read the [PagerDuty Advance AI Disclosure](#pagerduty-advance-ai-disclosure) to learn more about how we designed, built, and assessed PagerDuty AI with mission-critical work in mind. - Stay informed about the compliance status of PagerDuty AI by reviewing our [Services in Scope](https://www.pagerduty.com/security/in-scope-services/) page. **Are there any requirements for PagerDuty AI actions to work?** For minimum requirements, read the [PagerDuty Advance AI Disclosure](#pagerduty-advance-ai-disclosure) for details. Additionally, certain action types work only if certain products are provisioned in your account. For example, the Automation Digest action type requires the Automation Actions product. The following PagerDuty AI Assistant prompts require the following products to work: | Prompt | Required Product | | :----------------------------------------------------------------- | :--------------------- | | Where are the alerts coming from? | Incident Management | | Are there any related services affected? | Incident Management | | Are there any open incidents for \{service name\}? | Incident Management | | Who do I go to for help (who is on call)? | Incident Management | | What happened? | Incident Management | | Catch me up on this incident | Incident Management | | Generate a post-incident review | Incident Management | | Write me a status update message | Incident Management | | How do I set up \{PagerDuty feature\}? | Incident Management | | What are the best practices for \{PagerDuty feature\}? | Incident Management | | Why can I not add notes to a PagerDuty incident? | Incident Management | | What questions can I ask PagerDuty AI? | Incident Management | | What data is used to generate a status report? | Incident Management | | Why are my Android notifications not showing up? | Incident Management | | How can I set up an integration with Jira? | Incident Management | | What is the customer impact? | CSOps | | What changed? | AIOps | | What is the probable cause? | AIOps | | Are any of the changes likely to be the cause of the incident? | AIOps | | Has this incident happened before? | AIOps | **What incident actions can I perform with the PagerDuty AI Assistant?** The PagerDuty AI Assistant now uses intelligent AI routing to connect you with specialized AI agents for different tasks. However, it no longer supports direct incident actions such as acknowledging incidents, adding responders, running workflows, or resolving incidents. You can still perform these incident actions using the PagerDuty app commands and incident card buttons in your chat application. **How can I use the PagerDuty Advance plugin with Amazon Q?** The Amazon Q Business PagerDuty Advance plugin allows you to interact with the PagerDuty AI Assistant. Visit the [Configuring a PagerDuty Advance plugin for Amazon Q Business](https://docs.aws.amazon.com/amazonq/latest/qbusiness-ug/pagerduty-actions.html) article for more information on configuring this plugin. **What PagerDuty AI Assistant questions are supported In Japanese?** The PagerDuty AI Assistant supports both inputs and outputs in Japanese for these action types: 1. Any Incident Insight question except: - Change Events / Probable Cause - Who is on call - Service context (other services) 2. Any Incident Summarization **How do I migrate from the PagerDuty Advance Slack app to the PagerDuty Slack app?** The PagerDuty Advance Slack app is no longer available. To enable PagerDuty AI in the PagerDuty Slack app, follow the [setup guide](#connect-pagerduty-ai-to-slack). --- URL: https://docs.pagerduty.com/ai-automation/advance/add-paige-as-virtual-responder # Add Paige as Virtual Responder Configure an Incident Workflow to deploy Paige as a virtual responder in Slack or the PagerDuty web app > **Early Access:** This feature is currently in [Early Access](https://www.pagerduty.com/early-access/) and subject to change. ## Overview Paige, PagerDuty's SRE Agent, acts as a virtual responder for your incidents. It automatically investigates as incidents trigger, gathering context from your connected integrations and surfacing recommended next steps. This ensures your team gets the information they need to act immediately, without spending time on manual investigation. ## Enabling Paige Paige is enabled through your existing Incident Workflows. Once configured, Paige activates automatically when an incident triggers—no manual invocation required. ### Key Capabilities When invoked, Paige: - **Reviews** past incidents and notes for historical context. - **Gathers Information** automatically from configured integrations and connectors, including Confluence, log sources, and other connected tools. - **Surfaces Recommended Workflows** so your team can take decisive action quickly. ### Getting Started with Templates To get up and running quickly, PagerDuty provides two pre-built templates for adding Paige to an Incident Workflow. Choose the option that best fits your team's workspace: 1. Navigate to **Incident Workflows** and select **View more templates**. 2. Locate the **Paige Virtual Responder** templates. You can choose to publish Paige's updates directly to: - [A dedicated incident **Slack channel**](#configuring-paige-virtual-responder-in-a-dedicated-incident-channel-in-slack). - [The **PagerDuty Web Application**](#configuring-paige-virtual-responder-in-the-pagerduty-web-app). ### Configuring Paige Virtual Responder in a Dedicated Incident Channel in Slack #### Step 1 - Open the Template 1. Navigate to **Automation** → **Incident Workflows** in the PagerDuty web app. 2. In the templates section at the top, click **Paige virtual responder** in dedicated incident Slack. 3. Review the template preview. 4. Click **Use Template**. #### Step 2 - Configure the Trigger You can configure a [Condition and/or Manual](/ai-automation/automation/incident-workflows#triggers) trigger to run the workflow. > The Conditional Trigger fires automatically when an incident in an associated service is created or updated. The Manual Trigger allows responders to invoke the workflow on demand from an incident. > **Conditional Trigger Tip:** Scoping a conditional trigger to high-urgency incidents is a good starting point to limit noise. #### Step 3 - Configure Add Paige Action 1. Click **Add Paige** action block. 2. Under **Surface**, select **Slack**. - This dynamically links Paige's output to the dedicated Slack channel created for each incident. 3. Click **Save**. #### Step 4 - Publish and Test the Workflow 1. Click **Publish**. 2. Test by triggering an incident on one of your configured services. Paige will automatically create a dedicated Slack channel (e.g., #incident_1234) and post its findings including historical context, root cause analysis, links to relevant runbooks and dashboards, and prioritized next steps. ### Configuring Paige Virtual Responder in the PagerDuty Web App #### Step 1 - Open the Template 1. Navigate to **Automation** → **Incident Workflows** in the PagerDuty web app. 2. In the templates section at the top, click **Paige virtual responder** in PagerDuty. 3. Review the template preview. 4. Click **Use Template**. #### Step 2 - Configure the Trigger You can configure a [Condition and/or Manual](/ai-automation/automation/incident-workflows#triggers) trigger to run the workflow. > The Conditional Trigger fires automatically when an incident in an associated service is created or updated. The Manual Trigger allows responders to invoke the workflow on demand from an incident. > **Conditional Trigger Tip:** Scoping a conditional trigger to high-urgency incidents is a good starting point to limit noise. #### Step 3 - Configure Add Paige Action 1. Click **Add Paige** action block. 2. Under **Surface**, select **PagerDuty Web**. 3. Click **Save**. #### Step 4 - Publish and Test the Workflow 1. Click **Publish**. 2. Test by triggering an incident on one of your configured services. --- URL: https://docs.pagerduty.com/ai-automation/advance/connectors-tools-and-skills # Paige: Connectors and Skills Connect Paige to observability platforms and knowledge bases so it can ground triage recommendations in real system data. Paige, PagerDuty's SRE Agent, retrieves log data, metrics, and runbooks from observability platforms and knowledge bases to guide responders through investigation, triage, and resolution. By connecting your observability stack and institutional knowledge, Paige moves beyond simple alert analysis. - [**Connectors and Tools**](#connectors-and-tools) give Paige real-time access to your logs and metrics, so every triage analysis is grounded in the actual state of your systems — not just the alert payload. - [**Skills**](#skills) give Paige institutional knowledge specific to your environment — your runbooks, your escalation paths, your standards — so it can recommend precise next steps instead of generic ones. Together, these capabilities help your team triage faster with less human involvement, reducing MTTA and MTTR while building confidence in AI-assisted operations. Navigate to **AI Settings** → **Paige Configuration** to get started. > **Prerequisites:** Before configuring connectors, ensure the following: > > - You have Admin or Account Owner permissions in PagerDuty. > - You have credentials or API keys for the third-party integrations you plan to connect. ## Connectors and Tools Connectors link Paige to your external data sources. Once a connector is active, the agent can use its associated tools — such as querying logs or pulling metrics — automatically or via user request. ### Supported Connectors Navigate to **AI Settings** → **Paige Configuration** → **Connectors** to view and manage your connectors. | Connector | Tools | Connection Type | | :-------------------- | :-------------- | :--------------- | | **Arize** | Metrics | API | | | Traces | API | | [**Atlassian**](#atlassian) | Knowledge Base | MCP | | **AWS (CloudWatch)** | Logs | API | | **Azure Monitor** | Logs | API | | **Confluence** | Knowledge Base | API | | **Coralogix** | Logs | API | | **Datadog** | Logs | API | | | Metrics | MCP | | | Traces | MCP | | **Dynatrace** | Logs | API | | **Elasticsearch** | Logs | API | | **GCP** | Logs | API | | **GitHub** | Knowledge Base | API | | | Code | MCP | | | Code (Revert PR) | API | | **Grafana** | Logs | API | | | Metrics | API | | **Honeycomb.io** | Logs | MCP | | | Metrics | MCP | | **Logz.io** | Logs | API | | **New Relic** | Logs | API | | | Metrics | MCP | | | Traces | MCP | | [**Notion**](#notion) | Knowledge Base | MCP | | **Observe Inc.** | Logs | MCP | | | Metrics | MCP | | **Sentry** | Logs | API | | **ServiceNow** | Knowledge Base | API | | **Splunk** | Logs | API | | | Metrics | MCP | | **Sumo Logic** | Logs | API | ### Set up a Connector 1. In the PagerDuty web app, navigate to **AI Settings** → **Paige Configuration** and click the **Connectors** tab. 2. Find the connector you want to add and click **Connect**. If the connector is already listed but shows **Unhealthy**, click the menu to edit or reconnect it. 3. On the **Connect to [Integration] Tools** screen, select an existing connection from the dropdown or click **Manage Connections** to create a new one. 4. Under **Agent May Use These Tools**, check the tools you want to enable. 5. Click **Save**. The connector appears in your list with a status of `Active` once the connection is established. ### Connector Statuses - **Active:** The connector is healthy and Paige can use its tools. - **Unhealthy:** The connection exists but is failing. Check your credentials or API key and reconnect. - **Not Connected:** No connection has been set up. Click **Connect** to configure it. ### Connector Setup Notes #### Atlassian The Atlassian connector lets Paige search Confluence and read pages through Atlassian's remote MCP server. It uses OAuth 2.1 with PKCE and doesn't need a client secret or API key. Paige's access is read-only: it can search Confluence and read pages, and it can't create or change content. > **Admin Prerequisite:** Before anyone connects, an Atlassian organization admin must allow PagerDuty's OAuth callback URL in Atlassian Administration. Navigate to **Rovo** → **Rovo MCP server** → **Your domains**, and add the exact callback URL for your PagerDuty region: > > - US: `https://api.pagerduty.com/actions/public/oauth/redirect` > - EU: `https://api.eu.pagerduty.com/actions/public/oauth/redirect` > > If the domain isn't allowed, Atlassian blocks the redirect and shows an error that starts with "Your admin has blocked this domain...". A newly added domain can take a few minutes to take effect, so if you see this error right after adding it, wait a few minutes and try connecting again. To connect Atlassian, follow [Set up a Connector](#set-up-a-connector) and select **Atlassian**. When you create a new connection, you sign in to Atlassian, select the site to integrate, and approve access. PagerDuty requests read access to Confluence content, Confluence search, Rovo search, and your basic Atlassian profile. Paige uses these to list the Atlassian sites you can access, search Confluence in natural language or with CQL, and read a Confluence page by ID or URL. Searches that Paige runs through the Atlassian connector use Rovo credits from your Atlassian plan. Atlassian access tokens last 8 hours. PagerDuty checks the connection and refreshes the token every hour. If the connector shows **Unhealthy**, reconnect it to sign in to Atlassian again. #### Notion The Notion connector connects Paige to a Notion workspace through Notion's hosted MCP server. It uses OAuth 2.1 with PKCE and doesn't need a client secret or API key. Paige's access is read-only: it can search and read pages, databases, and data sources, and it can't create, edit, or delete Notion content. You can also paste a Notion page URL in chat so Paige reads that page. To connect Notion, follow [Set up a Connector](#set-up-a-connector) and select **Notion**. When you create a new connection, you sign in to Notion and approve access. Each connection covers one Notion workspace: the one you select when you approve access. When the workspace has a Notion AI plan, Paige uses Notion's AI (natural-language) search. Otherwise, Paige falls back to keyword search. Paige doesn't show Notion upgrade links in either case. Notion access tokens last 8 hours, and the connection health check refreshes them hourly. Notion requires you to re-authorize after 180 days, or after 30 days without use. If the connector shows as **Unhealthy**, reconnect it to fix it. ### Runbook Links When Paige is provided access to documents, it fetches a document if it determines the document is relevant or if you request it in chat. #### Confluence 1. Set up the [Workflow Integration](/ai-automation/automation/incident-workflows/workflow-integrations) and [set up the connector](#set-up-a-connector). Alternatively, set up the [Atlassian connector](#atlassian), which doesn't need a Workflow Integration. Paige fetches a Confluence runbook link through whichever one is enabled for your account. > **OAuth Access:** If you have set up your OAuth connection to Confluence but the integration is not working, verify that your admin has approved your user access to the PagerDuty app in Confluence. If you use the Atlassian connector, see the [admin prerequisite](#atlassian) for allowing PagerDuty's callback URL in Atlassian. 2. If you have your runbook link configured, Paige should identify it in the event payload. 1. If Paige doesn't identify the runbook link, update the event payload in your monitoring tool to include your Confluence runbook link in `custom_details` using the following nested key: ```json "custom_details": { "runbook_url": { "confluence": "https://YOUR-RUNBOOK-LINK" } } ``` #### GitHub 1. Set up the [Workflow Integration](/ai-automation/automation/incident-workflows/workflow-integrations) and [set up the connector](#set-up-a-connector). > **Branch Requirement:** Linked documents must already be committed to the main branch and cannot be from a feature branch. 2. If you have your runbook link configured, Paige should identify it in the event payload. 1. If Paige doesn't identify the runbook link, update the event payload in your monitoring tool to include your GitHub runbook link in `custom_details` using the following nested key: ```json "custom_details": { "runbook_url": { "github": "https://YOUR-RUNBOOK-LINK" } } ``` #### ServiceNow 1. Set up the [Workflow Integration](/ai-automation/automation/incident-workflows/workflow-integrations) and [set up the connector](#set-up-a-connector). 2. If you have your runbook link configured, Paige should identify it in the event payload. 1. If Paige doesn't identify the runbook link, update the event payload in your monitoring tool to include your ServiceNow runbook link in `custom_details` using the following nested key: ```json "custom_details": { "runbook_url": { "servicenow": "https://YOUR-RUNBOOK-LINK" } } ``` #### Set Custom Details with Orchestration Rules You can use [orchestration rules](/ai-automation/aiops/event-orchestration#step-2-create-rules) to update the event payload to include your runbook links in `custom_details`. 1. Navigate to an orchestration. 2. Navigate to **Edit Event Rule** → **Event Fields** → **Add Event Field**. 3. Click the **Select Field** dropdown and add a custom details path to the event field: - For GitHub: `runbook_url.github` - For Confluence: `runbook_url.confluence` - For ServiceNow: `runbook_url.servicenow`  *Configuring a runbook link in event fields* 4. Under **Replace using**, select **Template**. 5. In **Replace with value**, paste the URL of the runbook. 6. Click **Save**. ### Best Practices - Log queries work best when there are query examples in the runbook or alert payload. Sample queries in the alert payload can be in any `custom_details` field. - You can also provide queries directly to the agent to help ensure accurate log search. ### Prompt Examples - **@pagerduty** can you fetch the logs for this incident? - **@pagerduty** can you search the logs with this criteria [_enter criteria_]? ## Skills > **Skills (Available in Early Access):** Arm your agent with specialized domain expertise using custom instructions, scripts, and runbooks. Skills are available through **AI Settings** or the PagerDuty Claude plugin. Skills let you give Paige custom instructions, runbooks, and scripts for specialized domain expertise. Rather than relying only on retrieved data, a skill tells the agent how to handle specific situations, so it can work out the next steps for troubleshooting an issue. ### How Paige Uses Skills Skills load progressively to keep Paige's context focused. Paige does not read every skill's full instructions up front. Paige may load a skill automatically if it decides the skill is relevant. After loading it, Paige may choose not to run the skill if the instructions do not fit the problem it is working on. > **Skills Do Not Run on Conditions:** Paige does not support running a skill when specific conditions are met, such as alert fields, incident title patterns, urgency, or lifecycle events. A skill is not guaranteed to run for every matching incident. > > To make Paige more likely to use a skill in a specific scenario: > > - **Write a clear name, description, and examples.** These are the only cues Paige has before it loads the skill. > - **Reference the skill in a runbook.** For example: "For suspected security issues, use the `detect-security-incident-logs` skill." > - **Reference the skill in a custom triage skill.** For example: "If the alert custom details include `type: possible_security_issue`, run the `detect-security-incident-logs` skill." > - **Ask for it directly** in chat. ### What a Skill Contains Each skill is a structured set of instructions with the following components: | Component | Details | | :------------------- | :------------------------------------------------------------------------------------------------------------------------------------------------------------------------------------------ | | **When to Use** | Guidance that helps Paige confirm this is the right skill after it loads. This does not make the skill run automatically. | | **Prerequisites** | The integrations or data the agent needs to execute the skill. | | **Execution Steps** | Step-by-step instructions the agent follows. | | **Error Handling** | How the agent should gracefully degrade if a step fails. | | **Success Criteria** | How the agent determines whether the skill ran successfully. | | **Examples** | Three to five example requests or scenarios where this skill applies, each up to 200 characters. Along with the name and description, Paige uses these to decide whether to load the skill. | #### Example Skill: detect-security-incident-logs The following is an example of a fully structured skill that you can use as a template. This skill searches Datadog and AWS CloudWatch logs for critical security events. **Name:** `detect-security-incident-logs` **Description:** Searches Datadog and CloudWatch logs for critical security events. Use when an incident may involve a security issue or a responder asks to check for security incidents. **Example Instructions:** ```text When to use: - The incident or alert suggests a possible security issue (for example, alert custom details include type: possible_security_issue) - A responder asks the agent to check for security incidents Prerequisites: - Datadog connector configured and active - AWS CloudWatch connector configured and active Execution steps: 1. Search Datadog logs for the exact phrase SECURITY_INCIDENT: CRITICAL within the incident time window. 2. Search AWS CloudWatch logs for the exact phrase SECURITY_INCIDENT: CRITICAL within the incident time window. 3. If matches are found in either source, surface the key log details in Paige's response. 4. Recommend triggering the Alert Security Team incident workflow. Error handling: - If one connector is unavailable, continue with the other and note which source was skipped. - If both connectors are unavailable, inform the responder and suggest checking logs manually. Success criteria: - The agent has queried both log sources and reported results or confirmed no matches were found. Examples: - "Check for any security incidents in the logs" - "Are there critical security events related to this incident?" - Triaging an alert where custom_details includes type: possible_security_issue ``` ### Create a Skill You can create skills in the PagerDuty web app or with the PagerDuty Claude plugin. #### In the PagerDuty Web App 1. In the PagerDuty web app, navigate to **AI Settings** → **Paige** → **Configure** and click the **Skills** tab. 2. Click **Add Skill**. 3. On the **New Skill** page, complete the following fields: | Field | Value | | :------------------------------------- | :------------------------------------------------------------------------------------------------------------------------------------------------------------------------------------------------------------------------------------------- | | **Name** | Enter a unique, descriptive identifier for the skill (for example, `escalation-runbook`). Paige uses the name to decide whether to load the skill. | | **Description** | Enter a short description of what the skill does and when it should be used (for example, `Guides the agent when escalating incidents to a secondary team`). Paige uses the description to decide whether to load the skill, so be specific. | | **Instructions** | Enter the full instructions to send to the LLM. Use the structure described in [What a Skill Contains](#what-a-skill-contains) as a guide. | | **Make skill available to everyone** | Check this option to make the skill accessible to everyone in the account. When unchecked, the skill is only available to you. | 4. Click **Save**. Paige can use the skill on future incidents. 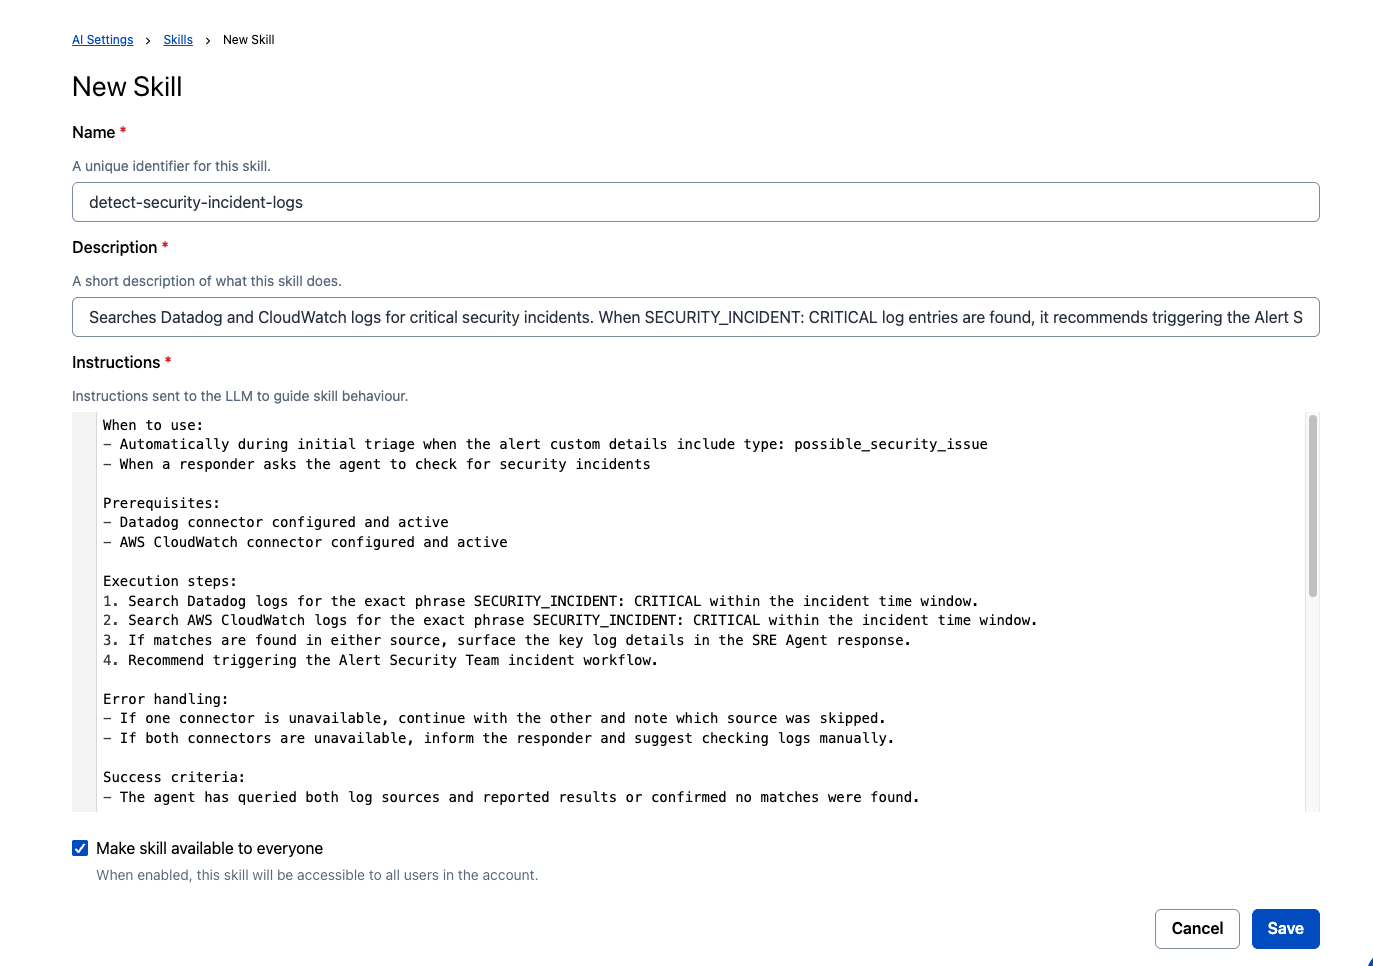 *Create a skill in PagerDuty* #### Use the Claude Plugin 1. Install the PagerDuty Claude plugin. 2. Run the `/pagerduty:create-pagerduty-skill` command and follow the guided prompts to define the skill's name, description, instructions, usage guidance, and examples. 3. Once created, Paige can use the skill on future incidents. ### Test a Skill After creating a skill, test it by asking Paige to use it in chat on a relevant incident, or by triggering an incident that your runbook or triage skill links to the skill. Then review what the agent reports in: - The **Paige** tab on the incident details page. - Your ChatOps channel (Slack or Microsoft Teams). --- URL: https://docs.pagerduty.com/ai-automation/advance/insights-agent # Insights Agent Unlock the power of your operational data directly from Slack and MS Teams. The Insights Agent delivers proactive recommendations and on-demand conversational insights based on your Incidents, Services, and Teams analytics. By surfacing operational risks, trends, and patterns, this AI agent empowers data-driven decision making and building more resilient operations. > **Availability:** This feature is included with PD Reliability Platform plans. It's also available as PagerDuty Advance on Professional, Business, and Enterprise plans. > > [Contact our Sales Team](mailto:sales@pagerduty.com) if you would like to upgrade to a plan featuring PagerDuty AI. > **Required User Permissions:** An Admin, Global Admin, or Account Owner role can manage [PagerDuty AI](/ai-automation/advance) settings. > > Any user with a linked PagerDuty account can interact with the Insights Agent. All users can see Insights Agent responses within a public channel. ## Configure Insights Agent Insights Agent is automatically activated for all customers who have enabled PagerDuty AI. Follow the instructions in our [PagerDuty AI](/ai-automation/advance#connect-pagerduty-ai-to-slack) article to enable PagerDuty AI in Slack. ## Disable Insights Agent Disable the Insights Agent by toggling its switch to the **off** position on the [AI Settings](/ai-automation/advance#2-enable-or-disable-ai-agents) page. ## User Guide The Insights Agent can answer questions and synthesize patterns, trends, and risks associated with data available in the Incident, Service, and Teams Analytics reporting in PagerDuty. You can ask any Insights Agent question in one of the following ways: - In a public channel, enter `@pagerduty
**User setup** — You can then add the Scribe Agent to your meetings. ### Step 1 - Video Conferencing Platform Setup Zoom and Microsoft Teams require initial configuration, while Google Meet meetings work without additional setup steps. #### Zoom Configuration 1. Sign in to the [Zoom web portal](https://zoom.us/signin). 2. In the navigation menu, navigate to **Settings** → **Meeting** tab. 3. Under **In Meeting (Advanced)**, click the **Automated captions** toggle to enable it. 4. On the verification prompt, click **Enable**. 5. Under **Security**, ensure that the **Only authenticated users can join meetings…** toggle is disabled.  *Automated captions toggle for Zoom meetings*
 *Authentication toggle to allow users to join Zoom meetings* > **Configuration Note:** Zoom administrators can also enable these settings for a group of users or for all users in your account. Visit these Zoom resources for more information: > > - [Enabling automated captions](https://support.zoom.com/hc/en/article?id=zm_kb&sysparm_article=KB0058810) > - [Configuring authentication settings and profiles](https://support.zoom.com/hc/en/article?id=zm_kb&sysparm_article=KB0061263) > - [Allowing only authenticated users in meetings](https://support.zoom.com/hc/en/article?id=zm_kb&sysparm_article=KB0063018) 6. To automatically add the Scribe Agent using incident workflows or the auto launch feature, install the [Zoom | PagerDuty](/integrations/zoom-integration-guide) integration. If you plan to add the Scribe Agent manually using Slack or Microsoft Teams, skip this step. #### Microsoft Teams Configuration 1. To automatically add the Scribe Agent using incident workflows or the auto launch feature, install the [Microsoft Teams | PagerDuty](/integrations/microsoft-teams) integration. If you plan to add the Scribe Agent manually, skip this step. 2. Optional: By default, the Scribe Agent waits in the meeting lobby for manual admission. To allow the Scribe Agent to bypass the lobby and join meetings automatically, configure your Microsoft Teams organization settings. For more information, visit the Microsoft resource on [Using the lobby in Microsoft Teams meetings](https://support.microsoft.com/en-us/office/using-the-lobby-in-microsoft-teams-meetings-eaf70322-d771-4043-b595-b40794bac057). #### Google Meet Configuration 1. To automatically add the Scribe Agent using incident workflows or the auto launch feature, set up a workspace connection to your [Google Workspace](/integrations/google-workspace-integration-guide). If you plan to add the Scribe Agent manually, skip this step. ### Step 2 - PagerDuty Configuration Follow these steps to complete the PagerDuty setup: 1. Connect a Chat Integration: - [Connect PagerDuty AI to Slack](/ai-automation/advance#connect-pagerduty-ai-to-slack), or - [Connect PagerDuty AI to Microsoft Teams](/ai-automation/advance#connect-pagerduty-ai-to-microsoft-teams) 2) **Enable the Scribe Agent**: Navigate to [AI Settings](/ai-automation/advance#2-enable-or-disable-ai-agents) and enable the Scribe Agent. > **EU Data Region:** In the EU data region, the Scribe Agent is **enabled by default**. In the US data region, you must enable it manually using this step. 3) _Optional:_ **Disable auto launch**. When the Scribe Agent is enabled, auto launch is on by default, so the agent is added automatically to every incident meeting. To stop the Scribe Agent from joining every incident meeting automatically: 1. Click **Configure** next to the Scribe Agent. 2. Click the **Automatically launch Scribe Agent** toggle to disable it. 3. Click **Save**. 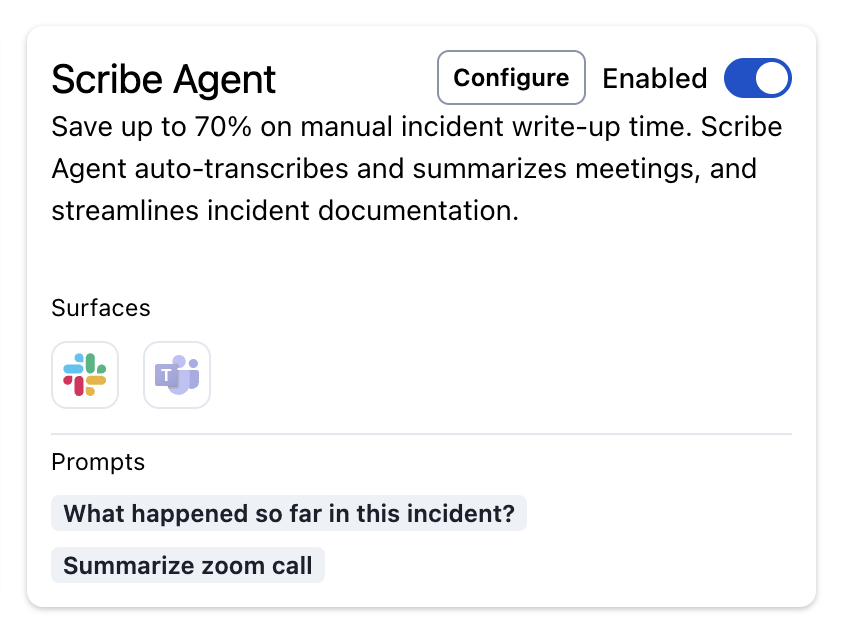 *Scribe Agent card in AI Settings*
 *Automatically launch Scribe Agent with a PagerDuty incident toggle* ## Add the Scribe Agent to a Meeting Once an administrator completes the initial configuration you can add the Scribe Agent to your incident meetings. > **Scribe Agent Limit:** Only one Scribe Agent can join and transcribe each incident meeting. When you remove the Scribe Agent from a meeting, you can add it back to that same meeting if needed. > > You can have up to 10 Scribe Agents simultaneously transcribing across different meetings. ### Add the Scribe Agent Once Scribe Agent is enabled you can add it to your meetings using these methods: - Automatically - [Auto Launch Feature](#using-the-auto-launch-feature) - [Incident Workflows](#using-incident-workflows) - Manually - [Slack or Microsoft Teams](#using-slack-or-microsoft-teams) #### Using the Auto Launch Feature > **Requirements:** To add the Scribe Agent to your incidents using the auto launch feature, you require a valid meeting linked to the incident. > > We also recommend setting up a dedicated incident channel (or service mapping) in your preferred chat surface so your team can see the live transcript and meeting summary. With the **Automatically launch Scribe Agent** toggle enabled: - A participant must join the incident meeting within 15 minutes of setting the incident [conference bridge](/incident-management/incidents/conference-bridge) meeting URL for the Scribe Agent to automatically join. - If no one joins the incident meeting within 15 minutes, the Scribe Agent does not join automatically. You can still add the Scribe Agent to the meeting [using Slack or Microsoft Teams](#using-slack-or-microsoft-teams) or by manually running an incident workflow. #### Using Incident Workflows > **Requirements:** To add the Scribe Agent to your incidents using the auto launch feature, you require a valid meeting linked to the incident. > > We also recommend setting up a dedicated incident channel (or service mapping) in your preferred chat surface so your team can see the live transcript and meeting summary. > > When using incident workflows, including the steps to create the incident conference bridge, dedicated channel, and add Scribe Agent within the same workflow is recommended to ensure you satisfy all requirements. You can add the Scribe Agent to incident meetings via incident workflows, which provide precise control over when the agent is added based on your trigger conditions (for example, incident creation, priority changed to P1, or triggering only for major incidents). Because auto launch is enabled by default, **disable the [Automatically launch Scribe Agent](#step-2---pagerduty-configuration) toggle to avoid redundancy.** For detailed instructions about adding the Scribe Agent via incident workflows, read our [Add PagerDuty AI Scribe Agent](/workflow-actions/pagerduty-advance/add-pagerduty-advance-scribe-agent) workflow action article. When the **Add PagerDuty AI Scribe Agent** workflow action runs: - A participant must join the incident meeting within 15 minutes of setting the incident [conference bridge](/incident-management/incidents/conference-bridge) meeting URL for the Scribe Agent to automatically join. - If no one joins the incident meeting within 15 minutes, the Scribe Agent does not join automatically. You can still add the Scribe Agent to the meeting [using Slack or Microsoft Teams](#using-slack-or-microsoft-teams) or by manually running an incident workflow. #### Using Slack or Microsoft Teams > **Requirements:** To add the Scribe Agent, you must first link your PagerDuty and chat app user accounts. > See our [Slack User Guide](/integrations/slack-integration-guide/slack-user-guide#link-user-accounts) and [Microsoft Teams Integration Guide](/integrations/microsoft-teams#link-pagerduty-and-microsoft-teams-user-accounts) for more information on linking user accounts. 1. In your chat app, navigate to a channel linked to an incident. 2. Complete one of the following actions: - Type the `scribe` command: - Slack: `/pd scribe` - Microsoft Teams: `@PagerDuty advance scribe` - Click **Add Scribe Agent to meeting**. This button appears when the linked incident has a [conference bridge](/incident-management/incidents/conference-bridge) meeting URL. > **Transcript Association:** When you click **Add Scribe Agent to meeting** for a specific incident, all transcripts and meeting summaries from the Scribe Agent link to that incident only. 3. On the **Add Scribe Agent** modal, the incident meeting URL populates automatically. You can modify the URL if needed. 4. Ensure that the meeting URL includes the passcode for the meeting. 5. Click **Add**. ### Next Steps With the Scribe Agent properly configured, the agent is ready to join your incident meetings. #### During the Meeting The Scribe Agent sends live transcripts directly to your channel meeting thread unless a PagerDuty administrator disables this preference or you don't have a channel mapped to the incident. Meeting hosts can change the transcript language through the caption settings of the video conferencing tool. The agent also monitors meeting participation by sending messages when participants join or leave. It maintains an updated participant list on the initial "A meeting transcript has started for \<your incident>" message. > **Enhanced Transcript:** The Scribe Agent uses Enhanced Transcript, which elevates the quality and readability of automated transcripts from incident-related conference bridges. It removes filler words, redundant statements, and profanity, while preserving what was said, decided, and by whom — producing transcripts that are easier to follow and provide higher-quality context for AI-drafted status updates and post-incident review summaries. Enhanced Transcript applies to all supported meeting platforms (Zoom, Microsoft Teams, and Google Meet). #### After the Meeting When the meeting ends or the host [removes the Scribe Agent](#remove-the-scribe-agent-from-a-meeting) from the meeting, the Scribe Agent posts a comprehensive meeting summary to the mapped channel (if one exists). This includes key discussion points, action items, next steps, and a complete list of all participants who attended the meeting. For longer meetings, the summary can take extra time to generate. > **Operational Note:** While transcripts sent during the meeting are audio-only, the final meeting summary captures both audio and chat content. ## Remove the Scribe Agent from a Meeting You can remove the Scribe Agent from a meeting at any time. ### As the Meeting Host **Zoom** 1. In Zoom, hover over the Scribe Agent and click the overflow menu. 2. Click **Remove**. **Microsoft Teams** 1. In Microsoft Teams, click the **People** icon to view the meeting participants. 2. Click the overflow menu next to the Scribe Agent. 3. Click **Remove from meeting**. **Google Meet** 1. In Google Meet, click the **People** icon to view the meeting participants. 2. Click the overflow menu next to the Scribe Agent. 3. Click **Remove from the call**. ### If You Are Not the Meeting Host 1. In your chat app, locate the initial message from the Scribe Agent that reads "A meeting transcript has started for \<your incident>." 2. Click **Remove Scribe Agent**. ## Hide Transcripts in Chat Platform By default, the Scribe Agent sends the meeting conference details to Slack or Microsoft Teams, but you can choose not to receive this data if it does not offer added value. In the AI Agents Console, locate the Scribe Agent configuration and disable the **Send transcripts to chat surface** toggle. 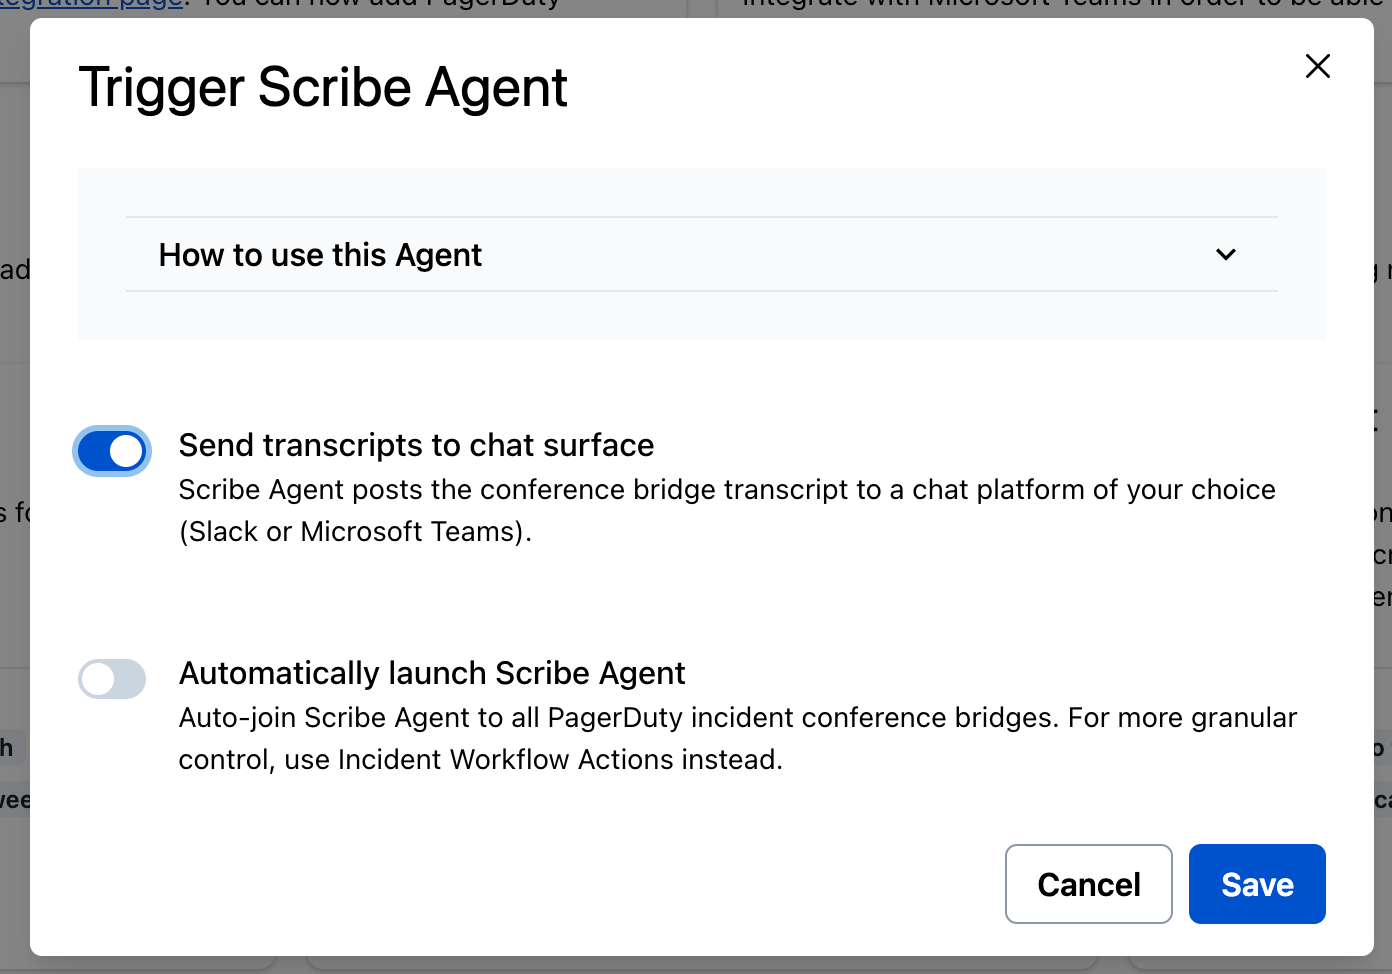 *Send transcripts to chat surface toggle* ## Disable Scribe Agent Disable the Scribe Agent by toggling its switch to the **off** position on the [AI Settings](/ai-automation/advance#2-enable-or-disable-ai-agents) page. ## FAQ **How do I get more compliance, legal, privacy, or security information about the Scribe Agent?** You can read the [PagerDuty Advance AI Disclosure](/ai-automation/advance#pagerduty-advance-ai-disclosure) to learn more about how PagerDuty designed, built, and assessed PagerDuty AI with mission-critical work in mind. **I have added the Scribe Agent to my Zoom meeting. Why is it not able to join the meeting?** The meeting host must configure the [required Zoom settings](#zoom-configuration) before the Scribe Agent can join the host's meetings. **The Scribe Agent has joined my Zoom meeting. Why is it not sending transcripts to my channel?** The meeting host must configure the [required Zoom settings](#zoom-configuration) before the Scribe Agent can start transcribing. If Zoom settings are already configured, check if the Scribe Agent is configured to send transcripts to the chat platform at all and/or if there is a chat surface configured with a channel properly mapped to the incident. **Does the Scribe Agent provide word-for-word verbatim transcripts?** The Scribe Agent uses Enhanced Transcript, which improves transcript quality and readability by removing filler words, redundant statements, and profanity, while preserving what was said, decided, and by whom. Enhanced Transcript is the standard format for all Scribe Agent transcripts, across all supported meeting platforms. **Why does the Scribe Agent show as "Unverified" in my Microsoft Teams meeting?** The Scribe Agent appears as "Unverified" in Microsoft Teams due to Microsoft's February 2024 update, which automatically labels participants based on their relationship to the meeting organizer's organization. Since the Scribe Agent is a bot without an established trust relationship with your organization, Microsoft Teams assigns it the "unverified" label by default. This labeling is purely cosmetic and does not affect the agent's functionality — it still transcribes and summarizes your meeting normally. **Can the Scribe Agent help with status updates and post-incident reviews?** Yes, the Scribe Agent can assist with both: - **Status updates**: The Scribe Agent's meeting transcripts are used as context to generate status updates. - **Post-Incident Reviews**: The Scribe Agent's meeting transcripts provide context for "wrap me up" prompts, and these summaries can be used to create post-incident reviews. **What happens if I do not have PagerDuty AI Actions?** Without available [AI Actions](/ai-automation/advance#how-many-ai-actions-does-each-action-type-cost) or the PagerDuty AI add-on, you cannot use the Scribe Agent. Contact your account administrator or PagerDuty sales to add AI Actions to your account.
--- URL: https://docs.pagerduty.com/ai-automation/advance/shift-agent # Shift Agent Eliminate manual on-call management and ensure seamless coverage Shift Agent brings AI-powered automation to on-call schedule management in PagerDuty. Designed for on-call managers, team leads, and incident responders, it monitors calendars, detects potential conflicts, identifies qualified replacements, and coordinates schedule changes without manual intervention. By automating these traditionally manual tasks, Shift Agent helps ensure reliable operational coverage. By default, Shift Agent activates for all customers who enable [PagerDuty AI](/ai-automation/advance) with the [Slack](/integrations/slack-integration-guide) integration. > **Availability:** This feature is included with PD Reliability Platform plans. It's also available as PagerDuty Advance on Professional, Business, and Enterprise plans. > > [Contact our Sales Team](mailto:sales@pagerduty.com) if you would like to upgrade to a plan featuring PagerDuty AI. > **Required User Permissions:** - [PagerDuty AI](/ai-automation/advance) permissions for configuration are the same across all agents. After the required permissions are accepted, any user can interact with the Shift Agent. > - An Admin or the Account Owner can configure the Google Calendar Extension. ## Configure Shift Agent Shift Agent has two primary functions: - [Intelligent Conflict Detection](#intelligent-conflict-detection) - [Extension for Google Calendar](#extension-for-google-calendar) ### Intelligent Conflict Detection Shift Agent is an AI-powered scheduling assistant that automatically manages on-call coverage conflicts. It monitors responder calendars, detects scheduling conflicts, and coordinates coverage changes without manual intervention. By automating these traditionally time-consuming tasks, Shift Agent eliminates coverage gaps, reduces scheduling stress, and ensures operational readiness. 1. Configure and enable [PagerDuty AI](/ai-automation/advance) in a chat integration (for example, [Slack](/integrations/slack-integration-guide)). 2. Ensure users have appropriate permissions to manage [on-call schedules](/incident-management/schedules/schedule-basics#create-a-schedule) and [integrations](/incident-management/services/services-and-integrations). 3. Shift Agent only detects conflicts on schedules configured on [Level 1 of an escalation policy](/incident-management/schedules/escalation-policies-and-schedules#connect-a-schedule-to-a-service-via-escalation-policy) in order to reduce noise. Ensure any schedule you want included in conflict detection is on Level 1 of an escalation policy. ### Extension for Google Calendar The Google Calendar Extension automatically syncs your calendar events with PagerDuty, allowing Shift Agent to detect out-of-office conflicts before they impact coverage. This integration reduces the need for manual availability updates and helps maintain operational continuity while respecting responders' scheduled commitments. [Learn more](/incident-management/schedules/google-calendar-extension) on setting up your Google Calendar Extension. ## Disable Shift Agent You can disable the Shift Agent by toggling its switch to the **off** position on the [AI Settings](/ai-automation/advance#2-enable-or-disable-ai-agents) page. ## User Guide ### Check Responder Availability In a [PagerDuty AI](/ai-automation/advance) chat, enter a message such as, `I am on vacation June 13. Do I have a conflict?`. Depending on your availability, PagerDuty AI offers contextual suggestions, such as **Create override manually** or **Find coverage**. 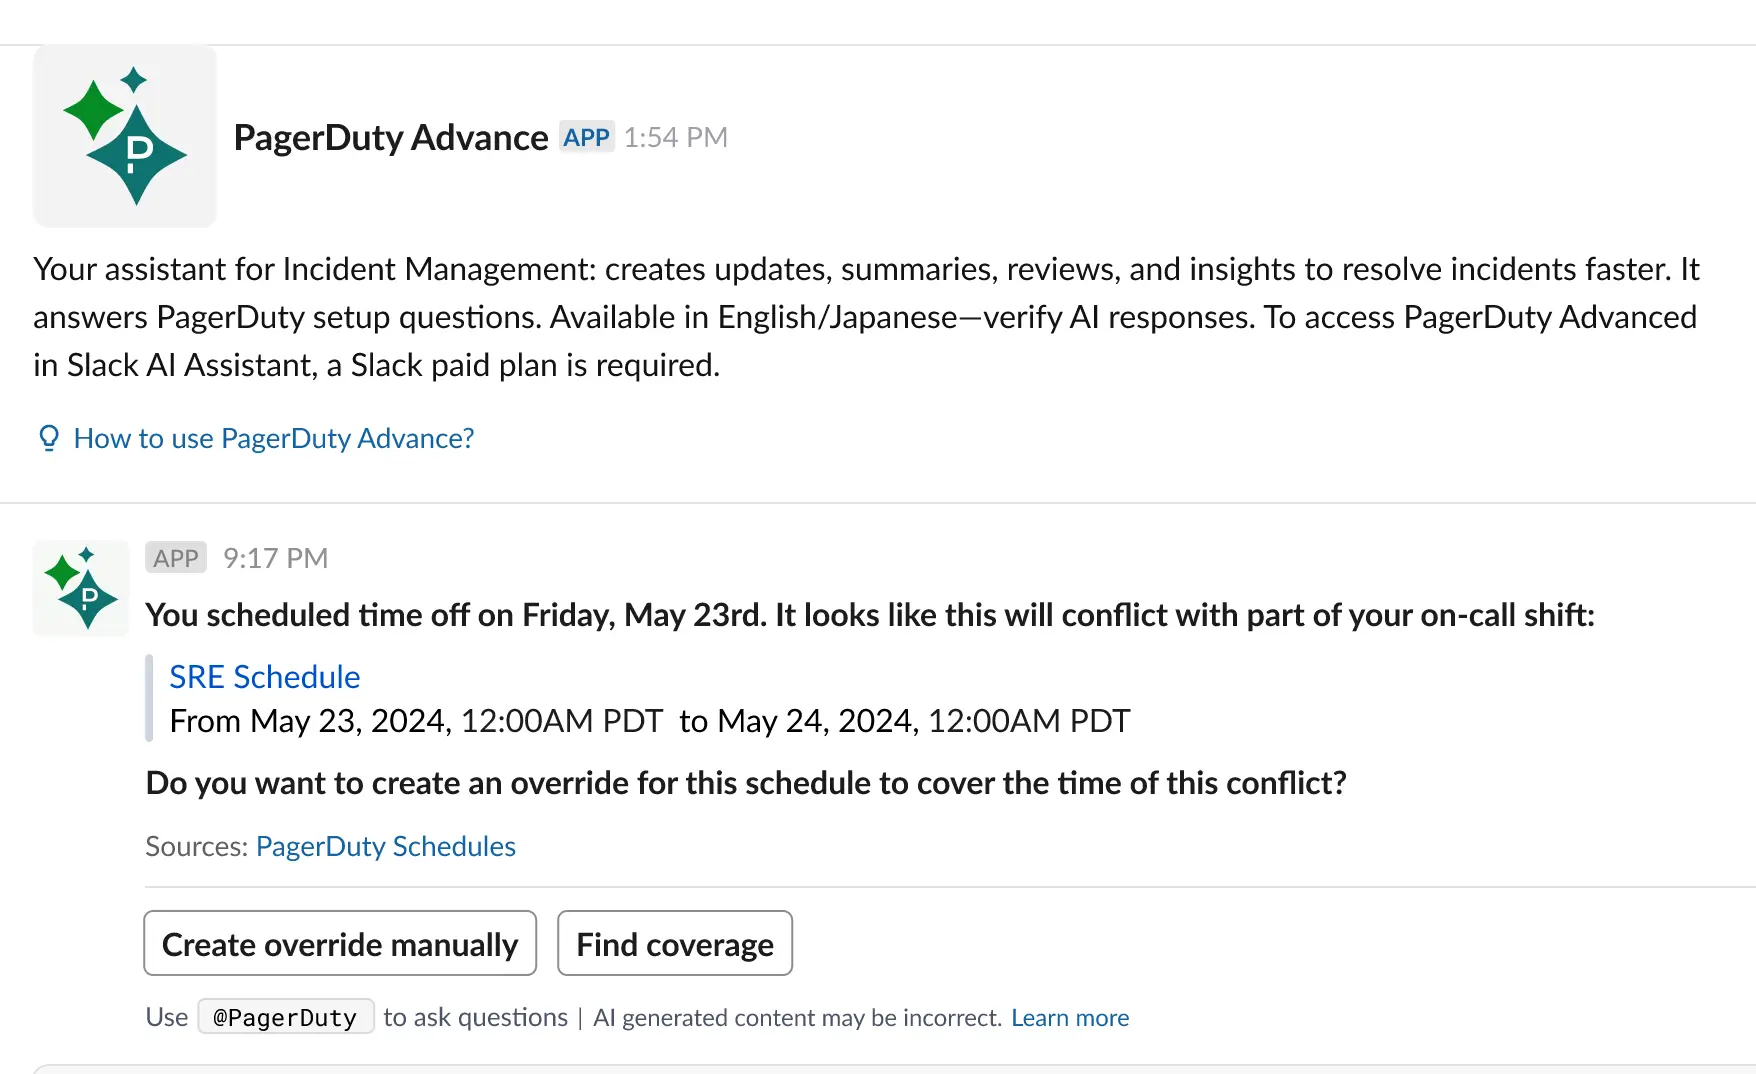 *Check responder availability* ### Request Coverage Shift Agent can automatically find a replacement for an on-call shift. Click **Request coverage** to reach out to suggested candidates. They receive a message based on their [configured notification rules](#configure-notification-rules). 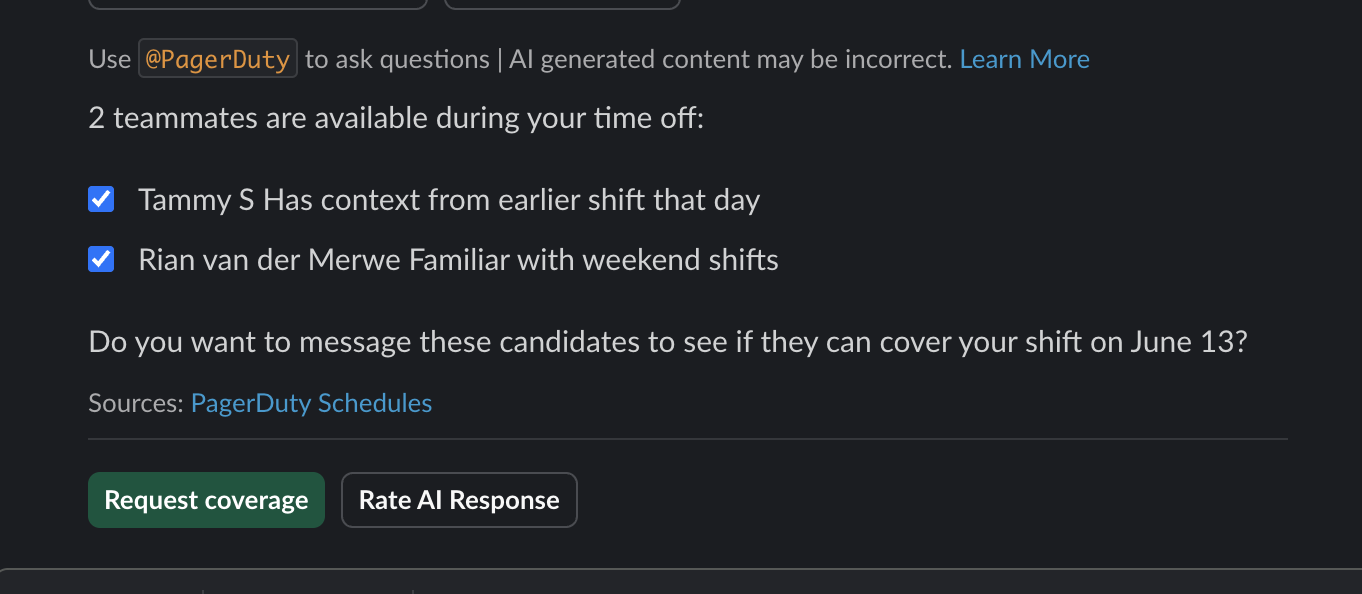 *Request coverage* You receive an update once a candidate accepts the shift. Shift Agent automatically updates on-call schedules and maintains a record of all changes. Shift Agent gives responders 24 hours to respond. This 24-hour period does not include Saturday or Sunday. After the period times out, or after all candidates decline, you will also receive a notification. ### Configure Notification Rules Users can configure their [Notification Rules](/account-admin/user-profile/notification-rules) to customize how Shift Agent contacts them. > **Slack Notifications:** When you link your PagerDuty user account with Slack, PagerDuty attempts to automatically create notification rules for [shift conflicts](#shift-conflicts) and [shift coverage requests](#shift-coverage-requests). If you have connected more than one Slack workspace, PagerDuty uses the most recently-added workspace. > > You can review and customize your [Notification Rules](/account-admin/user-profile/notification-rules) at any time. If you are not receiving notifications as expected, check your [User Profile](/account-admin/user-profile) to make sure the preferred Slack workspace is selected to receive notifications, or add a workspace if none is currently configured. #### Shift Conflicts PagerDuty automatically adds a notification rule to users' profiles when the Google Calendar extension is enabled in the account. To edit this setting: 1. Navigate to **User Icon** → **My Profile** and select the **Notification Rules** tab. 2. Under **When I have an upcoming shift conflict, contact me via**, click to edit _or_ to remove the notification rule. 3. Make the required changes and click **Save**. #### Shift Coverage Requests All PagerDuty AI users have a notification rule for when they receive a shift coverage request. You can edit this notification rule (i.e., change the selected workspace), however you cannot delete it. 1. Navigate to **User Icon** → **My Profile** and select the **Notification Rules** tab. 2. Under **When I am sent a shift coverage request, contact me via**, click . 3. Make the required changes and click **Save**. ## FAQ **How many AI Actions does the Shift Agent use?** Shift Agent is included at no additional cost and does not consume AI Actions. ## Demo Video Watch this demo to see the Shift Agent in action. [https://www.youtube.com/watch?v=zu-MsGM0T94](https://www.youtube.com/watch?v=zu-MsGM0T94) --- URL: https://docs.pagerduty.com/ai-automation/advance/sre-agent # Paige (SRE Agent) A continuously learning agent to help rapidly diagnose, troubleshoot, and remediate issues > **Availability:** To access Paige within the **PD Reliability or Operations Console**, you must have [AIOps](/ai-automation/aiops/overview) and [PagerDuty AI](/ai-automation/advance). To access Paige in **Slack** or the **incident details page**, you must have [PagerDuty AI](/ai-automation/advance). > > PagerDuty AI is included with PD Reliability Platform plans. It's also available through one-time AI Actions or as an add-on with the following pricing plans: > > - Enterprise > - Business > - Professional > > Contact our [Sales Team](https://www.pagerduty.com/contact-us/#contact-sales) to upgrade to a pricing plan that includes this feature. > **PagerDuty Advance Disclosure:** Read our [PagerDuty Advance AI Disclosure](/ai-automation/advance#pagerduty-advance-ai-disclosure) for more information about how PagerDuty designed, built, and assessed PagerDuty AI with mission-critical work in mind. ## Overview When an incident fires, responders often spend the first critical minutes doing the same repetitive work: hunting down the right runbook, pulling logs from multiple tools, piecing together whether this has happened before. Paige, PagerDuty's SRE Agent, works alongside you to handle that toil automatically — ingesting event data, runbooks, and logs to build an understanding of the incident's scope and likely cause, then recommending remediation actions so your team can focus on resolution. Every incident Paige participates in contributes to its memory, so investigations get faster and more accurate over time. ## Key Features - Ingest and analyze your runbooks, SOPs, and diagnostics (for example, error logs) - Generate and save playbooks for recurring issues - Prioritize actions by urgency and impact - Surface likely root causes from available data - Recommend diagnostic and remediation steps - Detect patterns; recall similar incidents and past resolutions - Provide structured troubleshooting for incidents, services, and infrastructure - Organize context into actionable views with interactive nudges and buttons - Summarize conversations and inputs, mark resolved, and save learnings > **PagerDuty AI Actions:** Accounts with PagerDuty AI have an allotment of AI Actions at their disposal. Paige uses four AI Actions whenever you: > > - Submit a request to Paige via Slack or the **Operations Console** (for example, "what are my past incidents," "what is the likely root cause"). > - Click a nudge button (for example, **Update a Runbook**, **Analyze Past Incidents**). > > Refer to [How many AI Actions does each action cost](/ai-automation/advance#how-many-ai-actions-does-each-action-type-cost) for more information. ## Use Paige After [configuring PagerDuty AI](/ai-automation/advance), you can access Paige through either: - [The Operations Console](#in-the-operations-console) or the [PD Reliability Console](/ai-automation/aiops/pd-reliability-console) (Depending on your plan) - [The Incident Details Page](#in-incident-details) - [Slack](#in-slack) - [MS Teams (Currently in Early Access)](#in-ms-teams) > **Paige Virtual Responder:** Currently in Early Access, you can deploy Paige as a virtual responder so it begins investigating the moment an incident triggers. Configure it in one of two ways: > > - [Trigger via Incident Workflow](/ai-automation/advance/add-paige-as-virtual-responder) — deploy Paige as a virtual responder in either Slack or the PagerDuty web app. > - [Trigger via Escalation Policy](/ai-automation/advance/trigger-paige-via-escalation-policy) — add Paige to an escalation level so it investigates in parallel with your on-call responders. ### In the Operations Console 1. In the PagerDuty web app, navigate to **AIOps** → **Operations Console**. - _Optional:_ To add the **Paige** column to the **Operations Console** as a default column for faster incident triage: 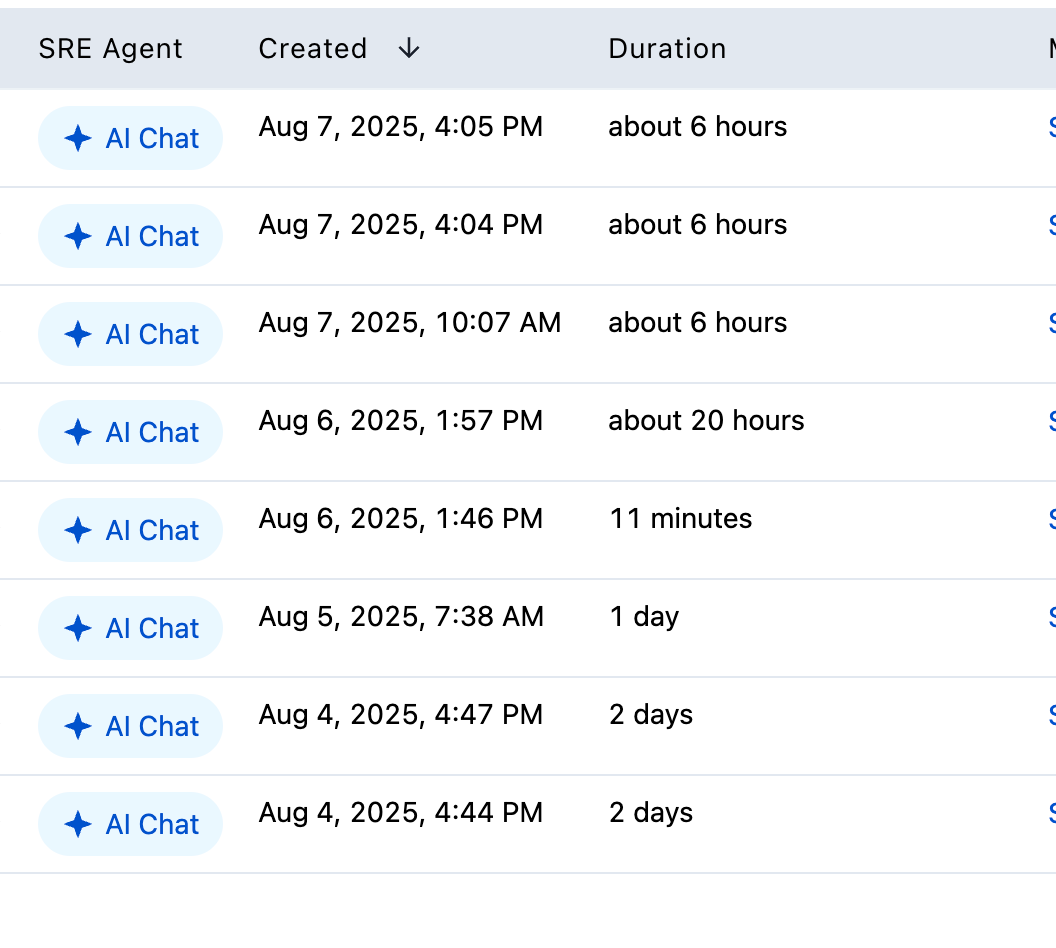 *Paige Column in the Operations Console* 2. Click the incident **Title**. 3. Select the **Paige** tab and wait for the agent to load the incident summary and suggest next steps. 4. Ask questions and provide information to begin troubleshooting the incident with the agent. Refer to [Example Questions](#example-questions) for examples. 5. Click Paige's nudges or buttons to take prescribed actions during the conversation (for example, **Upload a service runbook**). 6. Add an attachment to upload additional files. ### In Incident Details 1. In the PagerDuty web app, navigate to an open incident. 2. On the right side of the incident details page, select the **Paige** tab and wait for the agent to load the incident summary and suggest next steps. 3. Ask questions and provide information to begin troubleshooting the incident with the agent. Refer to [Example Questions](#example-questions) for examples. 4. Click Paige's nudges or buttons to take prescribed actions during the conversation (for example, **Upload a service runbook**). 5. Add an attachment to upload additional files. ### In Slack > **Before You Begin:** You must configure Slack with Paige. Refer to our instructions to [Configure the Slack Integration](/integrations/slack-integration-guide) and [Connect PagerDuty AI to Slack](/ai-automation/advance#connect-pagerduty-ai-to-slack) if you have not already done so. > **Note:** If you do not have PagerDuty AIOps, you can still access certain PagerDuty AIOps information, such as related incidents, past incidents, change events, and outlier incidents, but only within the Slack chat interface. This information is not available outside of the agent chat interface in Slack (for example, in the incident management web app). > **Required Scopes:** Paige requires [additional scopes](/integrations/slack-integration-guide#app-permissions) to work with Slack. A PagerDuty admin may need to [reauthorize the Slack integration](/integrations/slack-integration-guide#approve-app-update) to grant these scopes. 1. Access Paige in one of the following channel types: - Dedicated incident channels - Team-based or service-based Slack channels 2. To start Paige, perform one of the following actions: 1. Click the **Paige Triage** button. 2. Ask questions in the chat using `@pagerduty` followed by a question related to the incident. Refer to [Example Questions](#example-questions) for examples. 3. To upload a file to Paige in Slack: 1. Click the **Upload Runbook** or **Update Runbook** button. 2. Follow the prompts and select the runbook to upload. 3. Click **Submit**. 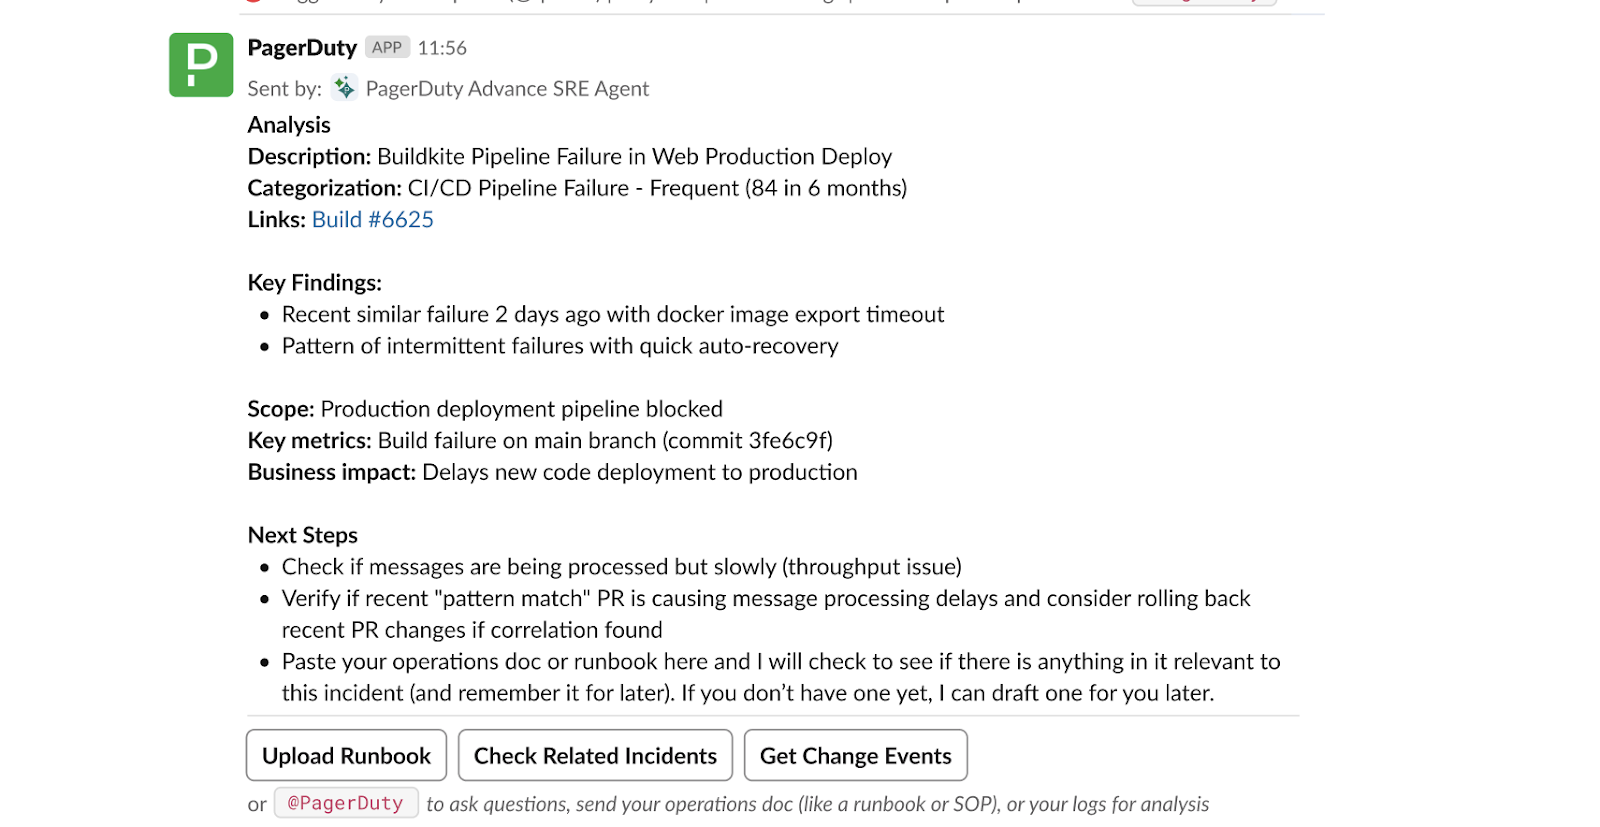 *Slack Interface with Paige* ### In MS Teams > **Before You Begin:** Paige in MS Teams is currently in [Early Access](https://www.pagerduty.com/early-access/). You must configure MS Teams with PagerDuty AI and have Paige enabled. Refer to our instructions on how to [Connect PagerDuty AI to MS Teams](/ai-automation/advance#connect-pagerduty-ai-to-microsoft-teams) if you have not already done so. Once configured, you can interact with Paige by typing `@pagerduty` followed by your question in the chat. Refer to [Example Questions](#example-questions) to get started. ## Integrations Paige can retrieve log data from observability platforms such as Grafana, Datadog, New Relic, and AWS CloudWatch, and runbooks from sources such as Confluence and GitHub. By analyzing these logs and runbooks, Paige guides responders through investigation, triage, and resolution. When setting up one of these [workflow integrations](/ai-automation/automation/incident-workflows/workflow-integrations), select **Allow Paige access** to use this connection.  *Allow Paige Access* > **Setting Up an Integration:** For more information on setting up Paige integrations, view [Paige: Connectors and Skills](/ai-automation/advance/connectors-tools-and-skills). ## Supported Actions Paige uses nudges to recommend supported actions such as: - **Upload Runbook**: For first-time setup on a service. - **Update Runbook**: When a runbook already exists. - **Analyze Past Incidents**: Review history and patterns. - **Analyze Related Incidents**: Identify correlations and impact. - **Generate a Playbook**: Create repeatable response steps. - **Check Change Events**: Verify recent changes for possible cause. - **Search Logs**: Check logs based on tooling setup. - **Update Memory**: After incident resolution, save new information to Paige's memory. ## Incident Notes Paige analyzes new notes posted during active incidents, where you can see them in: - **Slack**: Posts analysis of new incident notes. - **Operations Console**: Posts each new note in chat with interpretation. You can disable proactive note messages on the **AI Settings** page. You can ask questions in the chat about recent notes. ### Example Questions The following questions are representative of the types of questions Paige can answer. Paige leverages large language models where questions do not have to be provided in the exact text format shown below. | Example Question to Paige | Description | | :------------------------------------------------------------------------------------ | :------------------------------------------------------------------------------------------------------------------------------ | | Can you analyze past incidents to see how this was resolved before? | Ability to see what similar incidents occurred previously for that service. | | Can you provide a list of related incidents? | Ability to see what active incidents might be related on services that are not your service. | | How do I check \[insert service, infrastructure information] for this specific error? | Ability to ask questions related to the type of incident you are troubleshooting. | | What information should I gather for this incident to help troubleshoot? | Ability to understand what type of information is needed to troubleshoot the incident. | | Should I do step X or step Y first to troubleshoot this incident? | From the list of suggested next steps, the agent recommends which step to take first, with additional context on its reasoning. | | How urgent is this incident based on the data? | Ability to understand incident urgency. | | What steps should I take to troubleshoot this issue? | Suggested remediation steps. | | Can you generate a playbook for resolving this error? | Paige develops a playbook based on its understanding of the incident. | | How do I check the logs for this specific error? | Instructions for checking logs, which may include a sample query. | | How can I prevent this error from recurring? | Suggestions on how to improve the incident for the future, such as service or infrastructure improvements. | | Is there a pattern to when these errors occur? | Analysis of incident patterns. | | What is the impact of this error on our systems? | Potential impact on other related services or infrastructure based on the incident context. | | What are some likely root causes for this incident? | Suggested root-cause for the incident. | ## Paige's Capabilities Here is a look at the specific capabilities Paige uses to investigate and manage incidents: - `get_incident_details` - Look up incidents by ID or number (includes recent notes, changes, status updates). - `list_incidents` - Query incidents by service, team, user, or filters. - `add_incident_note` - Add a note to the current incident. - `get_service_details` - Retrieve service info by ID or name. - `get_related_services` - Get upstream and downstream service dependencies. ## Paige Memory Definitions Paige maintains several types of memory to provide increasingly relevant and personalized assistance over time. All of Paige's memory artifacts are scoped to a given PagerDuty service. Understanding these memory types in the following sections helps you leverage the full capabilities of the agent. ### Memory API To update or redact information, see the [Paige Memory API documentation](/developer/api/reference/rest/sre-agent/update-sre-memory). The Paige Memory API provides visibility and control over the memory artifacts maintained by Paige for each PagerDuty service. Paige uses multiple types of memory to deliver increasingly personalized and context-aware assistance over time, helping teams resolve incidents faster and with greater accuracy. With the Memory API, you can: - View all of Paige's memory artifacts associated with a given service or incident. - Update or redact sensitive or outdated information to improve the accuracy and compliance of Paige's insights. - Leverage the API to make edits or redactions at human speed, not machine speed, ensuring timely, manual oversight where needed. - Enhance transparency into how Paige builds memories from operational data to deliver more relevant recommendations. ### SRE Incident Playbook ("Scratchpad") - Continuously learns from your organization's historical incident data. - Automatically generates prioritized resolution steps tailored to your environment by analyzing patterns from past incidents. - Provides AI-powered baseline recommendations, even for novel incidents. - Delivers context-aware troubleshooting guidance that improves with each resolved incident. ### Customer Service Runbook - Stores and references your runbooks, SOPs, and documentation (for example, Confluence or GitHub pages). - Remembers manually provided documentation for future conversations. - Recommends steps that align with your organization's established procedures and standards. ### Incident Summarization - Automatically creates comprehensive summaries when incidents are marked complete. - Captures key learnings, resolution details, and troubleshooting paths without manual documentation effort. - Builds an ever-growing repository of institutional knowledge that benefits future incident response. ### Service Profile - Metadata Paige has observed about a given service via customer runbook, event payload data, and user interactions. - Examples include cloud providers, region, service type, and relevant log search queries for a given service. ## Recommended Workflows Paige helps streamline incident response by analyzing configured incident workflows and recommending the most relevant options based on the real-time context of each incident. [Click here](/ai-automation/advance/paige-recommended-workflows) for more information on recommended workflows. ## Best Practices Use these quick tips to get the most from Paige — share context fast, collaborate in triage, and improve outcomes over time. ### Provide Relevant Documentation and Context Upload any runbooks, SOPs, or knowledge base articles related to the affected service or architecture so everyone has the right context. ### Resolve Incidents Paige recalls key information observed during an incident including event payload information, key user interactions, log search queries, and other data that is useful for future similar incidents. Incidents _must be resolved_ to prompt Paige to save information into memory. If you interact with Paige post incident resolution, click the **Update Memory** button to prompt Paige to save additional information for future incidents. ### Interact with Paige Treat Paige like a triage partner and ask questions when you encounter difficulties. Share any critical findings or remediation steps you have taken during the incident so Paige stays informed and learns over time. ### Provide Performance Feedback Report whether each suggested troubleshooting step was a success or a failure. If a step fails, inform Paige so it can suggest alternative actions and keep the triage moving forward. ### Generate Incident Playbooks At the end of each incident, request a summary playbook. Review it for accuracy and completeness, then copy the approved version to your knowledge base for future use. ### Add Runbooks Structure runbooks one per service with SOPs based on incident types or scenarios. Optionally include log queries to help Paige build better searches. ### Know Product Limits Paige analyzes `custom_details` and notes, but only up to the first 2,000 characters of each. Content beyond that limit is not included. ### Rate AI Responses Click the **Rate AI Response** button next to each suggestion or recommendation in the conversation. Provide feedback to help improve the product and future recommendations. Your input helps the system learn and deliver better assistance over time.  *Rate AI Response Button* ## FAQ **What incident data can Paige analyze?** Paige analyzes: - Event and alert payload information - Historical and related incidents - Change events - User-provided data (runbooks, logs, documentation) **Current limitations**: Paige has limited access to incident timeline details, incident workflows, and alert grouping data. These features will be added in future releases to enhance Paige's capabilities. **What happens if a recommendation or incident summary is not correct?** Interact with the agent and state that the suggestion provided was not helpful, why it was not helpful, and ask for an alternative recommendation. You should also rate the response for the recommendation, which is analyzed to improve future recommendations. **What file types and limits exist for file upload?** - PagerDuty currently supports `.txt`, `.pdf`, and `.md` files. - PagerDuty currently supports `.jpg` and `.png` for image analysis. - One conversation can contain up to a total of 25 files, with each file being 100 Kb maximum. **What ways can Paige fetch links?** Paige automatically fetches runbook URLs from the event payload. You can also ask it to: - Fetch specific runbook links from Knowledge Base tools (including embedded links within pages) - Conduct log searches via nudge (button) or chat command **How does Paige save time?** Paige transforms incident response by replacing manual, time-consuming investigation steps with automated, intelligent actions. Here is a comparison of your workflow before and after using Paige: | Manual Workflow (Before) | Paige Workflow (After) | | :----------------------------------------------------------------------------------------------------------------------------------- | :------------------------------------------------------------------------------------------------------------------------------------------------------------------------------------------------------------- | | **Hunting for Documentation**: You search across multiple systems for the correct SOPs and runbooks. | **Runbook Integration**: The agent ingests your existing SOPs, integrates with tools that link to runbooks, and automatically generates new runbooks. | | **Manual Log Retrieval**: You log into multiple third-party tools to manually search, view, and retrieve error logs and diagnostics. | **Automated Analysis**: The agent integrates with third-party tools to automatically retrieve, ingest, and analyze diagnostics and error logs. | | **Guessing Next Steps**: You manually prioritize tasks and determine the necessary troubleshooting steps. | **Guided Remediation**: The agent prioritizes actions by urgency and impact, recommends diagnostic and remediation steps, and provides structured troubleshooting for incidents, services, and infrastructure. | | **Fragmented Context**: You spend critical minutes piecing together context and searching for the root cause. | **Instant Context**: The agent surfaces likely root causes from available data and organizes context into actionable views with interactive buttons and nudges. | | **Relying on Human Memory**: You try to remember if a similar incident happened in the past and how your team resolved it. | **Pattern Detection**: The agent detects patterns and automatically recalls similar past incidents and their resolutions. | | **Manual Wrap-Up**: You spend time writing summaries, documenting recurring issues, and manually resolving the incident. | **Automated Wrap-Up**: The agent summarizes conversations and inputs, marks the incident resolved, saves learnings, and generates and saves playbooks for recurring issues. | --- URL: https://docs.pagerduty.com/ai-automation/advance/trigger-paige-via-escalation-policy # Trigger Paige via Escalation Policy Add Paige to an escalation level so it investigates in parallel with your on-call responders > **Early Access:** This feature is currently in [Early Access](https://www.pagerduty.com/early-access/) and subject to change. Add Paige, PagerDuty's SRE Agent, to an escalation level to put it on call as a virtual responder, in parallel with your human responders — not in place of them. The moment an incident triggers, Paige begins investigating alongside whoever is paged next in your escalation chain. It reviews the incident payload, checks how similar incidents were resolved in the past, and queries your connected integrations for relevant logs and runbooks. By the time a human responder opens the incident, Paige has already gathered context, investigated likely causes, and — where available — recommended a workflow with its reasoning attached. The human is never blocked waiting on Paige, and Paige never blocks waiting on a human; both start working the moment the incident fires. ## Prerequisites - Paige is enabled for your PagerDuty account. - You have a Manager or Admin role, which is required to edit escalation policies. ## Add Paige to an Escalation Policy 1. Navigate to the escalation policy you want to configure and open it. 2. Select the escalation level where you want Paige to engage. Paige triggers immediately after the incident is created, in parallel with that level's on-call responder. 3. Turn on **Trigger Paige for incidents in this escalation policy**. 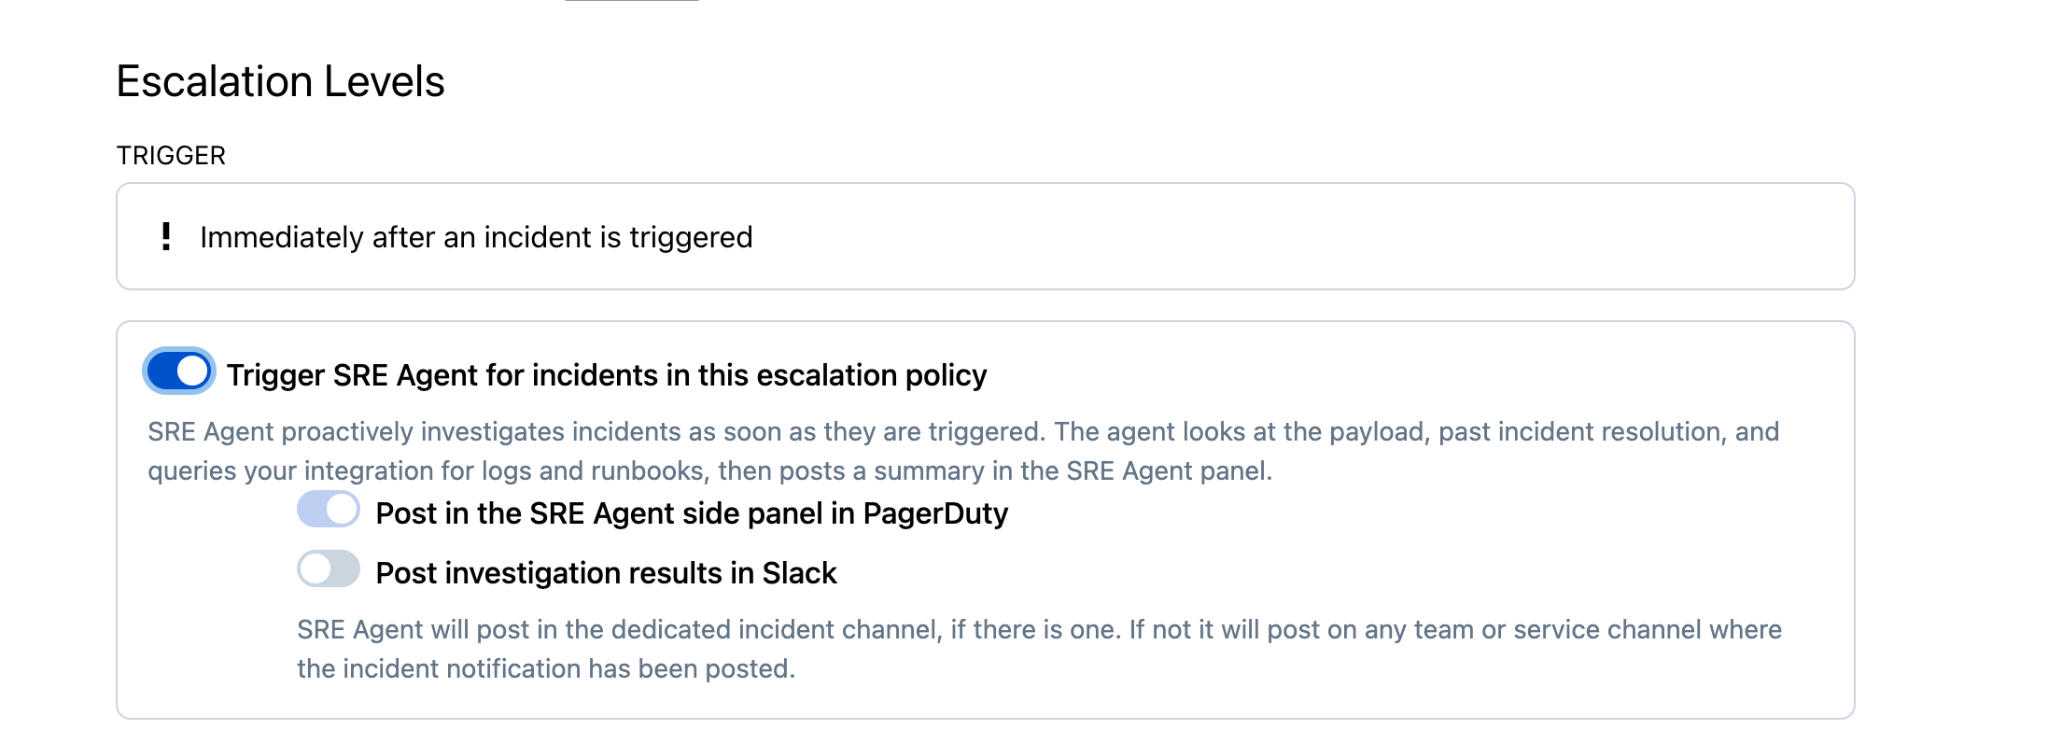 *Trigger Paige toggle* 4. Choose where Paige posts its findings. You can enable one or both destinations: - **Post in the Paige side panel in PagerDuty** — investigation results appear in the Paige panel on the incident. - **Post investigation results in Slack** — results post to the incident's dedicated Slack channel if one exists, or to the relevant team or service channel where the incident notification was posted. 5. Click **Save**. Once saved, every incident that reaches this escalation level triggers Paige automatically, with no manual assignment needed per incident. > **Good to Know:** - Paige does not replace a step in the escalation chain or delay paging; it runs concurrently with the humans in the policy. --- URL: https://docs.pagerduty.com/ai-automation/advance/user-guide # PagerDuty AI User Guide Use PagerDuty AI's features after configuration Once you have [configured PagerDuty AI](/ai-automation/advance), you can use the following features: > **Also known as PagerDuty Advance:** This capability is part of the PD Reliability Platform plan. If your organization is not on the PD Reliability Platform plan, you'll see it labeled PagerDuty Advance in your product and account. - [PagerDuty AI Assistant](#pagerduty-ai-assistant) - [PagerDuty AI for Post-Incident Reviews](#pagerduty-ai-for-post-incident-reviews) - [PagerDuty AI Slack Side Panel](#direct-messages-using-the-pagerduty-ai-slack-side-panel) - [PagerDuty AI Agents](#pagerduty-ai-agents) - [PagerDuty AI Integration for Amazon Q](#pagerduty-ai-integration-for-amazon-q) - [PagerDuty AI for Status Updates](#pagerduty-ai-for-status-updates) - [Periodic Incident Progress](#periodic-incident-progress-pip) - [PagerDuty AI for Automation Digest](#pagerduty-ai-for-automation-digest) - [PagerDuty AI Analytics](#pagerduty-ai-analytics) ## PagerDuty AI Assistant > **Availability:** PagerDuty AI Assistant is available in US and EU [service regions](/get-started/service-regions). > **Required User Permissions:** You can interact with the PagerDuty AI Assistant in Slack. 1. Navigate to the channel that is linked to the incident for questions directly related to a PagerDuty incident. For non-incident questions, navigate to any channel. 2. Mention the PagerDuty bot and enter your question to interact with the PagerDuty AI Assistant within the channel. 1. **In a Slack channel**: `@PagerDuty` <your question> 2. **In a Microsoft Teams channel**: `@PagerDuty advance` <your question> ### Prompt Examples | Category | Prompt Examples | | :------------------------- | :----------------------------------------------------------------------------------------------------------------------------------------------------------------------------------------------------------------------------------------------------------------------------------------------------------------------------------------------------------------------------------------------------------------------------------------- | | **Incident Insight** | “Where are the alerts coming from?”
“What changed in the last 24h?”
“What is the probable cause?”
“Are any of the changes likely to be the cause of the incident?”
“Has this incident happened before?”
“What are the related services and their status?”
“Are there any open incidents for \{service name\}?”
“Who is on call? / Who is on call for \{service name\}?”
“What is the customer impact?” | | **Incident Summarization** | “What happened?”
“Catch me up on this incident”
“Generate a post-incident review” | | **Status Updates** | “Write me a status update message” | | **Planned Work** | “How do I set up \{PagerDuty feature\}?”
“What are the best practices for \{PagerDuty feature\}?”
“Why can I not add notes to a PagerDuty incident?”
“What questions can I ask PagerDuty AI?"
“What data is used to generate a status report?”
“Why are my Android notifications not showing up?”
“How can I set up an integration with Jira?” | To meet these requirements, the bot requires the ability to join the channel, send messages, and send URLs within the channel. ### PagerDuty AI for Post-Incident Reviews > **Availability:** - This feature is included with PD Reliability Platform plans. It's also generally available to Professional, Business, and Enterprise Incident Management accounts using PagerDuty AI (one-time AI Actions, trial, or add-on). > - This feature is only available in the US [service region](/get-started/service-regions). > **Requirements:** - If you have the role of Observer, Limited User, User, Admin, or Account Owner (or their respective [advanced permission base roles](/account-admin/advanced-permissions)), you can generate post-incident reviews. > - You must have a [dedicated incident channel](/integrations/slack-integration-guide/slack-user-guide#dedicated-incident-channel) or have at least one [Slack channel connection](/integrations/slack-integration-guide#configure-the-slack-integration) to a PagerDuty service. 1. Mention `@PagerDuty` and ask it, “what happened” once you resolve an incident in Slack or Microsoft Teams. 2. PagerDuty AI reviews the entire chat history and presents you with an executive summary, including what happened, actions, decisions, and the incident resolution. 3. Click **Create a Post-Incident Review** to import the PagerDuty AI summary into PagerDuty as a new post-incident review. You can edit the post-incident review within Jeli. 4. Jeli displays an indicator to show that the post-incident review is AI-generated. ### Direct Messages using the PagerDuty AI Slack Side Panel PagerDuty AI in the Slack side panel automatically understands which channel you are currently viewing and can access relevant information about any associated incidents. When you use the split view to examine an incident, the PagerDuty AI Assistant intelligently references that specific incident in its responses to your questions, ensuring more accurate and relevant assistance. This contextual understanding allows the PagerDuty AI Assistant to provide more targeted and helpful responses without requiring you to provide additional background information. To begin a conversation with the PagerDuty AI Assistant in the Slack side panel: 1. Click the **PagerDuty AI Slack side panel** logo on the top right corner of your Slack workspace. 2. Enter your question or request. ## PagerDuty AI Agents PagerDuty AI agents are purpose-built to help operations teams drive productivity and efficiency through every stage of the operations lifecycle. Visit these resources to learn about each agent's capabilities: - [Insights Agent](/ai-automation/advance/insights-agent) - [Shift Agent](/ai-automation/advance/shift-agent) - [Scribe Agent](/ai-automation/advance/scribe-agent) - [Paige (SRE Agent)](/ai-automation/advance/sre-agent) ## PagerDuty AI Integration for Amazon Q > **Requirements:** To begin using the integration, you must first link your PagerDuty and chat app user accounts. See our [Slack User Guide](/integrations/slack-integration-guide/slack-user-guide#link-user-accounts) or [Microsoft Teams Integration Guide](/integrations/microsoft-teams#link-pagerduty-and-microsoft-teams-user-accounts) for more information on linking user accounts. > **View Integration Summary:** From the PagerDuty AI incident context card, click the **Use Amazon Q** button to view a summary of the integration and its usage instructions. 1. You can use Amazon Q by typing the `amazonq` command and entering your question. 1. **In a Slack channel**: `/pd amazonq` <your question> 2. **In a Microsoft Teams channel**: `@PagerDuty amazonq` <your question> 2. If you have not authenticated with Amazon Q or your AWS session has expired, you receive a message prompting you to log into your company Identity Provider for AWS (for example, AWS IAM Identity Center, Okta, Entra, or Auth0). 1. Click **Link Accounts** to log into your Identity Provider. **Note**: If you are unable to log in, reach out to your AWS account administrator and ensure your AWS user account can access the Amazon Q Business app and the PagerDuty AI data accessor. 2. Once authenticated, type the `amazonq` command and re-enter your question for Amazon Q. 3. You can ask questions such as: - What is our rollback process? - Who can I talk to about feature X? - Why do we use encryption for feature Y? - What kinds of questions can you answer? 4. PagerDuty AI searches your connected Amazon Q Business data sources to find and show you relevant information. It presents key information, including a link to the source documents. PagerDuty AI only reads data – it does not modify any source content or run any actions, even if PagerDuty AI is integrated with Amazon Q Business as a plugin. **Note**: Information availability and recency vary based on the Amazon Q Business configuration in your AWS account. ## PagerDuty AI for Status Updates > **Availability:** PagerDuty AI for internal status updates is available in US and EU [service regions](/get-started/service-regions). PagerDuty AI for the external status page is not available at this time. > **Required User Permissions:** - If you are not a Limited Stakeholder or Full Stakeholder, you can generate status updates for incidents assigned to you. > - Only Responders, Managers, Global Admins, and Account Owners can generate status updates for incidents that are not assigned to them. > **Slack and Microsoft Teams Sources:** Status updates generate from the following chat app sources: > > **Slack** > > 1. The incident-associated channel, when present. > 2. The service-associated channel. > > **Microsoft Teams** > > 1. The incident-associated chat or meeting, when present. > 2. The service-associated channel. ### In PagerDuty 1. In the web app, click the **title** of your preferred incident, navigate to the **Status Updates** tab, and click **New Update**. 2. Click **Generate** to the right of the **Message** field. A status update automatically generates. You can make edits to the draft according to your preferences. 3. Click **Send Update**. ### In Slack and Microsoft Teams 1. On the incident card, click **New Status Update**. 2. Select the tone that you want to use when generating the status update. 3. Review and edit the status update. 4. Click **Send Update**. Alternatively, you can chat directly with the PagerDuty app and give it a prompt, such as “write a status update”. After the draft generates, you can choose **Send Status Update** to send the update, **Review Status Update** to make additional changes, or change the tone. ## Periodic Incident Progress (PIP) > **Required Permissions:** Account Owners and Global Admins can create and edit all incident workflows. You can create and edit workflows and triggers for services where they have Manager access. ### Overview The **PagerDuty AI - Periodic Incident Progress incident workflow action** automatically posts progress updates in Slack or Microsoft Teams on active incidents, keeping responders and stakeholders informed of what changed since the last update. By default, updates are sent every 15 minutes, but you can adjust the cadence to fit your team needs. It is designed for teams that want regular, low-toil status pings without manual check-ins. Each update shows only what changed since the last check—such as priority, assignee, responders, notes, or severity—rather than repeating the full incident state. Updates post to your configured Slack or Microsoft Teams dedicated incident channels. If no changes occur during an interval, the update may be skipped depending on your settings. > **Meeting Summaries:** Periodic Incident Progress posts metadata changes (status, priority, assignments, responders, severity, notes) at your configured cadence. When the [Scribe Agent](/ai-automation/advance/scribe-agent) is enabled, Periodic Incident Progress also includes AI-based meeting summaries generated by the agent in its periodic updates. > > When [Thread updates in Dedicated Channels](/integrations/slack-integration-guide/slack-user-guide#threaded-updates) is enabled in Slack, progress updates post as a thread under a pinned card. This card is then automatically updated with the latest summary. > **Important:** Periodic Incident Progress updates are only posted to **dedicated incident channels** created for specific incidents. ### Use cases - **Automated status updates**: Keep incident channels in Slack or Microsoft Teams up to date without manual typing. - **Change tracking**: Provide clear details of what changed (assignee, priority, notes, responders, severity, and other fields) since the last update. - **Cross-team visibility**: Improve cross-team awareness during longer-running incidents. ### Configuration See [Add Periodic Incident Progress workflow instructions](/workflow-actions/pagerduty-advance/add-periodic-incident-progress). ## PagerDuty AI for Automation Digest See our [Automation Actions](/ai-automation/automation/automation-actions#pagerduty-ai-for-automation-digest) article for more information on generating an automation digest. ## PagerDuty AI Analytics See our [PagerDuty AI Analytics](/incident-management/analytics/advance-analytics) article for more information on viewing PagerDuty AI Analytics data. --- URL: https://docs.pagerduty.com/ai-automation/aiops # PagerDuty AIOps Minimize noise, accelerate resolution and automate event processing PagerDuty AIOps helps teams reduce alert noise, improve incident visibility, and triage more efficiently, eliminating manual, repetitive tasks from the incident response process. With quick implementation and no ongoing maintenance, teams experience fewer incidents and resolve issues faster. > **Purchase PagerDuty AIOps:** - PagerDuty AIOps launched in April 2023 and is the [current evolution](#difference-between-legacy-event-intelligence-and-aiops) of PagerDuty's Legacy Event Intelligence add-on. > - To migrate from Event Intelligence to PagerDuty AIOps, or to purchase the add-on for the first time, read [Purchase PagerDuty AIOps](#purchase-pagerduty-aiops). ## Feature Sets PagerDuty AIOps can be broken down into the following feature sets: - [Noise Reduction](#noise-reduction) - [Triage and RCA](#triage-and-rca) - [Event Orchestration and Automation](#event-orchestration-and-automation) - [Operations Console](#operations-console) - [Increased Event Ingestion](#increased-event-ingestion) ### Noise Reduction Reduce incident noise with the click of a button. Use built-in machine learning (ML) models that learn and adapt based on user behavior, or create your own logic. You can even group alerts across services using [Global Alert Grouping](/ai-automation/aiops/noise-reduction/alert-grouping/global-alert-grouping). 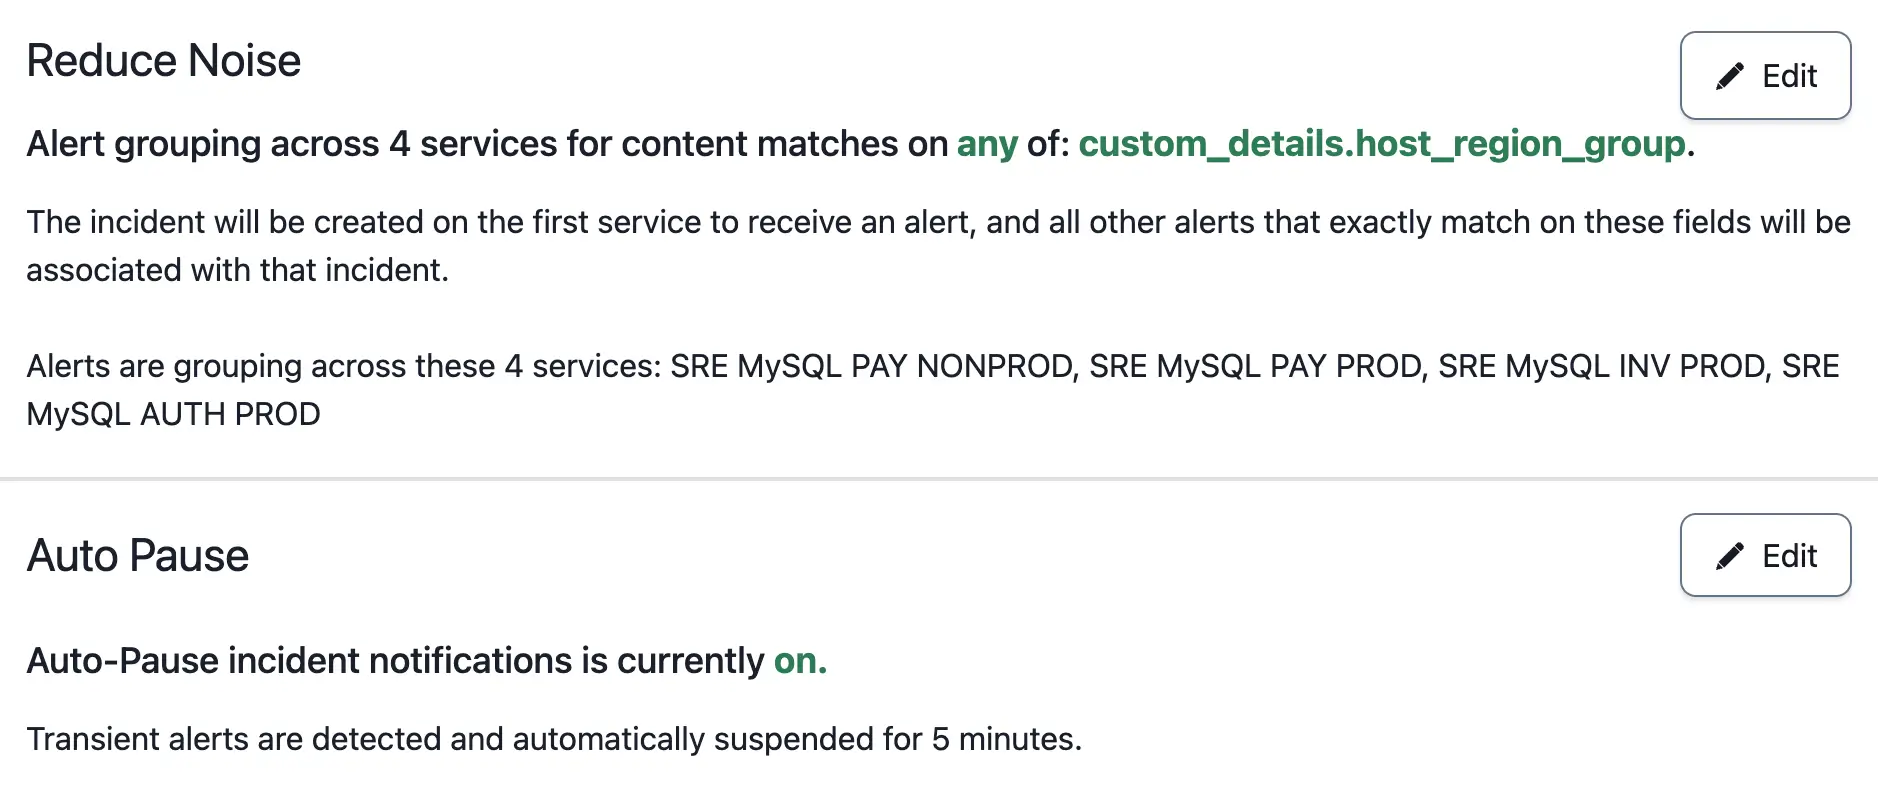 *Noise Reduction Settings on a PagerDuty Service* **Read more about Noise Reduction features**: - [Global Alert Grouping](/ai-automation/aiops/noise-reduction/alert-grouping/global-alert-grouping) - [Intelligent Alert Grouping](/ai-automation/aiops/noise-reduction/alert-grouping/intelligent-alert-grouping) - [Preview Intelligent Alert Grouping](/ai-automation/aiops/noise-reduction/alert-grouping/preview-intelligent-alert-grouping) - [Content-Based Alert Grouping](/ai-automation/aiops/noise-reduction/alert-grouping/content-based-alert-grouping) - [Unified Alert Grouping](/ai-automation/aiops/noise-reduction/alert-grouping/unified-alert-grouping) - [Time-Based Alert Grouping](/ai-automation/aiops/noise-reduction/alert-grouping/time-based-alert-grouping) - [Auto-Pause Incident Notifications](/ai-automation/aiops/noise-reduction/auto-pause-incident-notifications) - [Event Orchestration: Alert Suppression](/ai-automation/aiops/event-orchestration#incident-data) ### Triage and RCA Responders can leverage machine learning to immediately surface critical incident information. When an incident occurs, you can quickly discover the probable origin of the incident, whether the incident has previously occurred, and whether a change was the likely cause. 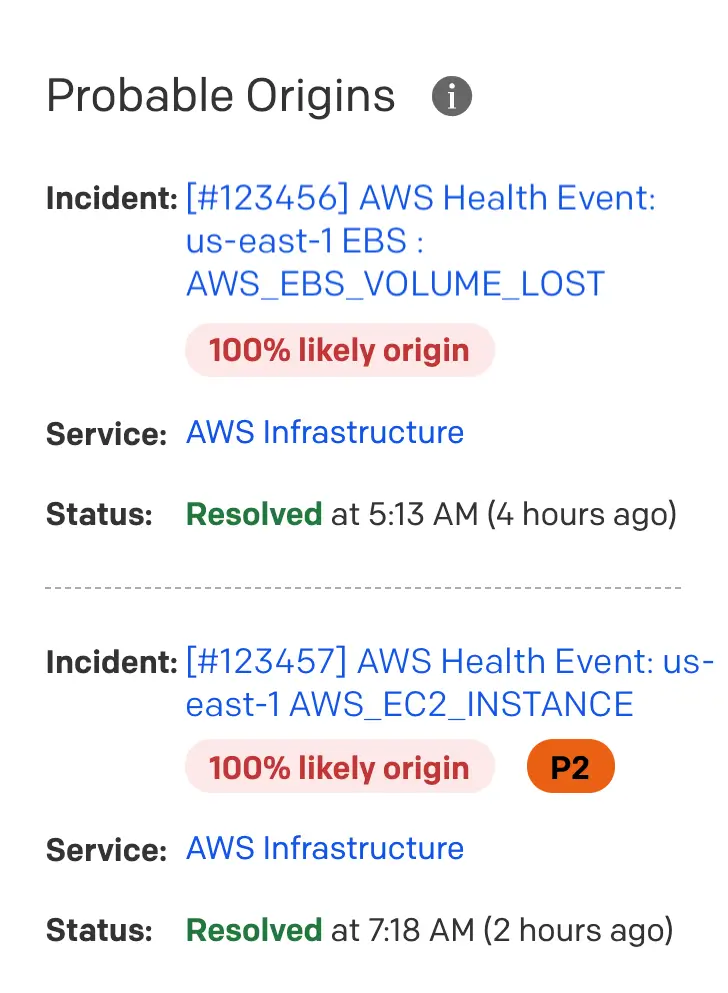 *Probable Origin Feature on a PagerDuty Incident* **Read more about Triage and RCA features**: - [Past Incidents](/ai-automation/aiops/past-incidents) - [Related Incidents](/ai-automation/aiops/related-incidents) - [Outlier Incident](/ai-automation/aiops/outlier-incident) - [Probable Origin](/ai-automation/aiops/probable-origin) - [Recent Changes](/ai-automation/aiops/recent-changes) ### Event Orchestration and Automation Event Orchestration provides state-of-the-art automation capabilities that are a force-multiplier across the entire technical ecosystem. Teams can enrich events and create complex logic within a service, or across services. This end-to-end event-driven automation ensures faster resolution and requires less input from humans who are needed for value-add work. 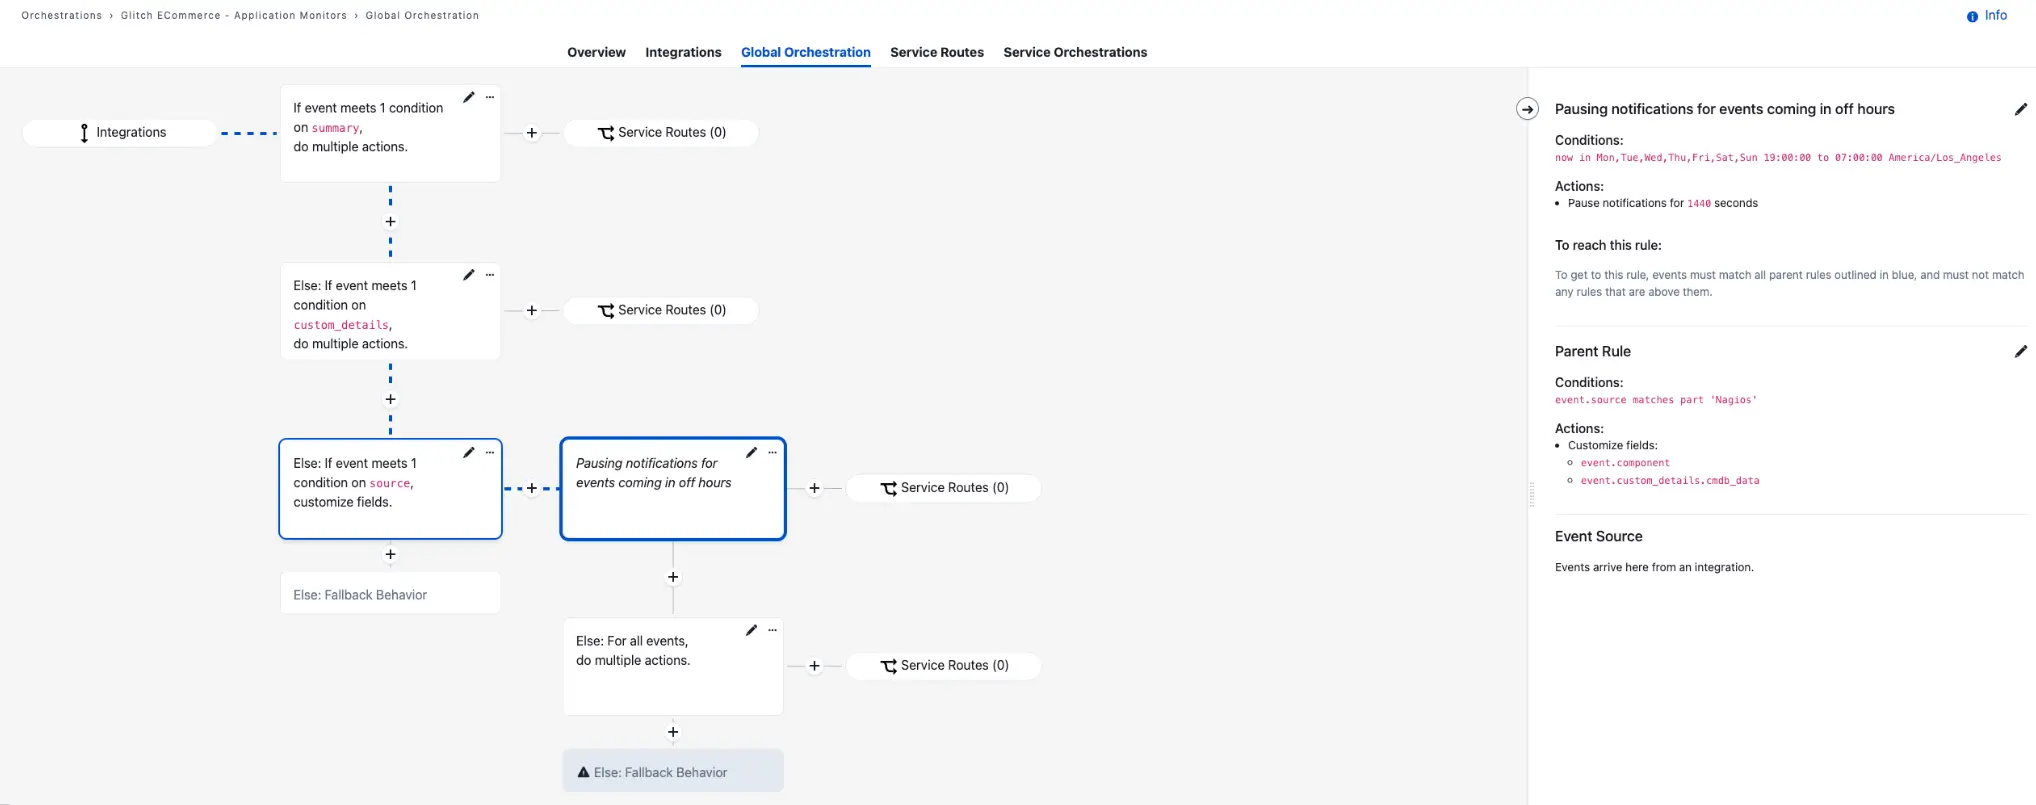 *Global Orchestration Configuration Screen* **Read more about Event Orchestration**: - [Event Orchestration](/ai-automation/aiops/event-orchestration) ### Operations Console The PagerDuty Operations Console offers live visibility into incidents, and you can create customized views to triage and take immediate action on issues. This feature provides central IT teams and technical stakeholders with at-a-glance context on their technical environment to more efficiently triage incidents, and minimize MTTA and MTTR. 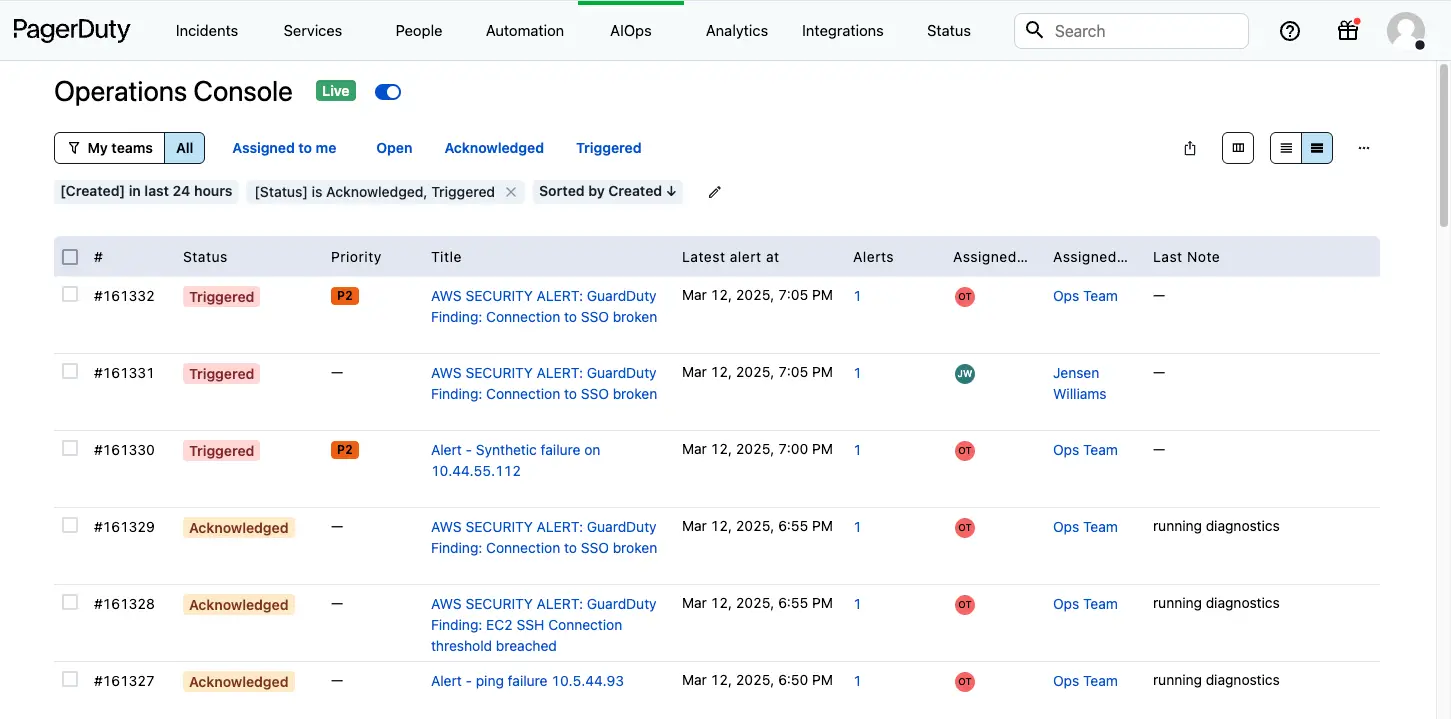 *Operations Console* **Read more about the Operations Console**: - [Operations Console](/ai-automation/aiops/operations-console) ### Increased Event Ingestion Upon request, increase the Events API rate limit from 120 events/min per key, up to 10,000 events/min per key. Contact your account team or Support to request a higher limit. ## PagerDuty AIOps Pricing PagerDuty AIOps is priced by event consumption, so you only pay for the events you ingest. PagerDuty's pricing is: - **Transparent**: Each event that PagerDuty accepts and processes is counted. This includes events sent while a service is in a [Maintenance Window](/incident-management/services/maintenance-windows). Historic and current data is viewable on your subscription page (**User Icon** → **Subscriptions**). - **Flexible**: The draw-down model with wide tiers simplifies estimation and minimizes the impact of event spikes. - **Informative**: Historical event data is visible on the PagerDuty subscription page so that you can better predict the future based on the past. - **Proactive**: Early warning notifications that alert you on your event usage can help you make the right decision. > **Event Notification Thresholds:** When an account reaches 50, 80, 90, 100, or 150% of purchased AIOps Events, PagerDuty sends a notification email to the Account Owner, and to any recipients of [Additional Notification Emails](/account-admin/billing#additional-notification-emails) in Account Settings. Check out the [pricing page](https://www.pagerduty.com/pricing/aiops/) for more details or [contact Sales](https://www.pagerduty.com/contact-us/) to learn more. | Feature | Legacy Event Intelligence | PagerDuty AIOps | |---|---|---| | **Pricing Model** | Per seat | Event Consumption | | **Features Available** | **Noise Reduction:**
• Alert Grouping (Per-Service)
◦ Intelligent Alert Grouping
◦ Content-Based Alert Grouping
◦ Time-Based Alert Grouping
• Auto-Pause Incident Notifications
• Alert Suppression
**Triage and RCA:**
• Probable Origin
• Related Incidents
• Outlier Incident
• Past Incidents
• Recent Changes
**Event Orchestration and Automation:**
• Event Orchestration (Per-Service)
◦ [Basic Event Orchestration](/ai-automation/aiops/event-orchestration/pricing-tiers#basic-event-orchestration)
◦ [Advanced Event Orchestration](/ai-automation/aiops/event-orchestration/pricing-tiers#advanced-event-orchestration)
**Visibility:**
• Visibility Console
**Event Rate Limits:**
• 120 events/min per key | **Noise Reduction:**
• Alert Grouping (Per-Service)
◦ Global Alert Grouping
◦ Intelligent Alert Grouping
◦ Content-Based Alert Grouping
◦ Unified Alert Grouping
◦ Time-Based Alert Grouping
• Global Alert Grouping
• Auto-Pause Incident Notifications
• Alert Suppression
**Triage and RCA:**
• Probable Origin
• Related Incidents
• Outlier Incident
• Past Incidents
• Recent Changes
**Event Orchestration and Automation:**
• Event Orchestration (Per-Service)
◦ [Basic Event Orchestration](/ai-automation/aiops/event-orchestration/pricing-tiers#basic-event-orchestration)
◦ [Advanced Event Orchestration](/ai-automation/aiops/event-orchestration/pricing-tiers#advanced-event-orchestration)
• Global Event Orchestration (across services)
• Dynamic Routing
• Dynamic Escalation Policies
**Operations Console:**
• Operations Console
• Visibility Console
**Event Rate Limits:**
• Maximum limit value of 10,000 events/min per key | | **Receives Feature Updates?** | No | Yes | | **Customer Availability** | • Remains available to Event Intelligence customers
• Unavailable to new customers as of April 11, 2023 | • Event Intelligence customers may migrate to PagerDuty AIOps
• Available to new customers | ## AIOps Service Configuration AIOps Service Configuration (Signal Intelligence on PD Reliability Platform) provides you with flexibility and control over how AIOps features apply. This approach allows you to enable AIOps on the [services](/incident-management/services/services-and-integrations) and [Event Orchestrations](/ai-automation/aiops/event-orchestration) that are most relevant to your needs. AIOps Service Configuration maximizes value and efficiency, and ensures that you are using advanced capabilities where they have the greatest impact. Benefits include: - **Cost-Effective Adoption**: Pay for AIOps on the services where teams will actively use it. This is especially valuable for larger organizations where not every team is ready to implement advanced AIOps features. - **Maximum Flexibility**: Roll out AIOps at your own pace and avoid unexpected event overages. - **Better Control, Better Experience**: Empower teams that want AIOps to use it, while others can stick with standard event management. Optimize both your incident response and your budget. ### How it Works - When you purchase AIOps, all services and Event Orchestrations have AIOps enabled by default. - You can disable or re-enable AIOps for [individual services](/incident-management/services/configurable-service-settings#manage-aiops) or [orchestrations](/ai-automation/aiops/event-orchestration#manage-aiops). - Only events sent to AIOps-enabled services or Event Orchestrations count toward your AIOps event volume tier. There is no change to how accepted events are counted, only which accepted events count against your AIOps event volume tier. > **AIOps and Signal Intelligence:** AIOps and Signal Intelligence are the same capability, offered under different plans: > - **AIOps** is a standalone add-on for Incident Management and legacy plans. > - **Signal Intelligence** is included in PD Reliability Platform plans. > > On PD Reliability Platform plans, Signal Intelligence is disabled by default on newly created services and Event Orchestrations. ### Manage AIOps > **Required User Permissions:** - Account Owners > - Admins and Global Admins > - Manager base role and team roles > - Manager team roles can only manage services associated with their team > **Disable Behavior:** When you disable AIOps on a service or event orchestration, you can expect the following to occur: > > - **Event Throughput**: Any increased event throughput for AIOps reverts to the standard 120 events/minute. > - **Operations Console**: Only AIOps services and their incidents are accessible on the Operations Console. > - **Noise Reduction and Root Cause Feature Access**: The system disables advanced AIOps features (like Outlier Incident, Probable Origin, Related Incidents, Past Incidents, Auto Pause, Alert Grouping, and Recent Changes) for non-AIOps Services. > - **Advanced Orchestration Capabilities**: Only AIOps-enabled Event Orchestrations can use Global Orchestrations and Dynamic Service Routing. If a non-AIOps Orchestration has AIOps rules, the system skips these rules during event ingestion. > - **Advanced Service Orchestration Rules**: Only AIOps-enabled Services can use advanced orchestration rules. If a non-AIOps Service has advanced rules, the system skips these rules during event ingestion. #### Services See the [Configurable Service Settings](/incident-management/services/configurable-service-settings#manage-aiops) article for instructions to enable or disable AIOps on a service. #### Event Orchestration See the [Event Orchestration](/ai-automation/aiops/event-orchestration#manage-aiops) article for instructions to enable or disable AIOps on an Event Orchestration. ## PagerDuty AIOps Trials To take PagerDuty AIOps for a spin before activating a trial, you can do so with the [interactive product tour](https://pagerduty.navattic.com/265z0hdg). You can activate a trial of PagerDuty AIOps via the following methods depending on your PagerDuty account status: - [Current Customers](#current-customers) - [Prospective Customers](#prospective-customers) ### Current Customers For current customers, the Account Owner can activate a trial on the account settings page: 1. In the PagerDuty web app, navigate to **User Icon** → **Account Settings**. 2. In the section **Product Trials**, select **Activate PagerDuty AIOps Trial**. 3. Your trial will automatically activate. ### Prospective Customers If you are not yet a PagerDuty customer, you can fill out [this form](https://www.pagerduty.com/try-pagerduty-aiops) and a representative will reach out about initiating a trial of PagerDuty AIOps. ### PagerDuty AIOps Trials FAQ At the end of your trial, the Account Owner has the option to purchase PagerDuty AIOps. If you decide not to continue with a paid version of AIOps, at the end of 30 days the account reverts to its original state, removing AIOps features. This deletes most configured AIOps settings (and PagerDuty does not retain them). All services revert to not having alert grouping configured, and if you were to sign up again the account would have to start from a clean slate. Consult the following table for the specific features PagerDuty retains: | Feature Category | Features | Retained / Not Retained by PagerDuty | | :-------------------------------- | :------------------------------------------------------------------------------------------------------------------------------------------------------------------------------------------------------------------------------------------------------------------------------------------------------------- | :----------------------------------- | | Ingestion | Recent Changes
Custom Change Event Transformer
High Ingestion Volumes | Not Retained | | Advanced Event Orchestration | Dynamic Field Enrichment & Extraction
Threshold Conditions
Recurring Conditions
Schedule Conditions
Rule Nesting
Paused incident notifications
Webhooks
Global Event Orchestration
Event Orchestration Variables
Dynamic Routing
Dynamic Escalation Policies | Retained | | Noise Reduction | Alert Suppression
Auto-Pause Incident Notifications
Time-Based Alert Grouping
Intelligent Alert Grouping (w/ Flexible Time Window)
Content-based Alert Grouping
Unified Alert grouping (IAG & CBAG)
Global Alert grouping | Not Retained | | Triage /
Root Cause Analysis | Change Correlation
Past Incidents
Related Incidents
Outlier Incidents
Probable Origin
Triage Widget (PD for Datadog) | Not Retained | | Dashboarding | Visibility Console
Operations Console | Not Retained | Once your trial ends, there are several ways to purchase PagerDuty AIOps: 1. **Reseller Partner**: If you previously purchased PagerDuty via a reseller, contact either the reseller or PagerDuty directly to proceed with your AIOps purchase. PagerDuty works with a wide network of reseller partners to complete your transaction. 2. **Self-Serve (Tier 5 or Below)**: If you need the Tier 5 event allotment or lower, you can add AIOps to your subscription. Navigate to **User Icon** → **Account Settings** → **Subscriptions**, and manually include PagerDuty AIOps in your plan. 3. **Contact Sales (Above Tier 5)**: For event allotments beyond Tier 5, or to speak with a sales representative, contact your PagerDuty account representative or email [sales@pagerduty.com](mailto:sales@pagerduty.com) to customize your PagerDuty AIOps subscription to fit your needs. ## Determine Your Event Volume PagerDuty AIOps is licensed per accepted event. Accepted events are any valid events that are sent to and processed by PagerDuty. PagerDuty does not charge for events that were found to be invalid, rate-limited, or that resulted in a non-successful response to the client. There are two ways to determine your event volume based on your current status as a PagerDuty customer: - [Customers](#customers) - [Prospective Customers](#prospective-customers-1) ### Customers > **Required User Permissions:** Account Owners can view event volume. If you are a current PagerDuty customer, you can view your event volume by navigating to **User Icon** → **Subscriptions** or you can use the [Event Analytics](/incident-management/analytics/event-analytics) page at **Analytics** → **Event Analytics**. If you have a newer account without enough data, you can also follow the prospective customer process in the next section. ### Prospective Customers 1. Determine how many events per month are generating from the noisiest integration you intend to send to PagerDuty. 2. Determine what percentage of your monthly events that integration sends. Some monitoring/observability tools indicate the number of events they are generating. 3. Calculate: Baseline events per month = (events/month for noisiest integration)/(% of total events from noisiest integration). ## Purchase PagerDuty AIOps To enhance your incident response process and achieve fewer incidents with faster resolution, you should consider purchasing PagerDuty AIOps. > **Required User Permissions:** Account Owners can purchase PagerDuty AIOps. ### Legacy Event Intelligence Customers For legacy Event Intelligence customers, [contact the Sales team](https://www.pagerduty.com/contact-us/) about migrating to PagerDuty AIOps. ### New Customers If you do not currently have PagerDuty's Legacy Event Intelligence product and you are interested in purchasing PagerDuty AIOps, follow the instructions below. 1. First, you must [determine your event volume](#determine-your-event-volume). Take note of this information, as you use it to select your event volume tier in step 4. 2. Next, navigate to **User Icon** → **Subscriptions** and click **Upgrade Plan**. 3. Select any **plan** (to stay on your current plan, select **Current Plan**). 4. On the next screen, select your preferred **Billing Cycle** and then check the **PagerDuty AIOps** checkbox. 5. Using the event volume information you found in step 1, select your **event volume tier** from the dropdown. 6. Complete checkout. To talk to someone about your current plan, or how you can benefit from PagerDuty AIOps, [contact the Sales team](https://www.pagerduty.com/contact-us/). ### Edit Your Event Volume Tier If you have already purchased PagerDuty AIOps and you would like to edit your [event volume](#determine-your-event-volume) tier, follow the instructions below. 1. Navigate to **User Icon** → **Subscriptions** and click **Upgrade Plan**. 2. Select any **plan** (to stay on your current plan, select **Current Plan**). 3. In the **PagerDuty AIOps** box, select your **event volume tier** from the dropdown. 4. Complete checkout.
--- URL: https://docs.pagerduty.com/ai-automation/aiops/event-orchestration # Event Orchestration Route incoming events and apply nested rule-based actions using Global Orchestrations, Global Integrations, or Service Orchestrations. Event Orchestration allows users to route events to an endpoint and create nested rules, which define sets of actions to take based on event content. Event Orchestration is PagerDuty's modern solution to help tackle your existing and future automation goals. > **Required User Permissions:** The following user roles can create/edit/delete Event Orchestrations: > > - User > - Admin > - Manager base roles and team roles. Manager team roles can create/edit/delete Event Orchestrations associated with their team. > - Global Admin > - Account Owner ## Configure Event Orchestration ### Step 1: Create an Orchestration There are three ways to create an Orchestration: - [Global Orchestrations](#global-orchestrations) (Available with [PagerDuty AIOps](/ai-automation/aiops/overview), or as Signal Intelligence for PD Reliability Platform, only) - [Global Integrations](#global-integrations) (Available on all packages) - [Service Orchestrations](#service-orchestrations) (Available on all packages) #### Global Orchestrations When an incoming event stream has more than one service destination, you can use Global Orchestrations to apply common event actions and route events to different services. > **Availability:** Global Orchestrations are only available on accounts with the [PagerDuty AIOps](/ai-automation/aiops/overview) add-on (or Signal Intelligence for PD Reliability Platform) and the [Advanced Event Orchestration](/ai-automation/aiops/event-orchestration/pricing-tiers#advanced-event-orchestration) pricing tier. To create a new Global Orchestration: 1. Navigate to **AIOps** → **Event Orchestration** and select **+ New Orchestration**. 2. Enter an **Orchestration Name** and an optional **Orchestration Description**. 3. Click **Save**. 4. On the next screen, select **Integrations** to view the **Integration Key**, **Email Address** (for email integrations), and **HTTP Endpoint for API** that you can use to connect your alerting systems with PagerDuty. Follow your alerting system's [integration guide](/integrations) for configuration instructions. 5. Select **Global Orchestration** to navigate to the Global Orchestration Rules graph. 6. Click **New Rule** to create a new rule. Continue to [Step 2: Create Rules](#step-2-create-rules). #### Global Integrations When an incoming event stream has more than one service destination, you can use Global Integrations to route events to different services and apply Service Orchestration rule actions. > **Availability:** Global Integrations are available on all packages. 1. Navigate to **AIOps** → **Event Orchestration** and select ** New Orchestration**. 2. Enter an **Orchestration Name** and an optional **Orchestration Description**. 3. Click **Save**. 4. On the next screen, select **Integrations** to view the **Integration Key**, **Email Address** (for email integrations), and **HTTP Endpoint for API** that you can use to connect your alerting systems with PagerDuty. Follow your alerting system's [integration guide](/integrations) for configuration instructions. 5. Next, select the **Service Routes** tab. Continue to [Step 2: Create Rules](#step-2-create-rules). #### Service Orchestrations When integrations exist on a service, you can use Service Orchestrations to evaluate your incoming events and perform additional actions. > **Availability:** Service Orchestrations are available on all packages. > > If you have a service that uses [Service Event Rules](/ai-automation/aiops/rulesets#service-event-rules), you can switch to Service Orchestrations at any time. Read the section [Switch to Service Orchestrations](#switch-to-service-orchestrations) for more information. To create a new Service Orchestration: 1. Navigate to **Services** → **Service Directory** → click your desired **service name** and select the **Settings** tab. 2. Scroll to **Event Management** and click **Service Orchestration Rules**. 3. Click **+ New Rule** and continue to [Step 2: Create Rules](#step-2-create-rules). ##### Create a Service Orchestration from a Global Integration or Orchestration A Service Orchestration can also be created after a Global Integration, or Global Orchestration is made. This method allows users to create the rules that define what happens after events are routed to a service. To create a new Service Orchestration from a Global Integration or Orchestration: 1. Navigate to **AIOps** → **Event Orchestration** → select your desired **Orchestration** and then click **Service Orchestrations**. 2. Select a **service** from the **Service Event Rules** dropdown. 3. You are then taken to the Service Orchestration graph for the service you selected. Continue to [Step 2: Create Rules](#step-2-create-rules). ### Step 2: Create Rules With Event Orchestration there are three distinct types of rules that a user can create: - [Global Orchestration Rules](#global-and-service-orchestration-rules) (Available with [PagerDuty AIOps](/ai-automation/aiops/overview) only): Global Orchestration rules are optional rules that can be created _before_ a routing rule. They determine which actions are applied to events during event processing as well as how events eventually turn into incidents. Actions applied at the Global Orchestration rule level apply to **_all_** events that match the rule's conditions, regardless of which service they are eventually routed to. Any actions applied can be overridden by Service Orchestration rules which also match against a given event. The last evaluated rule takes precedence where a single enrichment, alert, or incident action is taken multiple times. - [Routing Rules](#routing-rules) (Available on all packages): Routing rules define how events are routed to services. They must be created for events to be routed from a Global Integration or Orchestration to a service. - [Service Orchestration Rules](#global-and-service-orchestration-rules) (Available on all packages): Service Orchestration rules are optional rules that can be created after a routing rule. They determine which actions are applied to events during processing, and how events eventually turn into incidents. Service Orchestration rules have their own conditions and are linked to rules that precede and follow them. #### AI Orchestrations AI Orchestration rules are automatically generated recommendations that surface in a dedicated segment after all manual Global and Service Orchestration rules. See [AI Orchestrations](/ai-automation/aiops/event-orchestration/ai-orchestrations) for more information. #### Recommended Preparation PagerDuty recommends sending events to your Orchestration integration key to inspect the incoming JSON key/value pairs and build rules from there. To send events to Orchestrations: 1. Navigate to **AIOps** → **Event Orchestration**, select your preferred **Orchestration** and click **Integrations**. 2. On the following screen, select the integration key set you want to work with and copy the appropriate **Integration Key** to use in your upstream event source, e.g., a monitoring tool or CI pipeline. > **Note:** An Orchestration can have up to 10 integration keys associated with it. Using any of these integration keys directs events toward the Orchestration rules and routing rules specified for the Orchestration. #### Routing Rules For Event Orchestration to route events to the appropriate service, you need to create routing rules. Some things to keep in mind while working with your routing rules: - There can only be one routing rule per service per Event Orchestration. For example, if **Orchestration A** routes events to **Service A**, you cannot configure another rule within the same orchestration to route to the same service, however you _could_ configure **Orchestration B** to route events to **Service A**. - Routing rule conditions can be based on either [PD-CEF](/developer/api/pd-cef)-transformed event data or raw event payloads. - You can also create Dynamic Routing Rules, which evaluate _all_ events and do not have conditions. Dynamic Routing Rules are able to route events to services based on the **Service name** or **Service ID** in the payload. Dynamic Routing Rules are evaluated before any other routing rules on a service router. - Events that do not match any configured rules match to the [catch all rule](#catch-all-rule). The default catch all behavior does not send these events to a specific service & never creates an incident. You can edit the catch all rule to send these events to a specific service instead. > **Routing Rules and Event Deduplication:** All events—including acknowledge and resolve events—are evaluated against the conditions defined in your routing rules to determine which service they should be routed to. If you need event deduplication across all services because your trigger events have different payloads than acknowledge or resolve events, please refer to [this example](/ai-automation/aiops/event-orchestration/examples#capture-unrouted-trigger-events). ##### Create a Dynamic Routing Rule To create a dynamic routing rule: 1. Navigate to **AIOps** → **Event Orchestration** and select your preferred **Orchestration**. 2. Click **Service Routes** → **New Dynamic Route**.  *Select New Dynamic Route* 3. In the modal, select the **Event Field** where routing information (i.e., either service name or service ID) is located. You can select any single [PD-CEF](/developer/api/pd-cef) field. For example, `event.summary` refers to the Summary field. You may also select free text field formats: **Raw Event** (e.g., `raw_event.foo.bar`) or **Custom Details** (e.g., `event.custom_details.foo.bar`). 4. In the **Format** dropdown, select **Service name** (default) or **Service ID**. This setting specifies if the Dynamic Routing Rule should attempt to match events to services via its name or ID (e.g., `PXXXXXX`). 5. In the **Extraction Regex** field, enter an [RE2](https://github.com/google/re2/wiki/Syntax) regex pattern that identifies where service information is located in the selected field. If you specify a capture group, the part matched by the capture group is used to set the variable. Otherwise, the entire match is used. 6. Click **Save**. > **Dynamic Routing Rules:** Keep the following information in mind while configuring a dynamic routing rule: > > - If an event does not match to a service based on your dynamic routing rule configuration, it evaluates against the next [routing rule](#create-a-routing-rule) in the service's router. > - If an event contains malformed information in the field targeted for dynamic routing, Event Orchestration drops the event (e.g., if you have configured a dynamic routing rule based on service ID, but the specified field does not contain data shaped like a service ID). > - [Global Orchestrations](#global-orchestrations) execute before Dynamic Routing Rules. Manipulating a CEF field in a Global Orchestration may lead to unintended behavior if a downstream Dynamic Routing Rule reads from that field. > - Service names are stored as cached data for routing purposes. It can take up to 10 minutes for the service name cache to update after a service's name has been changed. During this time events continue to match to services based on the previously configured service names. ##### Create a Routing Rule To create a routing rule: 1. Navigate to **AIOps** → **Event Orchestration** → select your preferred **Orchestration** → **Service Routes** → click **New Service Route**. - _Optional_: next to , enter a **description** for your new rule. 2. From the dropdown **What service should events route to?**, select a service you would like to route events to. 3. Under **When should events be routed here?**, select one of the following options: - **Always (for all events)** - **If events match certain conditions** - **On a recurring weekly schedule** (Available with [Advanced Event Orchestration](/ai-automation/aiops/event-orchestration/pricing-tiers#advanced-event-orchestration)) - **During a scheduled date range** (Available with [Advanced Event Orchestration](/ai-automation/aiops/event-orchestration/pricing-tiers#advanced-event-orchestration)) - **Depends on event frequency** (Available with [Advanced Event Orchestration](/ai-automation/aiops/event-orchestration/pricing-tiers#advanced-event-orchestration)) 4. Depending on your selection in the previous step, configure the rule according to your needs. 5. Click **Save**. ##### Catch All Rule If an event does not match any configured routing rules, it performs the action outlined by the **catch all rule**. There are two options available for this rule: - **Events not matching a previous rule should not be sent to a specific service & should never create an incident (Default)**: If a **trigger** event reaches this rule, it creates a suppressed alert. If a **resolve** event reaches this rule, the rule attempts to resolve an open alert previously created through the orchestration with the same `dedup_key`, regardless of service. These events can also resolve suppressed alerts if a matching `dedup_key` exists. - **Send all events not matching a previous rule to a service**: If an event reaches this rule, it is routed to the chosen service and can be evaluated further by the service's Service Orchestration if one exists. > **Event Orchestration Examples:** See [Event Orchestration Examples](/ai-automation/aiops/event-orchestration/examples) for more details on both common and advanced routing rule configurations. ### Global and Service Orchestration Rules - Global Orchestration rules are optional rules that can be created _before_ a routing rule. These rules have their own conditions and are linked to rules that precede and follow them. - Global Orchestration rules can include any action except those that define how an event is routed to a service. - Service Orchestration rules are optional rules that can be created _after_ a routing rule. These rules have their own conditions and are linked to rules that precede and follow them. - Service Orchestration rules determine which actions are applied to events during processing before an incident triggers. - When there is more than one potential global or service orchestration rule that an event could match against, that group of rules is called a **set**. Events match against whichever rule in a set has the highest ordinality (i.e., appears first, either in the UI or API). - When creating a Global or Service Orchestration rule, any conditions can be created and combined, similar to a routing rule, however, threshold-based conditions can only ever exist on their own. If a user wants to create a rule with a threshold-based condition they must make a specific service rule that only has that condition present. > **Ruleset Limits:** A set of rules grouped vertically in the web app can be referred to as a "ruleset." Rulesets can have up to 25 rules. As needed, you can [nest rules](#configure-a-global-or-service-orchestration-rule), which allows you to create more than 25 rules in an orchestration, however PagerDuty advises against making orchestrations too complex, as this can make it difficult to maintain, or for other teams to understand your orchestration's logic. ### Recombining Rules If your orchestration logic is complex, use **Connect Mode** to reduce redundant rules and improve user experience by enabling multiple rules to recombine back into a single rule. To learn more, see the guide on [Recombining Rules](/ai-automation/aiops/event-orchestration/recombining-rules). 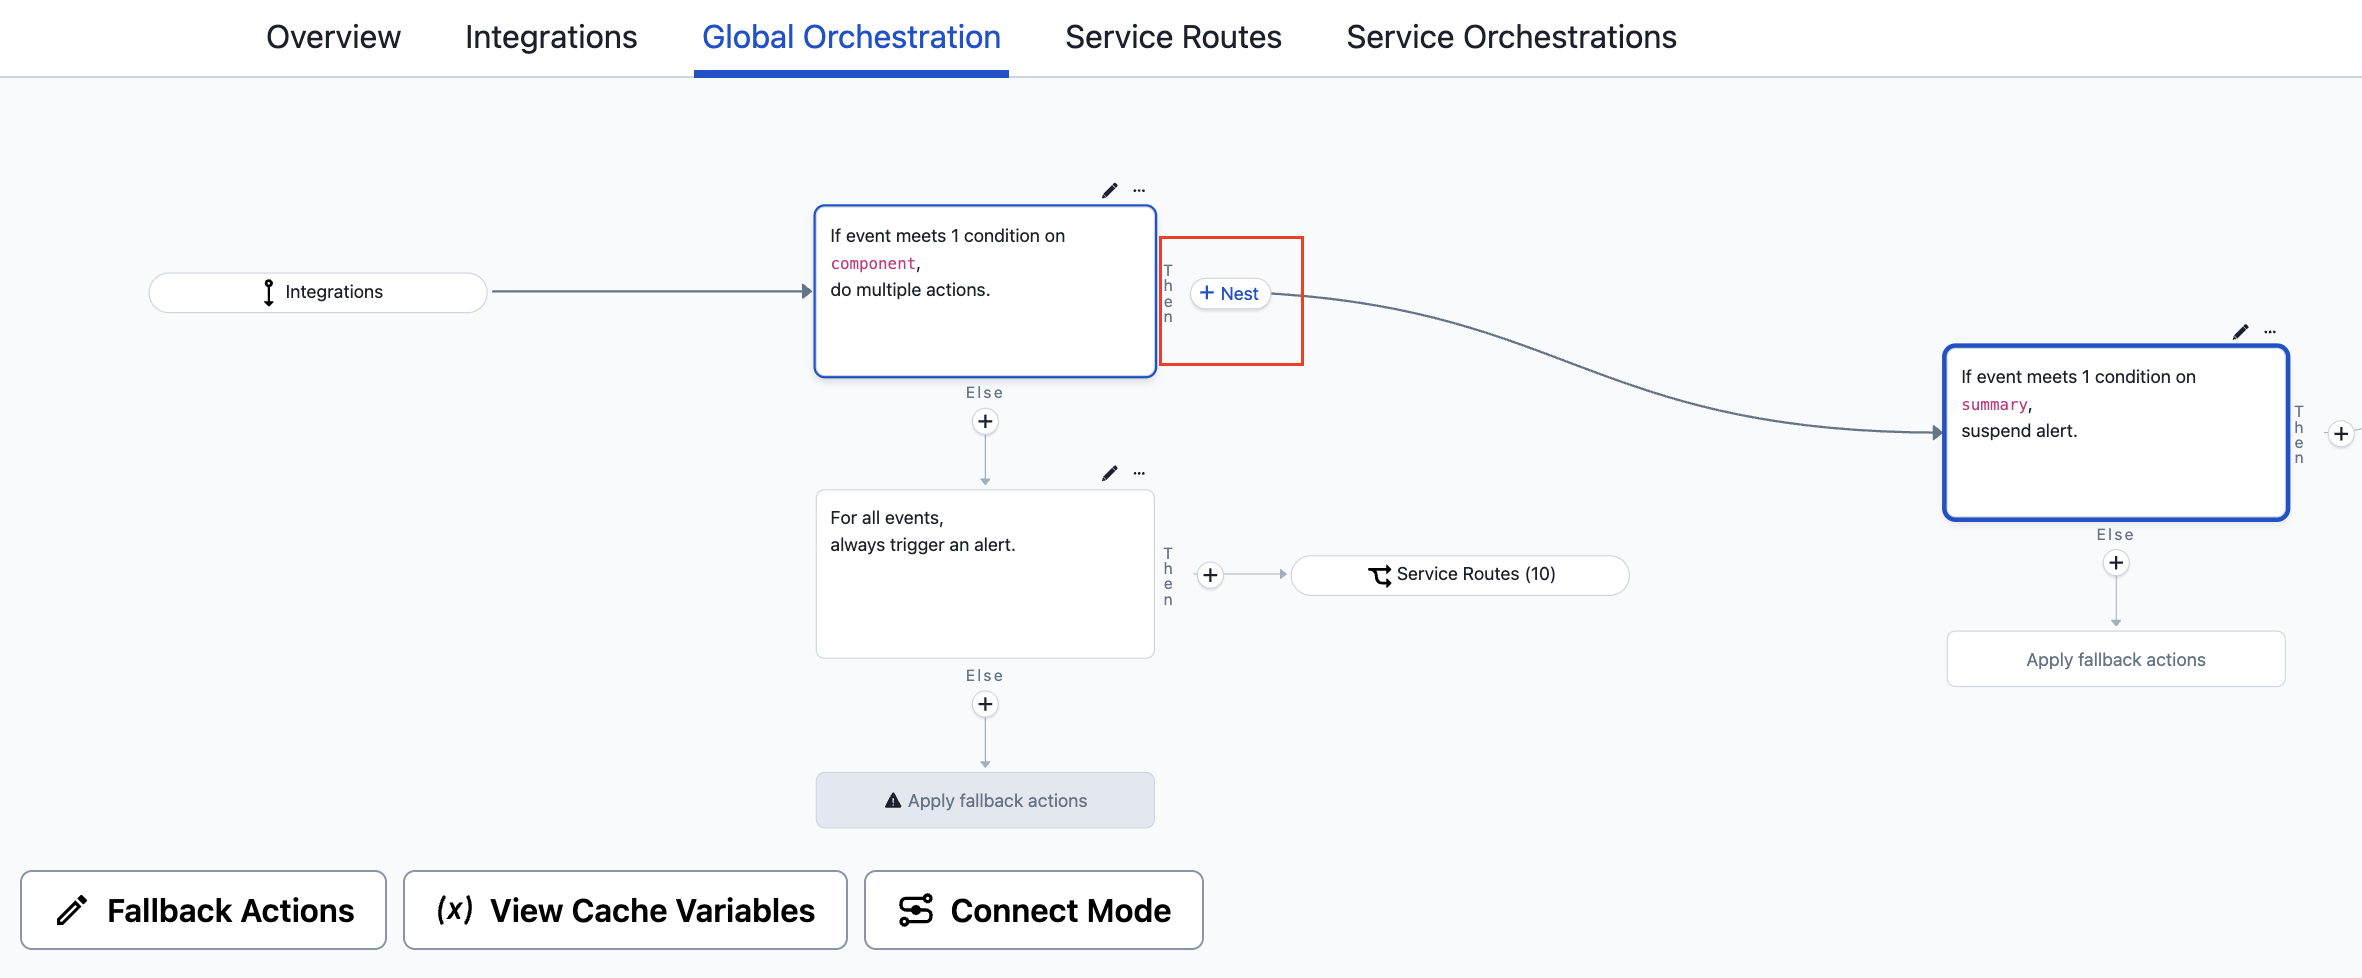 *Connect mode* ### Configure a Global or Service Orchestration Rule 1. Navigate to **AIOps** → **Event Orchestration** → select your preferred **Orchestration** → select **Global Orchestration** or **Service Orchestrations** (and select a service), and click **New Rule** on an empty Orchestration rule page or **** on an Orchestration rule page with existing rules. 2. A modal appears on the page. Select the type of condition, then specify the appropriate **conditions** for this new rule. 3. Click **Next**. 4. Specify the **actions** that should be applied in the following menus: - [Incident Data](#incident-data) - [Basic Event](#basic-event) - [Event Fields](#event-fields) - [Custom Fields](#custom-fields) - [Rule Variables](#create-custom-rule-variables) - [Alert Data](#alert-data) - [Automation](#automation) - [Webhooks](#webhooks) - [Automation Actions](#automation-actions) 5. Click **Save** to save this new rule. #### Incident Data ##### Basic Event Determine how the incident should be created, or override default incident creation. | Incident Action Option | Instructions and Details | | :---------------------------------------------------------------------------------------------------------------------------- | :---------------------------------------------------------------------------------------------------------------------------------------------------------------------------------------------------------------------------------------------------------------------------------------------------------------------------------------------------------------------------------------------------------------------------------------------------------------------------------------------------------------------------------- | | Create an alert but pause notifications
([Advanced Event Orchestration](/ai-automation/aiops/event-orchestration/pricing-tiers#advanced-event-orchestration)) | An incident can trigger after a predetermined amount of time. Enter the **amount of time** you would like to pass before an incident and notifications are created in the **Suspend alert for \_ second(s) before triggering incident** field. See [Pause Incident Notifications](#pause-incident-notifications) for more details. | | Suppress alert
([Advanced Event Orchestration](/ai-automation/aiops/event-orchestration/pricing-tiers#advanced-event-orchestration)) | Alerts that match the routing rule conditions suppress, meaning they do not create PagerDuty incidents or notify responders. You may want to suppress alerts if you do not want responders to be notified outside of support hours, or within any specific [timeframe](#create-a-routing-rule). Suppressed alerts are visible in the [Alerts table](/incident-management/incidents/alerts/alerts-table). | | Drop incident and stop processing
([Advanced Event Orchestration](/ai-automation/aiops/event-orchestration/pricing-tiers#advanced-event-orchestration)) | **Note**: Only available for Global Orchestration rules.
Events that match this rule are dropped out of PagerDuty's event ingestion pipeline. They generate no data within the PagerDuty platform, do not create Incidents, and are not turned into Alerts. It is not possible to audit PagerDuty for events that were dropped. | | Set Priority | To set priority, check the **Set Priority** checkbox and select your desired **priority level** from the dropdown.
[Incident priority](/incident-management/incidents/incident-priority) allows the classification of incidents based on a level of prioritization. Incident priority must be [enabled on your account](/incident-management/incidents/incident-priority#configure-incident-priority) before it can be set with orchestrations. | | Dynamic Escalation Policy Override
([Advanced Event Orchestration](/ai-automation/aiops/event-orchestration/pricing-tiers#advanced-event-orchestration)) | To override a service's assigned [Escalation Policy](/incident-management/schedules/escalation-policies), select your preferred escalation policy from the dropdown. The on call responder associated with the selected escalation policy receives notifications when an incident triggers, instead of the responder associated with the service's configured escalation policy. | | Add a note to the incident | To add a note when an incident is created, under **Additional Context**, enter the text of the note that you would like to be added to an incident that meets your rule's criteria. If multiple rules in an orchestration add a note, only the note from the most recently evaluated rule is added to the incident.
[Notes](/incident-management/incidents/edit-incidents#add-a-note-to-an-incident) can be used to help responders resolve incidents quicker by including information or links related to the system that the event comes from. | > **Adding a Note to a New Incident:** Adding a note or overriding an Escalation Policy only applies when an event triggers a new incident. These actions are not applied to subsequent events and alerts that are grouped or deduplicated into an existing incident. ##### Event Fields Event Fields allow you to copy important data from any combination of source event fields into any [PagerDuty Common Event Format (CEF)](/developer/api/pd-cef) field. Translate difficult machine terms and code into helpful context for responders so they can effectively respond to the problem. Event Fields can also be used to enhance PagerDuty AIOps capabilities by customizing alerts, influencing the [Intelligent Alert Grouping](/ai-automation/aiops/noise-reduction/alert-grouping/intelligent-alert-grouping) and Intelligent Triage machine learning algorithms. Enrich and update any [CEF](/developer/api/pd-cef) field or even create new key values within the Custom Details object using custom rule variables. When events are sent to PagerDuty, they are transformed into Common Event Format. You can replace any CEF field or even create new key values within the Custom Details object. > **Availability:** Event Fields are available with [Advanced Event Orchestration](/ai-automation/aiops/event-orchestration/pricing-tiers#advanced-event-orchestration). 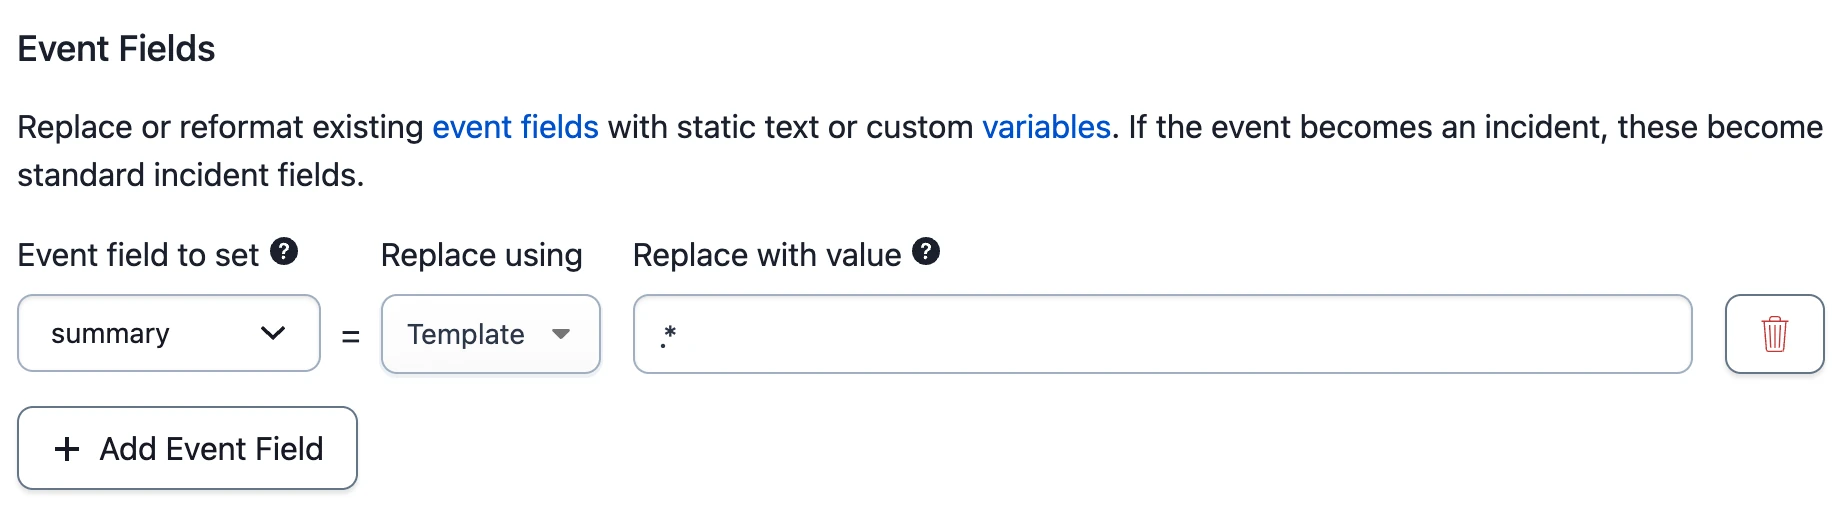 *Event Orchestrations Event Fields* 1. Click **Add Event Field**. 2. Perform the following: | Replace Event Field | Instructions and Details | | :----------------------- | :------------------------------------------------------------------------------------------------------------------------------------------------------------------------------------------------------------------------------------------------------ | | Common Event Field (CEF) | Select your preferred **Common Event Field (CEF)** from the **Event field to set** dropdown. | | Right dropdown | Select whether you would like to use **Regex** _or_ a **Template** from the **Replace using** dropdown. | | Template option | If you chose a text template from the dropdown, you can reference a variable defined in the [Create Custom Rule Variables](#create-custom-rule-variables) section above using `{{ }}` brackets (e.g., `{{class}}`) in the **Replace with value** field. | | Regex option | If you chose the **Regex** option from the dropdown, enter a **Value** and the origin **Source**. | Event Fields are available with both Global Orchestrations and Service Orchestrations. ###### Deduplication The `dedup_key` field is used to merge events into a single alert. Events with the same `dedup_key` can update the status of the alert they are automatically merged into. To set a deduplication key: 1. In the Event Fields section of your rule, under Define Custom Variable, [create a rule variable](#create-custom-rule-variables) from event fields by entering a **Variable Name**, **Event Field** and the **Extraction Regex**. You may use Sample Events on the right to create these rule variables. 2. Next, select **Dedup Key** from the **Event field to set** dropdown. Select whether you would like to use **Regex** or a **Template** from the right hand dropdown. If you use a Template, you can reference a rule variable defined in step 1 using `{{variable name here}}` brackets in **Replace with value** field. If you are using Regex, enter a **Value** and the **Source**. > **Using Event Fields on Email Events:** [Event Fields](#event-fields) are only available for email events sent to [Global Integrations](#global-integrations). Users can extract data from the email event using regex matching into multiple rule variables. **Currently, only** `Summary` **and** `Dedup_Key` **Common Event Fields can be replaced for email events.** ##### Custom Fields Replace or fill incident Custom Fields with static text, [event fields](#event-fields) or [rule variables](#create-custom-rule-variables). This allows you to bring event data into your incidents and use event-driven automation in your incident management. For example, you may wish to pass the `component`, `class`, or other `custom details` event fields into incident custom fields. Once a value is in a custom field, it can be used elsewhere in the product such as [Status Update Templates](/incident-management/communicate/status-update-templates) or as part of the [ServiceNow integration](/integrations/servicenow-integration-guide), which supports [custom fields bi-directional syncing](/integrations/servicenow-integration-guide/advanced-servicenow-configuration/servicenow-custom-field-mappings). > **Availability:** - Business Plans and above are able to set Custom Fields to static text values through Event Orchestration (#3 in table below) > - Enterprise for Incident Management, Digital Operations (Legacy), Event Intelligence or AIOps plans are able to dynamically populate custom field values with Event Orchestration. This includes replacement with both event fields and variables (#1 and #2 in table below). > **Custom Fields Set on New Incidents:** Custom fields are only set when the event triggers a new incident. Subsequent events and alerts that are grouped or deduplicated into the incident do not update Custom Fields at this time. 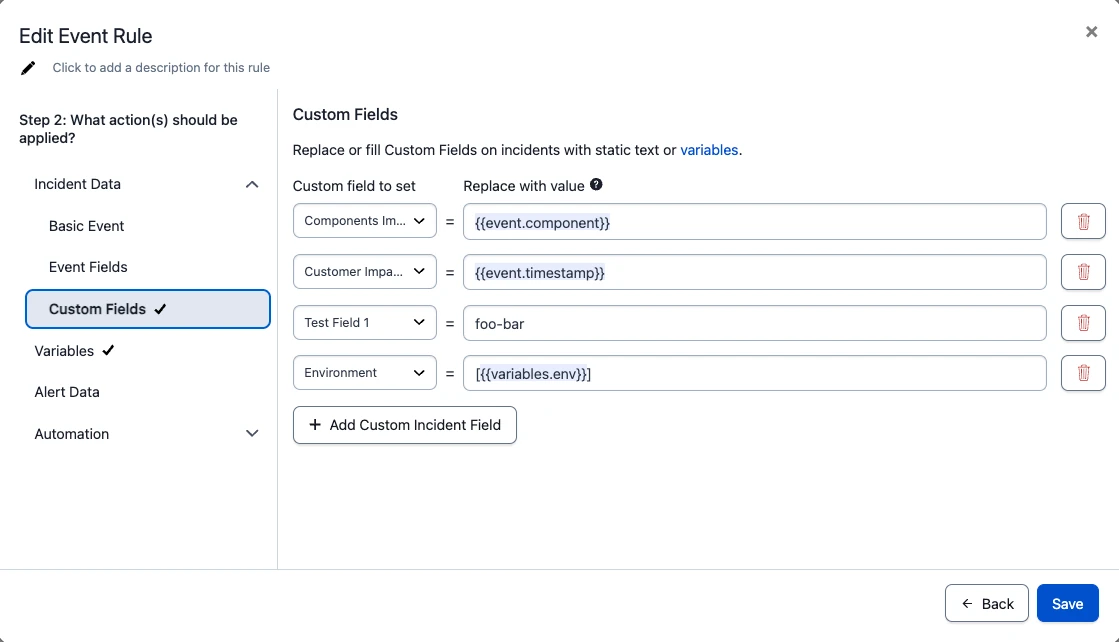 *Custom fields in Event Orchestration* 1. Click **Add Custom Incident Field**. 2. Perform the following:
| Custom field to set | Replace with value |
|---|---|
| Select your preferred **Custom Field** | There are a few options for how to replace values: 1. **Replace with event field**: Use double curly brackets to reference event fields. E.g.: `{{event.component}}`. 2. **Replace with [variable](#create-custom-rule-variables)**: Use double curly brackets to reference both cache variables and rule variables. **Note**: variables must first exist before they can be referenced. E.g.: `{{variables.env}} {{cache_var.foo_bar}}` 3. **Replace with static text**: Simply use static text, such as `foo-bar` in the above image. |
| Custom Field Type | Expected Event Orchestration Format | Example |
|---|---|---|
| Text | As is | Hello World |
| Single Select | As-is | OptionA |
| Multiple Select | Array with quoted strings | \[“OptionA”, “OptionB”] |
| Tag | Array with quoted strings | \[“TagA”, “TagB”] |
| Date-Time | ISO-8601 formatted date-time with timezone. Microseconds are accepted but not required. - yyyy-mm-ddThh:mm:ss.sss±hh:mm - yyyy-mm-ddThh:mm:ss±hh:mm - yyyy-mm-ddThh:mm:ss.sssZ - yyyy-mm-ddThh:mm:ssZ | - 2024-01-25T16:17:18.315+0500 or - 2024-01-25T16:17:18+0500 or - 2024-01-25T16:17:18.315Z or - 2024-01-25T16:17:18Z |
| Decimal | As-is | 101.234 |
| Integer | As-is | 1234 |
| Boolean |
True or False **Note**: If left empty, defaults to False |
True |
use `event.summary` for the **Summary** CEF field, or `raw_event.fieldname` to read from the original event's `fieldname` data. | | Extraction Regex | Enter an [RE2](https://github.com/google/re2/wiki/Syntax) regular expression, which matches the part of the field you want to extract. If you specify a capture group, the part matched by the capture group is used to set the rule variable. Otherwise, the entire match is used. | You may use **Sample Events** on the right as a reference for rule variables by clicking **Show Details**. You may add multiple rule variables by clicking **Add Variable** in the upper right of the Customize Event Fields panel, or delete rule variables by clicking the icon directly to the right of the rule variable. ##### Alert Data | Alert Action | Instructions and Details | | :---------------------------------- | :----------------------------------------------------------------------------------------------------------------------------------------------------------------------------------------------------------------------------------------------------------------------------------------------------------------------------------------------------------------------------------------------------------------------------------------------------------------------------------------------------------------------------------------------------------------------------------------------------------------------------------- | | Set Severity | To set [severity](/developer/api/pd-cef#pd-cef-fields), check the **Set Severity** checkbox and select **info, error, warning or critical** from the dropdown.
Severity can be used for [Dynamic Notifications](/incident-management/incidents/dynamic-notifications), which are defined by the service settings. To use Dynamic Notifications, the events must be routed to a service that sets Dynamic Notifications based on severity levels.
With severity controlled via Event Orchestrations and the service configured to use dynamic notifications, you can [control the incident urgency](/incident-management/incidents/dynamic-notifications). | | Set a custom trigger/resolve action | If you would like to automatically trigger or resolve an alert based on your event rule's conditions, in the section **Override the given** `event_action` **behavior**, check the box for either **Always trigger an alert** or **Always resolve an alert**. | #### Automation Event Orchestration enables you to trigger automations at machine speed. You can leverage webhooks with Global Orchestration and Service Orchestration rules to trigger automations in external systems. Automation Actions within Service Orchestration rules allow you to run automations already created in the PagerDuty platform. Through an Event Orchestration rule, run the Automation on Incidents or Automation on Alerts so that the automation is completed before a human is notified. Only one automation can be specified per rule, however multiple automations can be triggered during incident creation by [nesting rules](#configure-a-global-or-service-orchestration-rule) one after another. To help you get started, see the example on how to [Automate Remediation for Specific Incidents](/ai-automation/aiops/event-orchestration/examples#automated-remediation-for-specific-incidents). > **Configuration Note:** Ensure that any configuration in the Event Orchestration aligns with the defined Trigger condition as it is possible to create a scenario where an automation would never run. This conflict could occur in a single rule or with nested rules. For example: > > - **Suppression Conflicts**: If you set rule #1 to suppress all alerts and rule #2 to "Run Automation Action" when an alert is added, the automation never runs because the alert was never created. > - **Deduplication vs. Grouping**: If your rule is set to trigger "Automatically when Alert is added to an Incident," it fires for the initial alert and any subsequent **grouped** alerts. However, it does **not** fire for **deduplicated** events that update the initial alert, as no new alert is being added to the incident. > > These rules would never trigger an automation as every alert would be suppressed, therefore an automation that is configured to run when an alert is added to an incident is impossible. ##### Webhooks Webhook Actions allow response teams to easily define a dynamic webhook through an Orchestration and send a custom payload to a specified endpoint. This enables responders to automate actions like restarting a server, clearing logs, and reverting bad deploys. > **Availability:** Webhooks are available with [Advanced Event Orchestration](/ai-automation/aiops/event-orchestration/pricing-tiers#advanced-event-orchestration). The payload can be set using a combination of several predefined variables. To configure a webhook action within an event rule:
| Option | Instructions and Details |
|---|---|
| Use webhooks if an event reaches this rule (_Enable webhook_) | Click the **toggle** to enable the webhook. |
| When should we run this Webhook? (_Trigger condition_) | Select the scenario from the dropdown for when the webhook should run: - Allow responders to manually send this action from the incident on incident creation - Automatically when Alert is added to an Incident - Automatically when Alert is suppressed - Automatically when Alert is paused/suspended |
| Name | Enter a **webhook name** to be displayed on the alert or incident. |
| Webhook URL | Enter the **API endpoint** for the payload. |
| Headers | Select the **+ Header Field** button and enter the **Name** and **Value** for the webhook header. |
| JSON Body Fields (_Optional_) | Enter a **name** and **value** using [rule variables](#create-custom-rule-variables) or [cache variables](/ai-automation/aiops/event-orchestration/cache-variables#step-2-create-a-new-cache-variable) to further enrich the custom action. |
| Option | Instructions and Details |
|---|---|
| Use Automation Actions if an event reaches this rule (_Enable Automation Action_) | Click the **toggle** to enable the Automation Action. |
| When should we run this Action? (_Trigger condition_) | Select the scenario from the **dropdown** for when the Automation Action should run: - Automatically when Alert is added to an Incident - Automatically when Alert is suppressed - Automatically when Alert is paused/suspended |
| Automated Action | Select an existing Automation Action from the **dropdown**. |
To enable or disable AIOps on an Event Orchestration: 1. Navigate to **AI** → **AIOps** → **Event Orchestration**. 2. To the right of your preferred orchestration, click the kabob menu and perform the following based on your use case: - Click **Enable AIOps**. In the confirmation modal that appears, click **Enable** to complete the process. - Click **Disable AIOps**. In the confirmation modal that appears, click **Disable** to complete the process. ## Manage Integrations When you [create an Event Orchestration](#step-1-create-an-orchestration), PagerDuty automatically creates a default integration set, which consists of an [Events API v2](/developer/events-api-v2-overview) integration key and an [integration email address](/integrations/email-integration-guide#integrate-with-event-orchestration). If you [delete](#delete-an-integration) or [migrate](#migrate-an-integration-from-an-existing-ruleset-or-orchestration) all integration keys associated with an orchestration, the orchestration's rules persist, however they are not able to receive or evaluate events. ### Create an Integration 1. In the web app, navigate to **AIOps** → **Event Orchestration**. 2. Select your desired **Orchestration** from the list. 3. Select **Integrations**, click **New Integration** and select **Create new integration**. 4. Enter a **name** for the integration and click **Save**. > **Integration Limit:** One orchestration can have up to 10 integrations. ### Rename an Integration 1. In the web app, navigate to **AIOps** → **Event Orchestration**. 2. Select the **Orchestration** with the integration you would like to rename from the list. 3. Select **Integrations**. 4. On the top-right of the integration you would like to rename, click . 5. Enter a new **name** for the integration and click **Save**. ### Delete an Integration 1. In the web app, navigate to **AIOps** → **Event Orchestration**. 2. Select the **Orchestration** with the integration you would like to delete from the list. 3. Select **Integrations**. 4. On the top-right of the integration you would like to delete, click . 5. In the confirmation modal, click **Delete**. 1. **Note**: This action cannot be undone. ### Migrate an Integration from an Existing Ruleset or Orchestration To assist with the transition from [Rulesets](/ai-automation/aiops/rulesets) to Event Orchestration, you may wish to [manually migrate an integration from Rulesets](#migrate-an-integration-from-a-ruleset) to a new orchestration. #### Migrate an Integration from a Ruleset 1. In the web app, navigate to **AIOps** → **Event Orchestration**. 2. Select your desired **Orchestration** from the list. 3. Select **Integrations**, click **New Integration** and select **Permanently migrate integration from existing Ruleset**. 4. From the dropdown in the modal, select the **Ruleset** you would like to migrate. 5. Click **Migrate**. > **Note:** This action is permanent and cannot be undone. #### Migrate an Integration from an Orchestration 1. In the web app, navigate to **AIOps** → **Event Orchestration**. 2. Select your desired **Orchestration** from the list. 3. Select **Integrations**, click **New Integration** and select **Migrate integration from existing Orchestration**. 4. From the dropdowns in the modal, first select the **Orchestration** with the desired integration, then select the **Integration**. 5. Click **Migrate**. ## Manage Rules The following information details how to manage the three rule types that are relevant to Event Orchestration: - [Global Orchestration Rules](#manage-global-orchestration-rules) - [Routing Rules](#manage-routing-rules) - [Service Orchestration Rules](#manage-service-orchestration-rules) ### Manage Global Orchestration Rules #### Edit, Disable or Reorder a Global Orchestration Rule 1. Navigate to **AIOps** → **Event Orchestration**. 2. Select the **Orchestration** from the list that contains the Global Orchestration rule you wish to edit or disable. 3. Select **Global Orchestration**. 4. On the following page: 1. **To edit**: Click in the top-right of your desired rule. In the modal, make any changes to conditions or rule information and click **Save**. 2. **To disable**: Click in the top-right of your desired rule and select **Disable**. The rule is immediately disabled, and appears in the rule's description. To enable the rule again, click and select **Enable**. 3. **To reorder**: Click in the top-right of your desired rule and select an action, as appropriate (e.g., **Move to Top**, **Move Up**, **Move Down**, **Move to Bottom**). #### Delete a Global Orchestration Rule 1. Navigate to **AIOps** → **Event Orchestration**. 2. Select the **Orchestration** from the list that contains the Global Orchestration rule you wish to delete. 3. Select **Global Orchestration**. 4. On the following page, click in the top-right of your desired rule and select **Delete**. 5. In the confirmation modal, click **Delete**. 1. **Note**: This action cannot be undone. ### Manage Routing Rules #### Edit or Disable a Routing Rule 1. Navigate to **AIOps** → **Event Orchestration**. 2. Select the **Orchestration** from the list that contains the routing rule you wish to edit or disable. 3. Select **Service Routes**. 4. On the following page: 1. **To edit**: Click to the right of your desired routing rule. In the modal, make any changes to conditions or rule information and click **Save**. 2. **To disable**: Click to the right of your desired routing rule and select **Disable**. The rule is immediately disabled, and appears in the rule's description. To enable the rule again, click and select **Enable**. 3. **To reorder**: Click in the top-right of your desired rule and select an action, as appropriate (e.g., **Move to Top of All Routes**, **Move Up**, **Move Down**, **Move to Bottom of All Routes**). #### Delete a Routing Rule 1. Navigate to **AIOps** → **Event Orchestration**. 2. Select the **Orchestration** from the list that contains the routing rule you wish to delete. 3. Select **Service Routes**. 4. On the following page, click to the right of your desired routing rule and select **Delete Rule**. 5. In the confirmation modal, click **Delete**. 1. **Note**: This action cannot be undone. ### Manage Service Orchestration Rules There are two places where you can manage Service Orchestration rules: - [In Event Orchestration](#manage-a-service-orchestration-rule-in-event-orchestration) - [On a Service's Settings Tab](#manage-a-service-orchestration-rule-on-a-services-settings-tab) #### Manage a Service Orchestration Rule in Event Orchestration ##### Edit, Disable or Reorder a Service Rule 1. Navigate to **AIOps** → **Event Orchestration**. 2. Select the **Orchestration** from the list that contains the service rule you wish to edit or disable. 3. Select **Service Orchestrations** and select your desired **service** from the dropdown. 4. On the following page: 1. **To edit**: Click to the right of your desired routing rule. In the modal, make any changes to conditions or rule information and click **Save**. 2. **To disable**: Click to the right of your desired routing rule and select **Disable**. The rule is immediately disabled, and appears in the rule's description. To enable the rule again, click and select **Enable**. 3. **To reorder**: Click in the top-right of your desired rule and select an action, as appropriate (e.g., **Move to Top**, **Move Up**, **Move Down**, **Move to Bottom**) ##### Delete a Service Rule 1. Navigate to **AIOps** → **Event Orchestration**. 2. Select the **Orchestration** from the list that contains the service rule you wish to delete. 3. Select **Service Orchestrations** and select your desired **service** from the dropdown. 4. On the following page, click in the top-right of your desired rule and select **Delete**. 5. In the confirmation modal, click **Delete**. 1. **Note**: This action cannot be undone. #### Manage a Service Orchestration Rule on a Service's Settings Tab ##### Edit, Disable or Reorder a Service Rule 1. Navigate to **Services** → **Service Directory** and select your desired **service**. 2. Select the **Settings** tab, scroll to the **Event Management** section and click **Service Orchestration Rules**. 3. On the following page: 1. **To edit**: Click to the right of your desired routing rule. In the modal, make any changes to conditions or rule information and click **Save**. 2. **To disable**: Click to the right of your desired routing rule and select **Disable**. The rule is immediately disabled, and appears in the rule's description. To enable the rule again, click and select **Enable**. 3. **To reorder**: Click in the top-right of your desired rule and select an action, as appropriate (e.g., **Move to Top**, **Move Up**, **Move Down**, **Move to Bottom**) ##### Delete a Service Rule 1. Navigate to **Services** → **Service Directory** and select your desired **service**. 2. Select the **Settings** tab, scroll to the **Event Management** section and click **Service Orchestration Rules**. 3. On the following page, click in the top-right of your desired rule and select **Delete**. 4. In the confirmation modal, click **Delete**. 1. **Note**: This action cannot be undone. ## Send Events to a Global or Service Orchestration ### Send Events to Global Orchestrations 1. Once you have [configured a Global Orchestration](#global-orchestrations), navigate to **AIOps** → **Event Orchestration** → click the **name** of your Global Orchestration. 2. Click **Integrations** to navigate to the **Integrations** section of the Event Orchestration. Each Event Orchestration has the following routing options for each integration key set: - **Integration Key**: You may use the integration key with many of the [tool integrations](/integrations). You may also use it to send events via API (see below). - **Email Address**: You may use the email address with the [Email Integration](/integrations/email-integration-guide). - **HTTP Endpoint for API**: You may use the integration key and the [Events API V2](/developer/send-alert-event) to send events to this endpoint. ### Send Events to Service Orchestrations 1. Add your preferred [tool integration](/incident-management/services/services-and-integrations#add-integrations-to-an-existing-service) or a [Custom Event Transformer integration](/developer/custom-event-transformer) to the service where you configured the above [Service Orchestration rule(s)](#service-orchestrations). 2. Once you have added the integration to your service, you are directed to the Integrations tab. Find the integration that was just added in the list, click to the right and then copy its **Integration Key**. 3. Use this integration key to complete your integration [according to its guide](/integrations), and then send test events to your service. ## Switch to Service Orchestrations If your account has services that are currently using [Service Event Rules](/ai-automation/aiops/rulesets#service-event-rules), you may choose to switch to Service Orchestrations, which is a more robust feature. When you switch to Service Orchestrations, events that land on the service, regardless of source, are evaluated by Event Orchestration instead of Event Rules. > **Note:** Email events are an exception. If an email event comes in via a service-level [email integration](/integrations/email-integration-guide), the Service Orchestration is ignored, and only the [email filters and rules](/integrations/email-integration-guide/email-management-filters-and-rules) are applied. In contrast, if an email comes in on a Global Orchestration, then the Global Orchestration rules are applied, followed by Service Orchestration rules, if present. To switch to Service Orchestrations: 1. Navigate to **Services** → **Service Directory** → and select your desired **service**. 2. Select the **Settings** tab, scroll to **Event Management** and then click **Switch to Service Orchestrations**. The service can be switched back to processing events using Event Rules using the same process. ## Pause Incident Notifications As a feature of Event Orchestration, you can configure rules to create alerts in a **Suspended** state, which pauses incident creation and notifications for a predefined amount of time. During the pause period, new alerts are viewable in the [Alerts Table](/incident-management/incidents/alerts/alerts-table) with a **Suspended** status. You can take one of two actions on a **Suspended** alert: either **Trigger** it, which immediately creates an incident and sends out responder notifications, or **Resolve** it, which prevents the incident and notifications from being created altogether. > **Availability:** Pausing incident notifications is available as part of the [Advanced Event Orchestration](/ai-automation/aiops/event-orchestration/pricing-tiers#advanced-event-orchestration) package. [Contact the Sales Team](https://www.pagerduty.com/contact-us/#contact-sales) if you would like to upgrade to a plan with this feature. > > Pausing incident notifications is only available on incidents generated by the [Events API](/developer/events-api-v2-overview), and does not work with those generated from the [REST API](/developer/rest-api-overview). To configure paused incident notifications: 1. While [configuring a Global or Service Orchestration Rule](#configure-a-global-or-service-orchestration-rule), select the **Incident Data** tab and check the box next to **Pause notifications**. 2. Enter a value (in seconds) for **Suspend alert for \_\_\_ seconds before triggering an incident**. 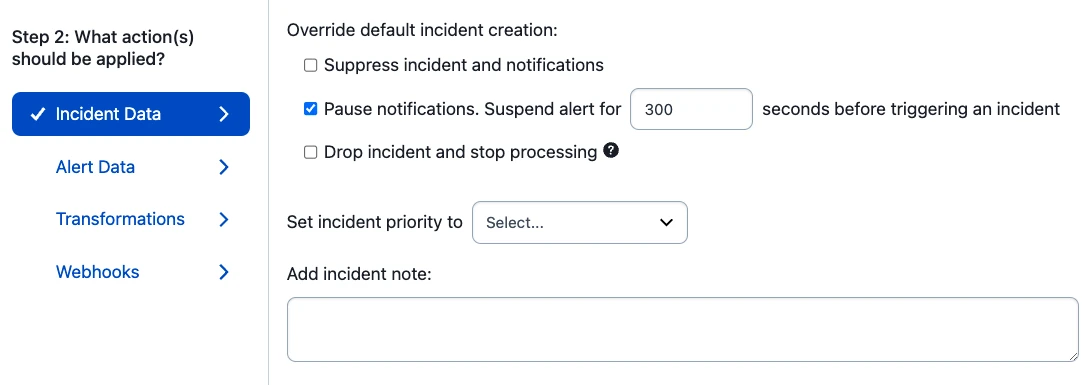 *Select pause notifications* 3. Click **Save**. ### View and Take Action on Paused Alerts To view alerts in a paused state, navigate to the **Alerts** table in the upper menu of the web app. Alerts with paused incident notifications have a **Suspended** status: 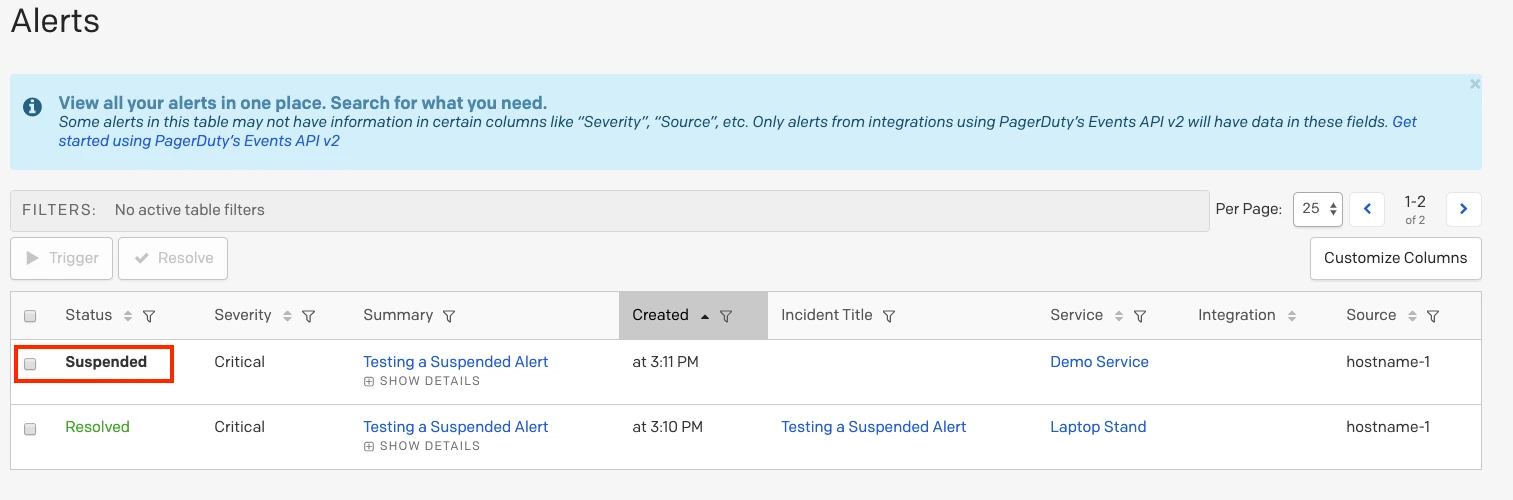 *Suspended alert* To take action on a paused alert: 1. Click the incident **title** to view its details page. 2. On the right hand side, click **Trigger** to trigger an incident and send notifications, or **Resolve** if you would like to resolve the alert without triggering an incident/notifications. You see a green modal that confirms that the alert has been triggered or resolved.  *Alert details* The pause period and action taken also appear in the Alert Log timeline, accessible by clicking an alert's **title** to view the detail page:  *Alert log* ## PagerDuty Condition Language (PCL) You can write your [Global Orchestration](#global-orchestrations), [routing](#routing-rules), or [Service Orchestration rules](#service-orchestrations) in PagerDuty Condition Language (PCL) if you need more control over the logic than the UI offers. Select while [creating](#step-2-create-rules) or [editing](#manage-rules) a rule to access this feature.  *Edit a routing rule using PagerDuty Condition Language (PCL)* For more information and examples, see the developer documentation [PCL Overview](/developer/pcl-overview). ## FAQ **How should I troubleshoot a rule that did not work as expected?** **Ensure the expected action is supported** - Confirm your [subscription plan](/account-admin/account-settings#your-subscription) supports the action you expected. Some Event Orchestration features are only available with AIOps. If relevant, ensure both your Event Orchestration and Service have AIOps enabled. - If you were on an AIOps Trial, verify the trial was active when the event was ingested or the incident was created. **Review the incident timeline** - Check the [incident timeline](/incident-management/incidents/overview#incident-timeline) for any errors or unexpected behavior when the event was processed. Look for skipped actions, error messages, or anything unusual. **Check the alert timeline** - Next, review the alert timeline for more details. The alert timeline can show errors or skipped actions, and provides direct links to the specific Event Orchestration rule that applied (or attempted to apply) an action, so you can jump straight to the rule for further review. **Verify the rule condition** - Carefully review the condition in your [orchestration rule](#step-2-create-rules). Ensure it is accurate and free of typos or special characters (like extra spaces, quotes, or symbols) that could interfere with matching. **Use the Recent Events pane** - Open the Recent Events panel and find the event in question. Note: Only the last 10 accepted events are displayed so you may need to send a test event with the relevant payload. - Compare the event fields and values to your rule's condition. Make sure the field names and values match exactly—any mismatch can prevent the rule from triggering. **Ensure another rule or orchestration has not overwritten your action** - All rules are applied with a "last rule wins" methodology. Any rule in a Service Orchestration can overwrite any discrete actions (all actions other than triggering webhooks or Automation Actions) that were applied in a Global Orchestration. This same behavior applies to child rules within the same orchestration. **What is the difference between Event Rules and Event Orchestration?** Many of the new features in Event Orchestration are enhancements on Event Rules, however, there are also some substantial departures from existing event rule functionality: - With Event Orchestration, rules are now evaluated iteratively. They start with Global Orchestration rules, which define actions to be performed before routing and end with the definition of Service Orchestration rules, allowing individual teams to define their own incident creation behavior at the service level. This is substantially different from the earlier approach, which evaluated Global Event Rules (GERs) and Service Event Rules (SERs) at the same time. This change has allowed PagerDuty to remove both GERs and SERs from Event Orchestration. - As an intentional part of this change, Event Orchestration now also supports evaluation of conditions against either raw or [PD-CEF](/developer/api/pd-cef)-formatted event payloads. - Another substantial change with Event Orchestration is the introduction of different rule types, as well as a rigid rule structuring. This improves observability, ensures context is established when actions are taken, and streamlines rule creation. - Event Orchestration has made improvements to integration key management by adding the ability to migrate integration keys between rulesets and orchestrations as well as the ability to combine multiple integration keys together into a single Event Orchestration, reducing the number of Global Orchestrations and Routers required to ensure events are properly normalized and directed to the right teams. **How many services can an Event Orchestration route to?** You can route events to as many as 1,000 services in one orchestration. However, each service can only have one routing rule. **Can a service have more than one set of Service Orchestration rules?** No, each service can only have one set of Service Orchestration rules (orchestration rule canvas). Here, the same set of orchestration rules is applied to all events that land on the service, which streamlines the Event Management process. **Can events be routed to a service from the Unrouted rule with Event Orchestration?** Yes, selecting a service to route events that do not match with any of the routing rules in an orchestration is possible with Event Orchestration. **Does Event Orchestration support email events?** Yes, Event Orchestration supports email events. Rules may be based on the content of an email by entering the email field as custom details in the event field `event.custom_details.subject`. Having email events as custom fields means email events are treated as CEF events that you can apply [Event Fields](#event-fields) to. **Does Event Orchestration support the "contains/does not contain" filter?** Yes, Event Orchestration supports the "contains/does not contain" filter. It has, however, been reworded and replaced with the "matches part/does not match part" filter. **Are condition values case sensitive with Event Orchestration?** No, condition values with Event Orchestration are case insensitive. **Does Event Orchestration support time-based conditions?** Yes, you can set time-based conditions with Event Orchestrations that avoid trapping events that do not match condition pairs. With Event Orchestration, events outside the set schedule are evaluated by the next rule. To configure more advanced time-based conditions with an `and` operator, you need to edit the [PagerDuty Condition Language (PCL)](#pagerduty-condition-language-pcl) directly. See the section [Advanced Configuration with the `and` Operator](#advanced-configuration-with-the-and-operator) for more information. **Is there a payload size limit for an Event Orchestration?** Yes, the maximum payload size for an Event Orchestration is 4 MB. Orchestrations greater than 4 MB return `413 Payload Too Large` errors and do not save. This limit is most relevant to users who manage Event Orchestration via the [REST API](/developer/api/reference/rest/event-orchestrations/list-event-orchestrations) or with infrastructure-as-code tools, such as Terraform. **How many integrations can be added to an Event Orchestration?** Users can associate up to 10 integrations with one Event Orchestration. --- URL: https://docs.pagerduty.com/ai-automation/aiops/event-orchestration/ai-orchestrations # AI Orchestrations Create Orchestration rules with AI AI orchestrations automatically analyze historical events and incidents and surface recommended rules that reduce noise, improve MTTR, and accelerate automation setup. You can review the expected impact, understand why a recommendation was made, and apply the recommendation. > **Availability:** This feature is only available for AIOps customers, or as Signal Intelligence for PD Reliability Platform customers. Contact your Customer Success Manager or your Account Manager to have it enabled. Learn more about orchestration concepts in [Event Orchestration](/ai-automation/aiops/event-orchestration). ## Access AI Recommendations You can access AI recommendations in two ways: - In **Event Orchestration**, click the **AI Recommendations** tab on the landing page to view a global list of recommendations across all services. - Open the **AI Recommendation** panel from the **Orchestration** page by clicking the **Recommendation** button at the bottom of the screen. ## AI Recommendations Table The **AI Recommendations** table provides a high-level view of all suggestions. The table contains the following columns: | Column | Description | | :------------------------ | :-------------------------------------------------------------------------------------------------------- | | **Service Orchestration** | The name of the relevant service orchestration. | | **AI Recommendation** | A concise AI-generated summary of the proposed rule or a generic summary that does not leverage AI. | | **Tags** | The type of action the rule applies. | | **Impact** | The estimated impact of applying the rule based on historical events and incidents over the past 90 days. | | **Success Rate** | How accurately the rule performed on events in the past 90 days. | | **Date** | When the recommendation was generated. | | **Review** | Opens the recommendation in the related service for detailed review before applying. | > **Note:** AI-generated content can contain errors. Always review the summary for accuracy, staleness, and appropriateness before relying on it. ## AI Orchestration Segment - AI orchestration rules are evaluated in a dedicated segment after all manual global orchestration and service orchestration rules. - Each AI orchestration rule is evaluated regardless of order within the segment. - You can add rules from the **AI Recommendation** panel, and disable or delete them at any time. ## AI Recommendation Panel - Clicking the **Recommendation** button at the bottom of an orchestration opens the AI orchestration segment and displays the **AI Recommendation** panel. - The panel lists recommendation cards that summarize the same details shown in the **AI Recommendations** table to quickly assess priority and relevance. ## Apply or Dismiss Recommendations 1. Click **Review** on a recommendation card to open the rule modal. 2. Review the recommended condition and click **Next**. 3. Review the proposed action and click **Save** to apply the rule. You can adjust conditions and actions to fit your use case. > **Note:** Excessive changes can reduce the effectiveness of the rule. After you save, the rule becomes active and appears in the AI orchestration segment. 4. To decline a recommendation, click **Dismiss**. To improve future recommendations, rate the recommendation as either **Good Recommendation** or **Bad Recommendation**.
--- URL: https://docs.pagerduty.com/ai-automation/aiops/event-orchestration/cache-variables # Cache Variables Event Orchestration Cache Variables Event Orchestration Cache Variables allow you to store event information once events are converted into alerts or incidents. You can then use this stored information in Event Orchestration rules for setting conditions or triggering actions. Using cache variables in this way helps manage scenarios where understanding a system's status, event patterns, or timing is critical for diagnosing issues. There are two ways to store data in variables. Both variable types populate whenever an event matches the conditions assigned to a cache variable: - **Recent event values**: Assign data from an event to a cache variable. - **Count of events**: Number of occurrences of events matching the cache variable’s condition. > **Cache Variables vs. Rule Variables:** Unlike Rule Variables, which are limited to use within a single rule, cache variables can be applied throughout the entire orchestration. For more information on Rule Variables, please refer to our [Event Orchestration](/ai-automation/aiops/event-orchestration#create-custom-rule-variables) article. > **Tip:** Configuring cache variable conditions is an identical process to setting Event Orchestration [rule conditions](/ai-automation/aiops/event-orchestration#step-2-create-rules). ## Configure Event Orchestration Cache Variables > **Cache Variable Usage Limited to Orchestration of Origin:** Cache variables can be set in both Global and Service Orchestrations, but they are only usable within the orchestration in which they were created. ### Step 1: View Cache Variables You can access Event Orchestration cache variables from either the Global Event Orchestration or Service Event Orchestration builders. To view cache variables: 1. In the web app, navigate to **AIOps** → **Event Orchestration** → select an **Orchestration** → then select your desired **Global Orchestration** _or_ **Service Orchestration**. 2. Click **View Cache Variables** in the bottom left. This will expand the **Cache Variables** pane. 3. Any existing cache variables will display in this view. If no cache variables exist yet, you will be able to review some information about creating your first cache variable.  ### Step 2: Create a New Cache Variable To create a new cache variable: 1. Click **+ Variable** to open the cache variable creator modal. 2. Define the conditions that will determine when a cache variable populates with data: 1. **Variable Type**: Select a variable type from the dropdown. This defines what data populates into a cache variable. There are four options for cache variable type, and you can only select one at a time for each cache variable. Choose one of the following options and fill in the required fields: 1. **Event Data (CEF)**: Stores [CEF](/developer/api/pd-cef) data associated with an event in the cache variable. **Note**: If Event Orchestration has altered an event’s data prior to cache variable population, the altered data will be stored in the cache variable. 2. **Raw Data**: Allows you to target information in an event’s raw payload for storage. 3. **Event Count**: Tracks the number of times an event matching the specified cache variable conditions has occurred. 4. **External Data (API / Manual input)**: Allows you to leverage data from external sources to add additional context to orchestration rules. - Choose a **Data Format** to set what type of data (Text String, Number, or Boolean) can be stored in the variable. Please view the table in the [Product Limits](#external-data-variable-content) section for limit information. - Enter your desired **Data Retention** timeframe (in seconds) to set the Time To Live (TTL) for how long the data will be stored for. The TTL timer resets upon each cache variable value update. The configured TTL sets when the data loads and cannot be retroactively changed for existing data. If you update the TTL, it will apply after the next cache variable value update. 3. **Variable Name**: Enter a variable name. This is the display name that will appear in Event Orchestration rules and actions. 4. You may _optionally_ add further conditions by clicking **+ New Condition**. **Note**: Creating conditions for cache variables follows the same process as [creating routing rules](/ai-automation/aiops/event-orchestration#create-a-routing-rule) for Event Orchestration. 5. When you are finished, click **Save**. ### Step 3: Use Your Cache Variable You can use cache variables in either Event Orchestration [rule conditions](/ai-automation/aiops/event-orchestration#step-2-create-rules) or [actions](/ai-automation/aiops/event-orchestration#configure-a-global-or-service-orchestration-rule). > **Cache Variable Duration:** Stored values last for 24 hours, or until they're replaced by a new value. When a new value is set, the 24-hour countdown starts again. #### Use a Cache Variable in a Condition 1. Click **+ New Rule**, **+ Else Rule** or **Nest Rule** to add a new rule, or click to edit an existing rule in an Event Orchestration that contains cache variables. 2. Select **If events match certain conditions** from the condition type dropdown. 3. Assign the cache variable to either the **target** (e.g., `event.summary`) or **value** (i.e., the value being compared to whatever data is stored in the target) portion of the condition: 1. To assign a cache variable to the **target** portion of an Event Orchestration condition: 1. Click the left cell that shows **event** and select **Cache Variable** from the dropdown. This will populate the cell with `cache_var.`, which is how Event Orchestration references cache variables. 2. Type the cache variable name you wish to use after the period in the same cell (e.g., `cache_var.server_status`). 3. Once complete, enter your preferred value in the right cell. 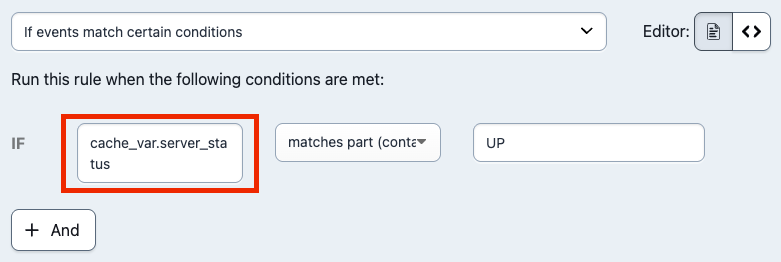 2. To assign a cache variable to the **value** portion of an Event Orchestration condition: 1. Select your preferred target from the right cell and then click into the blank right cell in the condition builder. 2. Type the name of the cache variable you want to reference using the following syntax: `cache_var.your_variable_name`. 3. Click the **\<>** symbol to open the Advanced PCL editor. 4. Remove the ' ' (single quotes) wrapping your cache variable so that the value of the cache variable is evaluated (e.g., change 'cache_var.server_status' to cache_var.server_status). **Note**: You must remove the quotation marks for the cache variable to be evaluated. 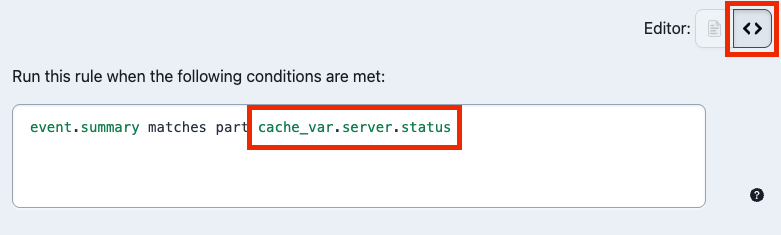 > **Tip:** Using a cache variable in the target portion of a condition means a rule will evaluate `true` or `false` without referencing the data in an event when an event is ingested. This allows you to create a logic gate that activates different branches of an Event Orchestration depending on what data is in a cache variable (e.g., `maintenance_window`, `server_status`, `deployment_status`, etc.). #### Use a Cache Variable in an Action 1. Navigate to the action you wish to reference the cache variable in. Supported actions are: 1. [Add incident note](/ai-automation/aiops/event-orchestration#basic-event) 2. [Replace event fields](/ai-automation/aiops/event-orchestration#event-fields) 3. [Custom Fields](/incident-management/incidents/custom-fields-on-incidents) 4. [Webhooks](/ai-automation/aiops/event-orchestration#webhooks) 2. Add the cache variable to the action using the following syntax: `{{cache_var.your_variable_name}}`. 3. Click **Save**. ## View Event Orchestration Cache Variables 1. In the web app, navigate to **AIOps** → **Event Orchestration** → select an **Orchestration** and then select your desired **Global Orchestration** _or_ **Service Orchestration**. 2. Click **View Cache Variables** in the bottom left to expand the **Cache Variables** pane. 3. To view the current value for a variable, select → **View / edit data**. 4. The current value, if one exists, will appear under **Current Data**. You can also manually add data by clicking **Add Data**. ## Edit Event Orchestration Cache Variables 1. In the web app, navigate to **AIOps** → **Event Orchestration** → select an **Orchestration** and then select your desired **Global Orchestration** _or_ **Service Orchestration**. 2. Click **View Cache Variables** in the bottom left to expand the **Cache Variables** pane. 3. To the right of your desired cache variable, select → **Edit configuration**. 4. Make your desired changes to the cache variable's condition(s) and properties and click **Save**. ## Disable or Delete Event Orchestration Cache Variables > **Disabled and Deleted Cache Variables:** Please be advised that disabling or deleting a cache variable may lead to unexpected behavior if there are any rules that still reference it. When you disable or delete a cache variable, it evaluates as `NULL`. For example, say you create a cache variable `host` and use it in a rule: `cache_var.host` matches `event.host`. After disabling or deleting `host`, the rule would evaluate to `NULL` matches `event.host`. > > As a best practice, please update your Event Orchestration rules before disabling or deleting a cache variable. ### Disable an Event Orchestration Cache Variable 1. In the web app, navigate to **AIOps** → **Event Orchestration** → select an **Orchestration** and then select your desired **Global Orchestration** _or_ **Service Orchestration**. 2. Click **View Cache Variables** in the bottom-left to expand the **Cache Variables** pane. 3. To the right of your desired cache variable, select → **Disable**. 4. In the confirmation modal, click **Disable**. To re-enable a cache variable, select → **Enable**. ### Delete an Event Orchestration Cache Variable > **Deletion is Permanent:** This action cannot be undone, and deleted cache variables cannot be recovered. 1. In the web app, navigate to **AIOps** → **Event Orchestration** → select an **Orchestration** and then select your desired **Global Orchestration** _or_ **Service Orchestration**. 2. Click **View Cache Variables** in the bottom-left to expand the **Cache Variables** pane. 3. To the right of your desired cache variable, select → **Delete**. 4. In the confirmation modal, click **Delete**. ## Product Limits ### Cache Variables per Orchestration - Each Global Orchestration can have 100 cache variables. - Each Service Event Orchestration can have 100 cache variables. - We do not support Cache variables for Service Routes. ### Cache Variable Content | Cache Variable Type | Data Format | Limitations | | --- | --- | --- | | Event Data (CEF) | String | Maximum of 1024 characters | | Raw Data | String | Maximum of 1024 characters | | Event Count | Integer | Maximum value of 1000. **Disclaimer**: A condition referencing a cache variable compared to a value that exceeds the limit of 1000 may lead to unexpected behavior. | ### External Data Variable Content | Data Format | Limitations | | :---------- | :----------------------------------------------------------- | | All Formats | Maximum TTL of 259,200 Seconds (72 Hours) | | String | Maximum of 1024 characters | | Number | Value must be between -9007199254740991 and 9007199254740991 | ### Cache Variable Accuracy Cache variables will process in order in a best-effort manner. Although it is expected that updates to the variables will be handled in FIFO order, this cannot be guaranteed when multiple updates occur in less than 1 second. ## FAQ **Can you use a cache variable created in a Global Orchestration as part of a Service Orchestration?** No. You can only reference cache variables in the Event Orchestration they were created for. For example, if you'd like to pass data from a Global Orchestration to a Service Orchestration, consider using a `custom_details` Event Field. Please read [Event Fields](/ai-automation/aiops/event-orchestration#event-fields) for more information. **Can you view historical values for a cache variable?** We do not currently support viewing historical cache variables, however this functionality is on our roadmap. **What happens if a cache variable value exceeds 1024 characters?** Cache variable data will truncate to fit the 1024 character limit. **Can non-string types be converted to strings?** Cache variables use [PagerDuty Condition Language (PCL)](/developer/pcl-overview), identical to Event Orchestration rules, and will attempt to interpret data in its correct format. If that process fails, it will interpret data as a string. **What is the maximum value an Event Count variable can be?** There is no maximum value for an event count variable. The maximum time range for an event count variable is 24 hours. **What happens if two cache variables in the same Event Orchestration have the same name?** It is not possible to create two cache variables with the same name in the same Event Orchestration. If you attempt to do this, you will receive an error message. **How can I tell what the current value of a cache variable is?** The current cache variable value can be [viewed](#view-event-orchestration-cache-variables) in the cache variables drawer portion of the Event Orchestration UI. Additionally, users can leverage the [variables API](/developer/api-changelog) to get the current value of a cache variable. **Is the Event Orchestration Cache Variables API supported?** Yes, there is [API support](/developer/api-changelog) for cache variables. In addition, support for cache variables with Terraform is on our roadmap. --- URL: https://docs.pagerduty.com/ai-automation/aiops/event-orchestration/examples # Examples of Event Orchestration Event Orchestration Examples [Event Orchestration](/ai-automation/aiops/event-orchestration) is a highly customizable suite of features and capabilities. The examples on this page are taken from real-world customer use cases, which you are welcome to replicate in your own PagerDuty account. - [Create Rules for Complex Alert Grouping](#create-rules-for-complex-alert-grouping) - [If Events Match Certain Conditions](#if-events-match-certain-conditions) - [On a Recurring Weekly Schedule](#on-a-recurring-weekly-schedule) - [Advanced Configuration with the `and` Operator](#advanced-configuration-with-the-and-operator) - [Capture Unrouted Trigger Events](#capture-unrouted-trigger-events) - [Standardized Triage](#standardized-triage) - [Notification Management for Specific Incidents](#notification-management-for-specific-incidents) - [Route Alerts with Dynamic Service Routes](#route-alerts-with-dynamic-service-routes) - [Automated Remediation for Specific Incidents](#automated-remediation-for-specific-incidents) - [Disable System Auto Resolve for High Priority Incidents](#disable-system-auto-resolve-for-high-priority-incidents) - [Track Event Spikes with Cache Variables](#track-event-spikes-with-cache-variables) - [Track Heartbeat Events with Cache Variables](#track-heartbeat-events-with-cache-variables) ## Create Rules for Complex Alert Grouping Leverage Event Orchestrations to stamp structured metadata onto events, then use [Content-Based Alert Grouping](/ai-automation/aiops/noise-reduction/alert-grouping/content-based-alert-grouping) to group alerts that share that metadata. This enables sophisticated grouping scenarios that are difficult to express with default fields alone. In this example, you: - Add a rule in Global or Service Orchestration that sets a custom detail only when your grouping conditions are met. You can extract dynamic values with a rule variable (regex) or stamp a static flag. - Configure Alert Content or Intelligent + Alert Content grouping on a service to group alerts based on that custom detail. Grouping is evaluated after Global and Service Orchestration rules complete. ### Step 1: Create the Orchestration Rule 1. In your desired orchestration, create a new rule. Use a **Global Orchestration** if the scenario applies across many services; otherwise use a **Service Orchestration**. 2. Under **When should this rule be applied?**, select **If events match certain conditions**. 3. Define the event field values that indicate you want alerts to group (for example, specific sources, components, error codes, or text in `event.summary`). Click **Next**. - Optionally, click **Create rule variable** and use regex to extract a value from an event field that you want to group by (for example, a shard ID embedded in `summary`). 4. Under **Event Fields**, create or set a custom details event field, for example: `custom_details.advanced_grouping`. - If you created a rule variable in step three, set `custom_details.advanced_grouping` to the variable value. - Alternatively, set a static value like `TRUE` to flag matching events for grouping. > **Tip:** Choose a custom details name that does not already exist in your payload, so it is only set when your rule runs. Grouping does not occur on fields with a `NULL` value. 5. Click **Save** to apply the rule. 6. If you have more than one scenario, repeat steps one through five with additional rules as needed. ### Step 2: Configure Content-Based Alert Grouping 1. Navigate to **Alert Grouping** settings for the relevant service via the **Service Directory** or the **Noise Reduction** homepage. 2. Select the service(s) where you want these settings applied. 3. Choose **Alert Content** or **Intelligent + Alert Content** as your grouping mode. 4. Under **Select Fields**, choose **Custom Details**. 5. In the field name input, enter the custom details key you set in your orchestration rule (for example, `advanced_grouping`). 6. Click **Save**. ### Step 3: Validate and Tune - Trigger test events that meet your rule conditions and confirm that `custom_details.advanced_grouping` is present and correctly valued on the resulting alerts. - Verify that alerts with the same value for this field are grouped as expected on the service. - Iterate on your regex extraction or conditions to avoid over- or under-grouping. ## If Events Match Certain Conditions In this example, you [create a routing rule](/ai-automation/aiops/event-orchestration#create-a-routing-rule) that routes events to a service when matching conditions are met. 1. [Create a routing rule](/ai-automation/aiops/event-orchestration#create-a-routing-rule) and, under **When should events be routed here?**, select **If events match certain conditions**. 2. Indicate the event conditions you would like the orchestration to match using one of the following methods: | Method | Description | | :------------------------------- | :------------------------------------------------------------------------------------------------------------------------------------------------------------------------------------------------------------------------------------------------------------------------------------------------------------------------------------------------------------------------------------------------------------------------------------------------------------------------------------------------------------------------------------------------------------------------------------------------------------------------------------------------------------------------------------------------------------------------------------------------------------------------------------------------------------------------------------------------------------------------------------------------------------------------------------------------------------------------------------------------------------------------------------------------------------------------------------------------------------------------------------------------------------------------------------------------------------------------------------------------------------------------------------------------------ | | Base conditions on incoming JSON | Depending on your account's activity, recent events may appear on the right side of the screen if events have been sent to the incoming event source. View these events to determine which values to use. | | Events sent through the API | Use the JSON field names directly (for example, `summary`). For nested fields, separate names with a dot (`.`) (for example, `payload.taskid`). If you are sending data through additional fields, enter them exactly as they are sent to PagerDuty. For example, if your events have a **tags** field, enter that field name in your rule condition as `tags`. | | Events sent through email | **Note**: The following functionality only works when you send emails to a [global email integration address](/ai-automation/aiops/event-orchestration#send-events-to-global-orchestrations). It will not work for emails sent directly to a service-level email integration. Rules may be based on the content of an email by entering the appropriate email field as custom details in the event field. The email subject is used as a default deduplication key — emails with the same subject line are automatically deduplicated. To change this behavior, add a custom deduplication key with an orchestration rule action. The most common email fields are: `event.custom_details.from[0]` (the from address), `event.custom_details.subject` (the subject line), and `event.custom_details.plain_body` (the email body). The `[0]` refers to the first position in a list of emails. To generally search through a list of emails in the **to** or **from** field, enter `event.custom_details.from` or `event.custom_details.to`. \*\*For email-generated events, `event.summary` is populated with the same value as `event.custom_details.subject` by default. However, these are separate fields and their values may differ based on customer-specified configurations. | 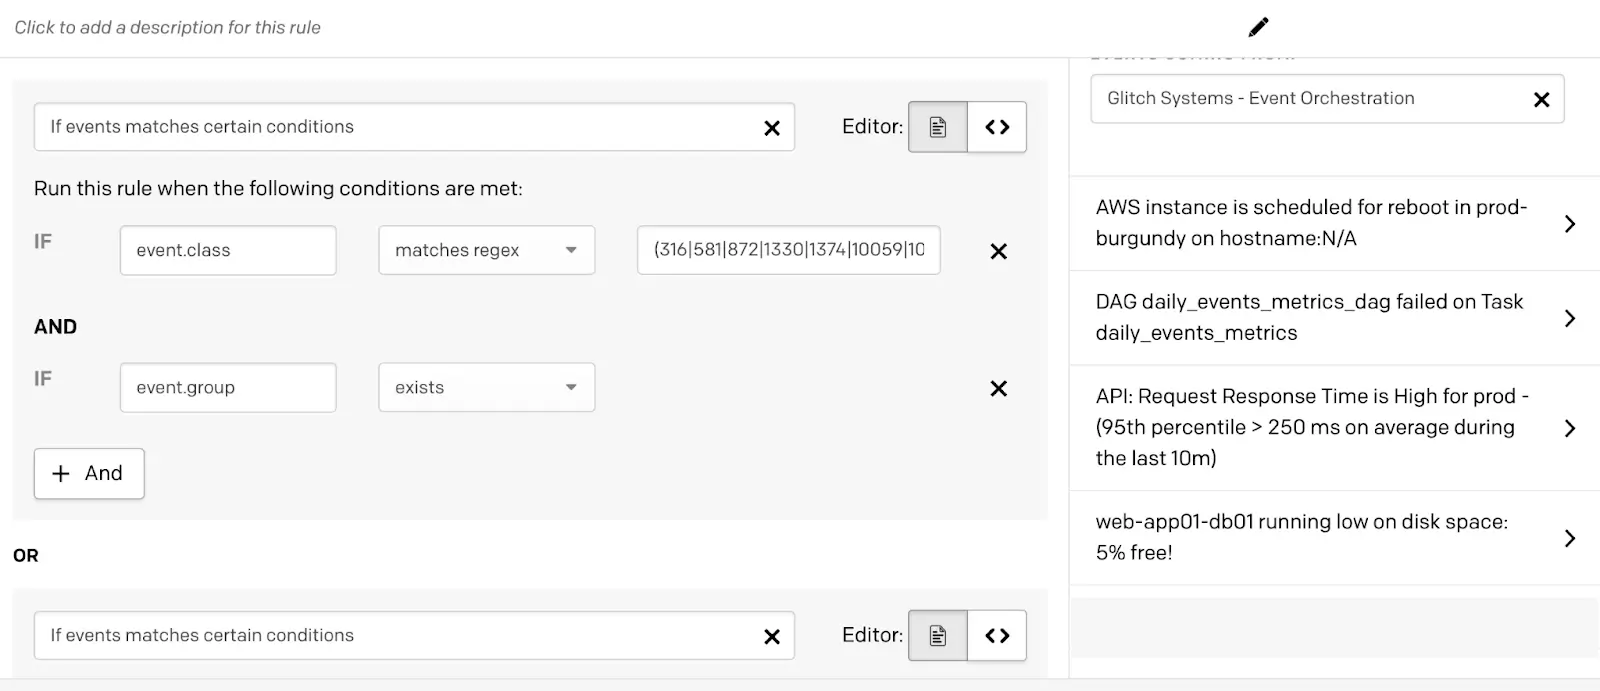 *Configure Routing Rule* 3. In the **middle dropdown**, select how the event should be filtered. | Filter Option | Description | | :----------------------------------- | :---------------------------------------------------------------------------------------------------------------------------------------------- | | matches part / does not match part | The field contains or does not contain a value. | | matches / does not match | The field equals or does not equal a value. This operation requires the field to be passed in as a string. | | exists / does not exist | The field exists or does not exist. | | matches regex / does not match regex | The field matches or does not match a regular expression. Regular expressions must use [RE2 syntax](https://github.com/google/re2/wiki/Syntax). | > **Negative Operations:** Rules with negative operations — such as **does not contain** or **does not equal** — will match events that do not contain your specified value and events that do not contain the field at all. For example: > > - `severity field does not equal critical` — this will match events where the severity field does not equal `critical` and events that do not contain a severity field at all. > > To avoid this, add an additional condition that matches only when the field exists. For example, when all conditions are true: > > - `severity field exists` > - `severity field does not equal critical` > > You must select **all conditions must be true** for the rule to match. 4. In the **second value** field, enter the value that should be met from the payload. This can be a string or regular expression. > **Case Sensitivity:** Condition values in Event Orchestrations are case-insensitive. For example, if a condition is set with `Summary` matches part `DOWN`, this will match if the `Summary` contains `Down`, `down`, and other variations of the word. 5. When additional conditions should be added, use the following options: - **+ And**: Additional conditions must be met. - **+ New Condition**: Create another set of conditions that must be met. A new condition block creates an `OR` operator of conditions that will also be evaluated alongside other blocks. 6. Click **Save** to save your configuration. > **Condition Limits:** You can create up to 25 condition blocks within a rule, and up to 64 operators (i.e., `AND`, `OR`), or a maximum of 2,048 bytes (for example, if you are using [PCL](/ai-automation/aiops/event-orchestration#pagerduty-condition-language-pcl)) in a single condition block. ## On a Recurring Weekly Schedule > **Availability:** Scheduled conditions are available with [Advanced Event Orchestration](/ai-automation/aiops/event-orchestration/pricing-tiers#advanced-event-orchestration). In this example, you [create a routing rule](/ai-automation/aiops/event-orchestration#create-a-routing-rule) that routes events to a service on a weekly recurring schedule. 1. [Create a routing rule](/ai-automation/aiops/event-orchestration#create-a-routing-rule) and, under **When should events be routed here?**, select **On a recurring weekly schedule**. 2. Enter appropriate times for **Start** and **End**, select your preferred **Days of the week**, and select your **Timezone**. 3. Click **Save**. ## Advanced Configuration with the `and` Operator > **Availability:** Scheduled and threshold conditions are available with [Advanced Event Orchestration](/ai-automation/aiops/event-orchestration/pricing-tiers#advanced-event-orchestration). This example details how to edit PCL to create an advanced condition that the UI does not natively support. If you select one of the following options for **When should events be routed here?**, the UI does not offer a way to set an `and` condition: - **On a recurring weekly schedule** - **During a scheduled date range** - **Depends on event frequency** You can work around this by directly editing the [PagerDuty Condition Language (PCL)](/ai-automation/aiops/event-orchestration#pagerduty-condition-language-pcl). For example, to route events to a service when the following conditions are met: - The event's `source` matches `mainframe`. - It is Wednesday or Sunday between 11:00 a.m. and 12:00 p.m. Eastern. The following PCL statement meets these conditions: `event.source matches 'mainframe' and now in Wed,Sun 11:00:00 to 12:00:00 America/New_York` ## Capture Unrouted Trigger Events Orchestration service routes include a [catch all rule](/ai-automation/aiops/event-orchestration#catch-all-rule) for events that do not match the configured rules. The default behavior creates a suppressed alert from unrouted trigger events; however, you can route these events to a specific service instead. To support event [deduplication](/ai-automation/aiops/event-orchestration#deduplication) across all services, the orchestration can resolve any open alert previously created when a matching `dedup_key` exists, regardless of which service the open alert belongs to. In this example, you [create a routing rule](/ai-automation/aiops/event-orchestration#create-a-routing-rule) that uses trigger events to create incidents on a catch all service. 1. [Create a routing rule](/ai-automation/aiops/event-orchestration#create-a-routing-rule) and, under **What service should events route to?**, select the service you would like to use as a catch all for these events. 2. Under **When should events be routed here?**, select **If events match certain conditions**. Configure the following condition: - If `event.event_action` matches part (contains) `trigger` 3. Click **Save**. 4. If necessary, [reorder](/ai-automation/aiops/event-orchestration#edit-or-disable-a-routing-rule) the rule so that it is directly above the default catch all rule.  *Routing Rule for Trigger Events* This configuration raises the visibility for trigger events that do not match existing routing rules while also preserving the default resolve behavior described above. ## Standardized Triage > **Availability:** Global Orchestrations, incident suppression, and variables are available with [Advanced Event Orchestration](/ai-automation/aiops/event-orchestration/pricing-tiers#advanced-event-orchestration). Use Global Orchestration rules to standardize the triage process across your entire organization. 1. Create a [Global Orchestration](/ai-automation/aiops/event-orchestration#global-orchestrations). You will send your events to the orchestration's integration. 2. Create an [Event Count Cache Variable](/ai-automation/aiops/event-orchestration/cache-variables#configure-event-orchestration-cache-variables). You can use this to count the number of specific events received within a designated timeframe. 3. Create a rule with an event condition to suppress any known false positive events: 1. Under **When should events be routed here?**, select **If events match certain conditions**. 2. Define a condition that will match your false positive events. For example, if `event.summary` matches part (contains) `[No error]`. Click **Next**. 3. Under **What action(s) should be applied?**, select **Suppress incident and notifications**. 4. Click **Save**. 4. Create an **Else** rule with an event condition to evaluate the current cache variable count: 1. Under **When should events be routed here?**, select **If events match certain conditions**. 2. In the field selector, choose **Cache Variable** and add your cache variable's name. Configure your desired threshold for when an incident should be created. For example, if `cache_var.myEventCount` is greater than or equal to `2`. Click **Next**. 3. Under **What action(s) should be applied?**, choose your desired priority and/or severity level for these incidents. 4. Click **Save**. 5. Create a final **Else** rule to set a lower priority and/or severity for incidents that do not pass the event count threshold set in the previous rule: 1. Under **When should events be routed here?**, select **Always (for all events)** and click **Next**. 2. Under **What action(s) should be applied?**, choose your desired priority and/or severity level for these incidents. 3. Click **Save**. 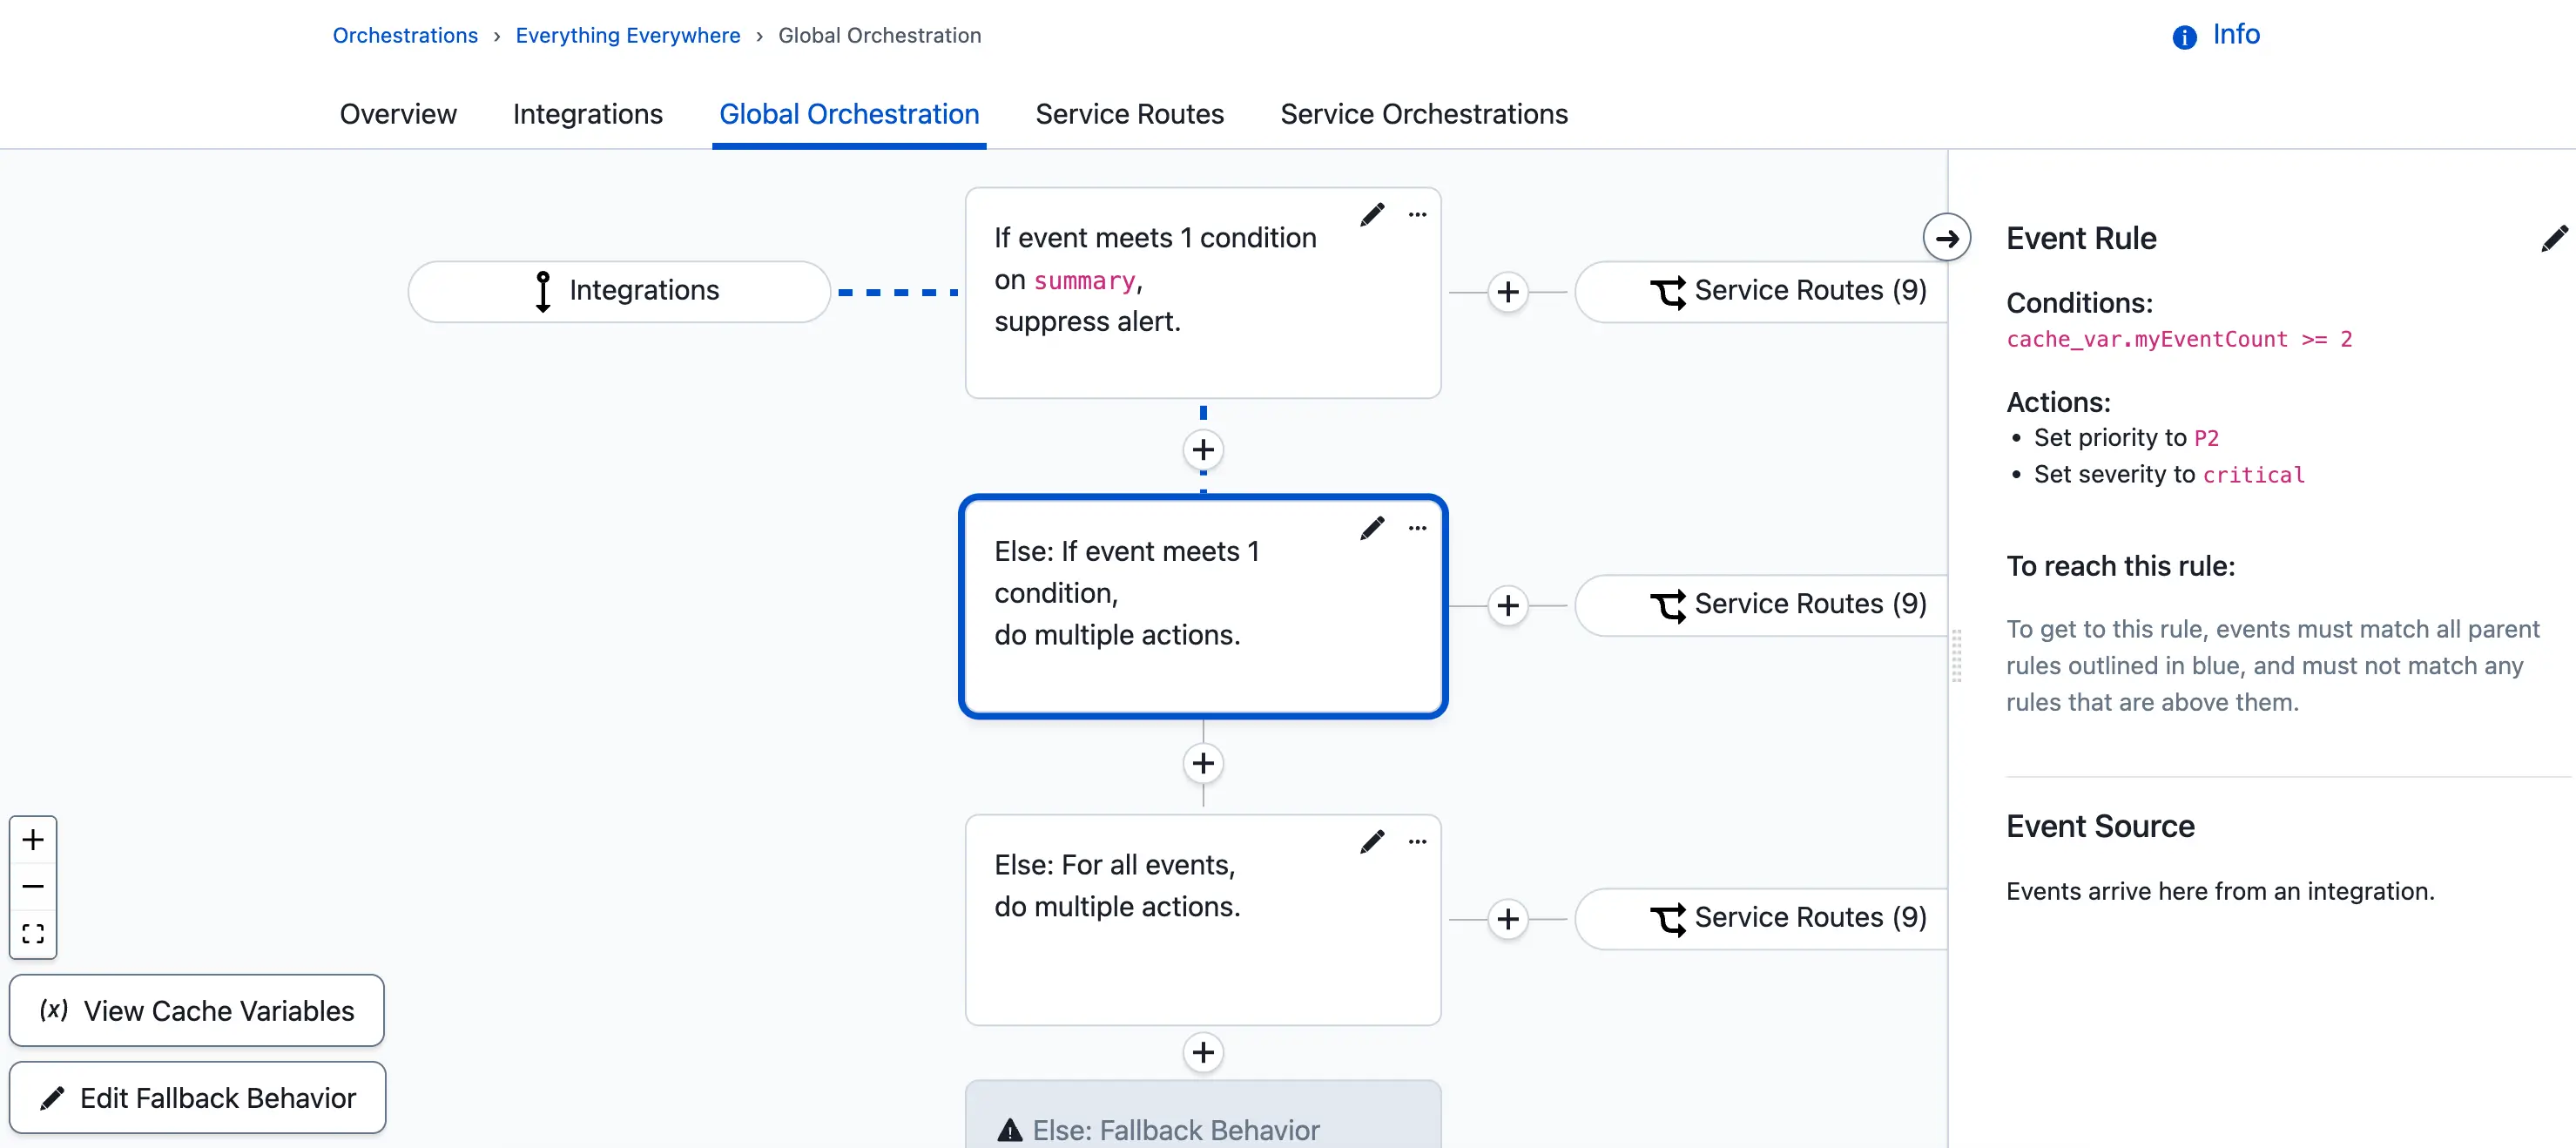 *Standardized Triage Example* With this configuration in place, any event sent to the global orchestration is evaluated by these rules. If the event is a false positive and matches the condition set in step three, it is automatically suppressed and does not create an incident. If the event does not meet that condition, it increments the cache variable count, is routed to a service, and creates an incident on that service. The current event count for the cache variable determines whether the incident has a high or low priority and/or severity. ## Notification Management for Specific Incidents > **Availability:** Dynamic Escalation Policy Assignment is available with [Advanced Event Orchestration](/ai-automation/aiops/event-orchestration/pricing-tiers#advanced-event-orchestration). Leverage Dynamic Escalation Policy Assignment to notify a Subject Matter Expert (SME) instead of the current on-call user when an incident requires a specific skill set to resolve. 1. Create an [escalation policy](/incident-management/schedules/escalation-policies#create-an-escalation-policy) with the SME user in the first level. - If the SME should be on-call 24/7, add them as a [user target](/incident-management/schedules/escalation-policies#escalation-targets). Otherwise, create a [schedule](/incident-management/schedules/schedule-basics#create-a-schedule) to define the hours the user should be on-call. 2. In your global orchestration, create the following rule: 1. Under **When should events be routed here?**, select **If events match certain conditions**. 2. Define a condition that will match events indicating a specific SME should be notified instead of the current on-call user. For example, if `event.summary` matches part (contains) `Database error`. Click **Next**. 3. Under **What action(s) should be applied?**, locate **Override service's assigned escalation policy with this policy** and select your desired escalation policy from the dropdown. 4. Click **Save**. 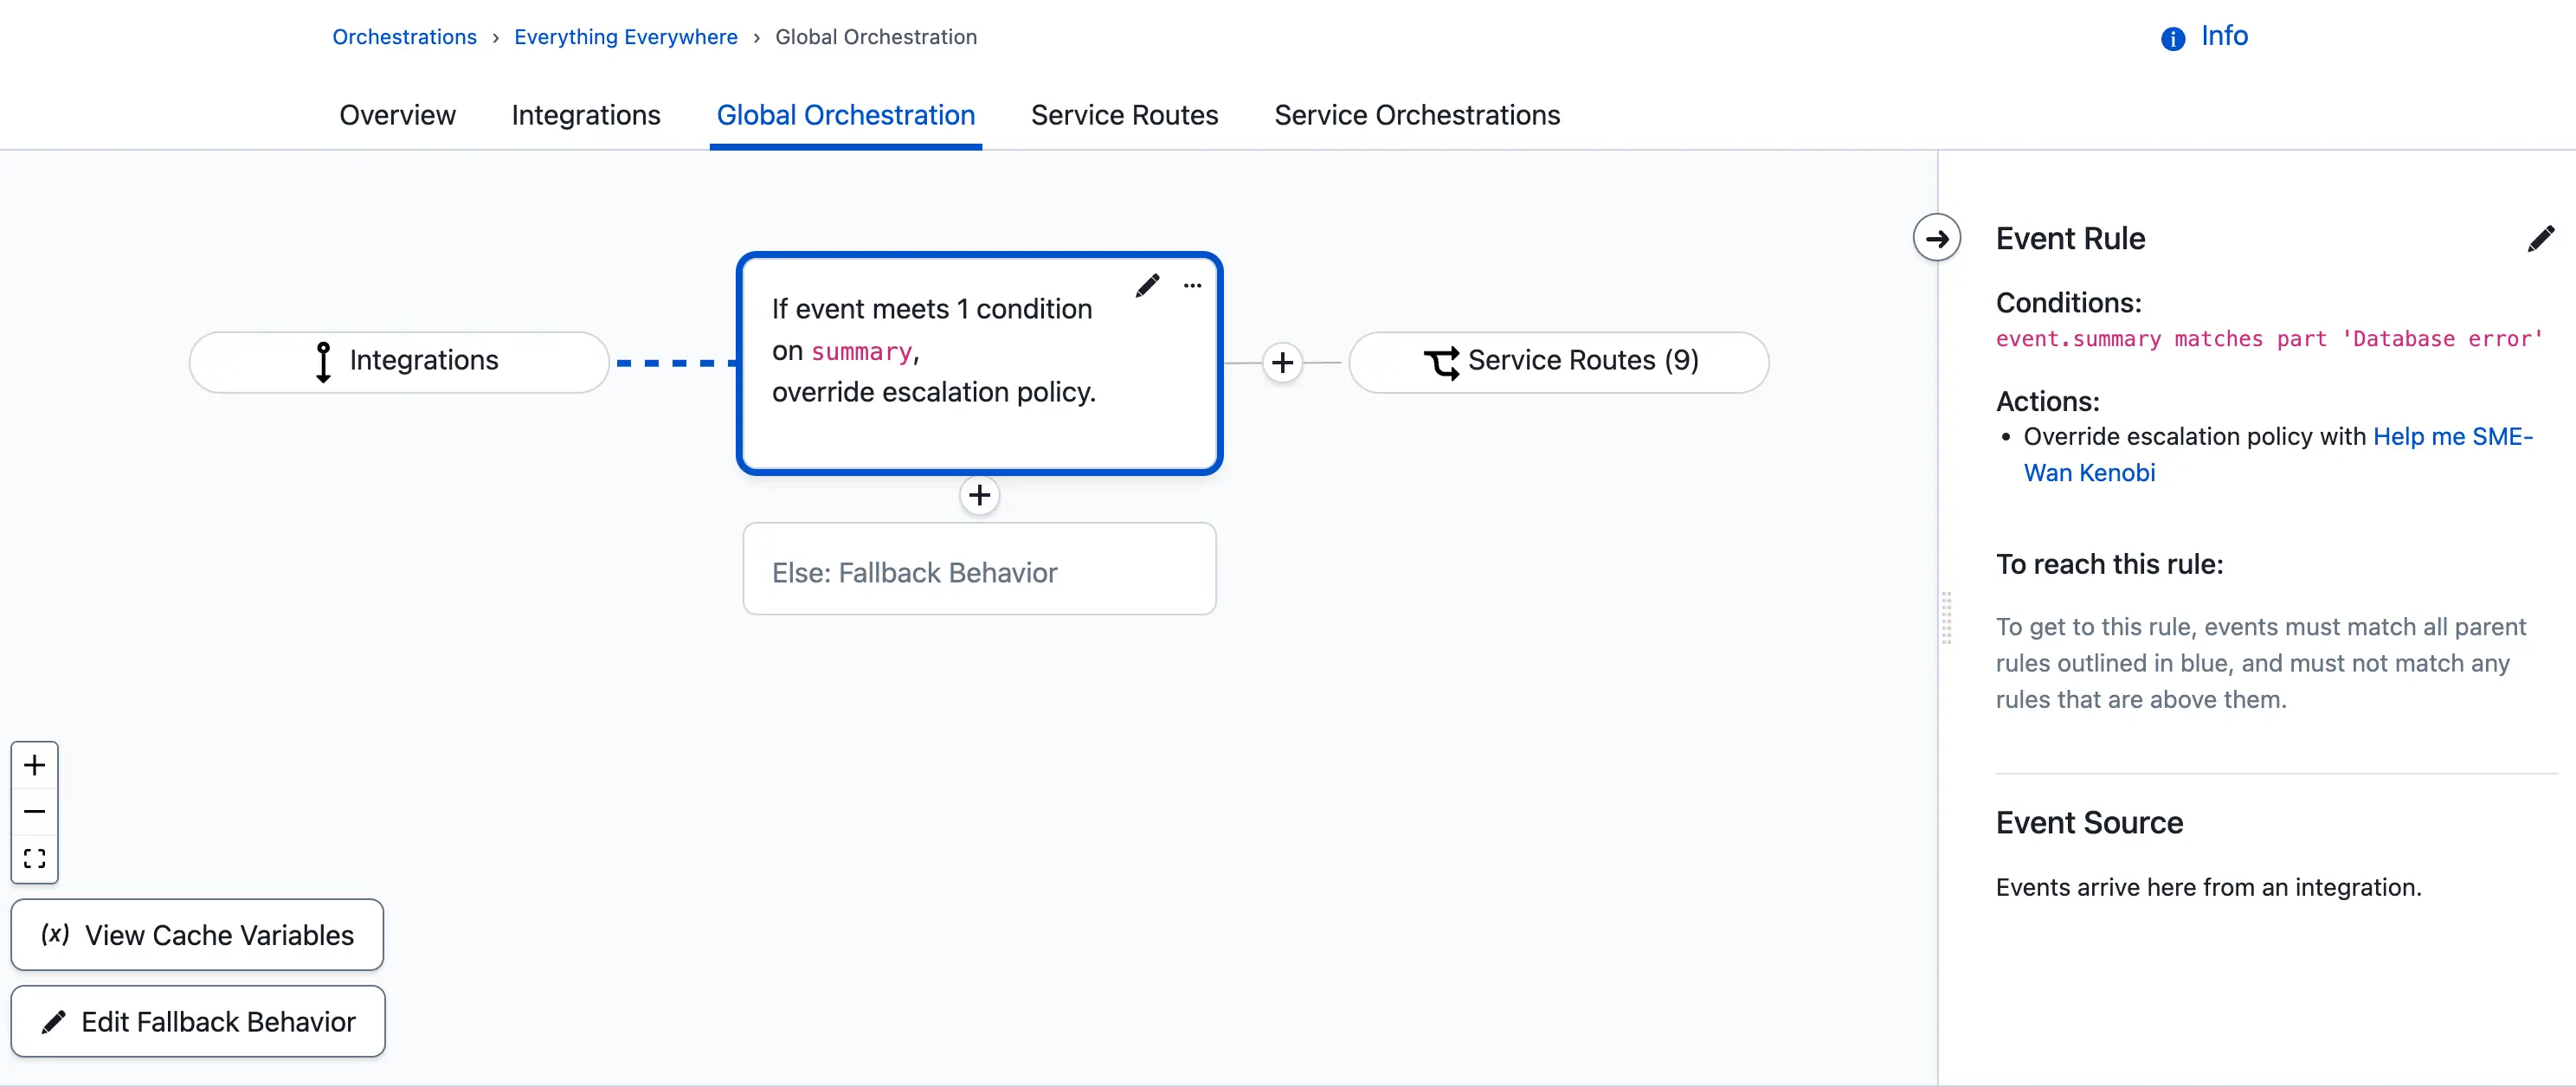 *Override Escalation Policy with SME* When the orchestration receives an event that matches the condition, the selected escalation policy is used for the incident, regardless of which service the event is routed to. ## Route Alerts with Dynamic Service Routes > **Availability:** Dynamic routing, dynamic field enrichment and extraction, and variables are available with [Advanced Event Orchestration](/ai-automation/aiops/event-orchestration/pricing-tiers#advanced-event-orchestration). Use Global Orchestrations to standardize the event format and automatically route events to the correct service with a dynamic routing rule. A dynamic routing rule evaluates all events and does not have conditions. Instead, dynamic routing rules route events to services based on the **Service name** or **Service ID** included within the payload. If service details are not included in your initial payload, you can update the payload with dynamic field enrichment and extraction. 1. In your global orchestration, create a rule with the following actions: 1. Create a [rule variable](/ai-automation/aiops/event-orchestration#create-custom-rule-variables) and use regex to extract the desired value from an event field. 2. Create an [event field](/ai-automation/aiops/event-orchestration#event-fields) (for example, `custom_details.service_route`) and use the rule variable you created to set the value. 2. In your global orchestration, navigate to the **Service Routes** tab. 3. Create a new [dynamic route](/ai-automation/aiops/event-orchestration#create-a-dynamic-routing-rule) and enter the event field you created in step one.  *Dynamic Routing Rule* When the orchestration receives an event with a valid service name in the event field, it automatically routes it to that service. The event can be processed further by the service's orchestration rules if desired. ## Automated Remediation for Specific Incidents > **Availability:** This example uses Automation Actions, which are available on PD Reliability Platform plans, as well as Business, Enterprise for Incident Management, and Digital Operations (Legacy) plans. > > Accounts must have the PagerDuty Automation Actions add-on and [Advanced Event Orchestration](/ai-automation/aiops/event-orchestration/pricing-tiers#advanced-event-orchestration). > > [Contact the Sales team](https://www.pagerduty.com/contact-sales/) if you are interested in [PagerDuty AIOps](/ai-automation/aiops/overview), or [fill out this form](https://www.pagerduty.com/contact-us/automation-actions/) if you are interested in Automation Actions. You can pause notifications and suspend alerts for a set duration while simultaneously triggering a remediation automation with an [Automation Action](/ai-automation/automation/automation-actions). If the automation successfully resolves the issue, an incident will not trigger. If the pause duration expires without a resolution, the incident will trigger as normal. Configure this within a service orchestration by following the steps below. 1. In your service orchestration, [create a rule](/ai-automation/aiops/event-orchestration#configure-a-global-or-service-orchestration-rule) with your desired conditions. 2. Under **Basic Event**, enable **Pause notifications**. Enter a value (in seconds) for **Suspend alert for \_\_\_ seconds before triggering an incident**. Set a pause duration long enough for your entire automation to complete. 3. Under **Automation** → **Automation Actions**, enable **Use Automation Actions if an event reaches this rule**. 4. For **When should we run this Action?**, select **Automatically when Alert is suspended/paused**. 5. For **Automated Action**, select your configured [Automation Action](/ai-automation/automation/automation-actions). 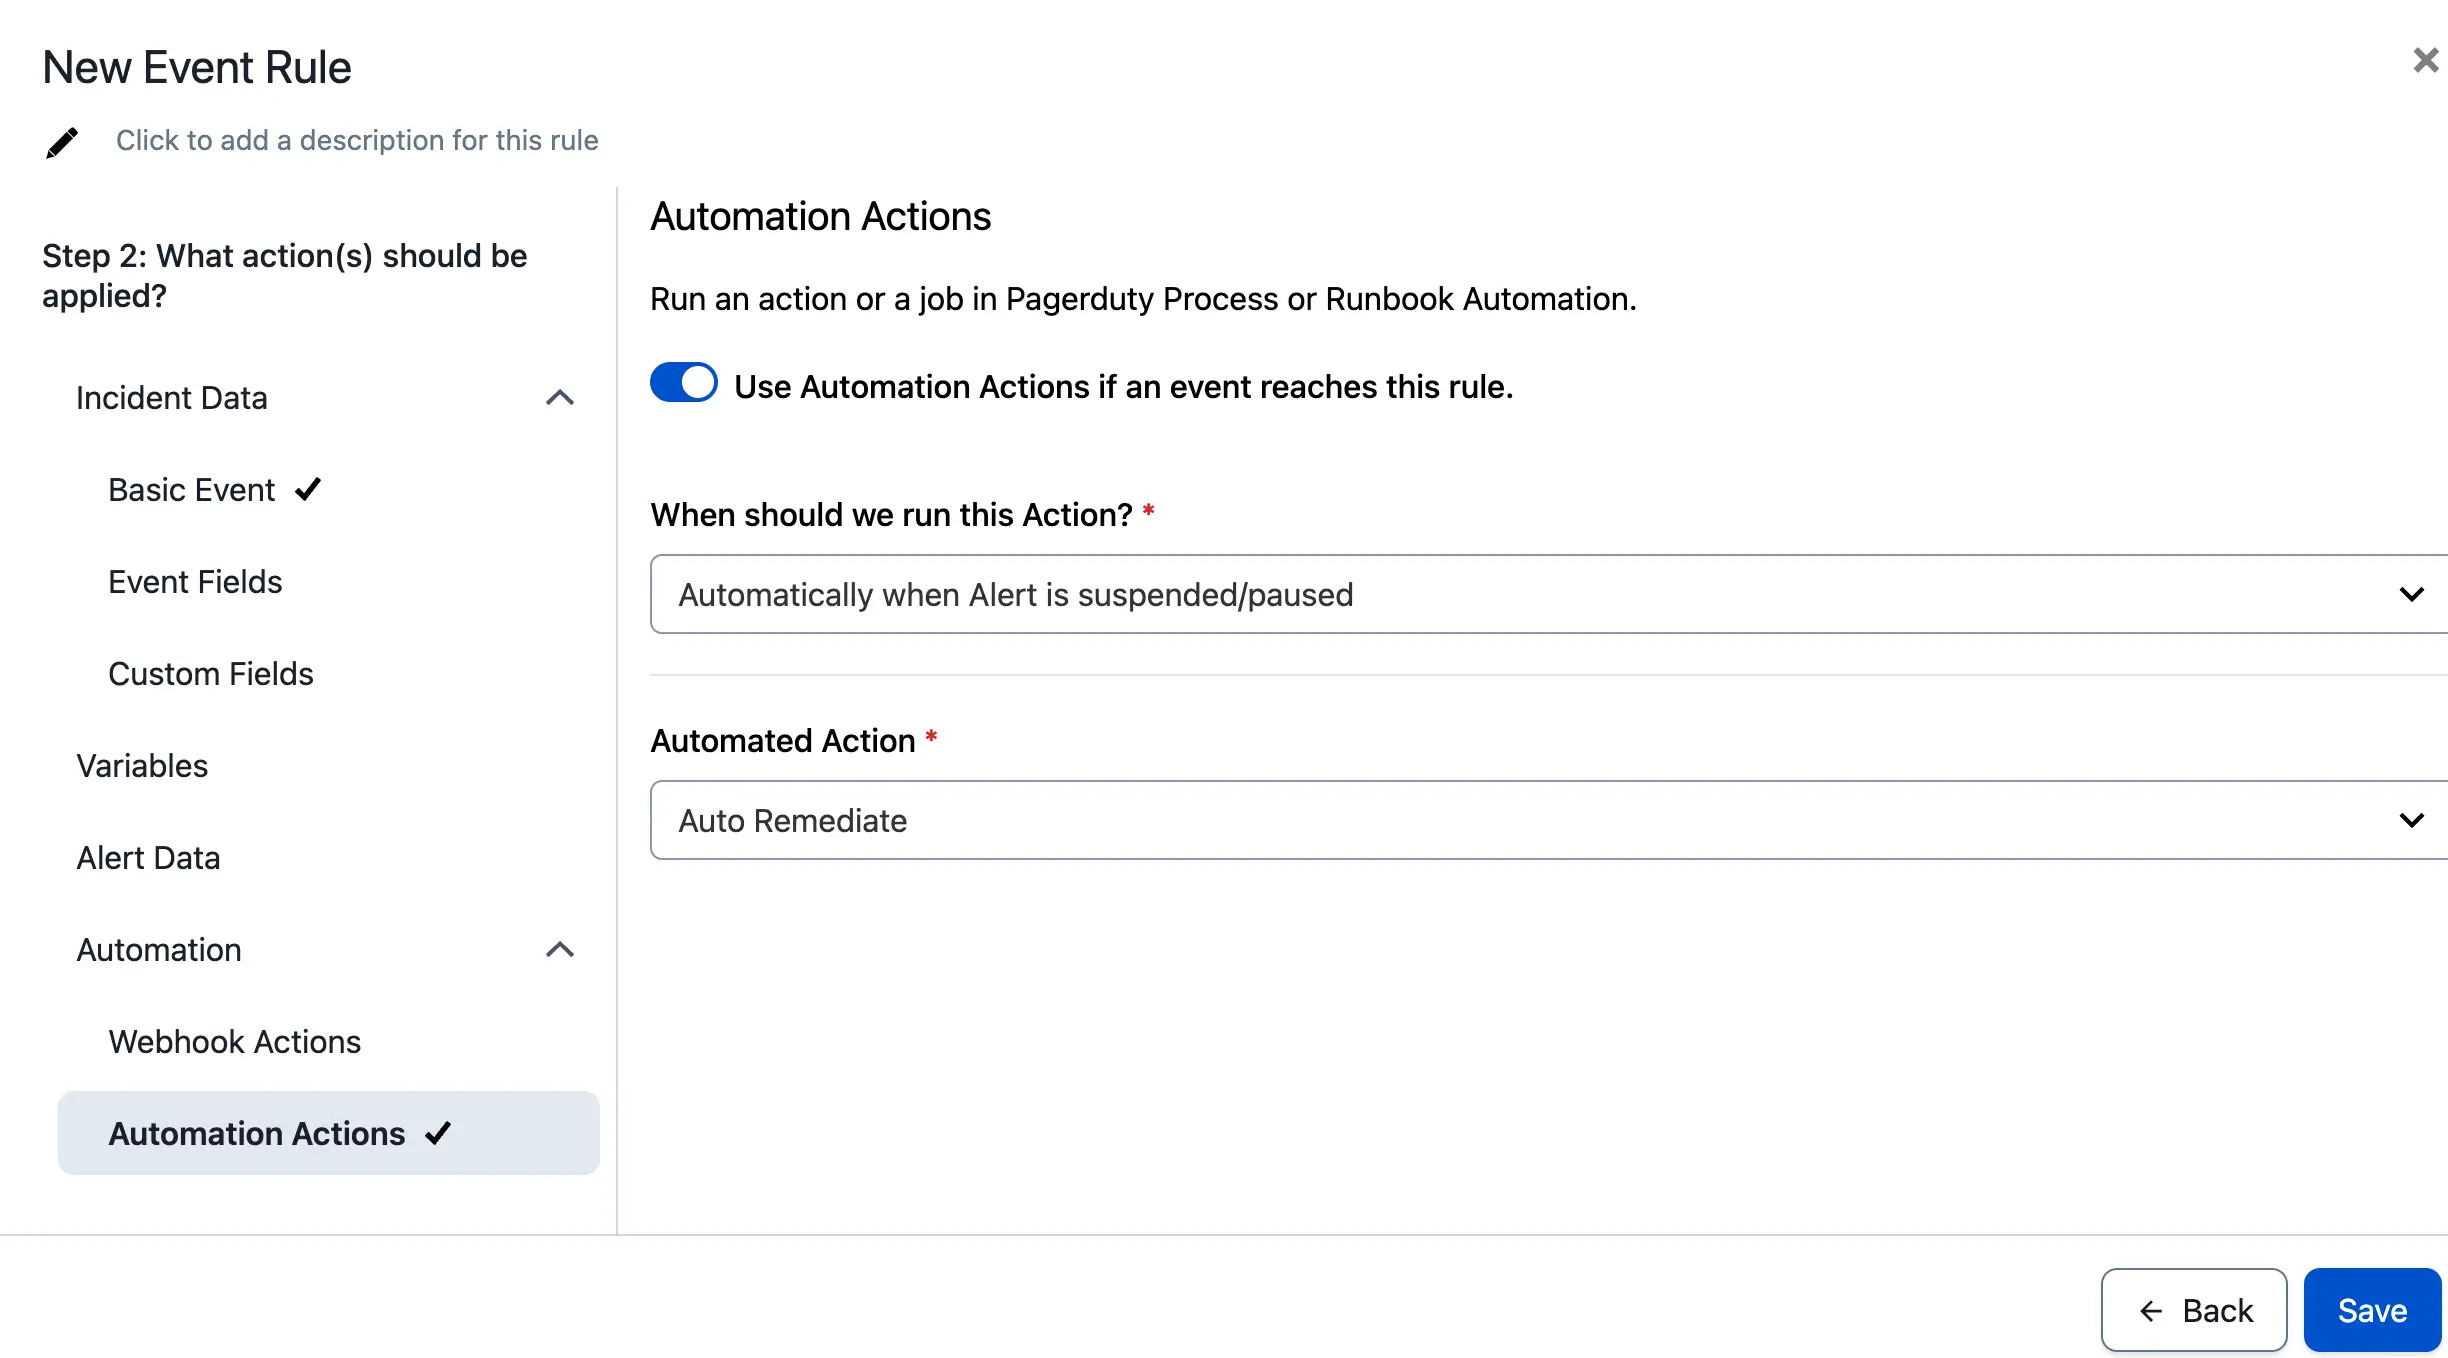 *Configured Actions for Auto Remediation* ## Disable System Auto Resolve for High Priority Incidents Ensure a human — not an automated system event — is responsible for resolving all high priority incidents by automatically blocking resolve events for specific incidents. 1. Create a [Custom Field](/incident-management/incidents/custom-fields-on-incidents#create-a-custom-field), which will use event data in the incident workflow. 2. Create a [Cache Variable](/ai-automation/aiops/event-orchestration/cache-variables#step-2-create-a-new-cache-variable) in your desired orchestration: 1. For **Type**, choose **External Data**. 2. For **Data Format**, choose **Text String**. 3. Within your orchestration, create a new rule with the following: 1. In **Step 1: When should this rule be applied?**, select **If events match certain conditions**. - Using the Cache Variable you created, create the following condition using the Advanced PCL condition editor: `not cache_var.your_new_cache_variable matches part event.dedup_key` 2. In **Step 2: What action(s) should be applied?**, select **Custom Fields** → **Add Custom Incident Field**. - Under **Custom field to set**, select the Custom Field you created earlier. For **Replace with value**, enter `event.dedup_key`. 3. Click **Save**. 4. Create an **Else** rule with the following: 1. In **Step 1: When should this rule be applied?**, select **Always (for all events)**. 2. In **Step 2: What action(s) should be applied?**, select **Alert Data**. Enable the **Always trigger an alert** option. 3. Click **Save**. 5. Create an [Incident Workflow](/ai-automation/automation/incident-workflows#create-an-incident-workflow) to prevent auto resolves for matching incidents: 1. Click **Add Trigger** and select **Conditional trigger**. Configure the trigger as follows: - **When should this Workflow start?**: Select **When conditions are met**. - Create the following condition using the Advanced PCL condition editor: `incident.priority matches 'P1' and not incident.custom_fields.your_custom_field == ''` - Click **Save**. 2. Click **Add Action**. Select **Append to a Cache Variable value** and follow the steps in the [Workflow Actions article](/workflow-actions/pagerduty-aiops/append-to-a-cache-variable-value) to configure this action. Enter your custom field in the **Value** field. 6. Create a second Incident Workflow to remove the Cache Variable's current value once the incident is resolved: 1. Click **Add Trigger** and select **Conditional trigger**. Configure the trigger as follows: - **When should this Workflow start?**: Select **When conditions are met**. - **All of the following conditions must be met**: Create two conditions: - `Status matches Resolved` **and** - `Resolve Reason does not match merge` - Click **Save**. 2. Click **Add Action**. Select **Remove from a Cache Variable value** and follow the steps in the [Workflow Actions article](/workflow-actions/pagerduty-aiops/remove-from-a-cache-variable-value) to configure this action. Enter your custom field in the **Value** field. ## Track Event Spikes with Cache Variables > **Availability:** [Cache Variables](/ai-automation/aiops/event-orchestration/cache-variables) and threshold conditions are available with [Advanced Event Orchestration](/ai-automation/aiops/event-orchestration/pricing-tiers#advanced-event-orchestration). Use Cache Variables to count events over a rolling time window and an event orchestration rule to trigger an incident when the count exceeds your defined threshold. ### Step 1: Create a Cache Variable 1. In your orchestration, click **View Cache Variables**. 2. In the Cache Variables side panel, click **+ Variable**. 3. For **Variable Type**, select **Event Count**. 4. Enter a descriptive **Name**, for example: `event_spike_threshold`. 5. For **Count matching events over the last**, enter the window you want to count events with a maximum of `86400` (24 hours). Choose a duration that reflects your normal event cadence. 6. For **When should this variable be updated?**, select **Always (for all events)**. 7. Click **Save**. > **Tips:** - Shorter windows (for example, 60–300 seconds) help detect bursty spikes; longer windows (for example, 1,800–3,600 seconds) help detect sustained increases. > - You can create multiple Event Count variables per service (for example, five-minute and one-hour windows) to differentiate burst from sustained noise. ### Step 2: Create the Orchestration Rule 1. In your orchestration, add a new rule in a position where it will be evaluated and not suppressed by a subsequent rule. If you use suppression rules, place the spike detection rule before them or ensure your suppression logic will not catch spike events. 2. Under **When should this rule be applied?**, select **If events match certain conditions**. 3. In the field selector, choose **Cache Variable** and add your variable (for example, `cache_var.event_spike_threshold`). 4. In the operator dropdown, select **is greater than**. 5. Enter the spike **Threshold** value — the number of events within your window that should trigger an incident (maximum `999`). Pick a value aligned to your normal event volume and the duration you defined. 6. Click **Next**. 7. Under **What action(s) should be applied?**, select your desired actions. Common choices include: - **Always trigger an alert** to ensure an incident is created. - **Priority** and/or **Severity** to elevate visibility (for example, `P2` and `critical`). - **Custom Fields** or **Tags** (for example, `spike_detected: true`, `window_seconds: 300`, `threshold: 50`). 8. Click **Save**. After saving, generate test traffic or replay sample events to verify that the count crosses your threshold as expected. Review the resulting incidents and Event Analytics to confirm the rule's usefulness, then adjust the time span and threshold to balance sensitivity and noise. > **Important:** - If you use additional rules that suppress alerts, verify ordering so the spike detection rule is not negated by later suppression. > - Thresholds should be tuned to reduce false positives — start higher and step down as you observe behavior. ## Track Heartbeat Events with Cache Variables Event Orchestration can use Cache Variables and webhooks to track heartbeat events for AIOps accounts. If an orchestration does not receive a heartbeat within the user-defined window (maximum 4 hours), it creates an incident. This flow works as follows: - First event: create and suspend → - Next event on time: resolve previous, save new key as cache variable → - Missed event: resume alert, open incident, do not auto-resolve. To track heartbeat events, you need to create two cache variables, an orchestration rule to resolve alerts, and an if/else rule to capture your first heartbeat event. ### Step 1: Create Two Cache Variables 1. Create an Event Data Cache Variable: 1. Create a Cache Variable using **Event Data (CEF)** and name it accordingly. 2. Extract the `dedup_key` field from the current event. 3. Set the condition for events where `event.event_action` matches `trigger`. 2. Create an Event Count Cache Variable: 1. Create a Cache Variable using **Event Count** and name it accordingly. 2. Set the duration for your desired heartbeat time window (for example, 300 seconds). 3. Set the condition for events where `event.event_action` matches `trigger`. ### Step 2: Create an Orchestration Rule to Resolve Alerts 1. Add Conditions: 1. Set the Event Data Cache Variable to `exists`; and 2. Set the Event Count Cache Variable >= 1; and 3. Set `event.event_action` matches `trigger`. 2. Add Action: 1. Suspend the alert for the desired heartbeat time window **+ five seconds** (for example, 305 seconds). The additional time is a buffer to allow the webhook to resolve the previous alert. 2. Create a webhook: 1. Under **Automation** → **Webhook Actions**, trigger a webhook **Automatically when Alert is suspended/paused**. 2. Enter a **Name** for the action. 3. Add the webhook URL: `https://events.pagerduty.com/v2/enqueue` 4. Add the following **Body fields**: - `routing_key`: copy the integration key from your Event Orchestration - `dedup_key`: `{{EVENT DATA CACHE VARIABLE NAME}}` - `event_action`: `resolve` - Additional fields may be required depending on the routing rules within the Event Orchestration, so that the event lands on the correct service to resolve the alert. This is not required if the Event Orchestration has Global Dedup configured. ### Step 3: Create an If/Else Rule to Capture the First Heartbeat Event 1. Add Conditions: 1. Set `event.event_action` matches `trigger`; and 2. Set the Event Count Cache Variable \< 1. 2. Add Action: 1. Suspend the alert for the desired heartbeat time window **+ five seconds** (for example, 305 seconds). ### Summary On the first heartbeat, there is no alert to resolve, so the alert is suspended and its `dedup_key` is stored in the Event Data Cache. For each subsequent heartbeat that arrives within the time window, the previous alert is resolved via webhook using the last `dedup_key`, then the new `dedup_key` is saved to the cache variable. If a heartbeat is missed, the previously suspended alert resumes and opens an incident, and the Event Count Cache ensures that this incident is not auto-resolved by any later missed events. --- URL: https://docs.pagerduty.com/ai-automation/aiops/event-orchestration/pricing-tiers # Pricing Tiers Event Orchestration Pricing Tiers Event Orchestration has two pricing tiers that come with their own set of features and actions: - [Basic Event Orchestration](#basic-event-orchestration) - [Advanced Event Orchestration](#advanced-event-orchestration) ## Basic Event Orchestration All pricing plans have access to Basic Event Orchestration features. Basic Event Orchestration comes with the following: | Feature Suite | Features | Pricing Plan Availability | | :---------------------- | :----------------------------------------------------------------------------------- | :------------------------ | | **Event Orchestration** | - Service Event Orchestrations
- Service Routing
- Global Integration Keys | All Plans | | **Incident Actions** | - Set Priority
- Add a Note | All Plans | | **Alert Actions** | - Set Severity
- Custom Trigger/Resolve Actions | All Plans | ## Advanced Event Orchestration Advanced Event Orchestration includes all features in [Basic Event Orchestration](#basic-event-orchestration), plus additional features in the table below. Contact the [Sales team](https://www.pagerduty.com/contact-us/) if you are interested in changing your pricing tier. | Feature Suite | AIOps | Legacy plans: Event Intelligence/Digital Operations | | :--------------------------------- | :------------------------------------------------------------------------------------------------------------------------------------------------ | :------------------------------------------------------------------ | | **Global Event Orchestration** | Available | Not available | | **Event Orchestration** | - Rule Nesting
- Scheduled/Recurring/Threshold Conditions
- Variables
- Dynamic Routing
- Dynamic Escalation Policy Overrides | - Rule Nesting
- Scheduled/Recurring/Threshold Conditions | | **Incident Actions** | - Suppress Incident
- Pause Incident
- Drop Incident | - Suppress Incident
- Pause Incident | | **Event Fields** | Dynamic Field Enrichment and Extraction | Dynamic Field Enrichment and Extraction | | **Runbook Automation Self-Hosted** | Event-driven automation with PagerDuty Automation (requires add-on) | Event-driven automation with PagerDuty Automation (requires add-on) | | **Webhooks** | Available | Available |
--- URL: https://docs.pagerduty.com/ai-automation/aiops/event-orchestration/recombining-rules # Recombining Rules Modify connections between Orchestration rules Create [Orchestrations](/ai-automation/aiops/event-orchestration) that reduce redundant rules and improve user experience by enabling multiple rules to recombine back into a single rule. ## Connect Mode You can manage connections between rules by using Connect Mode. While in Connect Mode, the ability to add or modify rule conditions and actions is disabled. > **Requirement:** Connect Mode requires at least two rulesets. A ruleset is defined as the vertical group of connected "Else" rules. > > In other words, you must have at least one nested rule to use Connect Mode. 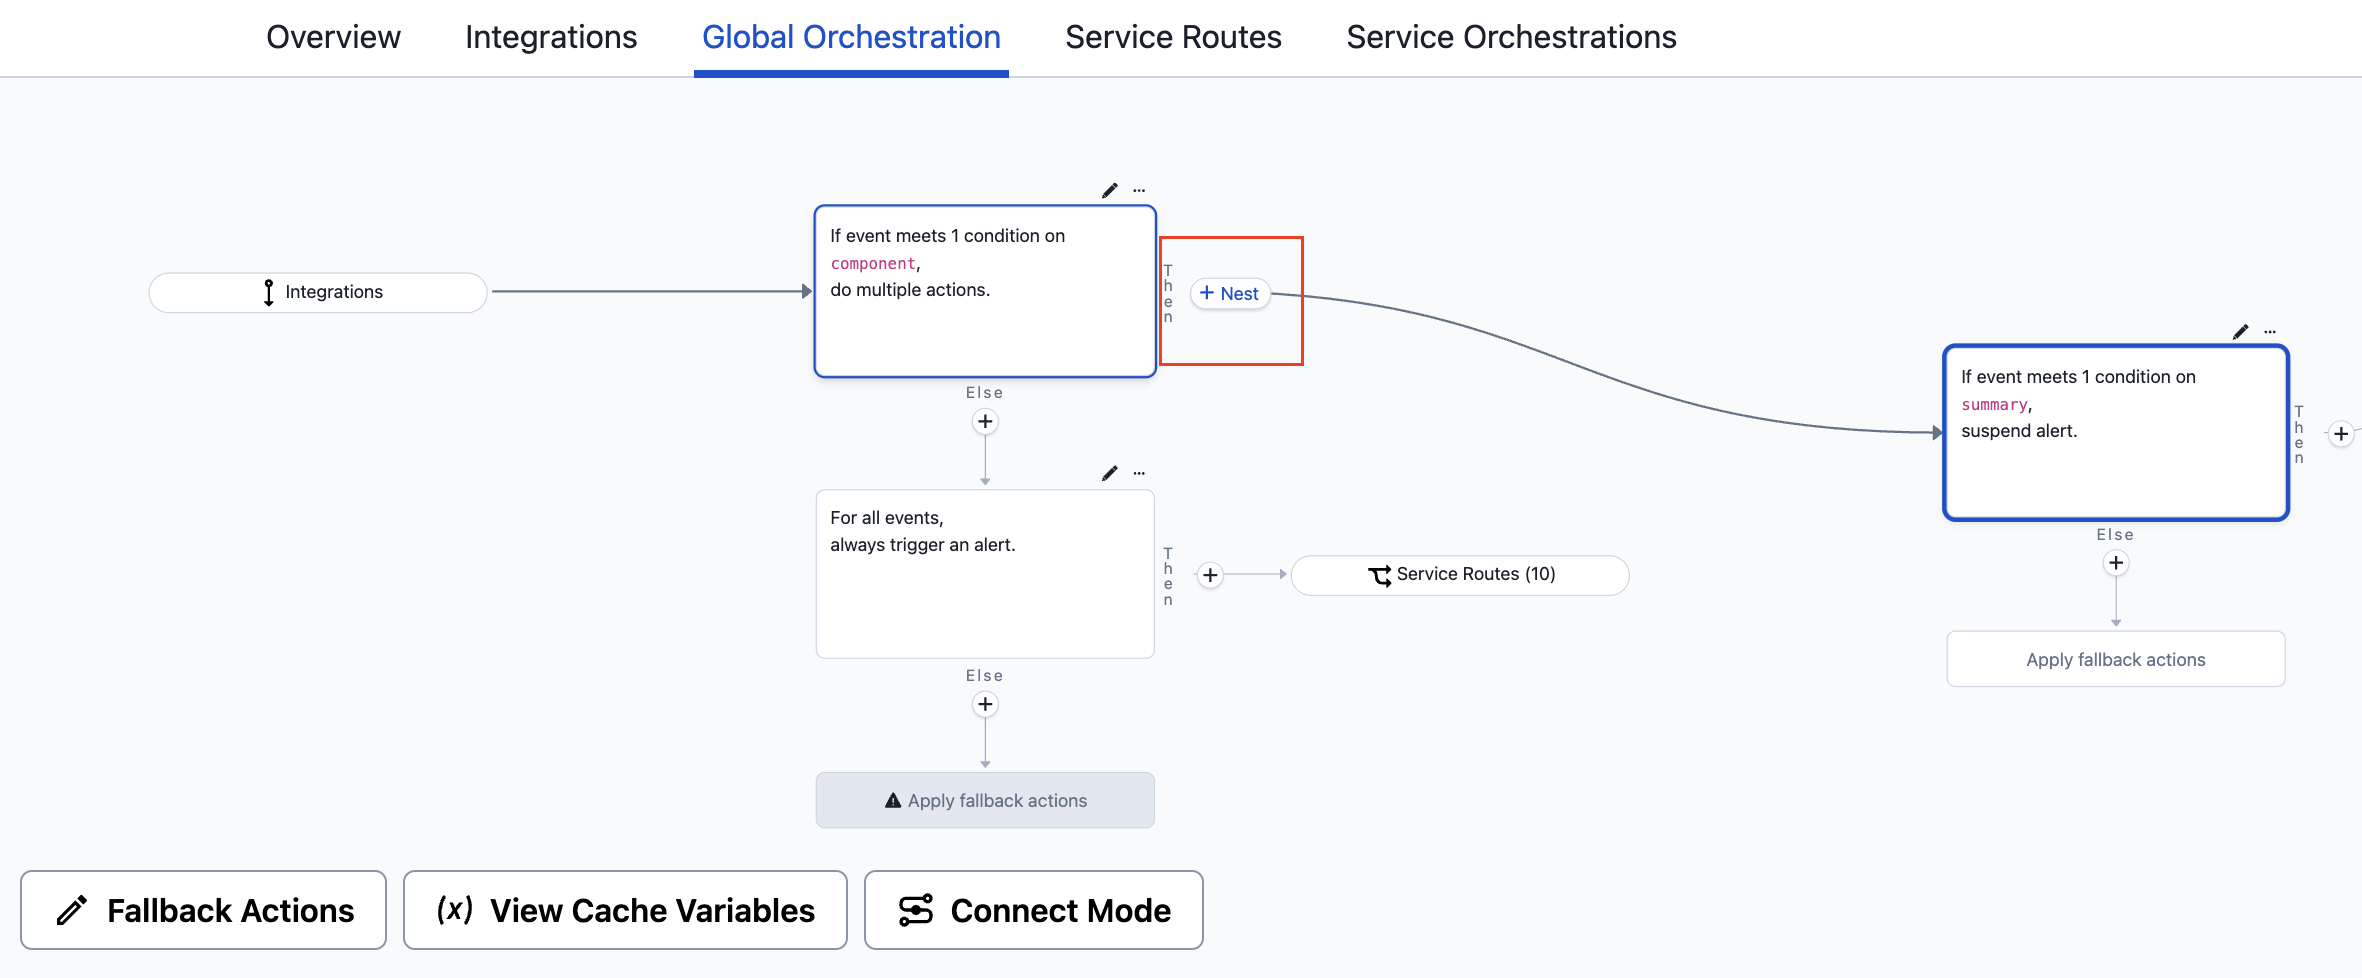 *A nested rule in an Orchestration* To modify rule connections, enter Connect Mode by following the steps below: 1. Navigate to your desired Orchestration: 1. For **Service Orchestrations**: Navigate to **Services** → **Service Directory** → and select your service. Select the **Settings** tab and scroll down to **Event Management** and select **View Event Orchestration Rules**. 2. For **Global Orchestrations**: Navigate to **AIOps** → **Event Orchestration** and select your Orchestration. Select the **Global Orchestration** tab. 2. Click **Connect Mode** at the bottom of the Orchestration. In Connect Mode, sets can be dragged around using the cursor to help with arranging rules. After you click **Save**, the rules are automatically moved to a structured grid. > **Save Conflicts:** If you try to save changes made in Connect Mode after another user or automation makes changes to the Orchestration's rules, you see a prompt informing you of the conflict. > > You must discard your changes to receive the latest updates. ### Create Connections To create a new rule connection: 1. Click the circular node on the right side of the rule. This highlights all valid connections. 2. Click the highlighted node of the desired rule you want to connect with. This creates a new connection. You can also click and then drag your cursor to the desired rule's node to create a connection. 3. Once you are finished with making connections, click **Save**. ### Delete Connections To remove an existing rule connection: 1. Click the desired connection line. 2. Click to delete the connection. If the deleted connection was the only connection to a set of rules, an Unconnected Set is created. You must connect all Unconnected Sets before saving your updates. --- URL: https://docs.pagerduty.com/ai-automation/aiops/legacy-event-intelligence # Legacy Event Intelligence Migrate to AIOps for expanded feature set Legacy Event Intelligence was an add-on that was priced per user license and came with a limited feature set. This product is still available to existing Event Intelligence customers, but has not been available to new customers since April 11, 2023. > **PagerDuty AIOps:** [PagerDuty AIOps](/ai-automation/aiops/overview) is the next generation of Event Intelligence. It is priced by event consumption and it has an expanded feature set. Legacy Event Intelligence users may continue using Event Intelligence, or migrate to PagerDuty AIOps. ## Legacy Event Intelligence Features Legacy Event Intelligence shares features that have been moved to PagerDuty AIOps. These features include: - [Intelligent Alert Grouping](/ai-automation/aiops/noise-reduction/alert-grouping/intelligent-alert-grouping) - [Content-Based Alert Grouping](/ai-automation/aiops/noise-reduction/alert-grouping/content-based-alert-grouping) - [Time-Based Alert Grouping](/ai-automation/aiops/noise-reduction/alert-grouping/time-based-alert-grouping) - [Auto-Pause Incident Notifications](/ai-automation/aiops/noise-reduction/auto-pause-incident-notifications) - [Past Incidents](/ai-automation/aiops/past-incidents) - [Related Incidents](/ai-automation/aiops/related-incidents) - [Outlier Incident](/ai-automation/aiops/outlier-incident) - [Probable Origin](/ai-automation/aiops/probable-origin) - [Change Events](/ai-automation/aiops/recent-changes) - [Event Orchestration](/ai-automation/aiops/event-orchestration) - [PagerDuty Automation Actions](/ai-automation/automation/automation-actions) - [Visibility Console](/incident-management/incidents/visibility-console) The features above will still be maintained, but Legacy Event Intelligence users will not receive new features or updates. Updates will apply to PagerDuty AIOps only. Please contact our [Sales team](https://www.pagerduty.com/contact-us/) about migrating to PagerDuty AIOps. --- URL: https://docs.pagerduty.com/ai-automation/aiops/migrate-to-event-orchestration # Migrate to Event Orchestration Migrate in preparation for Event Rules' upcoming end-of-life (EOL) **[Event Rules](/ai-automation/aiops/rulesets) webpages reached end-of-life (EOL) on January 31, 2025**. PagerDuty made this decision to ensure that it dedicates resources toward building the most robust and reliable event-driven enrichment and automation experience for customers. [Event Orchestration](/ai-automation/aiops/event-orchestration), the evolution of Event Rules, is currently available and is the best way for you to compress rule volumes, improve noise reduction, and more effectively automate well-understood, manual work. Event Orchestration has the same features as Event Rules and it uses the same, heavily tested backend architecture. > **Recommendation:** **PagerDuty highly recommends that you migrate to Event Orchestration as soon as possible so you can take advantage of the new functionality, such as improved UI, rule creation, APIs and Terraform support, advanced conditions, and rule nesting.** ## Migration Options You have several migration options, which are detailed below: - [Service Integration Key Migration](#service-integration-key-migration) - [REST API Migration](#rest-api-migration) - [Global Integration Key Migration](#global-integration-key-migration) - [Push-Button Rule Migration](#push-button-rule-migration) ### Service Integration Key Migration With Service Integration Key migration, you can direct your events towards existing Service Orchestration rules without having to change or update integration keys. No architecture is changed in this switch, so you do not need to change any integrations to PagerDuty. All of your events sent to a service will automatically start flowing through to Event Orchestration instead of Event Rules. To migrate your service integration keys: 1. Before performing this migration, it is recommended that you [create Event Orchestration rules for the service](/ai-automation/aiops/event-orchestration#configure-event-orchestration). If no Service Event Orchestration exists, then the default behavior is for events to trigger their event action as they normally would. 2. Next, in the PagerDuty web app navigate to **Services** → **Service Directory** and select the service that you want to migrate integration keys for. 3. Select the **Settings** tab and scroll to the **Event Management** section. 4. Click **Switch to Service Orchestrations**. 5. Once this button is clicked, all events that reach the service are evaluated against the Event Orchestration rules that have been created. ### REST API Migration Event Orchestration has a new set of APIs that allow you to nest rules together. To migrate existing APIs over to the new REST APIs, you can leverage the new [Event Orchestration Terraform Provider](https://registry.terraform.io/providers/PagerDuty/pagerduty/latest/docs/resources/event_orchestration) to create large volumes of Event Orchestration rules rapidly. [Professional services](https://www.pagerduty.com/services/) are available to help you with this process. Information on the new REST APIs can be found in the [Developer Documentation](/developer/api-changelog#2023-06-13), and information on the Event Orchestration Terraform Provider can be found in [Terraform's documentation](https://registry.terraform.io/providers/PagerDuty/pagerduty/latest/docs/resources/event_orchestration). To help get you started, here are a few endpoints you may find useful: - [List Global Rulesets](/developer/api/reference/rest/rulesets/list-rulesets) - [List Service Event Rules](/developer/api/reference/rest/services/list-service-event-rules) - [Create an Event Orchestration](/developer/api/reference/rest/event-orchestrations/post-orchestration) - [Create an Integration](/developer/api/reference/rest/event-orchestrations/post-orchestration-integration) - [Migrate an Integration to a New Orchestration](/developer/api/reference/rest/event-orchestrations/migrate-orchestration-integration) - [Update a Global Orchestration](/developer/api/reference/rest/event-orchestrations/update-orch-path-global) - [Update a Service Orchestration](/developer/api/reference/rest/event-orchestrations/update-orch-path-service) ### Global Integration Key Migration Global Integration Key migration allows you to retain your existing integration keys and have them evaluate against Event Orchestration rules instead of a Global Event Ruleset. The backend architecture for Event Orchestration is identical to Global Event Rules, so no ingestion or processing behavior changes. Events are simply evaluated against Event Orchestration rules instead of event rules. To migrate your global integration keys: > **Before You Start:** If you have not already done so, perform the following before migrating keys: > > - [Create a Global Orchestration](/ai-automation/aiops/event-orchestration#global-orchestrations) > - Ensure that you have created [routing rules](/ai-automation/aiops/event-orchestration#routing-rules) and [global or service orchestration rules](/ai-automation/aiops/event-orchestration#configure-a-global-or-service-orchestration-rule) that replicate any routing settings and event modifications that you would like to keep. > > If you do not replicate routing rules, events will no longer reach the appropriate services, and if you do not replicate the event modifications, actions will be lost. 1. Once you have created the Global Orchestration and rules described above, navigate to the orchestration in the PagerDuty web app and select **Integrations**. 2. Click **New Integration** and select **Permanently migrate integration from existing Ruleset** from the dropdown. 3. In the modal that appears, select the **Ruleset** with the integration key that you would like to migrate. 4. Note that migration is immediate. Once you click **Migrate**, the Global Ruleset will become inactive. When you are sure that you would like to move forward, click **Migrate**. 1. You should see a success message at the top of the screen confirming that the Ruleset has migrated. ### Push-Button Rule Migration If you do not want to manually re-create your service event rules in Event Orchestration, PagerDuty supports the ability to automatically migrate an account's service event rules to Event Orchestration rules. This automated migration identically re-creates your existing service event rules, retaining the same behavior and event processing outcomes in Event Orchestration. You can trigger this migration on a per-ruleset basis via the API. #### Migrate Service Event Rules to Service Event Orchestration The Push-Button Rule Migration feature leverages the API to allow you to automatically convert your Service Event Rules into Service Orchestration Rules. Read [Convert a Service's Event Rules into Event Orchestration Rules](/developer/api/reference/rest/services/convert-service-event-rules-to-event-orchestration) in the developer docs for more information. All functionality from the migrated Service Event Rules is supported in Service Event Orchestration, except in cases where the rule contains an unsupported exception. Refer to the [provided exception documentation](https://drive.google.com/file/d/19c1PE3aqAiweDLJAiZWaSne96RIjE2R6/view?usp=sharing) for details. If a service's Service Event Rules have more than 25 rules, rule nesting is used to accommodate additional rules under Service Event Orchestration. Note that this nesting is only supported to extend the number of Service Orchestration Rules on a service. Further nesting is not supported unless the account has purchased AIOps, Enterprise for Incident Management, Digital Operations (Legacy), Event Intelligence, or Enterprise for Customer Service. > **Enable Service Event Orchestration:** The migration process does not automatically enable Service Event Orchestration. This means that, while Service Orchestrations may be configured, they are not used to process incoming events unless you have [enabled Service Orchestrations](/ai-automation/aiops/event-orchestration#switch-to-service-orchestrations) on the service's **Settings** page or via the [API](/developer/api/reference/rest/event-orchestrations/update-orch-active-status). To migrate Service Event Rules to Service Event Orchestration: 1. In the PagerDuty web app, navigate to **Services** → **Service Directory** and select your preferred service. Locate the service's ID in the page's URL. 2. Use the [Convert a Service's Event Rules into Event Orchestration Rules](/developer/api/reference/rest/services/convert-service-event-rules-to-event-orchestration) endpoint to migrate the service's rules. #### Terraform If you have configured your event rules using Terraform, version 2.5.0 of the PagerDuty Terraform provider introduced support for Event Orchestration resources that can help you reproduce event rules using Event Orchestration rules instead. To reproduce Service Event Rules you will want to use the [pagerduty\_event\_orchestration\_service](https://registry.terraform.io/providers/PagerDuty/pagerduty/latest/docs/resources/event_orchestration_service) resource. To reproduce a Global Ruleset you will want to use the [pagerduty\_event\_orchestration](https://registry.terraform.io/providers/PagerDuty/pagerduty/latest/docs/resources/event_orchestration), [pagerduty\_event\_orchestration\_global](https://registry.terraform.io/providers/PagerDuty/pagerduty/latest/docs/resources/event_orchestration_global), and [pagerduty\_event\_orchestration\_router](https://registry.terraform.io/providers/PagerDuty/pagerduty/latest/docs/resources/event_orchestration_router) resources. ## Global Event Rules Migration Guidance [Event Orchestration](/ai-automation/aiops/event-orchestration) can identically replicate the features and functionality of Global Event Rules without requiring [Global Orchestrations](/ai-automation/aiops/event-orchestration#global-orchestrations). To effectively migrate your Global Event Rules to Event Orchestration PagerDuty suggests the following: 1. Create a new [Event Orchestration](/ai-automation/aiops/event-orchestration#global-integrations). 2. Create a [routing rule](/ai-automation/aiops/event-orchestration#routing-rules) for each service that appears in the Global Event Ruleset you are migrating. 3. For each service from step two, create Event Orchestration rules that replicate the actions (i.e., setting [incident priority](/incident-management/incidents/incident-priority)) from the corresponding Global Event Ruleset. 4. Once you have replicated the rules and actions, navigate to the **Integrations** section of the Event Orchestration you created and click **New Integration**. 5. From the options presented, select **Permanently migrate integration from existing Ruleset** and select the Global Event Ruleset you are migrating from the dropdown. This transfers the integration key to the new Event Orchestration. No data will be lost as part of this process and events immediately start using the new Event Orchestration rules you created.  *Migrate integration from existing Ruleset* > **Event Evaluation Order:** Global Event Rules are not evaluated before events are routed to services, whereas Global Event Orchestration rules are. This change in behavior allows Global Event Orchestration to reduce the number of required rules and improves downstream routing logic. ## FAQ **What happened to my Event Rules?** As of the end-of-life (EOL) date, January 31, 2025, event rulesets are no longer visible in the PagerDuty web app. Access and modifications to event rules are still possible via the [API](/developer/global-event-rules-api). **What happens if I don't migrate my Event Rules?** You can migrate your event rules to Event Orchestration via the API, however you are not obligated to do so. If you choose not to migrate your event rules before the end of life date, understand that event rules will become unsupported and PagerDuty will not maintain backwards compatibility with any new features that are released for Event Orchestration. This means that migrating event rulesets to Event Orchestration after the deadline increases the likelihood that PagerDuty will not be able to identically mirror the original behavior from event rules. **What's the difference between Event Rules and Event Orchestration?** Event Orchestration is a direct upgrade from Event Rules. Basic Event Orchestrations can perform all the same basic event processing actions that event rules can perform with the added benefits of improved UI, better rule creation, APIs and Terraform support, and advanced conditions. For customers with the [PagerDuty AIOps](/ai-automation/aiops/overview) add-on, Enterprise for Incident Management, or Digital Operations (Legacy) plans, Advanced Event Orchestrations bring even more functionality to the table. This includes contextual conditions, webhooks, paused incident notifications, rule nesting, and a direct integration with Automation Actions. Below are a few of the key ways that Event Orchestration is superior to Event Rules: - **Easier to use**: Architecturally, Event Orchestration takes advantage of PagerDuty's more modern approach to front-end development by leveraging React as its core frontend stack. This allows customers to navigate their rules with less lag and greater support for accessibility improvements in the future. - **More complex event processing**: Because of the condition language that Event Orchestration supports and the capability to nest rules, customers using Event Orchestration can perform complex event processing actions with a fraction of the configuration effort. What could once be accomplished with 10 event rules can now be done with 1 Event Orchestration rule. - **More robust support for automation**: You can trigger webhooks with custom headers or automation actions. - **More precise event processing**: Rule nesting allows you to execute automations with a high degree of precision as customers can itemize out in detail each known failure start for their systems, deploying automation to each with confidence. **Do I have to create all my event rules again in Event Orchestration?** PagerDuty highly recommends using the Service Integration Key, REST API or Global Integration Key migration methods listed above to migrate to Event Orchestration. That said, you also have access to an automated rule migration tool. This tool automatically copies all existing event rules into Event Orchestration rules on a per ruleset basis, initiated by a user via [API](/developer/api/reference/rest/services/convert-service-event-rules-to-event-orchestration). After the EOL date, event rules can continue to process events, however they are only accessible via API. **Is Event Orchestration a true replacement for Event Rules, or will I lose functionality?** Event Orchestration has the same features as Event Rules with the added benefit of being built on a more sustainable front-end framework. The backend for Event Orchestration is identical to the backend for Event Rules, allowing Event Orchestration to benefit from the years of testing that has been done with Event Rules. This shared backend also means that the processing outcomes for events sent to Event Orchestration are identical to Event Rules, with the added benefit of having easier-to-understand rules. **Is PagerDuty able to provide more support for my migration?** There is support available from the [Professional Services team](https://www.pagerduty.com/services/) for customers who need it. If you are interested in this, contact your account team and they can help set this up. **Where can I learn more about Event Orchestration?** Read the [Event Orchestration](/ai-automation/aiops/event-orchestration) article for more information. PagerDuty University also offers an [Event Orchestration eLearning Module](https://university.pagerduty.com/event-orchestration) course. **Who can I contact if I have more questions?** If you have additional questions, [reach out to the Support team](https://www.pagerduty.com/contact-us/#contact-support) or your Customer Success representative. --- URL: https://docs.pagerduty.com/ai-automation/aiops/noise-reduction # Noise Reduction Minimize noise, group alerts intelligently, and auto-pause transient notifications Not every alert should be an incident. PagerDuty's noise reduction capabilities — part of [PagerDuty AIOps](/ai-automation/aiops/overview) — leverage data science and machine learning to limit system noise and reduce alert fatigue. This means fewer incidents and interruptions for on-call responders, richer context around the incidents that do trigger, and lower resolution times. You can access the Noise Reduction homepage in the PagerDuty web app by navigating to **AIOps** → **Noise Reduction**. Here you can see an overview of noise reduction features: - [Alert Grouping](#alert-grouping) - [Auto-Pause Incident Notifications](#auto-pause-incident-notifications) You can create or edit settings from this central page.  *Noise Reduction settings* > **AIOps / Signal Intelligence Feature:** This feature is included with the [PagerDuty AIOps](/ai-automation/aiops/overview) add-on, or included as Signal Intelligence in PD Reliability Platform plans. To sign up for a trial of PagerDuty AIOps features, read [PagerDuty AIOps Trials](/ai-automation/aiops/overview#pagerduty-aiops-trials). ## Alert Grouping [Alert Grouping](/ai-automation/aiops/noise-reduction/alert-grouping) groups alerts into an incident on a service using different grouping techniques. [Global Alert Grouping](/ai-automation/aiops/noise-reduction/alert-grouping/global-alert-grouping) expands the scope of alert grouping by applying a setting across multiple services. ## Auto-Pause Incident Notifications [Auto-Pause Incident Notifications](/ai-automation/aiops/noise-reduction/auto-pause-incident-notifications) automatically pauses notifications for transient alerts — alerts that typically auto-resolve on their own — giving them time to resolve before interrupting responders. --- URL: https://docs.pagerduty.com/ai-automation/aiops/noise-reduction/alert-grouping # Alert Grouping Consolidate related alerts into a single incident to cut noise, reduce alert fatigue, and speed up response across one or more services. Alert Grouping is designed for incident responders and operations teams who want to streamline their workflow by reducing noise from multiple alerts and focusing on meaningful incidents. By consolidating related alerts into a single incident, this feature minimizes alert fatigue and accelerates response times, allowing teams to manage incidents more effectively across multiple services. > **AIOps / Signal Intelligence Feature:** This feature is included with the [PagerDuty AIOps](/ai-automation/aiops/overview) add-on, or included as Signal Intelligence in PD Reliability Platform plans. To sign up for a trial of PagerDuty AIOps features, read [PagerDuty AIOps Trials](/ai-automation/aiops/overview#pagerduty-aiops-trials). > **Required User Permission:** Users with the following roles can edit a service’s Alert Grouping settings: > > - Account Owner > - Admin and Global Admin > - User > - Manager base role and team roles > - Manager team roles can only manage services associated with their team. > **Global Alert Grouping:** By default, Alert Grouping groups alerts on a single technical service. If you’d like to expand scope across more than one service, please read [Global Alert Grouping](/ai-automation/aiops/noise-reduction/alert-grouping/global-alert-grouping), which allows you to configure a multiservice group, and group alerts from different services into a single incident. ## View Alert Grouping In the PagerDuty web app, navigate to **AIOps** → **Noise Reduction** and select the tab **Alert Grouping** for an overview of the services in your account that have Alert Grouping configured. Enter a term in the search box to filter the list of services displayed.  *Alert Grouping on the Noise Reduction overview page* ## Enable Alert Grouping There are two places to enable Alert Grouping: - [Noise Reduction](#noise-reduction) - [Service Settings](#service-settings) ### Noise Reduction In the PagerDuty web app: 1. Navigate to **AIOps** → **Noise Reduction**. 2. Click **New Grouping**. 3. In the dropdown **Select Services to group the alerts**, select one or more services to group alerts across services. 1. Read [Global Alert Grouping](/ai-automation/aiops/noise-reduction/alert-grouping/global-alert-grouping) for more information about what to expect when you select more than one service. 4. Select an alert grouping method and, if applicable, enter your grouping criteria. 1. Inputs will vary depending on the grouping method you select. Please see the section [Grouping Methods](#grouping-methods) below for more information about each. 5. Click **Save**. ### Service Settings In the PagerDuty web app: 1. Navigate to **Services** → **Service Directory** and select your desired service. 2. Select the **Settings** tab and click **New Grouping**/**Edit** in the section **Reduce Noise**. 3. In the dropdown **Select Services to group the alerts **, _optionally_ add more services to group alerts across services. 1. Read [Global Alert Grouping](/ai-automation/aiops/noise-reduction/alert-grouping/global-alert-grouping) for more information about what to expect when you select more than one service. 4. Select an alert grouping method and, if applicable, enter your grouping criteria. 1. Inputs will vary depending on the grouping method you select. Please see the section [Grouping Methods](#grouping-methods) below for more information about each. 5. Select a value from the dropdown for the grouping time window. 6. Click **Save**. ## Update Alert Grouping There are two places to enable Alert Grouping: - [Noise Reduction](#noise-reduction-1) - [Service Settings](#service-settings-1) ### Noise Reduction In the PagerDuty web app: 1. Navigate to **AIOps** → **Noise Reduction** and select the **name** of your desired service, _or_ select → **Edit** to the right of your desired service. 1. **Note**: Enter a service's name in the search box to show matching results. 2. Make your required configuration changes, e.g., add services to the multiservice group, adjust the matching criteria, the grouping time window value, or select a different [Grouping Method](#grouping-methods). 3. Click **Save**. ### Service Settings In the PagerDuty web app: 1. Navigate to **Services** → **Service Directory** and select your desired service. 2. Select the **Settings** tab and click **Edit** in the section **Reduce Noise**. 3. Make your required configuration changes, e.g., add services to the multiservice group, adjust the matching criteria, the grouping time window value, or select a different [Grouping Method](#grouping-methods) . 4. Click **Save**. ## Delete Alert Grouping There are two places to enable Alert Grouping: - [Noise Reduction](#noise-reduction-2) - [Service Settings](#service-settings-2) ### Noise Reduction In the PagerDuty web app: 1. Navigate to **AIOps** → **Noise Reduction** and select → **Delete** to the right of your desired service. 2. In the confirmation modal, click **Delete**. 1. **Note**: This action cannot be undone. ### Service Settings In the PagerDuty web app: 1. Navigate to **Services** → **Service Directory** and select the name of your desired service. 2. Select the **Settings** tab and click **Edit** in the section **Reduce Noise**. 3. In the bottom-left, click **Delete**. 4. In the confirmation modal, click **Yes, turn off**. ## View Alert Grouping on an Incident When enabled, you can see Alert Grouping actively grouping alerts on an incident’s detail page under the Alerts tab. The Grouping Now label indicates that an incident is using alert grouping. You can also see how many alerts are grouped into the incident, as well as their status. In the example below, two alerts have been grouped: one is triggered and the other is resolved. Click **Alert grouping details** to see which grouping method is in effect (Intelligent, Content-Based, Unified, or Time-Based Alert Grouping), when grouping started, and the conditions when grouping will stop. ## Grouping Methods PagerDuty offers a variety of grouping methods depending on your organization’s needs. Select one of the following grouping methods for more information, including configuration details: - [Intelligent](/ai-automation/aiops/noise-reduction/alert-grouping/intelligent-alert-grouping) - [Alert Content](/ai-automation/aiops/noise-reduction/alert-grouping/content-based-alert-grouping) - [Intelligent + Alert Content](/ai-automation/aiops/noise-reduction/alert-grouping/unified-alert-grouping) - [Time only](/ai-automation/aiops/noise-reduction/alert-grouping/time-based-alert-grouping) --- URL: https://docs.pagerduty.com/ai-automation/aiops/noise-reduction/alert-grouping/content-based-alert-grouping # Content-Based Alert Grouping Use alert content to group incoming alerts into open incidents Content-Based Alert Grouping enables custom alert grouping on services with predictable, homogenous alert data, without the need to train an algorithm. Alerts that share an exact match on a set of chosen fields group together into the most recent open incident. Grouped alerts mean fewer incidents and noise reduction, richer context on incidents that do trigger, and lower resolution times. > **AIOps / Signal Intelligence Feature:** This feature is included with the [PagerDuty AIOps](/ai-automation/aiops/overview) add-on, or included as Signal Intelligence in PD Reliability Platform plans. To sign up for a trial of PagerDuty AIOps features, read [PagerDuty AIOps Trials](/ai-automation/aiops/overview#pagerduty-aiops-trials). > **AIOps Service Configuration:** Your service configuration must have AIOps enabled to use this feature. See [Configurable Service Settings](/incident-management/services/configurable-service-settings#manage-aiops) for more information and enablement steps. > **Legacy Availability:** Content-Based Alert Grouping is also available with [Legacy Event Intelligence](/ai-automation/aiops/legacy-event-intelligence). > > Note that newer features (e.g., [Global Content-Based Alert Grouping](/ai-automation/aiops/noise-reduction/alert-grouping/global-alert-grouping#alert-content)) are only available to PagerDuty AIOps customers, and are not available on Legacy Event Intelligence plans. > > Contact the [Sales Team](https://www.pagerduty.com/contact-us/#contact-sales) to upgrade your account's pricing plan. > **Required User Permissions:** Users with the following roles can edit a service's Alert Grouping settings: > > - Account Owner > - Admin and Global Admin > - User > - Manager base role and team roles > - Manager team roles can only manage services associated with their team. ## Enable Content-Based Alert Grouping > **Important Notes:** - Content-Based Alert Grouping requires data to be in [Common Event Format (PD-CEF)](/developer/api/pd-cef). > - Alerts only group when all selected fields have an _exact_ match. 1. Select **Services** → **Service Directory** → click the **name** of the service where you would like to use Content-Based Alert Grouping. 2. Select the **Settings** tab and click **New Grouping** _OR_ **Edit** under the **Reduce Noise** section. 3. Select **Alert Content**. 1. _Optional_: To group alerts across multiple services, select additional services in the dropdown **Select Services to group the alerts** at the top of the page. Read [Global Alert Grouping](/ai-automation/aiops/noise-reduction/alert-grouping/global-alert-grouping#alert-content) for more information. 4. Select whether you want alerts to group if **All** or **Any** specified fields match. - If you select **All**, alerts group when there is an exact match on _every specified field_. - If you select **Any**, alerts group when there is an exact match on _at least one of the specified fields_. 5. There are two methods for specifying alert grouping fields: - Click **See Recent Alerts** to open a pane on the right side of the screen. Select a recently-received alert to see its payload. Click the fields you want to add to your grouping criteria and they are added to your configuration. _OR_ - Select your preferred **Field Name(s)** from dropdown: - **Class** - **Component** - **Group** - **Severity** - **Source** - **Summary** - **Custom Details**: To group on the value in a custom field, select **Custom Details** from the dropdown, and enter your **custom field name**. Be sure that your spelling and capitalization exactly match the alert's field. See the [FAQ below](#how-do-i-use-a-nested-custom-details-field-as-part-of-my-content-based-alert-grouping-configuration) for more information on using dot notation to access nested custom detail fields.  *Nested custom details example* 6. _Optional_: If required, select **Add Field** to add an additional field to match on. 7. Select the [time window](#flexible-time-window) that you would like to group alerts in. 8. Click **Save**. ### Flexible Time Window You can configure the grouping time window as part of the Content-Based Alert Grouping setting. The time window can be between five minutes and 24 hours. The time window is a rolling window and counted from the most recently grouped alert. The window extends each time an alert is grouped, up to 24 hours, or until the incident is resolved. If an alert comes in after 24 hours, it triggers a new incident. ## Update Content-Based Alert Grouping After [enabling Content-Based Alert Grouping](#enable-content-based-alert-grouping), you can adjust the grouping criteria at any time. > **Previously-Saved Criteria will be Ignored:** Note that Content-Based Alert Grouping will ignore any previously-saved criteria and will start grouping alerts into a new incident every time you save. In other words, Content-Based Alert Grouping does not consider any previously-saved criteria when determining whether to group an alert or trigger a new incident. 1. Select **Services** → **Service Directory** → click the **name** of the service where Content-Based Alert Grouping is in use. 2. Select the **Settings** tab and click **Edit** under the **Reduce Noise** section. 3. Select **Alert Content**. 4. Make the required changes and click **Save**. ## Disable Content-Based Alert Grouping To select a different grouping method, or to disable Alert Grouping altogether: 1. In the web app, navigate to **Services** → **Service Directory** → select the **name** of your desired service. 2. Select the **Settings** tab and click **Edit** next to **Reduce Noise**. 3. Select the desired grouping method and click **Save**. 1. Alternatively, you can entirely disable alert grouping on the service by clicking **Delete** and confirming **Delete** again in the modal. ### Delete a Field from Your Matching Criteria If you have configured more than one field as part of your matching criteria, there is an option to delete the individual fields. 1. Navigate to **Services** → **Service Directory** → select the **name** of your desired service. 2. Select the **Settings** tab and click **Edit** next to **Reduce Noise**. 3. To the right of the field(s) you wish to delete, click . 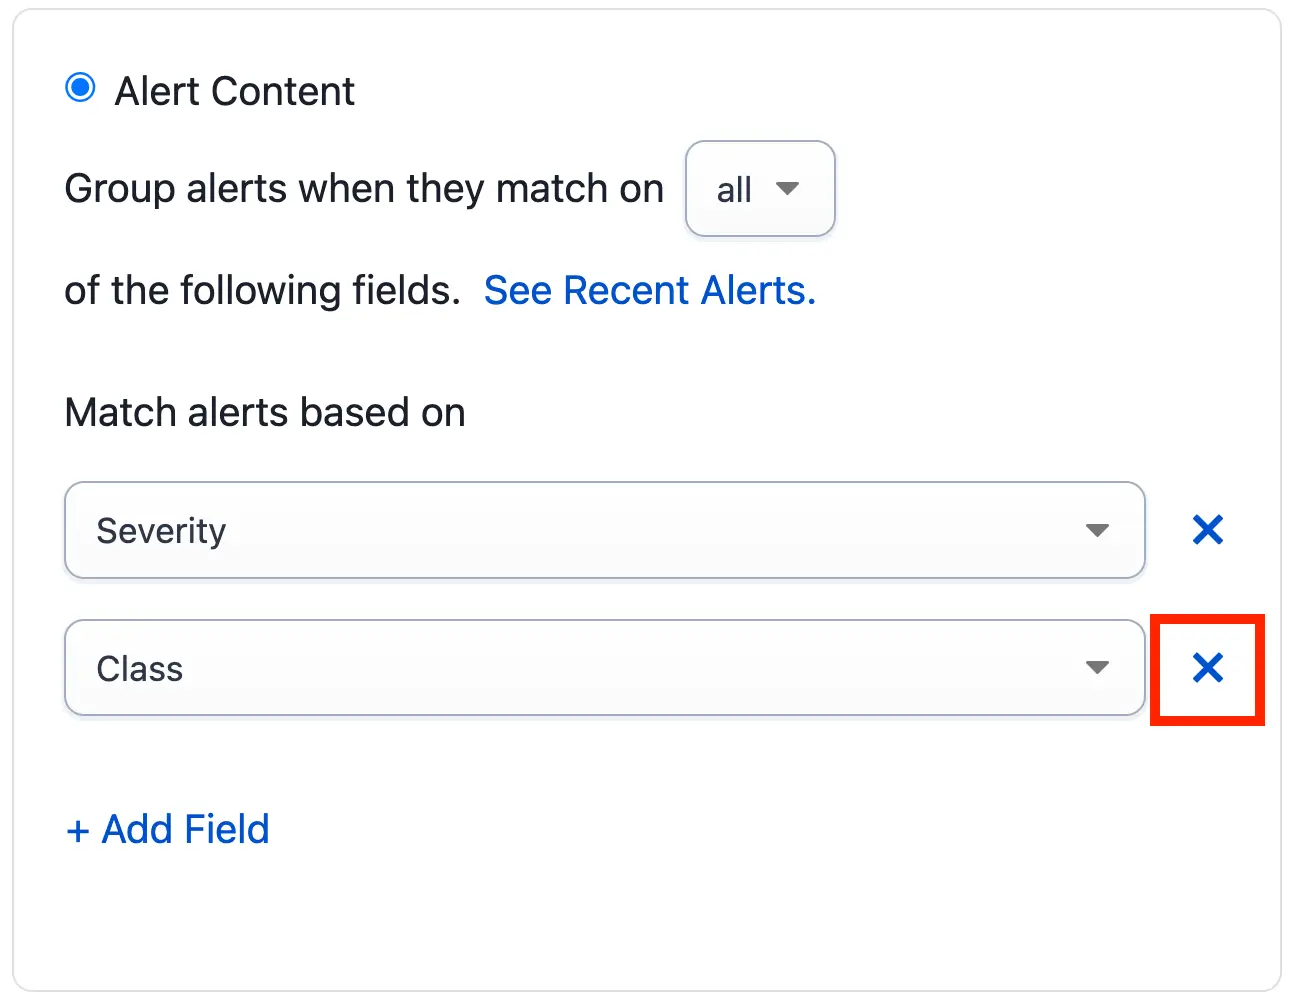 *Delete criteria* 4. Click **Save**. ## Email Events Content-Based Alert Grouping supports email alerts generated through service-level email integrations, as well as [Event Orchestration](/ai-automation/aiops/event-orchestration#send-events-to-global-orchestrations). This includes any alerts that have their `custom_details` field transformed in Event Orchestration's [Event Fields](/ai-automation/aiops/event-orchestration#event-fields) feature. Since email events are not structured in JSON, the format that [Common Event Format (PD-CEF)](/developer/api/pd-cef) requires, there are some differences in how these alerts are handled while configuring Content-Based Alert Grouping on incidents. ### Configuration While configuring Content-Based Alert Grouping or [Unified Alert Grouping](/ai-automation/aiops/noise-reduction/alert-grouping/unified-alert-grouping), the **See Recent Alerts** option displays a preview of recent alerts. However, if the alert contains a `custom_details` field that was transformed in [Event Orchestration](/ai-automation/aiops/event-orchestration), this field's updated value does not appear in the **See Recent Alerts** preview. The **See Recent Alerts** preview always displays the `custom_details` field as it appeared in the email headers. ### Alerts Table The [Alerts Table](/incident-management/incidents/alerts/alerts-table) displays email events with its [fields mapped](#field-mapping) to corresponding PD-CEF fields, but does not convert them into CEF events. If you would like to view the email alert in a formatted view, click **View Message** below an expanded alert in the Alerts Table. ### Field Mapping Content-Based Alert Grouping maps some email fields to a corresponding [Common Event Format (PD-CEF)](/developer/api/pd-cef) field. For example, if you are grouping based on **Source**, Content-Based Alert Grouping uses the email event's **From** field to consider a match. With this in mind, it shows in the incident timeline that the alert was added based on **Source**. The table below shows a complete list of email fields and their corresponding PD-CEF fields: | Email Field | PD-CEF Field | | :------------------------------ | :-------------------------------------------------------------------------------------------------------------------------------------------------- | | From | Source | | Subject | Summary | | Subject | `custom_details.subject` (This field always contains the original email subject, even if the Summary field was transformed in Event Orchestration.) | | Text Body | `custom_details.plain_body` | | HTML Body (in multipart emails) | `custom_details.html_body` | | To | `custom_details.to` (i.e., an array of 1 or more recipients) | | CCs | `custom_details.cc` | | Email Headers | `custom_details.
--- URL: https://docs.pagerduty.com/ai-automation/aiops/noise-reduction/alert-grouping/global-alert-grouping # Global Alert Grouping Combine similar alerts into a single incident to reduce notification noise and provide more context across multiple services Global Alert Grouping reduces noise by grouping alerts across more than one technical service. Global Alert Grouping allows you to select the scope of services to evaluate for alert grouping. Global Alert Grouping supports the following methods: - [Intelligent Alert Grouping](/ai-automation/aiops/noise-reduction/alert-grouping/intelligent-alert-grouping) - [Content-Based Alert Grouping](/ai-automation/aiops/noise-reduction/alert-grouping/content-based-alert-grouping) - [Unified Alert Grouping](/ai-automation/aiops/noise-reduction/alert-grouping/unified-alert-grouping) > **AIOps / Signal Intelligence Feature:** This feature is included with the [PagerDuty AIOps](/ai-automation/aiops/overview) add-on, or included as Signal Intelligence in PD Reliability Platform plans. To sign up for a trial of PagerDuty AIOps features, read [PagerDuty AIOps Trials](/ai-automation/aiops/overview#pagerduty-aiops-trials). > **AIOps Service Configuration:** Your service configuration must have AIOps enabled to use this feature. See [Configurable Service Settings](/incident-management/services/configurable-service-settings#manage-aiops) for more information and enablement steps. > **Required Permissions:** If you have one of the following roles, you can edit a service’s alert grouping settings: > > - Account Owner > - Admin and Global Admin > - User > - Manager base role and Team roles > - Manager Team roles can only configure the services for which they are assigned a Manager role. ## Enable Global Alert Grouping Global Alert Grouping groups alerts across multiple technical services. 1. In the PagerDuty web app, navigate to **Services** → **Service Directory** and click the name of your desired service. 2. Select the **Settings** tab and click **Edit** next to **Reduce Noise**. 3. Select one of the following options and configure your preferences: - [**Intelligent**](#intelligent) - [**Alert Content**](#alert-content) - [**Intelligent + Alert Content**](#intelligent-alert-content) 4. Click **Save**. ### Intelligent Selecting **Intelligent** enables Intelligent Alert Grouping on your service. There are differences in functionality depending on whether you select more than one service. The information in this section is relevant when you select more than one service. Read [Intelligent Alert Grouping](/ai-automation/aiops/noise-reduction/alert-grouping/intelligent-alert-grouping) if you select a single service. #### Advanced Options Advanced Options allow you to customize which alert fields the grouping model analyzes when determining textual similarities and reset the grouping model's learner cache. - [Configure Grouping Fields](#configure-grouping-fields): Choose up to five fields, including standard [Common Event Format (PD-CEF)](/developer/api/pd-cef) fields and custom details, for a comprehensive alert grouping analysis. - [Reset Learner Cache](#reset-learner-cache): Reset the learner cache. ##### Configure Grouping Fields By default, Intelligent Alert Grouping uses the summary field of alerts to determine textual similarity. Depending on your data, however, you can use alternate fields to determine similarity. In the PagerDuty web app: 1. While [configuring Intelligent Alert Grouping](/ai-automation/aiops/noise-reduction/alert-grouping/intelligent-alert-grouping#enable-intelligent-alert-grouping), click the dropdown **Advanced Options**. 2. In the section Select Fields, select a field from the dropdown you want the Intelligent Alert Grouping model to consider for textual similarity. 1. If you select Custom Details, enter a Custom field name. 3. Optional: Click **Add Field** and select another field. **Note**: You can repeat this step as needed to select up to five fields. 4. At the bottom of the page, click **Save**. > **Considerations:** Summary is the only field that PagerDuty requires. If you do not select Summary as one of the fields, all selected fields can be blank. In such cases, alert grouping does not occur because the selected fields are empty. > > When any field selected as part of the Advanced Options configuration is blank, the system does not analyze or consider those fields for Intelligent Alert Grouping. The grouping model only considers the fields with available data. > > The selected fields are analyzed for textual similarity and do not evaluate based on an exact match between fields. To specify exact matching criteria, use the [Intelligent + Alert Content](#intelligent-alert-content) option. > > The maximum number of characters for all selected fields is 1000. ##### Reset Learner Cache This option allows you to reset the grouping model's learner caches. This is useful if a data structure for a service changes significantly, or after a period of testing. In the PagerDuty web app: 1. While [configuring Intelligent Alert Grouping](/ai-automation/aiops/noise-reduction/alert-grouping/intelligent-alert-grouping#enable-intelligent-alert-grouping), click the dropdown **Advanced Options**. 2. Activate the checkbox **Reset learner cache**. 3. At the bottom of the page, click **Save**. #### Algorithm Behavior The Intelligent Alert Grouping algorithm observes real-time alert data and incident history, and adapts as new alerts trigger on a service. After you have [enabled Intelligent Alert Grouping](/ai-automation/aiops/noise-reduction/alert-grouping/intelligent-alert-grouping#enable-intelligent-alert-grouping) on a service, no explicit configuration is required, though you can optionally configure the [Flexible Time Window](/ai-automation/aiops/noise-reduction/alert-grouping/intelligent-alert-grouping#flexible-time-window). Intelligent Alert Grouping groups an alert into an existing incident when the model detects the following criteria. The reason for grouping each alert appears in the incident timeline. - **Textual similarity**: The Intelligent Alert Grouping algorithm deems the alerts similar based on alert title similarity. - **Past co-occurrences**: The Intelligent Alert Grouping model detects a high rate of co-occurrence between alerts. - **Learning from prior incident merges**: You have merged prior similar alerts and the algorithm learns from this behavior. Alerts that do not meet these criteria do not group and trigger a new incident. When a Global Alert Grouping setting is enabled, Intelligent Alert Grouping evaluates alerts from all services in a global setting, and groups alerts from one or more services into the same incident when the criteria in the previous section are met. New alerts group under the first created incident and notifications go to that incident's responder. The algorithm also reacts to feedback from you and your team. The best way for the algorithm to learn and adapt to new grouping behaviors is to manually merge related incidents, and to manually move alerts to a different incident when they are not related. For more information about moving alerts from one incident to another, see [Merge Incidents](/incident-management/incidents/edit-incidents#merge-incidents). You can also automatically update alert titles using [Event Orchestration](/ai-automation/aiops/event-orchestration#event-fields), which influences the algorithm. > **Tip:** Merging and unmerging alerts through the REST API does not affect the Intelligent Alert Grouping algorithm. Only manual merges and unmerges in the PagerDuty web app influence the algorithm. ### Alert Content Selecting **Alert Content** enables Content-Based Alert Grouping on your service. Content-Based Alert Grouping enables customized alert grouping on services with predictable, homogenous alert data, without the need to train an algorithm. With Content-Based Alert Grouping, alerts that share an exact match on a set of chosen fields group together into the most recent open incident. Grouped alerts mean fewer incidents and interruptions for responders, richer context on the incidents that trigger, and lower resolution times. To learn more about the Alert Content option, read [Content-Based Alert Grouping](/ai-automation/aiops/noise-reduction/alert-grouping/content-based-alert-grouping). ### Intelligent + Alert Content Selecting **Intelligent + Alert Content** enables Unified Alert Grouping on your service. Unified Alert Grouping combines [Content-Based Alert Grouping](/ai-automation/aiops/noise-reduction/alert-grouping/content-based-alert-grouping) and [Intelligent Alert Grouping](/ai-automation/aiops/noise-reduction/alert-grouping/intelligent-alert-grouping) with a flexible time window for increased precision and correlation control. Unified Alert Grouping groups alerts when alert content matches and Intelligent Alert Grouping determines alerts are similar. Alerts group only when both conditions are satisfied. To learn more about the Intelligent + Alert Content option, read [Unified Alert Grouping](/ai-automation/aiops/noise-reduction/alert-grouping/unified-alert-grouping). ### Flexible Time Window You can configure the grouping time window as part of the Global Alert Grouping setting. The time window can be between five and 60 minutes. The time window is a rolling window and counts from the most recently grouped alert. The window extends each time an alert groups, up to 24 hours, or until the incident resolves. If an alert arrives after 24 hours, it triggers a new incident. ## View Global Alert Grouping On an Incident A primary indicator that an incident has alerts grouped from other services is the **Multiservice Group** pill, along with the description of how many alerts have grouped, at the top of the incident details page.  You can also view Global Alert Grouping on an incident details page in the following places: - The **Impacted Services** field shows the incident’s **source service** and the names of any other services whose alerts have grouped into the incident.  - With the **Alerts** tab selected, you can also see the originating service for an alert. 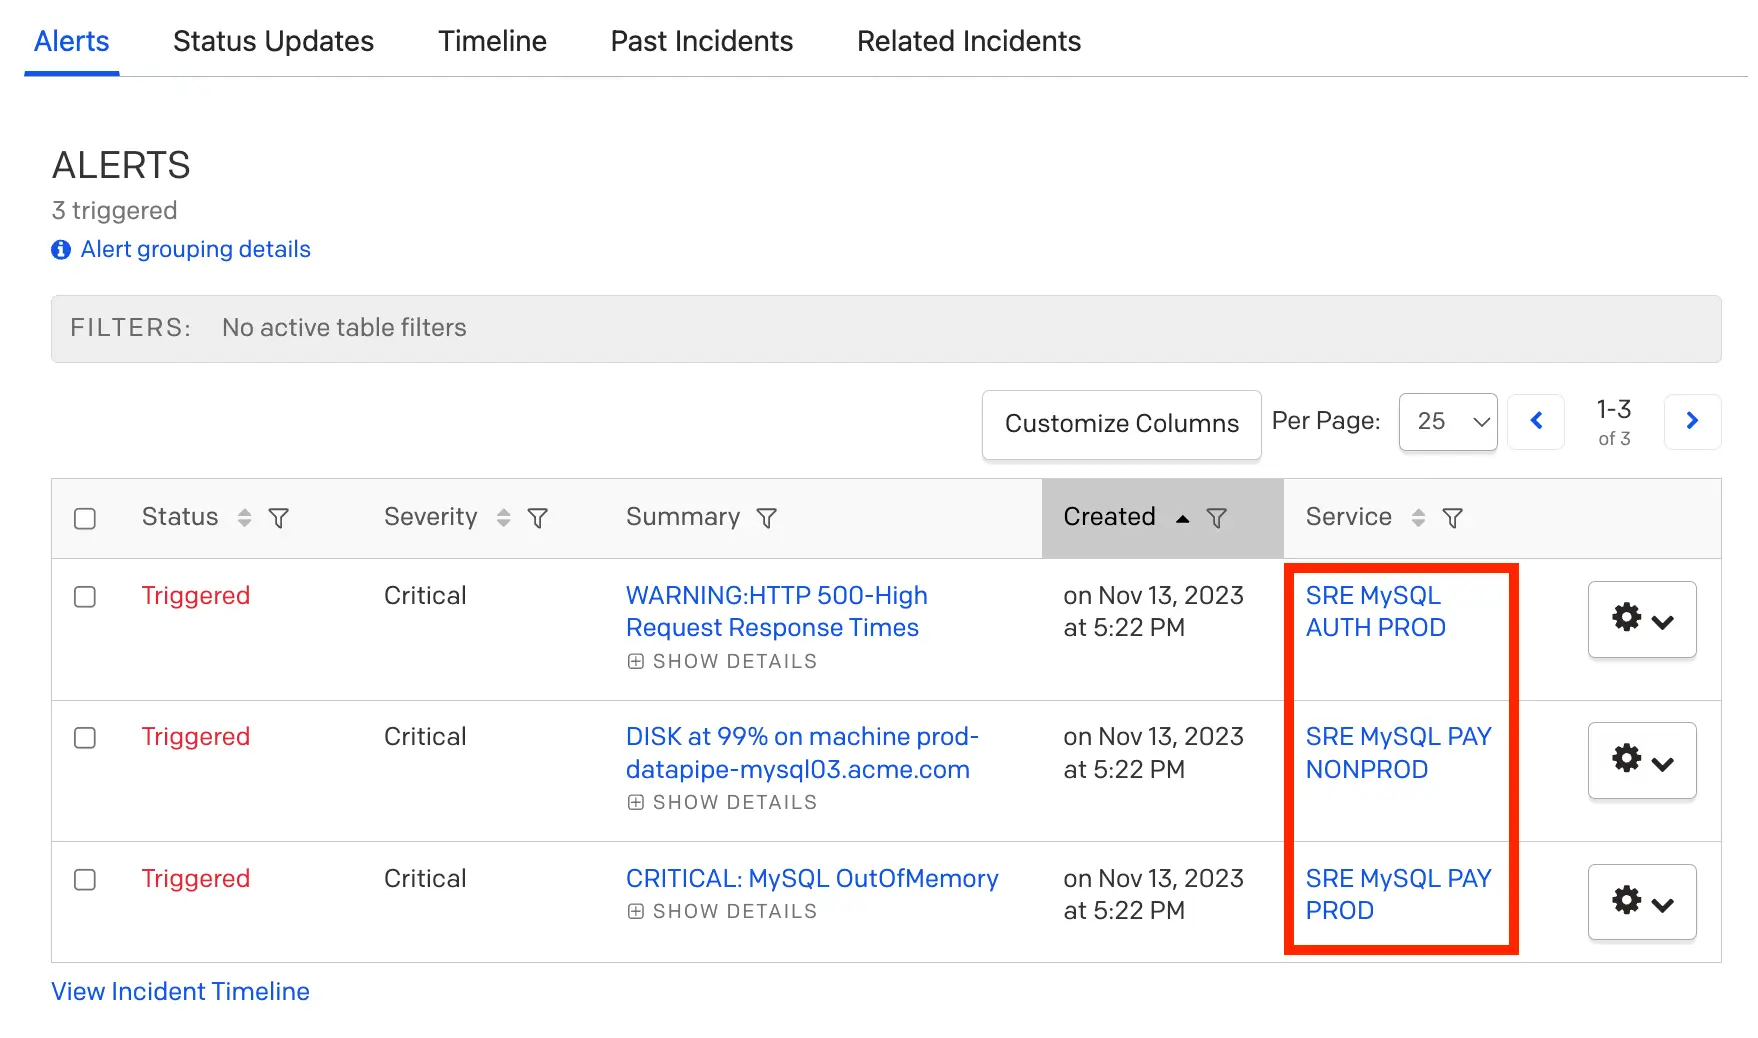 - An incident's **Timeline** shows an entry when Global Alert Grouping adds an alert from another service.  ## Best Practices To get the most out of Global Alert Grouping, follow these practices: 1. Make sure that responders on all associated Teams and escalation policies know that their services are part of a Global Alert Grouping configuration. 2. Ensure that on-call responders evaluate all alerts, including alerts that originated on other services. 3. If an on-call responder is unsure whether an alert belongs to an incident on their assigned service, instruct the on-call responder to add a responder from the originating service to review the alert, or [move the alert](/incident-management/incidents/alerts#move-alerts-to-another-incident) to create an incident on the originating service. Creating a new incident on the originating service notifies the appropriate on-call responder. 4. Ensure you have a base role of Responder or higher for services within a multiservice group. Do not use [Advanced Permissions](/account-admin/advanced-permissions) to restrict access to services that are part of a multiservice group (for example, restricting access to view incidents on a specific service). ## FAQ **What service does an incident get assigned to when grouping across services?** Global Alert Grouping groups subsequent alerts into the incident on the service that received the initial alert. Global Alert Grouping continues grouping matched alerts based on the configured criteria and rolling time window, or until the incident resolves. **Which escalation policy will be assigned to the incident?** PagerDuty uses the escalation policy from the service where the first alert triggers. **How do I bring in other responders?** You have multiple options: - The on-call responder can [reassign an incident to other users or escalation policies](/incident-management/incidents/reassign-incidents). - The on-call responder for that incident can [add responders](/incident-management/incidents/add-responders). - The on-call responder can execute an [Incident Workflow](/ai-automation/automation/incident-workflows) that adds responders. **Where can I check if an alert from my service has been grouped into an incident on a different service?** Grouped alerts maintain their originating service, so the alerts for your team are visible in the [Alerts Table](/incident-management/incidents/alerts/alerts-table) when the **My Teams** filter is selected. They do not appear on the Incidents page when **My Teams** is selected. In the [Service Directory](/incident-management/services/service-directory), the multiservice incident is only visible with the source service (the service that received the first alert). This means that a single technical service shows as impacted on your status page. If you configure [Business Services](/incident-management/services/business-services) and a priority is assigned to the incident, then the business service also displays as impacted. We are currently evaluating an area on the service directory page to show multiservice incidents when a service has an alert assigned to a multiservice incident. **How do I move an alert that was grouped into an incident to another service?** Read [Move Alerts to Another Incident](/incident-management/incidents/edit-incidents#move-alerts-to-another-incident) for more information about merging alerts, moving alerts to a new service, and using a grouped alert to trigger a new incident. **What is the maximum number of services that can be in a multiservice group?** You can include up to 250 services in a multiservice group. **Can a service have more than one type of Alert Grouping enabled at a time?** We do not allow a service to have more than one type of alert grouping enabled at a time, or to be part of more than one multiservice group, due to the potential conflict between grouping types. If two alerts matched more than one grouping type, PagerDuty does not know which setting takes precedence. **What is the difference between “grouping” and “merging” an alert?** Grouping is an automated process using our alert grouping feature set for automatically grouping alerts into a single incident based on criteria set by a user. Merging is a manual process executed by a user where an [incident](/incident-management/incidents/edit-incidents#merge-incidents) or [alert](/incident-management/incidents/edit-incidents#move-alerts-to-another-incident) can merge into a new or existing incident. **How does Global Alert Grouping interact with Event Orchestration?** [Event Orchestration](/ai-automation/aiops/event-orchestration) is a powerful tool that can manipulate an event's payload before routing it to a service. As their names imply, Event Orchestration acts at the event level (upstream from Global Alert Grouping), while Global Alert Grouping acts on alerts (downstream from Event Orchestration). This means that Global Alert Grouping evaluates an alert as it is received from Event Orchestration, after any transformations in Global Orchestrations or Service Orchestrations have taken place. **Can I use the REST API to configure Global Alert Grouping?** Yes, the following endpoints are documented in our Developer Docs to help you configure Global Alert Grouping: - [List alert grouping settings](/developer/api/reference/rest/alert-grouping-settings/list-alert-grouping-settings) - [Create an Alert Grouping Setting](/developer/api/reference/rest/alert-grouping-settings/post-alert-grouping-settings) - [Get an Alert Grouping Setting](/developer/api/reference/rest/alert-grouping-settings/get-alert-grouping-setting) - [Delete an Alert Grouping Setting](/developer/api/reference/rest/alert-grouping-settings/delete-alert-grouping-setting) - [Update an Alert Grouping Setting](/developer/api/reference/rest/alert-grouping-settings/put-alert-grouping-setting) --- URL: https://docs.pagerduty.com/ai-automation/aiops/noise-reduction/alert-grouping/intelligent-alert-grouping # Intelligent Alert Grouping Automatically add incoming alerts to related incidents via the Intelligent Alert Grouping algorithm Intelligent Alert Grouping automatically consolidates related alerts into a single, actionable incident, using machine learning to reduce alert noise for DevOps teams and SREs. Instead of managing dozens of separate notifications, incident responders can focus on problem-solving while the system combines related alerts in real time. The technology continuously learns from your team's response patterns and service behavior, becoming more accurate over time and leading to progressively faster incident resolution. > **AIOps / Signal Intelligence Feature:** This feature is included with the [PagerDuty AIOps](/ai-automation/aiops/overview) add-on, or included as Signal Intelligence in PD Reliability Platform plans. To sign up for a trial of PagerDuty AIOps features, read [PagerDuty AIOps Trials](/ai-automation/aiops/overview#pagerduty-aiops-trials). > **AIOps Service Configuration:** Your service configuration must have AIOps enabled to use this feature. See [Configurable Service Settings](/incident-management/services/configurable-service-settings#manage-aiops) for more information and enablement steps. > **Legacy Availability:** Intelligent Alert Grouping is also available with [Legacy Event Intelligence](/ai-automation/aiops/legacy-event-intelligence). > > Newer features are only available to PagerDuty AIOps customers and are not available on Legacy Event Intelligence plans. This includes: > > - [Advanced Options](#advanced-options), including [configurable field grouping](#configure-grouping-fields) and [resetting the learner cache](#reset-learner-cache) > - [Global Intelligent Alert Grouping](/ai-automation/aiops/noise-reduction/alert-grouping/global-alert-grouping#intelligent) > > Contact the [Sales Team](https://www.pagerduty.com/contact-us/#contact-sales) to upgrade your account's pricing plan. > **Required User Permissions:** The following roles can edit a service's Alert Grouping settings: > > - Account Owner > - Admin and Global Admin > - User > - Manager base role and team roles > - Manager team roles can only manage services associated with their team. ## Enable Intelligent Alert Grouping 1. Navigate to **Services** → **Service Directory** and select your desired service. 2. Select the **Settings** tab and click **New Grouping** under **Reduce Noise**. 3. Select **Intelligent**. - _Optional_: To group alerts across multiple services, select additional services in the **Select Services to group the alerts** dropdown. See [Global Alert Grouping](/ai-automation/aiops/noise-reduction/alert-grouping/global-alert-grouping#intelligent) for more information. 4. Select the desired grouping time window for alerts on the service. The **Recommended** time window in the dropdown uses historical service data to calculate the average time between alerts. 5. Click **Save**. 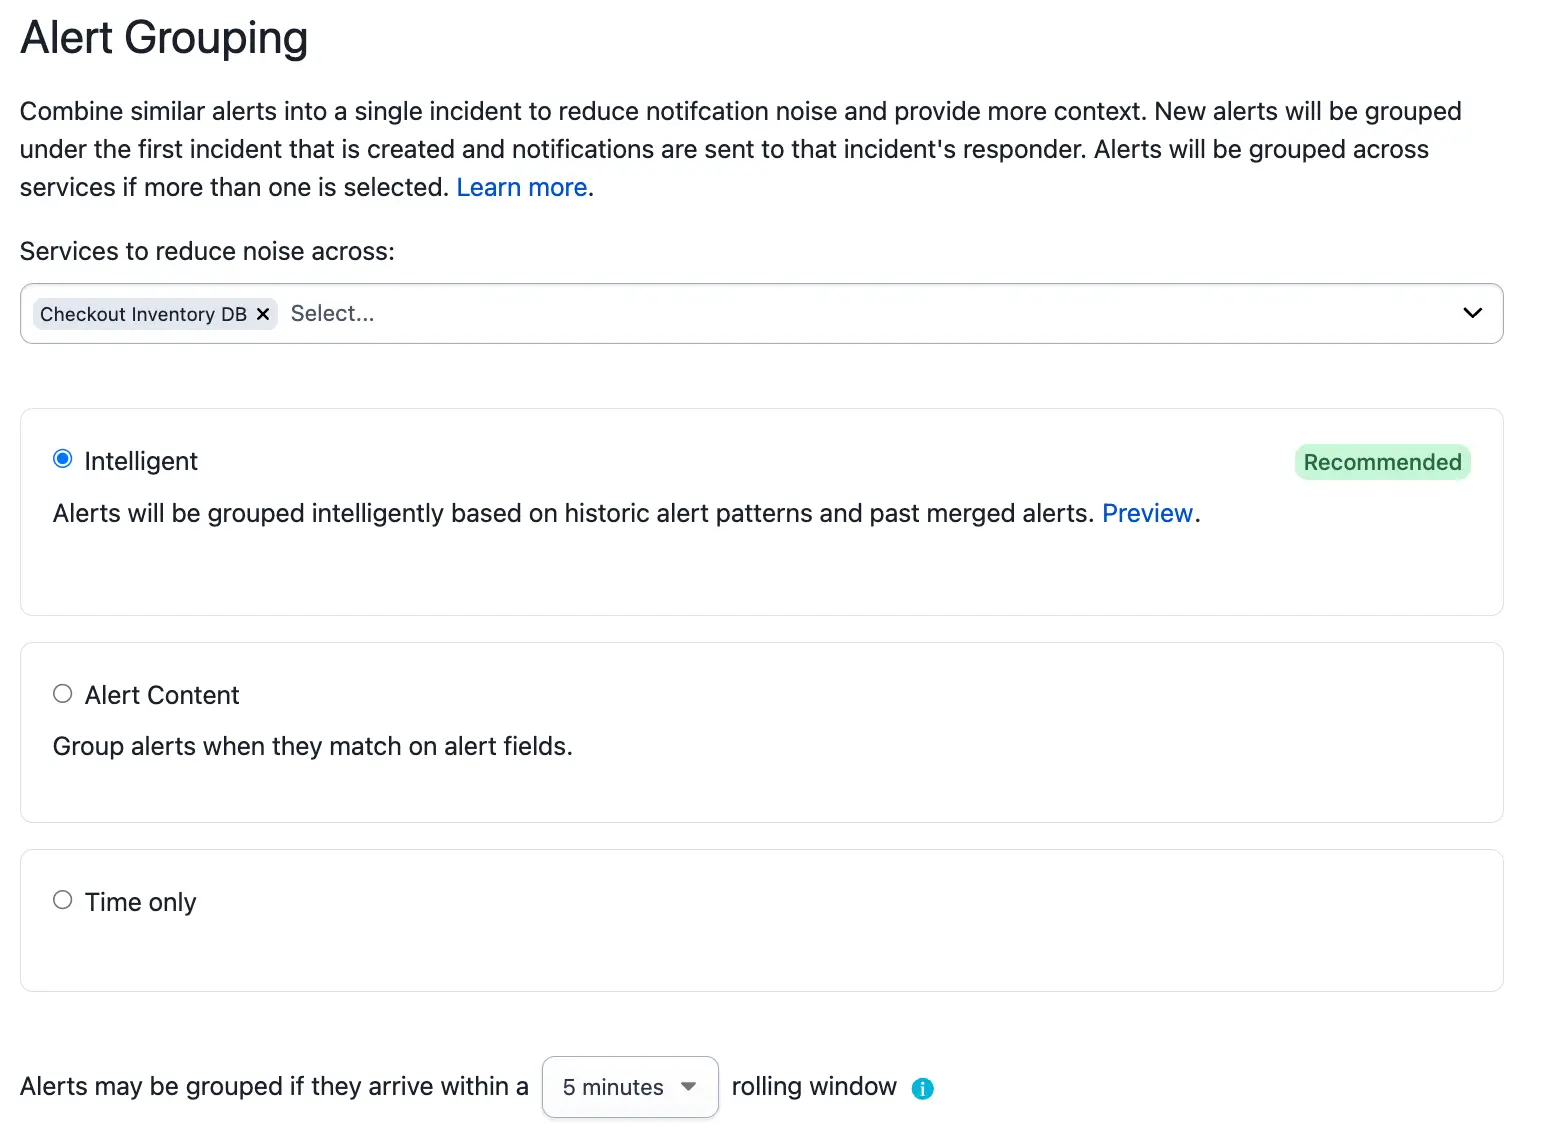 *Intelligent Alert Grouping on a service* > **Scope:** Intelligent Alert Grouping only looks at alerts on a single service and does not group alerts from other services. It does, however, consider alerts sent to other integrations on the same service, if any exist. > > See [Global Alert Grouping](/ai-automation/aiops/noise-reduction/alert-grouping/global-alert-grouping) if you are interested in grouping alerts across multiple services. > **How PagerDuty Uses Intelligent Alert Grouping:** PagerDuty's DataOps team uses Intelligent Alert Grouping to manage high incident volumes across multiple monitors. By implementing alert suppression and intelligent grouping, they achieved a 37% reduction in incidents and increased efficiency two to three times, allowing 10 FTEs to support a workload that would typically require 20–30 FTEs. This automation eliminated the productivity loss from manually grouping duplicate incidents and helped resolve issues faster. [Read the full story →](https://www.pagerduty.com/ops-guides/using-pd/dataops-team/) ## View Intelligent Alert Grouping on an Incident You can see Intelligent Alert Grouping actively grouping alerts on an incident's detail page under the **Alerts** tab. The **Grouping Now** label indicates that an incident is using alert grouping. You can also see how many alerts are grouped into the incident and their status. In the example below, two alerts have been grouped: one is triggered and the other is resolved. 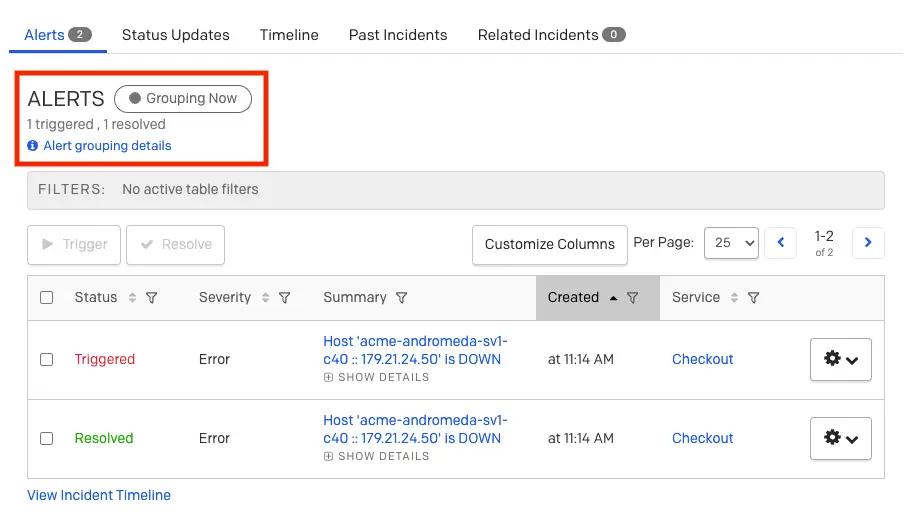 *View Intelligent Alert Grouping* Select **Alert grouping details** to see which [Alert Grouping](/ai-automation/aiops/noise-reduction/alert-grouping) method is in effect, when grouping started, and the conditions under which grouping stops. 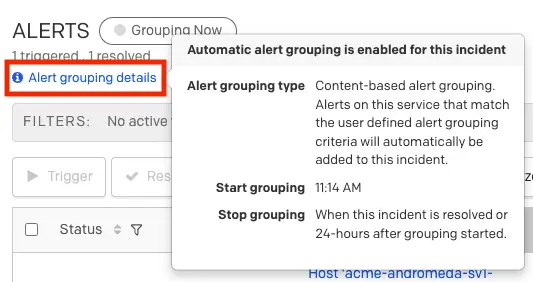 *Alert grouping details* ## Disable Intelligent Alert Grouping To select a different grouping method or disable Alert Grouping entirely: 1. Navigate to **Services** → **Service Directory** and select your desired service. 2. Select the **Settings** tab and click **Edit** next to **Reduce Noise**. 3. Click **Delete** in the bottom-left corner. 4. Click **Delete** in the confirmation modal. > **Non-Reversible Action:** This action cannot be undone. ## Advanced Options > **Advanced Options for AIOps Customers:** Advanced Options — including configuring grouping fields and resetting the learner cache — are only available to PagerDuty AIOps customers and are not available on Legacy Event Intelligence plans. Advanced Options allow you to customize which alert fields the grouping model analyzes when determining textual similarities, and to reset the grouping model's learner cache. - [Configure Grouping Fields](#configure-grouping-fields): Choose up to five fields, including standard [Common Event Format (PD-CEF)](/developer/api/pd-cef) fields and custom details, for a comprehensive alert grouping analysis. - [Reset Learner Cache](#reset-learner-cache): Reset the learner cache. 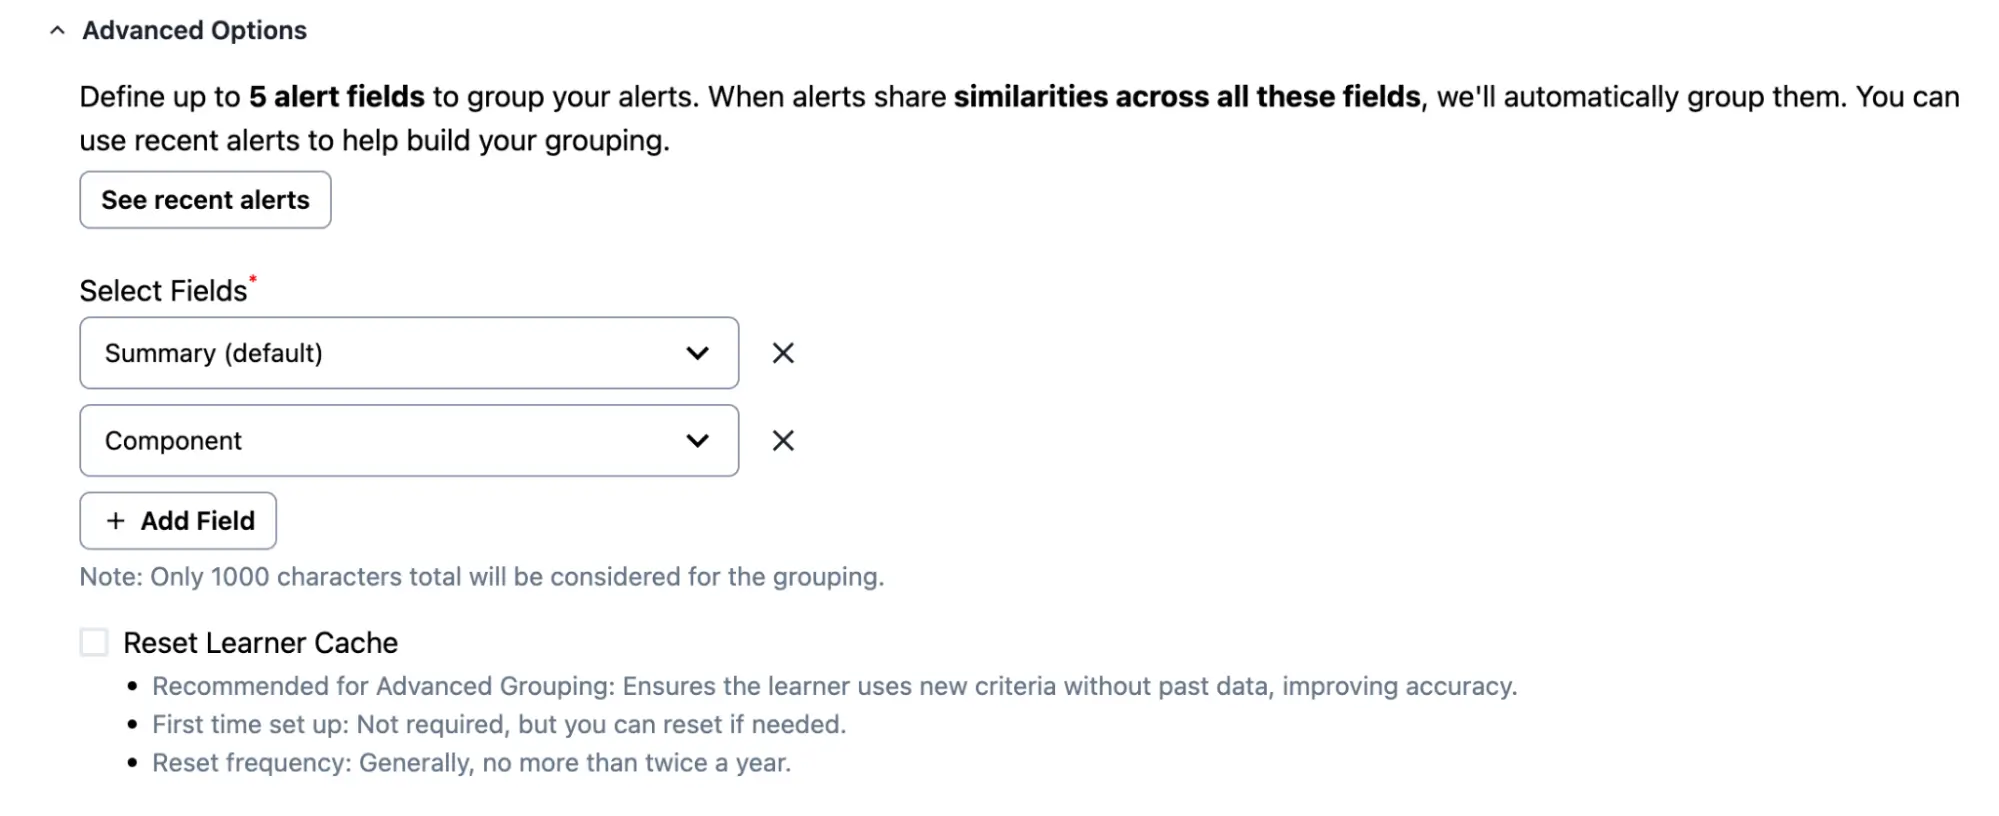 *Advanced Options* ### Configure Grouping Fields By default, Intelligent Alert Grouping uses alerts' **Summary** field to determine textual similarity. Depending on your event data, you may want to use alternate fields to determine similarity. 1. While [configuring Intelligent Alert Grouping](#enable-intelligent-alert-grouping), click the **Advanced Options** dropdown. 2. Under **Select Fields**, select a field from the dropdown for the Intelligent Alert Grouping model to consider for textual similarity. - If you select **Custom Details**, enter a **Custom field name**. 3. _Optional_: Click **Add Field** and select another field. You can repeat this step to configure up to five fields. 4. Click **Save**. > **Considerations:** - **Summary** is the only required field. If you do not select **Summary**, it is possible that all selected fields will be blank — in which case no alert grouping occurs because all selected fields are empty. > - When any selected field is blank, that field is not analyzed or considered for grouping. The model only considers fields with available data. > - Intelligent Alert Grouping analyzes selected fields for textual similarity and does not evaluate based on exact matches. To specify exact matching criteria, use the [Intelligent + Alert Content](/ai-automation/aiops/noise-reduction/alert-grouping/unified-alert-grouping) option. > - The maximum number of characters across all selected fields is 1,000. ### Reset Learner Cache This option resets the grouping model's learner cache. This can be useful if a service's data structure changes significantly or after a period of testing. 1. While [configuring Intelligent Alert Grouping](#enable-intelligent-alert-grouping), click the **Advanced Options** dropdown. 2. Enable the **Reset learner cache** checkbox. 3. Click **Save**. ## Algorithm Behavior The Intelligent Alert Grouping algorithm observes real-time alert data and incident history and adapts as new alerts trigger on a service. After you have [enabled Intelligent Alert Grouping](#enable-intelligent-alert-grouping) on a service, no explicit configuration is required, though you may optionally configure the [Flexible Time Window](#flexible-time-window). > **Single-Service Alert Grouping:** The following information applies when you have selected a single service during [configuration](#enable-intelligent-alert-grouping). The algorithm behaves slightly differently when you select more than one service. See [Global Alert Grouping](/ai-automation/aiops/noise-reduction/alert-grouping/global-alert-grouping#algorithm-behavior) for more information. Intelligent Alert Grouping groups an alert into an existing incident when all of the following criteria are met: 1. The most recent alert was created within the specified grouping time window. This works on a rolling basis — the timestamp on the incoming alert is compared to the most recently grouped alert. 2. The incident is less than 24 hours old. 3. The Intelligent Alert Grouping algorithm determines that the alerts are similar. Alerts that do not meet these criteria trigger a new incident. The algorithm also reacts to feedback from you and your team. The best way for the algorithm to learn and adapt is to manually merge related incidents and to manually move alerts to a different incident when they are not related. See [Merge Incidents](/incident-management/incidents/edit-incidents#merge-incidents) for more information. Alert titles can also be updated automatically using [Event Orchestration](/ai-automation/aiops/event-orchestration#event-fields), which influences the algorithm. > **Merge Incidents API:** Merging and unmerging alerts through the API does not factor into the Intelligent Alert Grouping algorithm. Only manual merges and unmerges in the PagerDuty web app influence the algorithm. PagerDuty strongly recommends against sending test data to try to influence the algorithm, as this can result in unpredictable behavior. ### Flexible Time Window You can configure the grouping time window on each service. The **Recommended** time window is calculated from the average time between alerts using historical service data. The larger the grouping time window, the higher the chance of overgrouping — where an unrelated alert is grouped into an incident. After increasing the time window, monitor alert grouping on the service for a period of time and adjust as needed based on accuracy. > **Best Practice:** For critical services, use the standard five-minute grouping window unless you are not seeing a satisfactory reduction in noise or the service owner deems a larger window appropriate. If you increase the time window, do so gradually and monitor closely to confirm that only the desired alerts are grouped. ## FAQ **Can you enable the grouping time window via API?** Yes. The time window can be enabled using the [Update a service](/developer/api/reference/rest/services/update-service) API endpoint and specified in seconds up to 3,600 seconds. You can enable the recommended time window by setting the time window to zero: `"time_window": 0`. **Can you retrieve the grouping time window via API?** Yes. You can retrieve the grouping time window using the [Get a service](/developer/api/reference/rest/services/get-service) API endpoint via `alert_grouping_parameters.config.recommended_time_window`. **Does the recommended time window update dynamically once enabled?** Whenever you view or edit a service's recommended time window in the [web app](#enable-intelligent-alert-grouping) or via the [Get a service](/developer/api/reference/rest/services/get-service) API endpoint (`alert_grouping_parameters.config.recommended_time_window`), PagerDuty recalculates the recommended value to show the latest figure. However, the grouping time window remains static unless changed manually. **Can we expose the machine learning-based model via the API?** No, not at this time. **Can we plug our own machine learning code into PagerDuty?** No, not at this time. **Does this take into account rules or correlations configured outside of PagerDuty?** No. This model is entirely based on actions taken within PagerDuty. **Does it affect the machine learning capabilities if I rename the service?** No, it does not. **Can Intelligent Alert Grouping group alerts together from multiple services?** By default, Intelligent Alert Grouping only looks at alerts from a single service. To group alerts from different services, see [Global Alert Grouping](/ai-automation/aiops/noise-reduction/alert-grouping/global-alert-grouping). **Why didn't my alerts get grouped together?** There are three main reasons the algorithm may not have grouped alerts on the same service: 1. The alerts did not arrive within the time window specified for that service. 2. The incoming alert data was not similar enough to the desired alerts, or was more similar to the alerts it was grouped with. 3. Human response behavior — such as merging or moving alerts out of incidents — overrode the desired behavior. The algorithm takes several factors into consideration, which makes tracing specific grouping decisions difficult. If you believe there has been enough history for an alert to be grouped but are still seeing unexpected grouping behavior, contact [the Support team](mailto:support@pagerduty.com) with links to specific incidents and alert groupings and a summary of why the behavior is unexpected. **Why don't I see any alert grouping options?** Your current pricing plan may not support Alert Grouping. If you are interested in trying Alert Grouping, [contact the Sales team](https://www.pagerduty.com/contact-us/#contact-sales) to start a free PagerDuty AIOps trial. **Is there a limit to how many alerts can group into a single incident?** Yes. Incidents are limited to 1,000 alerts each. After this limit is reached, a new incident is created and subsequent alerts are grouped into the new incident. **Are incidents resolved only when all alerts within that incident are resolved?** Yes. An incident resolves when all of its associated alerts are resolved. Similarly, if you resolve an incident, PagerDuty automatically resolves any associated triggered alerts. See [Resolve Alerts](/incident-management/incidents/alerts#resolve-alerts) for more information.
--- URL: https://docs.pagerduty.com/ai-automation/aiops/noise-reduction/alert-grouping/preview-intelligent-alert-grouping # Preview Intelligent Alert Grouping Preview how the Intelligent Alert Grouping algorithm would automatically group existing alerts The Preview Intelligent Alert Grouping feature gives service owners an overview of how [Intelligent Alert Grouping](/ai-automation/aiops/noise-reduction/alert-grouping/intelligent-alert-grouping) would have grouped historic alerts into incidents. This information can help inform how Intelligent Alert Grouping will group future alerts, since automatically grouped alerts mean fewer overall incidents and interruptions for responders. > **AIOps / Signal Intelligence Feature:** This feature is included with the [PagerDuty AIOps](/ai-automation/aiops/overview) add-on, or included as Signal Intelligence in PD Reliability Platform plans. To sign up for a trial of PagerDuty AIOps features, read [PagerDuty AIOps Trials](/ai-automation/aiops/overview#pagerduty-aiops-trials). > **AIOps Service Configuration:** Your service configuration must have AIOps enabled to use this feature. See [Configurable Service Settings](/incident-management/services/configurable-service-settings#manage-aiops) for more information and enablement steps. ## View the Preview Intelligent Alert Grouping Feature Services with a high volume of incidents, and some variance in their incident titles, tend to have the most interesting and meaningful previews. You can find the Preview Intelligent Alert Grouping feature by selecting an appropriate service in the web app: 1. Navigate to **Services** → **Service Directory** and select the **name** of your desired service. 2. Select the **Settings** tab, scroll to the **Reduce Noise** section, and click **Edit**/**New Grouping**. 3. With **Intelligent** selected, click **Preview**. 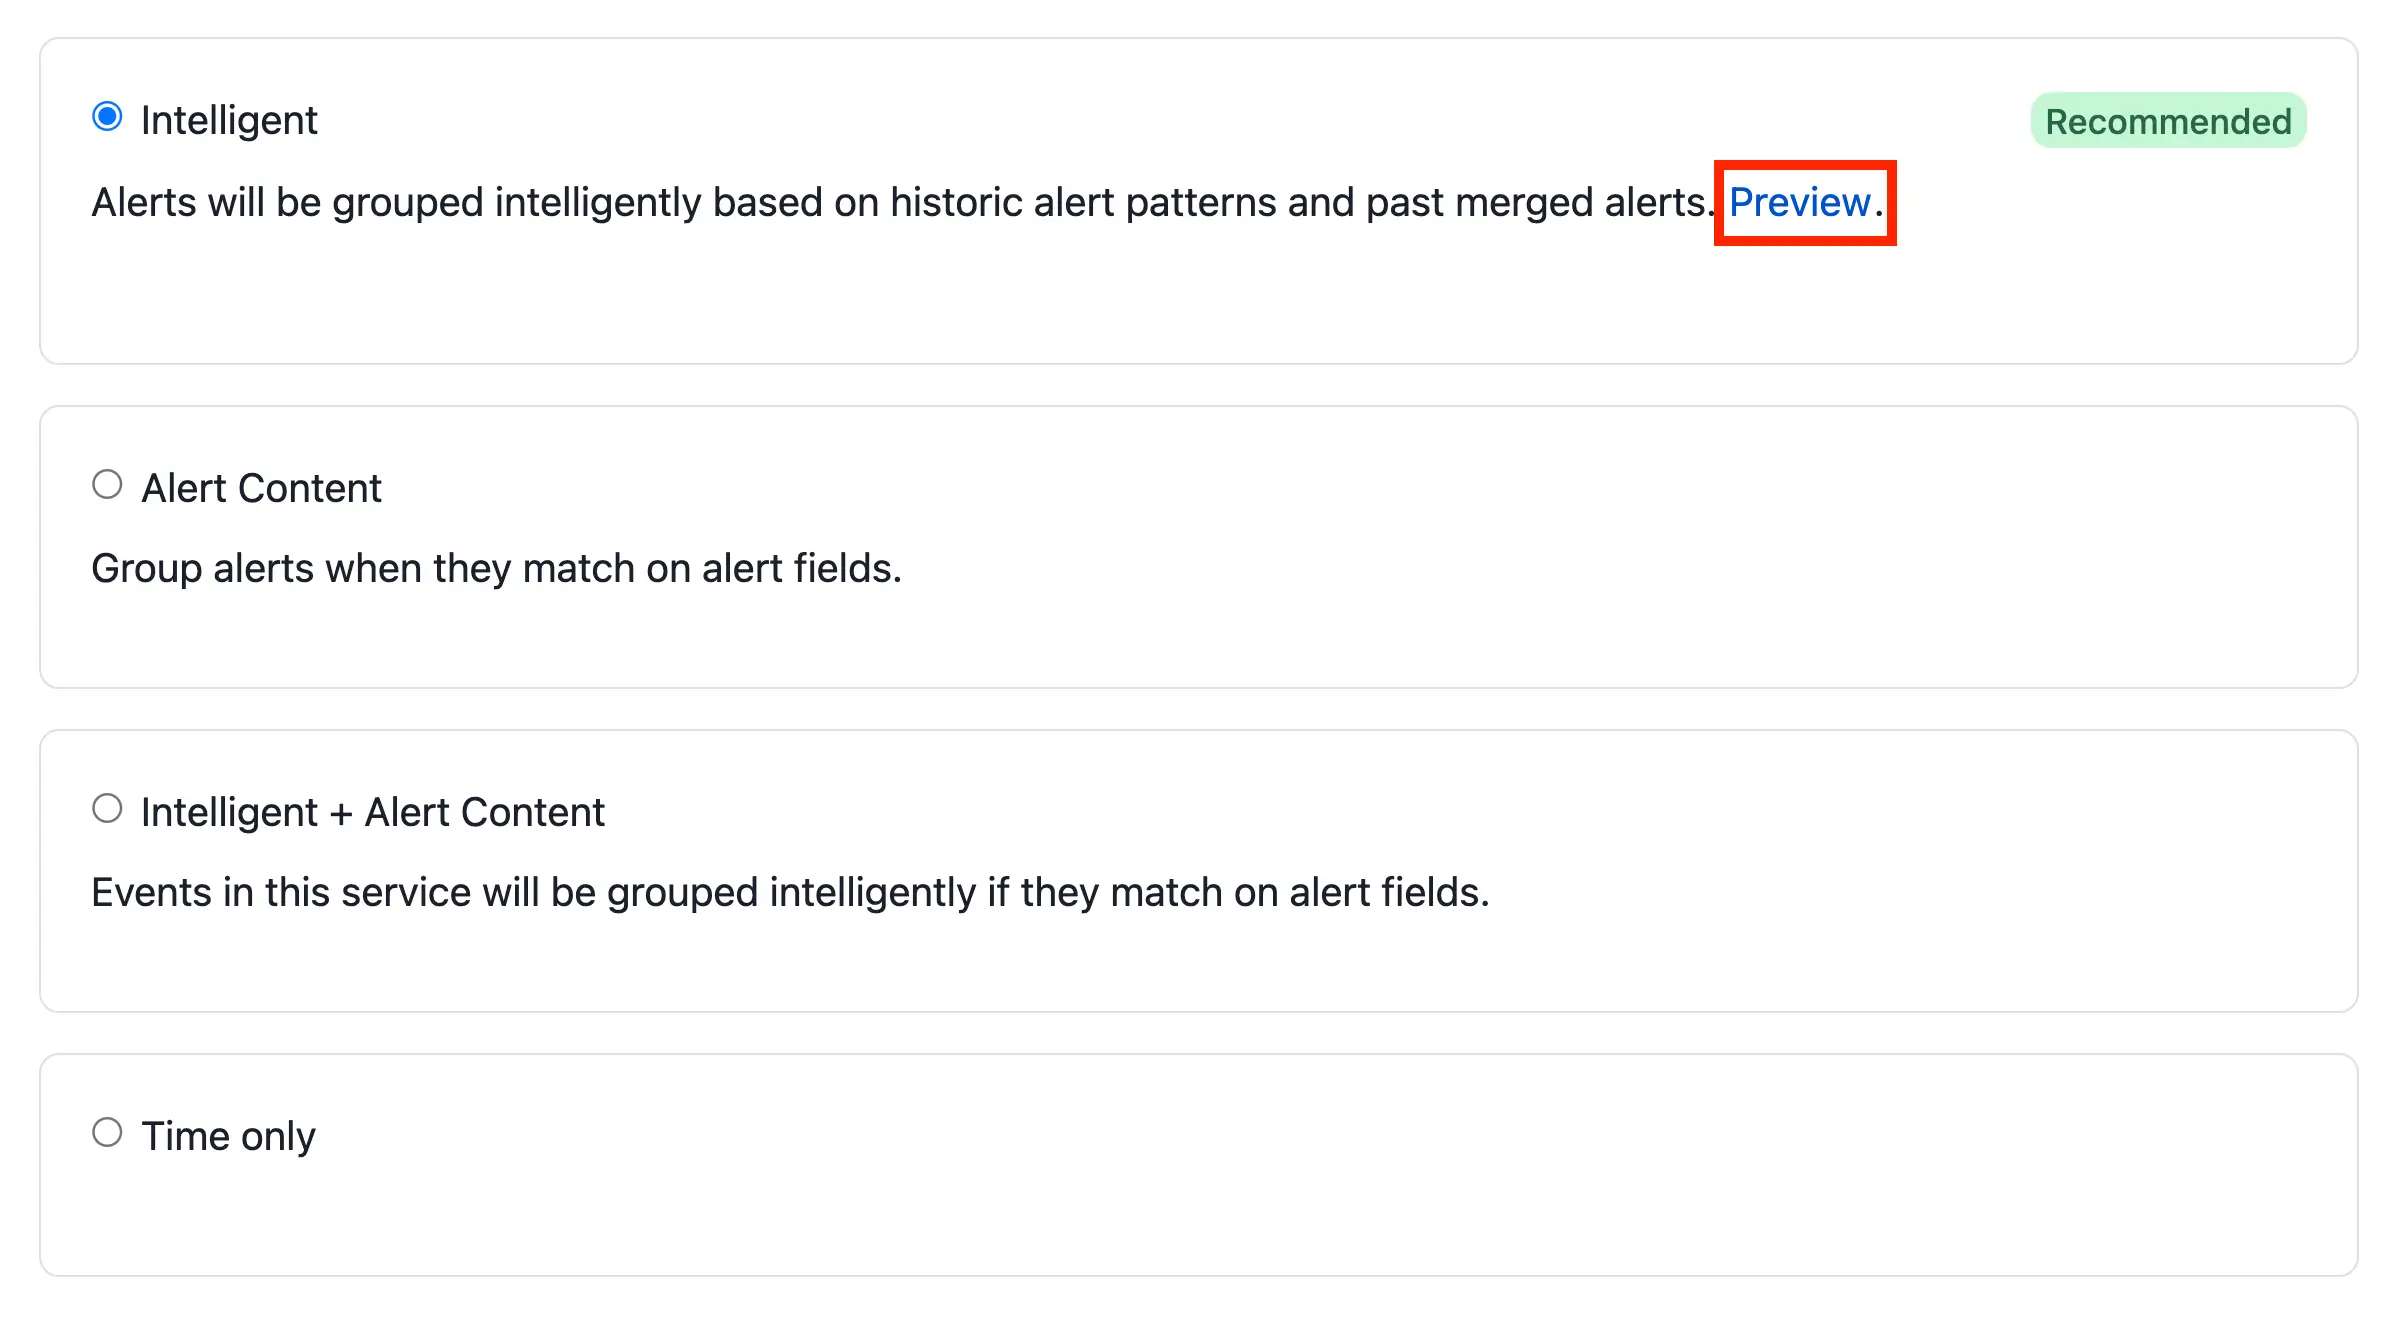 *Select Preview link* > **PagerDuty AIOps Trial:** If you do not see **Intelligent** as an option and you would like a free trial of Intelligent Alert Grouping, read [PagerDuty AIOps Trials](/ai-automation/aiops/overview#pagerduty-aiops-trials). ### Preview Details The preview modal provides a rich view of how alerts would have been grouped into incidents over a given period of time. Previews are generated once a day and are based on alerts from the past 45 days. The preview indicates the number of incidents that would have triggered without alert grouping, and how many fewer incidents your team would have been notified for if Intelligent Alert Grouping had been enabled. The preview assumes a five-minute time window unless a time window with a different duration has been set for that service. You can see metrics at the top of the preview, which are all calculated based on: - **Alerts**: The total number of [Alerts](/incident-management/incidents/alerts) this service has seen within the past 45 days. - **Incidents**: The total number of incidents within the past 45 days this service would have seen without turning on any alert grouping. - **Number of Unique Incidents**: The number of incidents that would have been triggered within the past 45 days, if the service had had Intelligent Alert Grouping turned on. - **Number of Incidents Saved**: The number of incidents that would have been saved from a trigger within the past 45 days, if the service had had Intelligent Alert Grouping turned on. 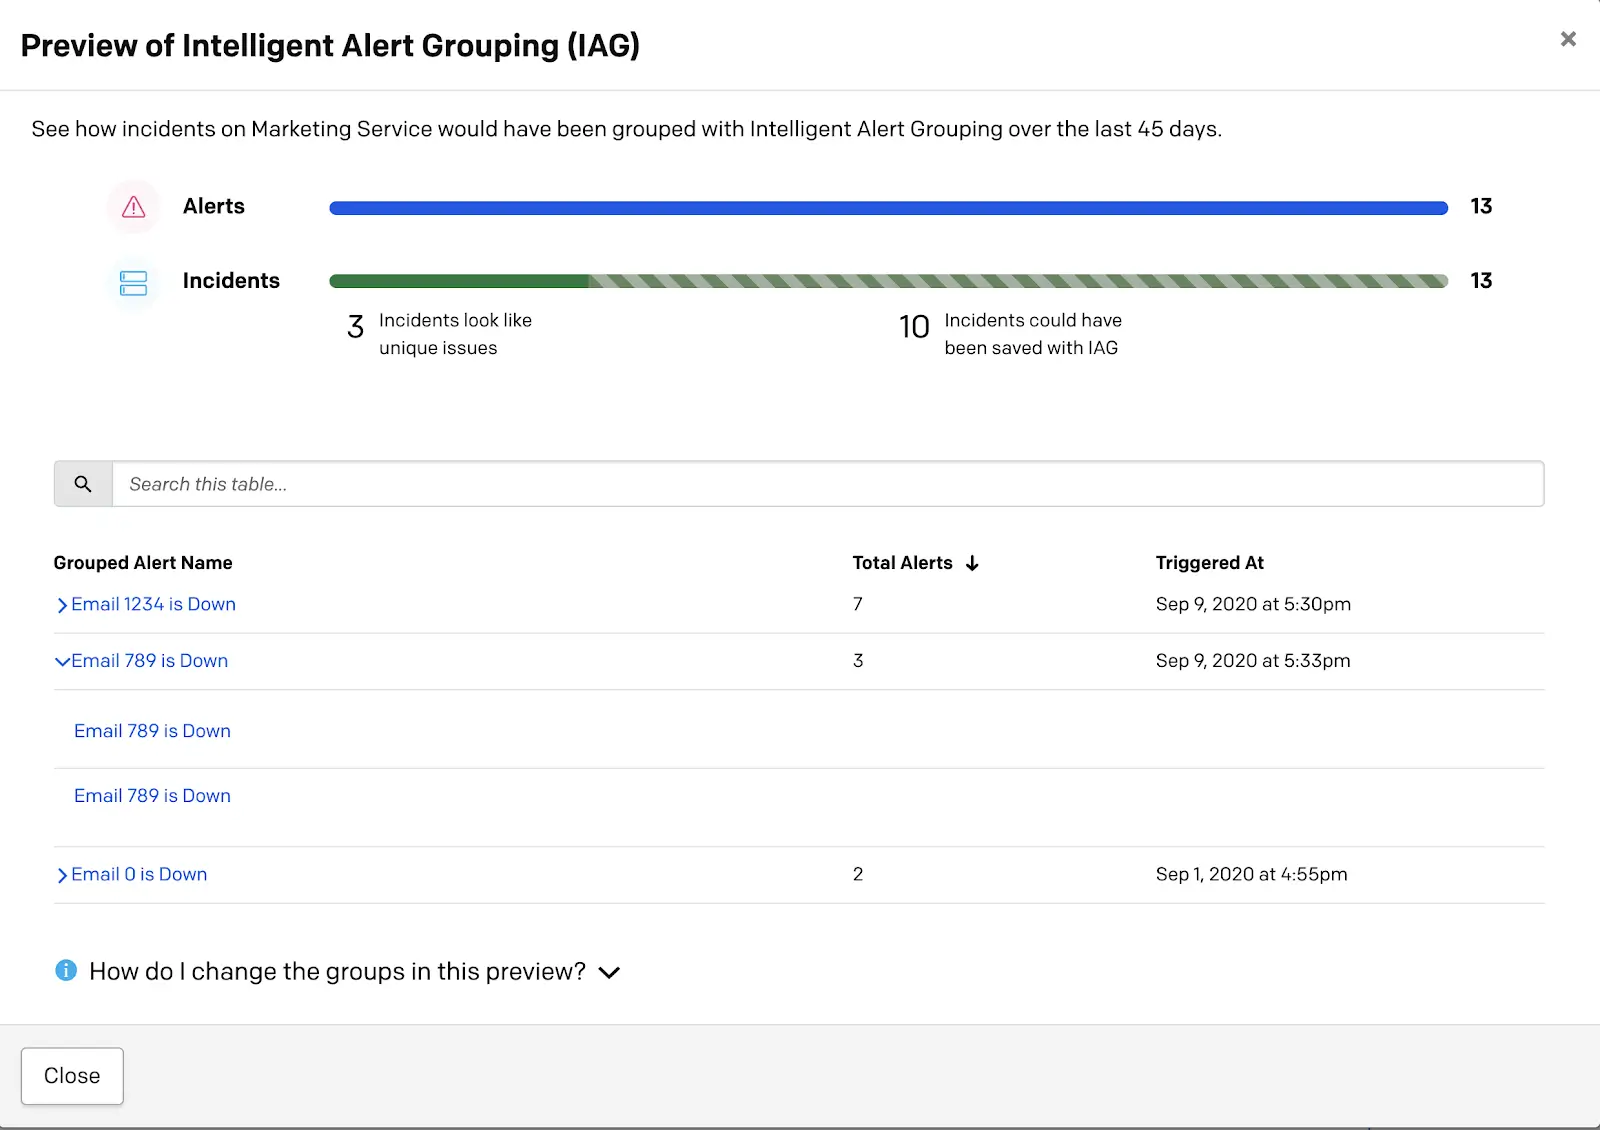 *Preview Intelligent Alert Grouping* You can expand each alert group to see how many, and which, alerts would have been grouped together into an incident. The date and time listed reflect when the first incoming alert was triggered. Note that the incident's title is derived from the first incoming alert. Read more about this in the [Alerts](/incident-management/incidents/alerts#alerts-and-incident-titles) article. Some services may have a large number of alert groups in this list. PagerDuty recommends looking at some of the larger groups to get a sense of the grouping algorithm's behavior. To learn more about the grouping algorithm, see [Intelligent Alert Grouping](/ai-automation/aiops/noise-reduction/alert-grouping/intelligent-alert-grouping#algorithm-behavior). ## FAQ **I just triggered an incident/alert, why is it not appearing in the preview?** Previews are not generated in real time. They are generated once a day. If you have new alert data that you would like the preview to take into account, check back in 24 hours, after the next preview has been generated. **When will the preview on my service be updated?** New previews are calculated once a day, provided there have been sufficient alerts in the last few months. If a preview is unavailable on your service, it could be because the Intelligent Alert Grouping algorithm does not have enough data to generate a new preview. Existing previews are only deleted when a new preview is available to replace it. **Some alerts appear under incidents that I wouldn't want to be grouped together. How can I adjust these groups?** While the preview is static and cannot be changed directly, you can still provide feedback on the quality of the groups you see and this feedback helps the algorithm learn and create better groups. To provide feedback on the groups, go to the original incident and assign the alert to another incident, or merge incidents together. Read [Editing Incidents](/incident-management/incidents/edit-incidents#merge-incidents) for more information about moving alerts from one incident to another. After moving alerts and/or merging incidents, your changes are not immediately reflected in the current preview, however you may notice a difference in the next preview. **Why do I see fewer alert groups than expected?** The preview's table displays alert groups that have two or more alerts. Furthermore, only the top 10 alert groups are displayed, sorted by alert count. --- URL: https://docs.pagerduty.com/ai-automation/aiops/noise-reduction/alert-grouping/time-based-alert-grouping # Time-Based Alert Grouping Automatically group incoming alerts into open incidents based on the time they are generated Time-Based Alert Grouping automatically adds alerts to an open incident for a predetermined period. This feature is helpful for services that generate many alerts. Grouped alerts mean fewer incidents and interruptions for responders, richer context for triggered incidents, and lower resolution times. > **AIOps / Signal Intelligence Feature:** This feature is included with the [PagerDuty AIOps](/ai-automation/aiops/overview) add-on, or included as Signal Intelligence in PD Reliability Platform plans. To sign up for a trial of PagerDuty AIOps features, read [PagerDuty AIOps Trials](/ai-automation/aiops/overview#pagerduty-aiops-trials). > **AIOps Service Configuration:** Your service configuration must have AIOps enabled to use this feature. See [Configurable Service Settings](/incident-management/services/configurable-service-settings#manage-aiops) for more information and enablement steps. > **Legacy Availability:** This feature is also available with [Legacy Event Intelligence](/ai-automation/aiops/legacy-event-intelligence). > **Required User Permission:** You can edit a service's alert grouping settings if you have one of the following roles: > > - Account Owner > - Admin and Global Admin > - User > - Manager base role and team roles > - Manager team roles can only manage services associated with their team. ## Enable Time-Based Alert Grouping 1. In the web app, navigate to **Services** → **Service Directory** and click your preferred service's **name**. 2. Select the **Settings** tab and click **New Grouping** or **Edit** in the **Reduce Noise** section. 3. Select **Time only** and select a duration from the dropdown. 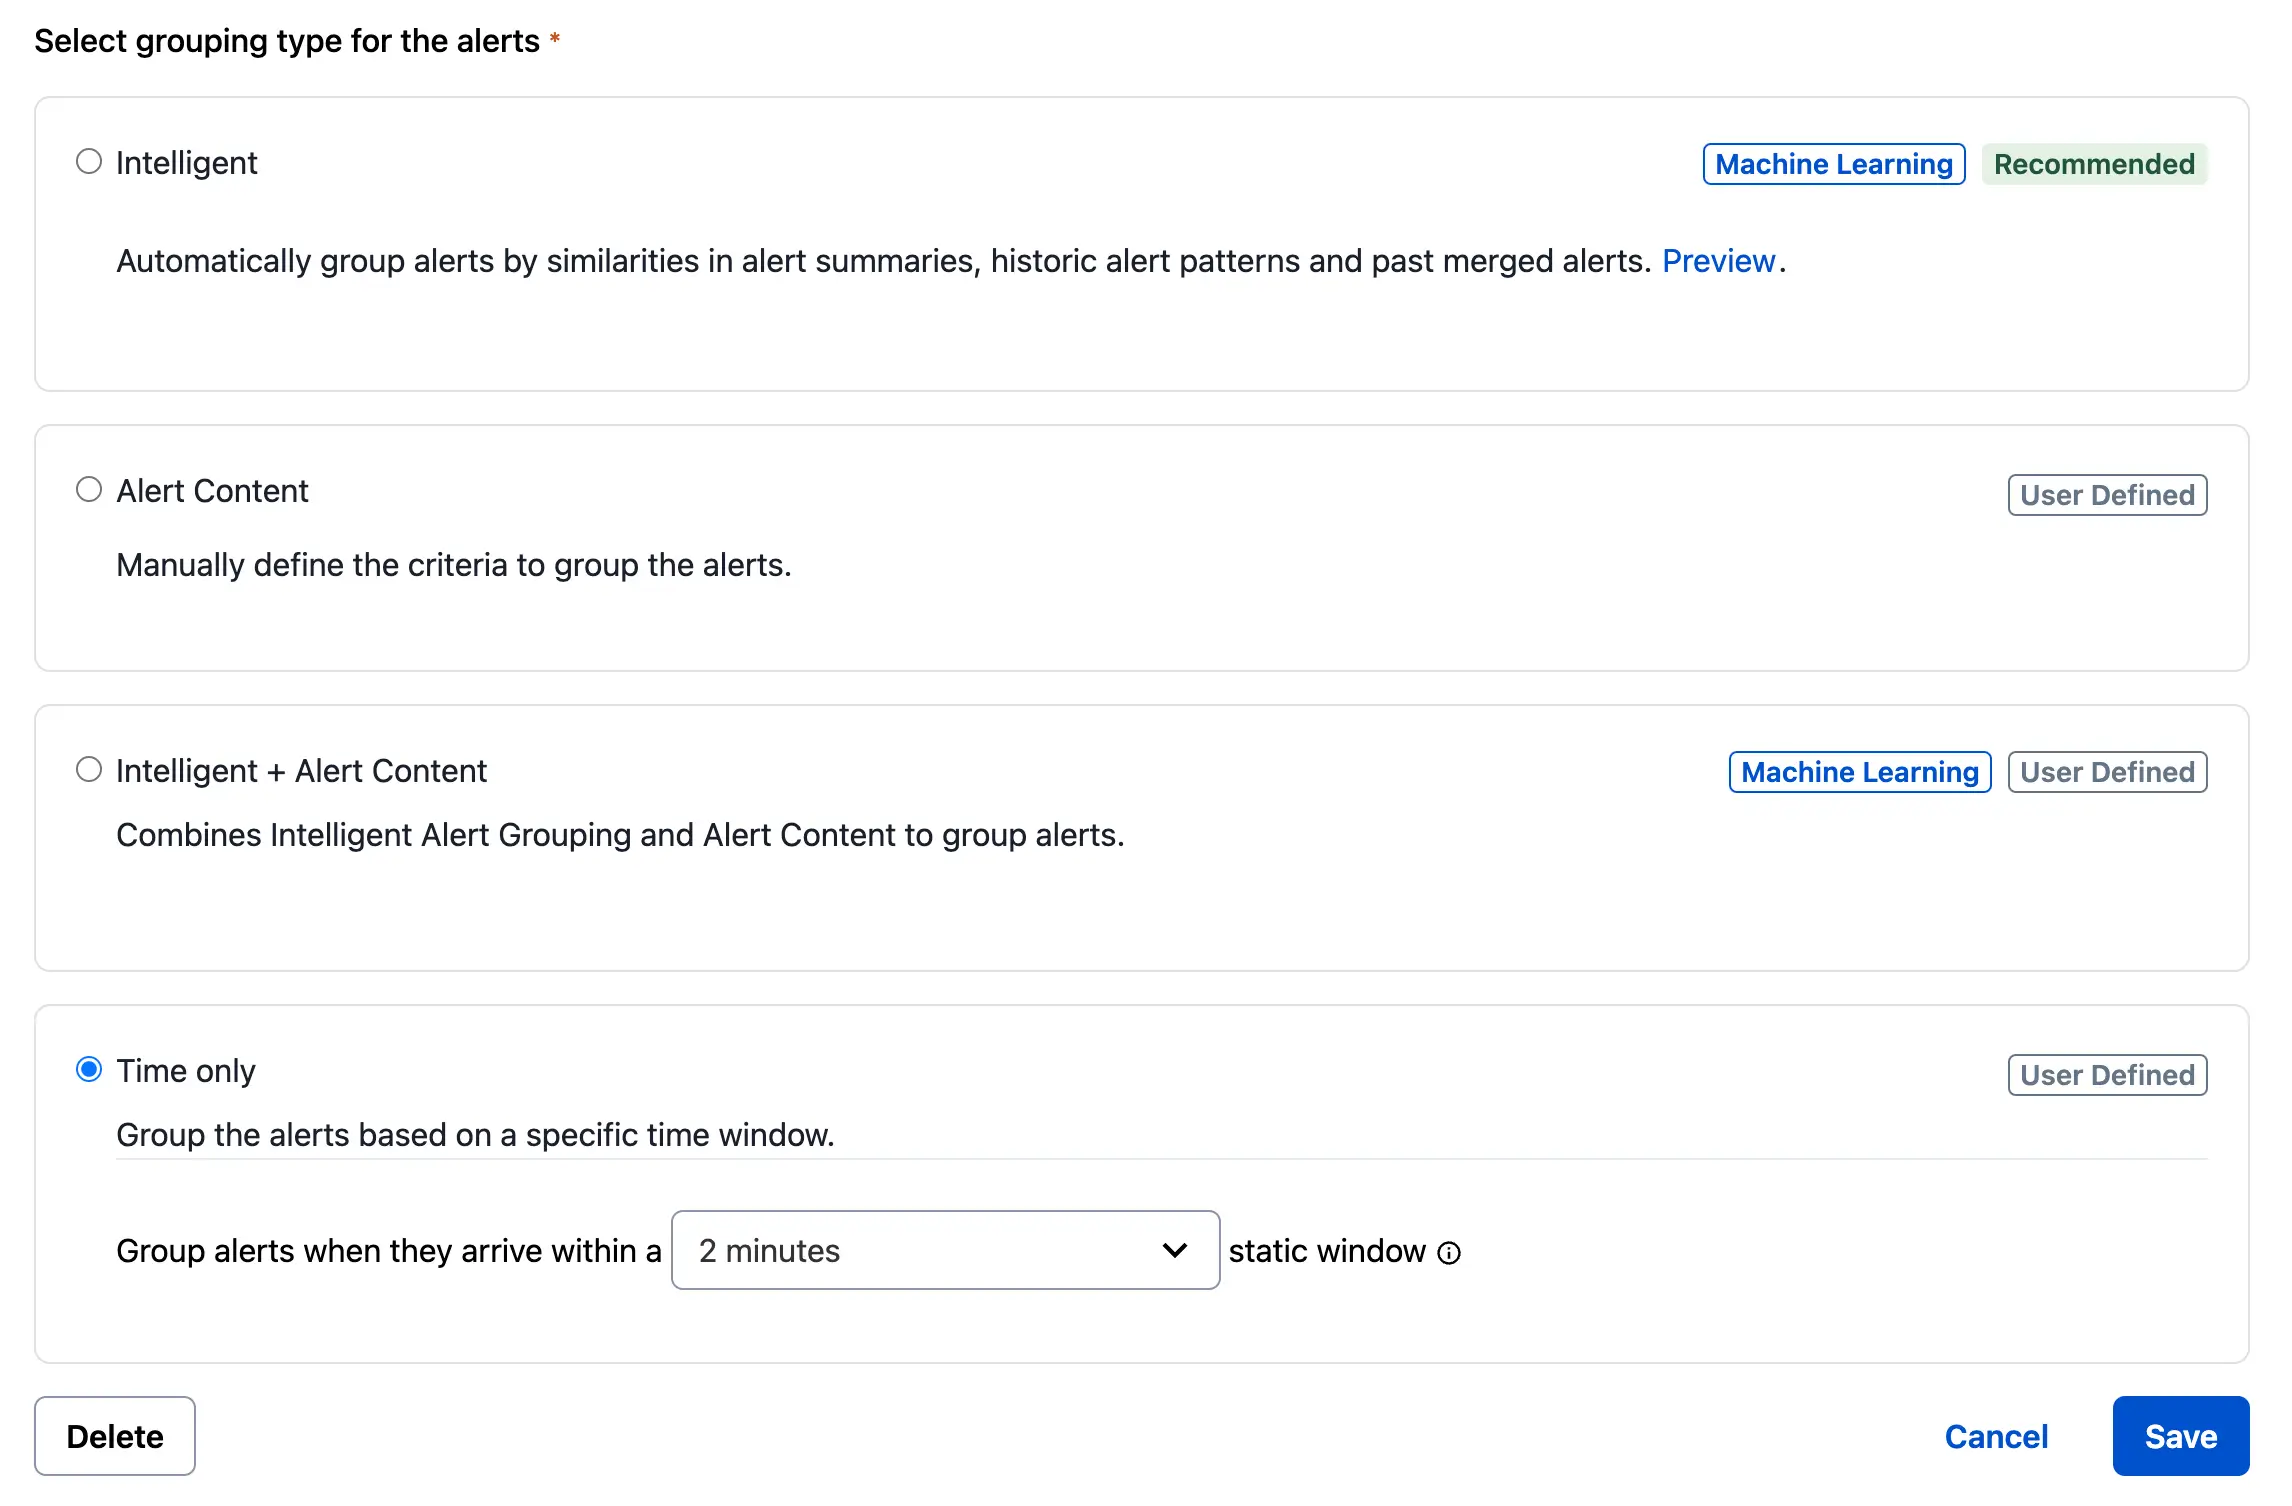 *Enable Time-Based Alert Grouping* 4. Click **Save**. ## Disable Time-Based Alert Grouping 1. In the web app, navigate to **Services** → **Service Directory** and click the **name** of your desired service. 2. Select the **Settings** tab and click **Edit** in the **Reduce Noise** section. 3. In the bottom-left, click **Delete**. In the confirmation modal, click **Delete** again. - **Note**: This action cannot be undone. ## Time-Based Alert Grouping Behavior When you enable Time-Based Alert Grouping on a service, the first alert creates a new incident. Subsequent alerts add to that incident for the specified time period while the incident remains open (that is, **triggered** or **acknowledged**). If the incident resolves within the selected time period, the timer stops, and subsequent alerts do not group into that incident. The timer restarts when the next alert on that service arrives and triggers a new incident. If the incident does not resolve within the selected time period, the incident remains open and the next alert triggers a new incident. Subsequent alerts group into the most recent incident. If you select **until incident is resolved** for the duration of the timer, the first alert on the service triggers an incident and all subsequent alerts group into that incident until it resolves, regardless of how much time passes. ## Time-Based Alert Grouping Example This example uses a **Shopping Cart** service with a one-hour time-based alert grouping window. | Time | Example 1: Incident resolves within 45 minutes | Example 2: Incident does not resolve within one hour | | :--------- | :------------------------------------------------------------------------------------------------------------------------------------------------------------------------------------------------------------- | :-------------------------------------------------------------------------------------------------------------------------------------------------------------------------- | | 10:00 a.m. | TRIGGER: An alert triggers and creates Incident 1. The one-hour timer begins, set to group all new alerts on the **Shopping Cart** service into Incident 1 until 11:00 a.m. | TRIGGER: An alert triggers and creates Incident 1. The one-hour timer begins, set to group all new alerts on the **Shopping Cart** service into Incident 1 until 11:00 a.m. | | 10:07 a.m. | ACKNOWLEDGE: Responder acknowledges Incident 1. | ACKNOWLEDGE: Responder acknowledges Incident 1. | | 10:15 a.m. | Five more alerts come in on **Shopping Cart**. Incident 1 now has six alerts, all triggered. | Five more alerts come in on **Shopping Cart**. Incident 1 now has six alerts, all triggered. | | 10:45 a.m. | RESOLVE: The responder resolves Incident 1. New alerts on the **Shopping Cart** service no longer group into Incident 1. | Incident 1 remains in the acknowledged state and groups alerts. | | 10:55 a.m. | TRIGGER: An alert comes in on the **Shopping Cart** service and creates Incident 2. A new one-hour timer begins, set to group all new alerts on the **Shopping Cart** service into Incident 2 until 11:55 a.m. | An alert comes in on **Shopping Cart** and groups into Incident 1. Incident 1 now has seven alerts: three resolved, four triggered. | | 11:00 a.m. | Incident 1 is resolved, Incident 2 is triggered with one alert. | Incident 1 remains acknowledged, the timer expires, and PagerDuty no longer actively groups new alerts into Incident 1. Incident 1 is acknowledged with seven alerts. | | 11:10 a.m. | An alert comes in and groups into Incident 2. Incident 2 now has two alerts. | TRIGGER: An alert comes in and creates Incident 2. The one-hour timer begins, set to group all new alerts on the **Shopping Cart** service into Incident 2 until 12:10 a.m. | ## FAQ **Can I move grouped alerts to another incident?** If Time-Based Alert Grouping adds an alert to an incident that belongs better as part of a different incident, you can move the alert to another incident or create a new incident. For more information, read [Move Alerts to Another Incident](/incident-management/incidents/edit-incidents#move-alerts-to-another-incident). **How does Time-Based Alert Grouping affect incident notifications?** While Time-Based Alert Grouping reduces notification noise, the specific number of times you receive notifications is based on your [notification rules](/account-admin/user-profile/notification-rules). For example, if a service has an [acknowledgement timeout](/incident-management/services/configurable-service-settings#acknowledgement-timeout), responders receive notifications when the timeout expires. **How is Time-Based Alert Grouping different from alert deduplication?** [Deduplication](/incident-management/incidents/event-management#deduplicate-alerts) is configured on a per-integration basis and often requires specific event information, like an incident key or an alert key. When you have multiple integrations on a service, or your monitoring tool generates a variety of alerts, management can become increasingly difficult. Time-Based Alert Grouping allows you to group all incoming events on the service into the current incident for the specified time period, regardless of the monitoring tool (that is, the integration) that generates the original alert. **How is Time-Based Alert Grouping different from snoozing incidents?** [Snoozing](/incident-management/incidents/edit-incidents#snooze-an-incident) an incident keeps it from moving up the escalation chain and notifying you. Snoozing does not prevent new incidents from generating on a service. **Can I manually merge incidents?** Yes, Time-Based Alert Grouping does not affect your ability to manually [merge incidents](/incident-management/incidents/edit-incidents#merge-incidents) or [move alerts from one incident to another](/incident-management/incidents/edit-incidents#move-alerts-to-another-incident). All grouped alerts merge into a single incident. **Can manually triggered incidents be grouped with Alert Grouping?** Manually triggered incidents do not create alerts, do not participate in Alert Grouping, and cannot merge into other incidents. **Will incidents created by REST API be grouped by Time-Based Alert Grouping?** No, like manually created incidents, the [Incidents REST API](/developer/incident-creation-api) bypasses alerts and directly creates incidents. Therefore, Time-Based Alert Grouping does not affect them. This behavior also applies to any integrations that create incidents via REST API, for example, the [ServiceNow](/integrations/servicenow-integration-guide) integration. Events sent via the [Events API v2](/developer/events-api-v2-overview) work with Time-Based Alert Grouping. **Is there a limit to how many alerts can group into a single incident?** Yes, PagerDuty incidents are limited to 1,000 alerts. After reaching this limit, a new incident triggers and subsequent alerts continue to group into the most recent incident. --- URL: https://docs.pagerduty.com/ai-automation/aiops/noise-reduction/alert-grouping/unified-alert-grouping # Unified Alert Grouping Combine Intelligent Alert Grouping's machine learning model with Content-Based Alert Grouping's precision Unified Alert Grouping combines [Content-Based Alert Grouping](/ai-automation/aiops/noise-reduction/alert-grouping/content-based-alert-grouping) and [Intelligent Alert Grouping](/ai-automation/aiops/noise-reduction/alert-grouping/intelligent-alert-grouping) with a flexible time window for increased precision and correlation control. Unified Alert Grouping groups alerts when alert content matches and Intelligent Alert Grouping determines alerts are similar. Alerts group only when both conditions are satisfied. > **AIOps / Signal Intelligence Feature:** This feature is included with the [PagerDuty AIOps](/ai-automation/aiops/overview) add-on, or included as Signal Intelligence in PD Reliability Platform plans. To sign up for a trial of PagerDuty AIOps features, read [PagerDuty AIOps Trials](/ai-automation/aiops/overview#pagerduty-aiops-trials). > **AIOps Service Configuration:** Your service configuration must have AIOps enabled to use this feature. See [Configurable Service Settings](/incident-management/services/configurable-service-settings#manage-aiops) for more information and enablement steps. > **Required User Permissions:** Users with the following roles can edit a service's Alert Grouping settings: > > - Account Owner > - Admin and Global Admin > - User > - Manager base role and Team roles ## Enable Unified Alert Grouping 1. Navigate to **Services** → **Service Directory** and select the name of your desired service. 2. Select the **Settings** tab and click **New Grouping** in the section **Reduce Noise**. 3. Select **Intelligent + Alert Content**. 1. _Optional_: To group alerts across multiple services, select additional services in the dropdown **Select Services to group the alerts**. Read [Global Alert Grouping](/ai-automation/aiops/noise-reduction/alert-grouping/global-alert-grouping#intelligent--alert-content) for more information. 4. Select whether you want alerts to be grouped if **All** or **Any** specified fields match. 1. If **All** is selected, alerts match when content is exactly the same. 2. If **Any** is selected, alerts match when at least one of the fields is present. 5. In the **Select Fields** dropdown, select which alert field you would like to match on before Intelligent Alert Grouping considers alerts' similarity. > **View Alert Payloads:** You can select fields from recent alerts by clicking **See Recent Alerts**. This displays a list of the service's recent alerts. You can click an alert to view the alert's payload and then click on the field you want to match on. 6. _Optional_: Click **Add Field** to add additional content-based matching criteria. 7. Select the desired grouping time window for alerts on the service. The **Recommended** time indicated in the dropdown uses historical service data to calculate the average time between alerts. 8. Click **Save Settings**. ## Disable Unified Alert Grouping To select a different grouping method, or to disable Alert Grouping altogether, in the web app: 1. Navigate to **Services** → **Service Directory** and select the name of your desired service. 2. Select the **Settings** tab and click **Edit** next to **Reduce Noise**. 3. In the bottom-left, click **Delete**. 4. In the confirmation modal, click **Yes, turn off**. ## Unified Alert Grouping Behavior Consider the following alerts: **Alert 1** `Summary: “High CPU load on AWS EC2 instance” custom_details.source:”Datadog”` **Alert 2** `Summary: “High CPU load on AWS EC1 instance” custom_details.source:”Splunk”` [Intelligent Alert Grouping](/ai-automation/aiops/noise-reduction/alert-grouping/intelligent-alert-grouping) by itself would likely detect these two as similar, and group them together. However, with the greater control that Unified Alert Grouping offers, you can specify that alerts should only group if `custom_details.source` matches. As another example, in the following configuration, Unified Alert Grouping specifies that the `host` must match before Intelligent Alert Grouping considers alerts for grouping. 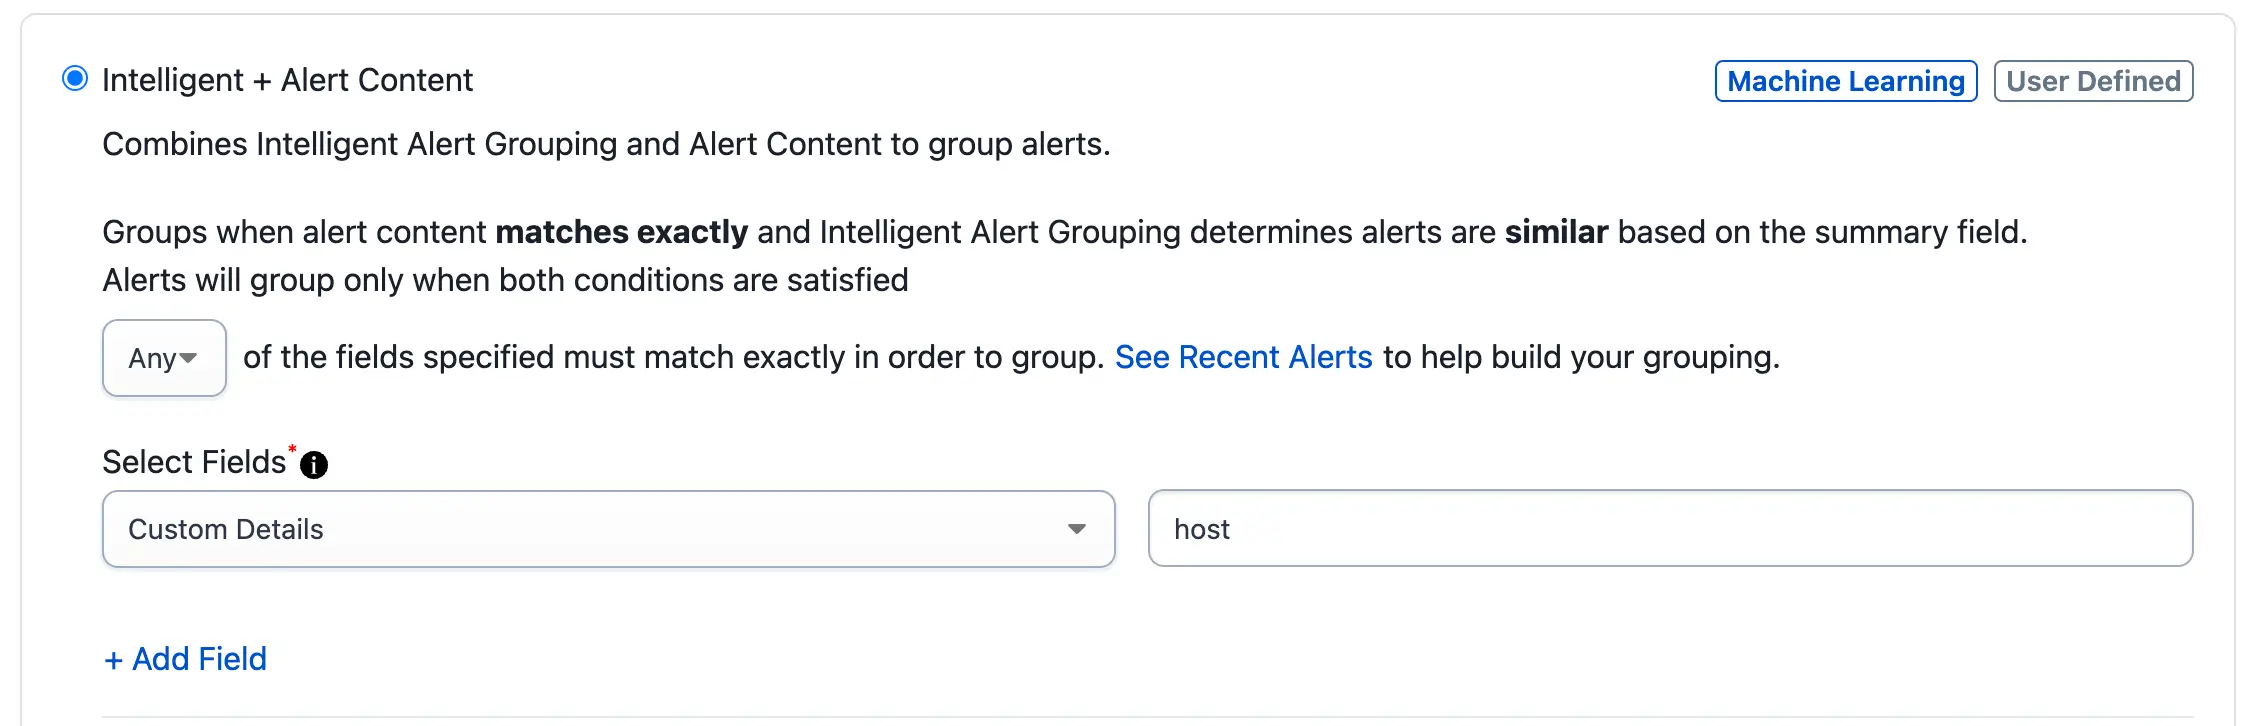 *Alerts must match on custom\_details.host* The incident in the following screenshot shows that the host name matched, and that the summary fields were similar enough for Intelligent Alert Grouping to group them together. 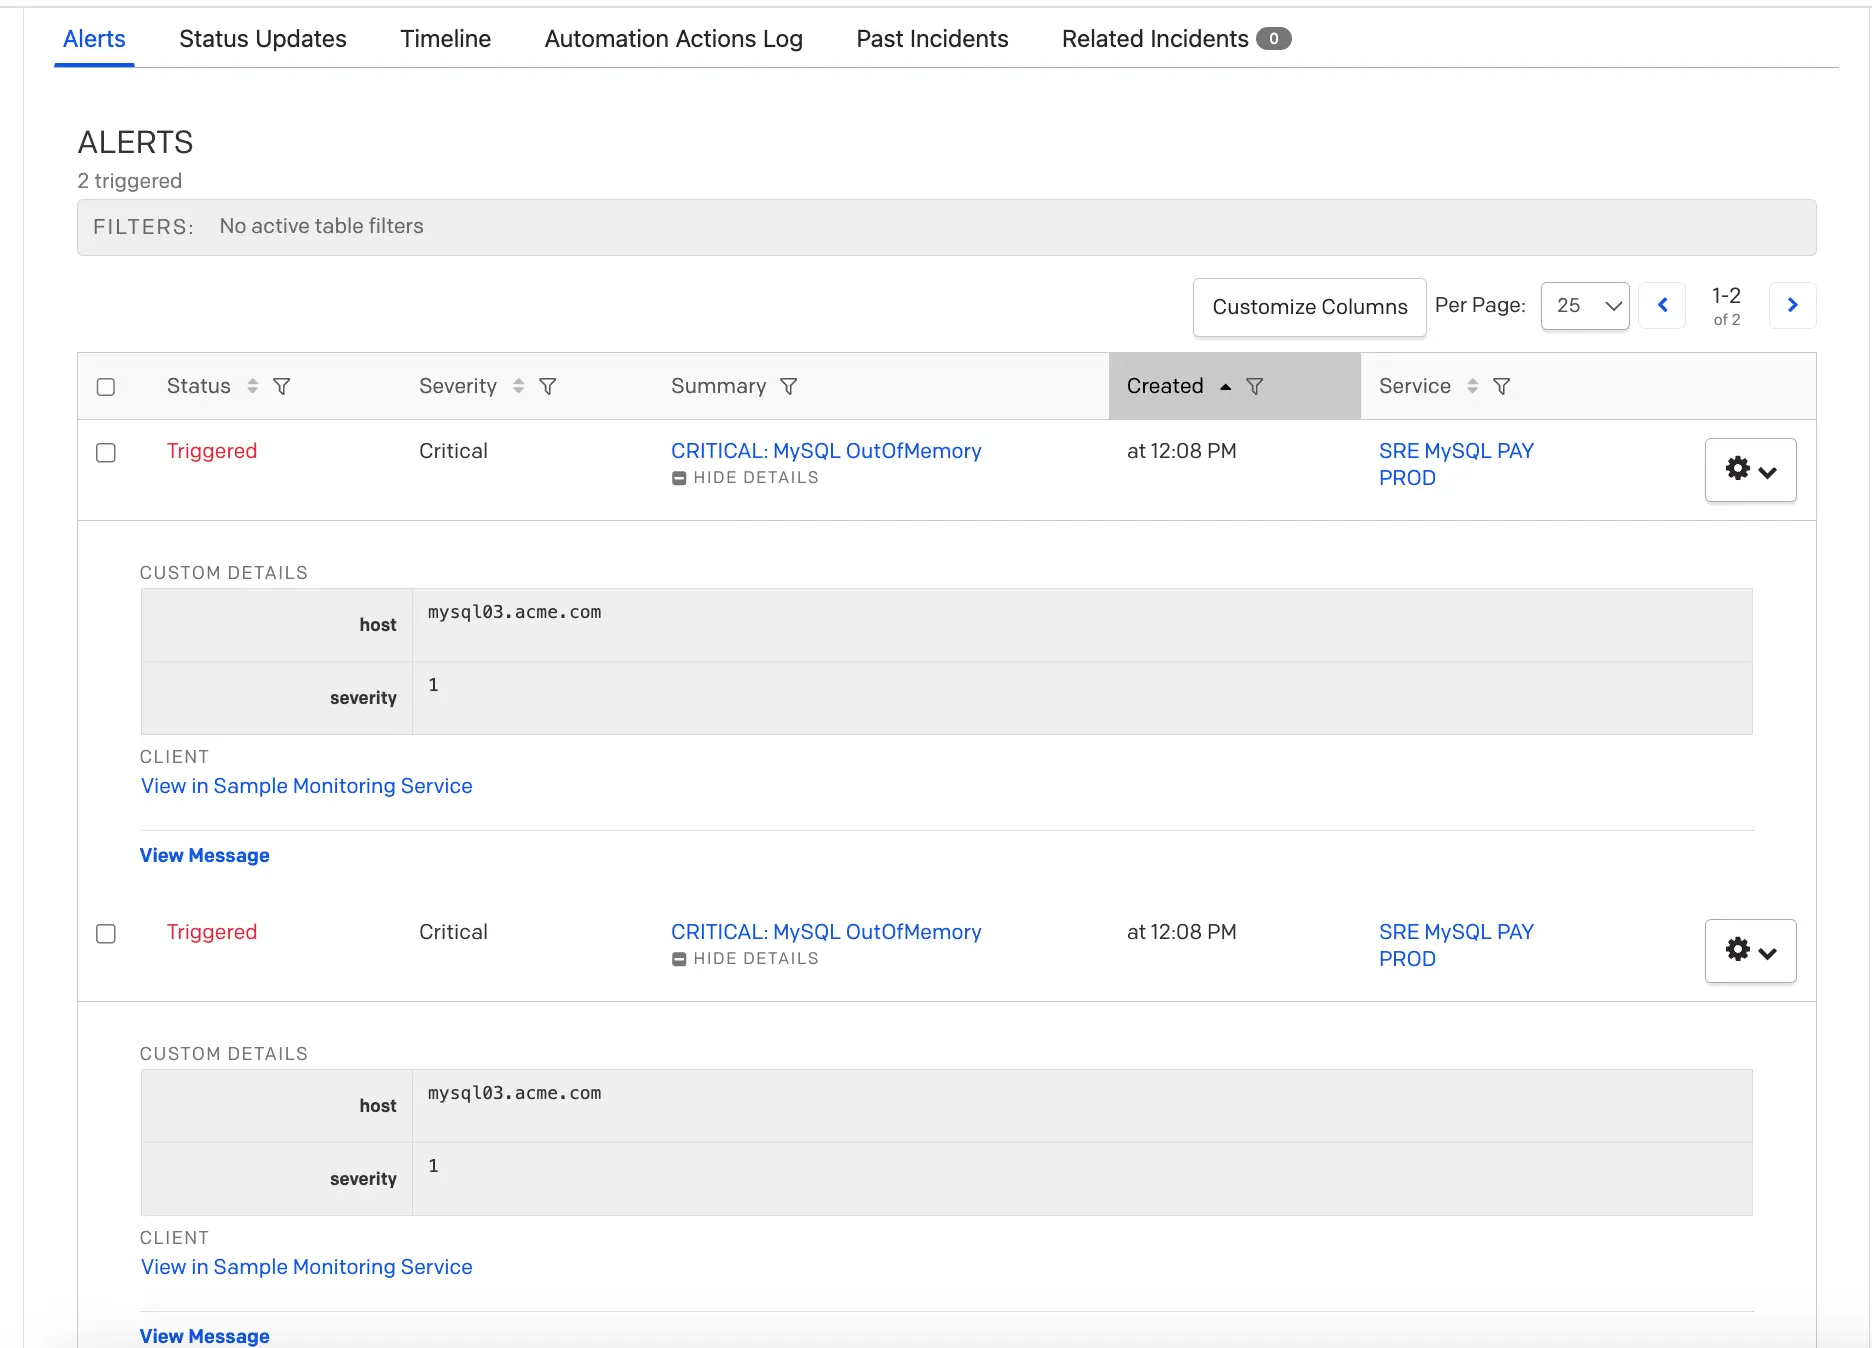 *Alert grouping result*
--- URL: https://docs.pagerduty.com/ai-automation/aiops/noise-reduction/auto-pause-incident-notifications # Auto-Pause Incident Notifications Automatically pause notifications for transient alerts, giving time for them to resolve before distracting responders. The Auto-Pause Incident Notifications feature detects alerts that typically auto-resolve within a short time period and temporarily pauses incident notifications. During the pause period, new alerts are viewable in the [Alerts Table](/incident-management/incidents/alerts/alerts-table) with a **Suspended** status. These suspended alerts allow you to trigger an incident from the alert during the pause period, or to resolve the alert, preventing the incident and its notifications from being created altogether. If a suspended alert does not auto-resolve within the configured time period, PagerDuty creates an incident and notifies responders. > **AIOps / Signal Intelligence Feature:** This feature is included with the [PagerDuty AIOps](/ai-automation/aiops/overview) add-on, or included as Signal Intelligence in PD Reliability Platform plans. To sign up for a trial of PagerDuty AIOps features, read [PagerDuty AIOps Trials](/ai-automation/aiops/overview#pagerduty-aiops-trials). > **AIOps Service Configuration:** Your service configuration must have AIOps enabled to use this feature. See [Configurable Service Settings](/incident-management/services/configurable-service-settings#manage-aiops) for more information and enablement steps. > **Legacy Availability:** Auto-Pause Incident Notifications is also available with [Legacy Event Intelligence](/ai-automation/aiops/legacy-event-intelligence). Note that newer features (e.g., [Recommended Pause Time](#recommended-pause-time)) are only available to PagerDuty AIOps customers, and are not available on Legacy Event Intelligence plans. ## Configure Auto-Pause Incident Notifications Auto-Pause Incident Notifications is configured at the service level, and it can be turned on and off while [creating](/incident-management/services/services-and-integrations#create-a-service) or [editing](/incident-management/services/services-and-integrations#edit-service-settings) services. 1. In the PagerDuty web app, navigate to **Services** → **Service Directory**, and select the **service** you want to configure. 2. Select the **Settings** tab and click **Edit** in the section Auto Pause. 3. Select **Auto-pause incident notifications** and the desired pause period from the dropdown: **2**, **3**, **5**, **10**, or **15 minutes**. 4. Click **Save Changes**. 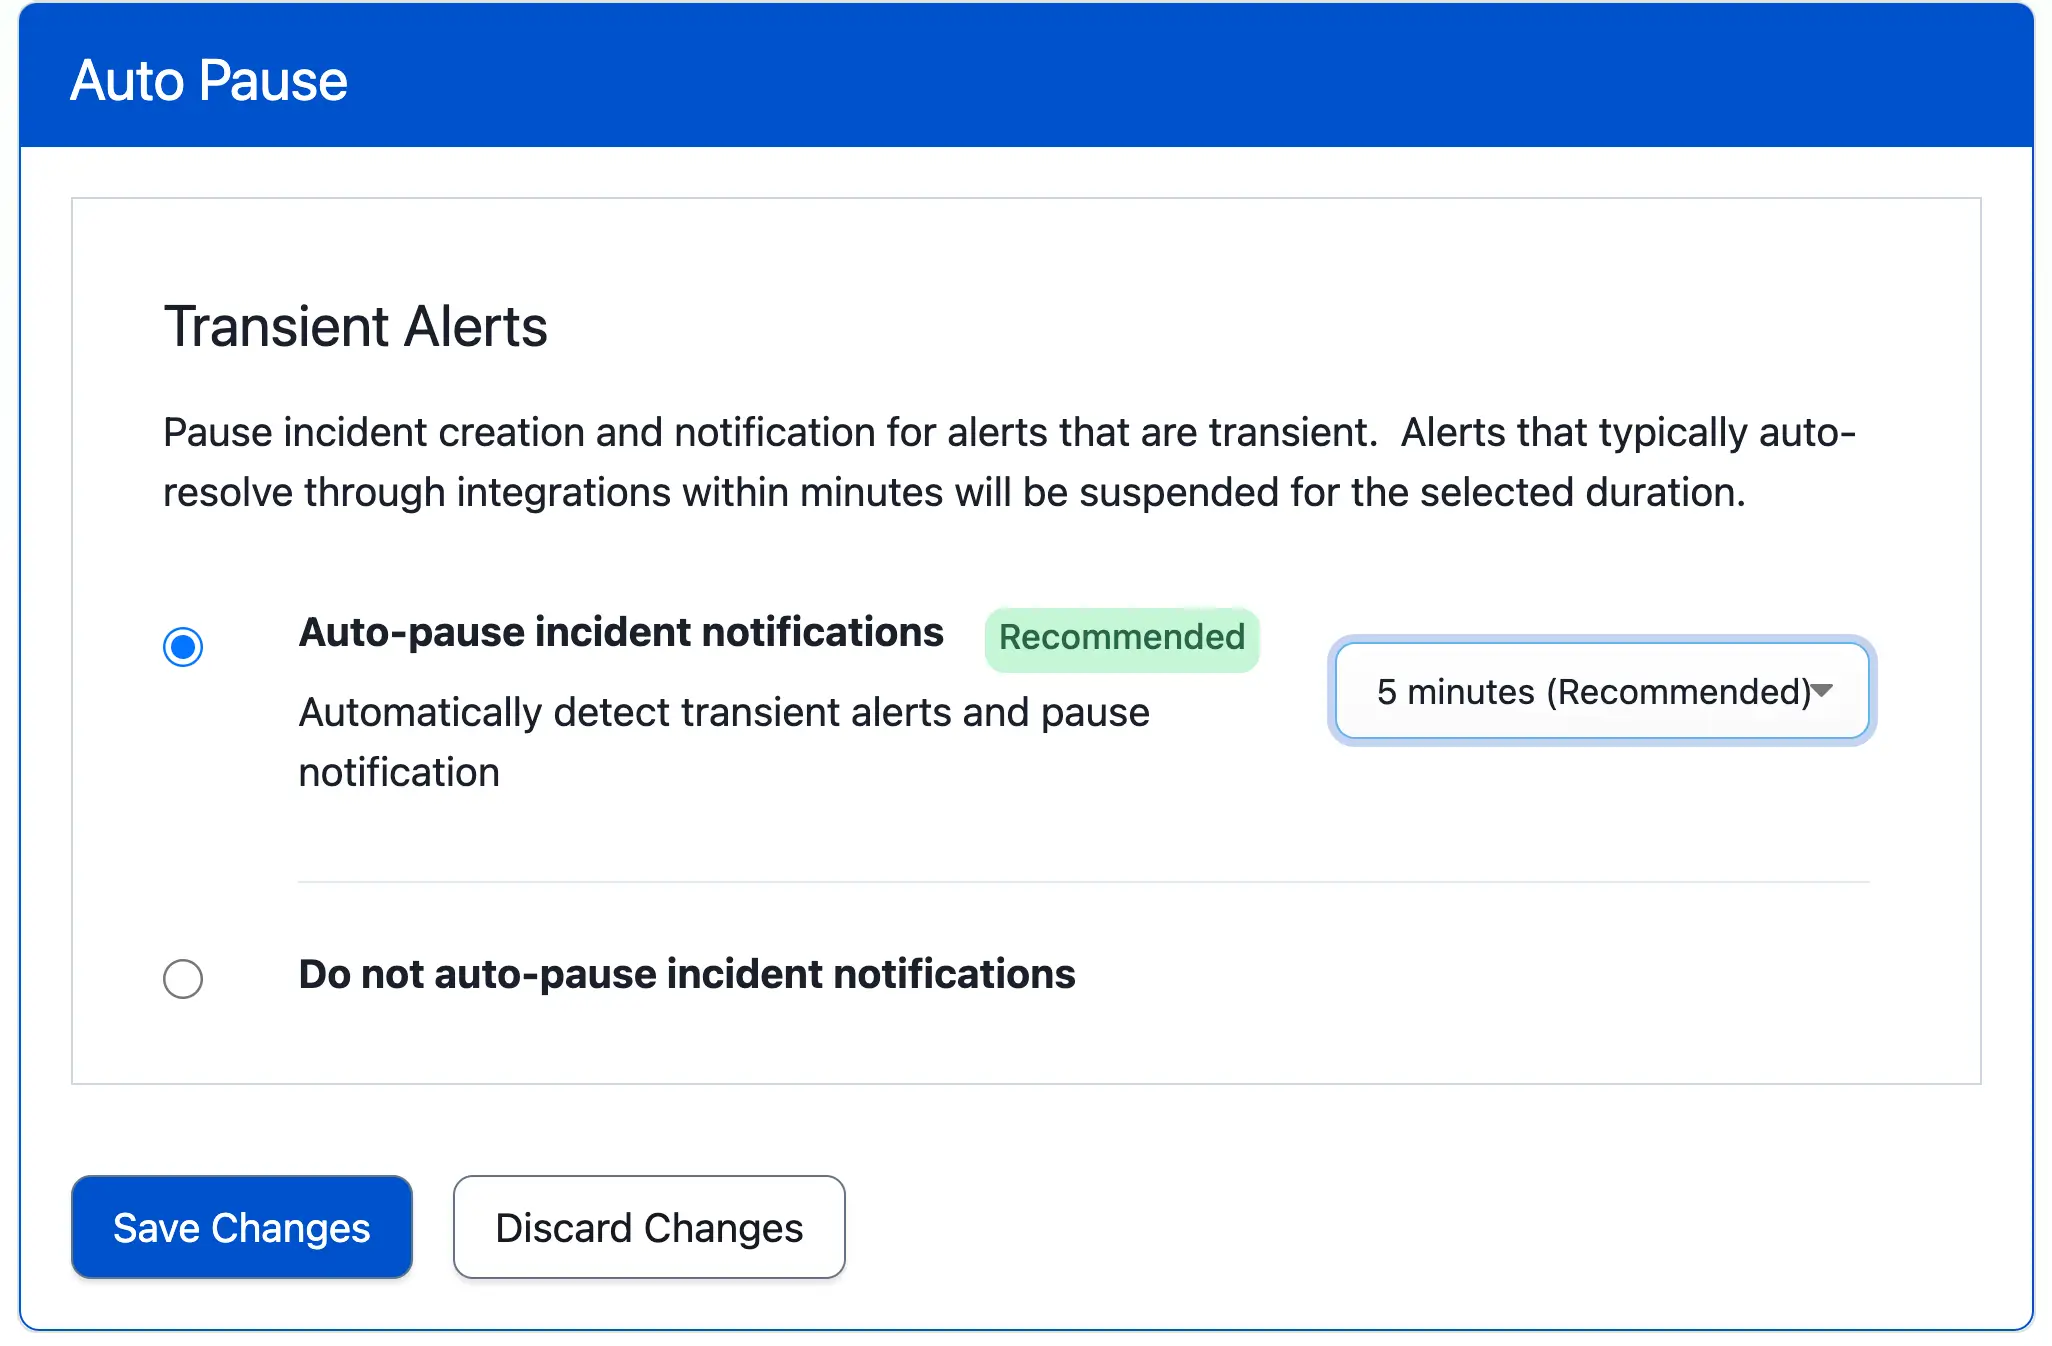 *Auto-pause incident notifications* ### Recommended Pause Time Auto-Pause Incident Notifications can generate a recommended pause time that informs you of the optimal pause time based on historical data. While [configuring Auto-Pause Incident Notifications](#configure-auto-pause-incident-notifications), select the value marked **Recommended** to optimize transient alerts. 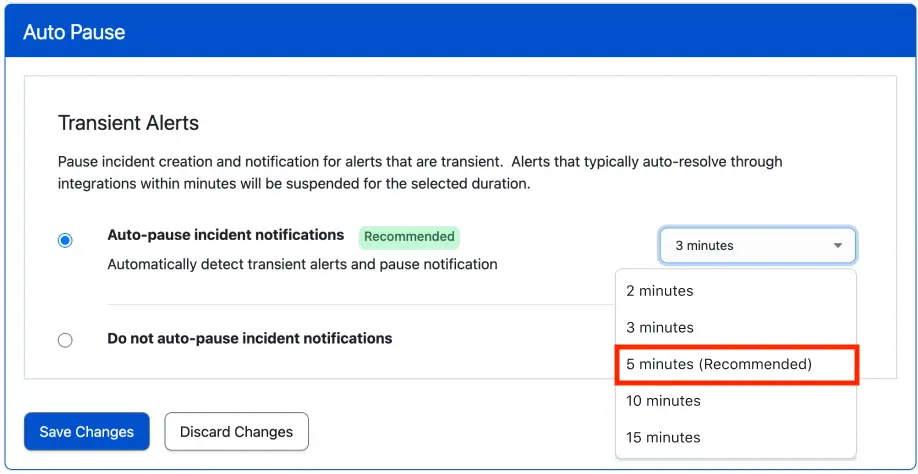 *Recommended pause time*
## FAQ **What is PagerDuty's definition of a transient alert?** For Auto-Pause Incident Notifications, a transient alert is an alert that typically auto-resolves via integration within a short time period. Alerts that receive a resolve action made manually by a responder are not classified as transient. **How are alerts determined to be transient?** Data science techniques assess the frequency of similar alerts demonstrating transient behavior in the past. If an alert is frequently classified as transient, the Auto-Pause Incident Notifications algorithm suspends incident notifications for the pause period set for that given service. **What happens to suspended alerts that resolve within the Recommended Pause Time window?** Suspended alerts that auto-resolve within the configured time period appear in the [Alerts Table](/incident-management/incidents/alerts/alerts-table) with the status **Resolved (Suppressed)** and have no associated PagerDuty incident. **Do I need to create any new service rules to use Auto-Pause Incident Notifications?** No new service rules are necessary to use Auto-Pause Incident Notifications. It can be turned on at any point through service configuration, or enabled on an existing service. You can configure [Paused Incident Notifications](/ai-automation/aiops/event-orchestration#pause-incident-notifications), an Event Orchestration feature, at the service level to build specific rules that determine how and when to pause incident creation and notification. **Will Auto-Pause Incident Notifications be applied to an event that was previously paused by Event Orchestration?** No, an event paused by Event Orchestration is not again paused by Auto-Pause Incident Notifications for alerts. **How does Auto-Pause Incident Notifications work with other Alert Grouping features?** If alerts are suspended by the Auto-Pause Incident Notifications feature for the specified pause period, then after the pause period expires, the triggered alerts honor the existing alert grouping configuration for that given service including [Intelligent Alert Grouping](/ai-automation/aiops/noise-reduction/alert-grouping/intelligent-alert-grouping), [Content-Based Alert Grouping](/ai-automation/aiops/noise-reduction/alert-grouping/content-based-alert-grouping), and [Time-Based Alert Grouping](/ai-automation/aiops/noise-reduction/alert-grouping/time-based-alert-grouping). **How can I get basic statistics on how many alerts are triggered or resolved after being paused?** PagerDuty has two reporting APIs available for Auto-Pause Incident Notifications. See the developer documentation for more information: - [Get Paused Incident Reporting on Alerts](/developer/api/reference/rest/paused-incident-reports/get-paused-incident-report-alerts) - [Get Paused Incident Reporting counts](/developer/api/reference/rest/paused-incident-reports/get-paused-incident-report-counts) **How is this feature different from Paused Incident Notifications?** Auto-Pause Incident Notifications uses machine learning to assess alerts that typically resolve within a short amount of time, and automatically pauses them based on a user-specified pause period. This feature is configured at the service level. [Paused Incident Notifications](/ai-automation/aiops/event-orchestration#pause-incident-notifications) is an Event Orchestration feature that creates alerts based on user-defined conditions, and pauses incident creation for a predefined amount of time. This feature is configured within [Event Orchestration](/ai-automation/aiops/event-orchestration). --- URL: https://docs.pagerduty.com/ai-automation/aiops/operations-console # Operations Console Gain live insight into incidents The PagerDuty Operations Console offers live visibility into incidents, and you can create customized views to triage and take immediate action on issues. This feature provides central IT teams and technical stakeholders with at-a-glance context on their technical environment in order to more efficiently triage incidents, and minimize MTTA and MTTR. 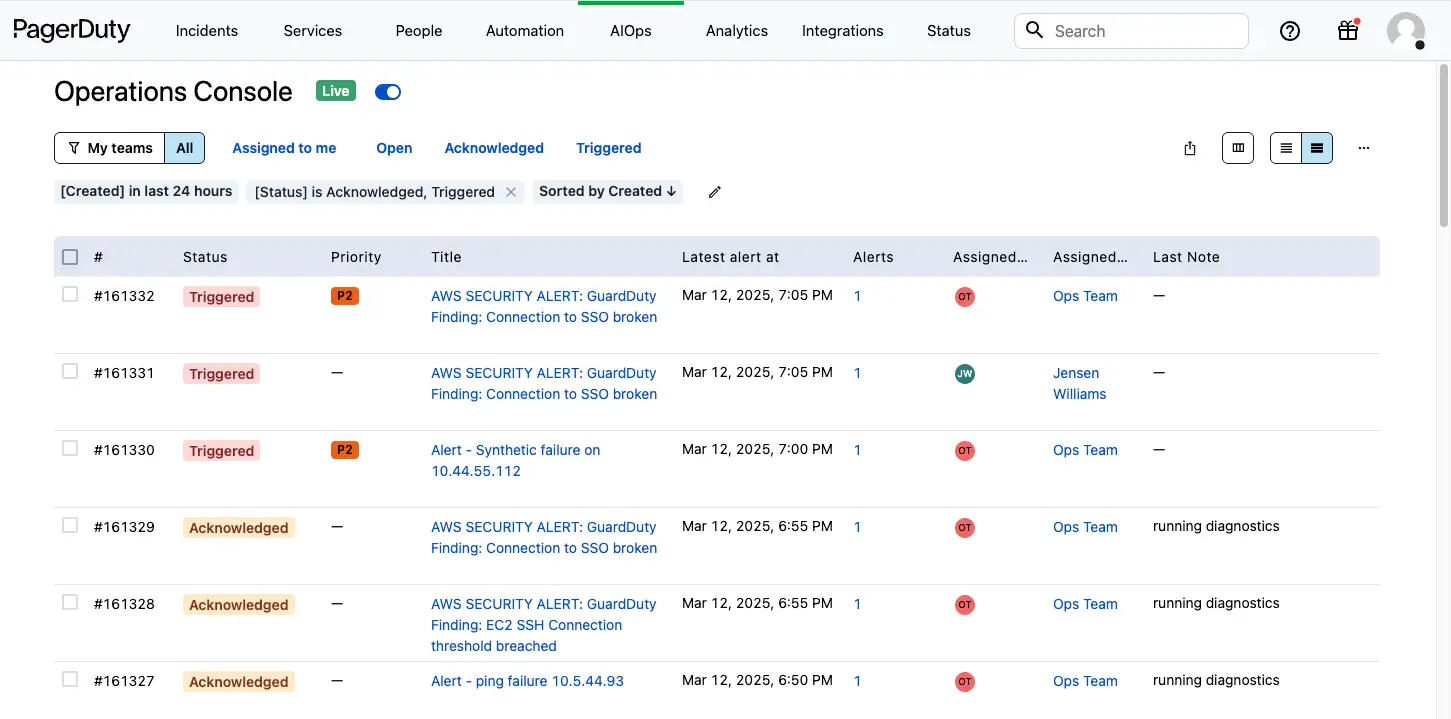 > **AIOps / Signal Intelligence Feature:** This feature is included with the [PagerDuty AIOps](/ai-automation/aiops/overview) add-on, or included as Signal Intelligence in PD Reliability Platform plans. To sign up for a trial of PagerDuty AIOps features, read [PagerDuty AIOps Trials](/ai-automation/aiops/overview#pagerduty-aiops-trials). ## View the Operations Console In the web app, navigate to **AI** → **Operations Console**. > **Japanese Language Support:** The Operations Console supports Japanese as a display and interface language. Depending on your permission level, you can update this at the account or profile level: > > - **For Account Admins (Global Default):** > Navigate to **Account Settings** and locate the **Default Voice and Interface Language** dropdown to set the default for the entire organization. > - **For Individual Users:** > Navigate to **My Profile**, click the pencil icon next to **Voice Language Setting**, and select Japanese from the dropdown menu. > **AIOps Service Incidents Only:** Only incidents on [AIOps services](/ai-automation/aiops/overview#aiops-service-configuration) will display in the Operations Console. If you would like to view incidents created on non-AIOps services, you must navigate to the **Incidents** page. Please see our [AIOps Service Configuration](/ai-automation/aiops/overview#aiops-service-configuration) article for more information on managing AIOps on services. > **AIOps Service Configuration:** Your service configuration must have AIOps enabled to use this feature. See [Configurable Service Settings](/incident-management/services/configurable-service-settings#manage-aiops) for more information and enablement steps. ## Configure the Operations Console The console offers users great flexibility to customize the live incidents table. This includes the ability to add or remove standard incident, alert, and custom-defined columns, as well as filter, sort, and apply other configurations. ### Column Selector You can customize which fields are visible in the incidents table by adding, removing or reordering the fields. Click to open the column selector panel and select/deselect your desired columns. Reorder columns by dragging and dropping them to their preferred location. You can also resize a column's width by clicking and dragging the edge to your desired size. Users can also sort by up to three columns simultaneously. 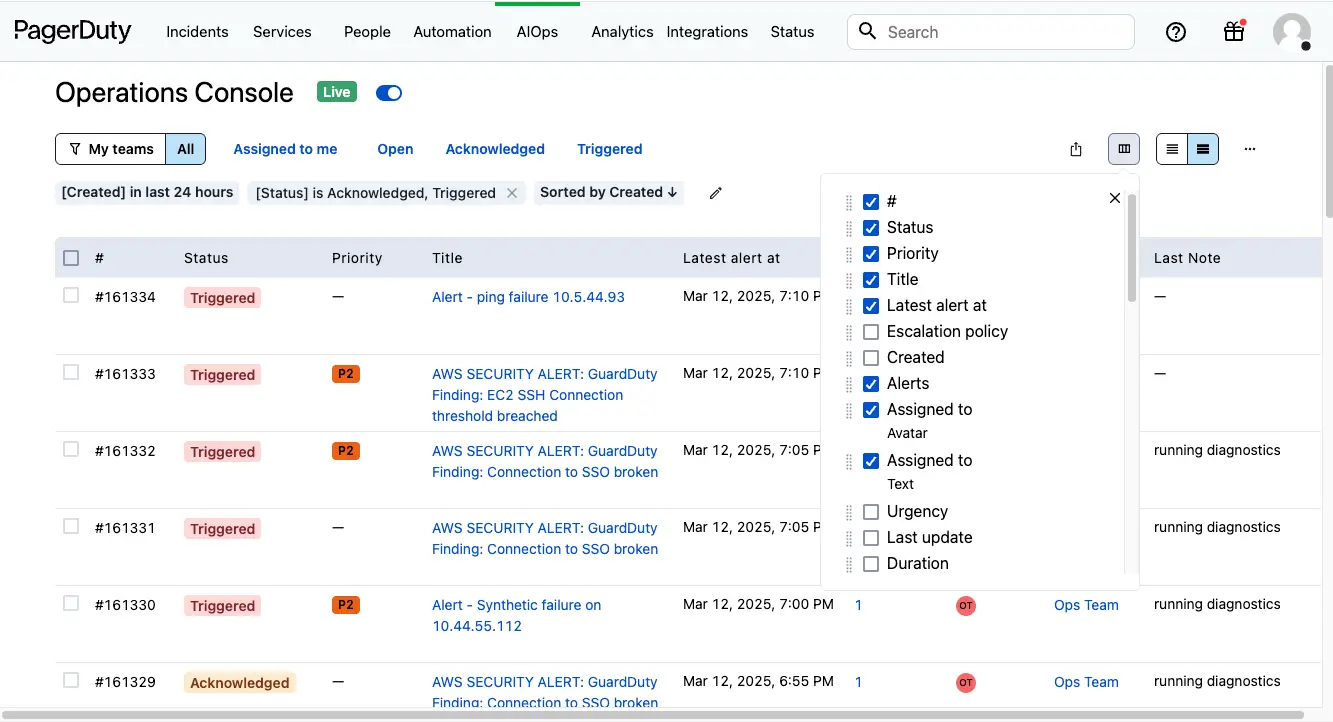 *Column selector* You can also display [Custom Fields on Incidents](/incident-management/incidents/custom-fields-on-incidents) in the live incidents table by clicking **Custom Columns** at the bottom of the Column Selector and adding them to the table. You can add up to ten Custom Fields in the Operations Console's incident table. If you wish to display a new field but are unable to, please deselect an existing custom field first. You can sort on up to three columns in the incidents table. 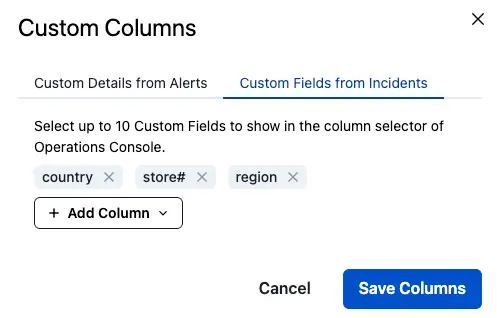 *Custom columns* > **Tip:** Since each users may have a different view based on their permissions and configurations, changes in one user’s account will not affect other users’ view. You can share your view with team members via the Share button. You can also export the all loaded incidents with your customized columns as a CSV file using the menu.  *Export visible rows as CSV* ### Side Panel You can view incident details by clicking on an incident's **Title** or alert count in the **Alerts** column. The side panel provides contextual information pertaining to the incident, including snoozed time (if applicable), alert grouping details (if applicable), alerts fields, alert custom details and so on, so you can view all things at a glance in one place. You can also change the width by dragging the side panel horizontally to view more or fewer alert columns. PagerDuty will remember your settings for later visits. 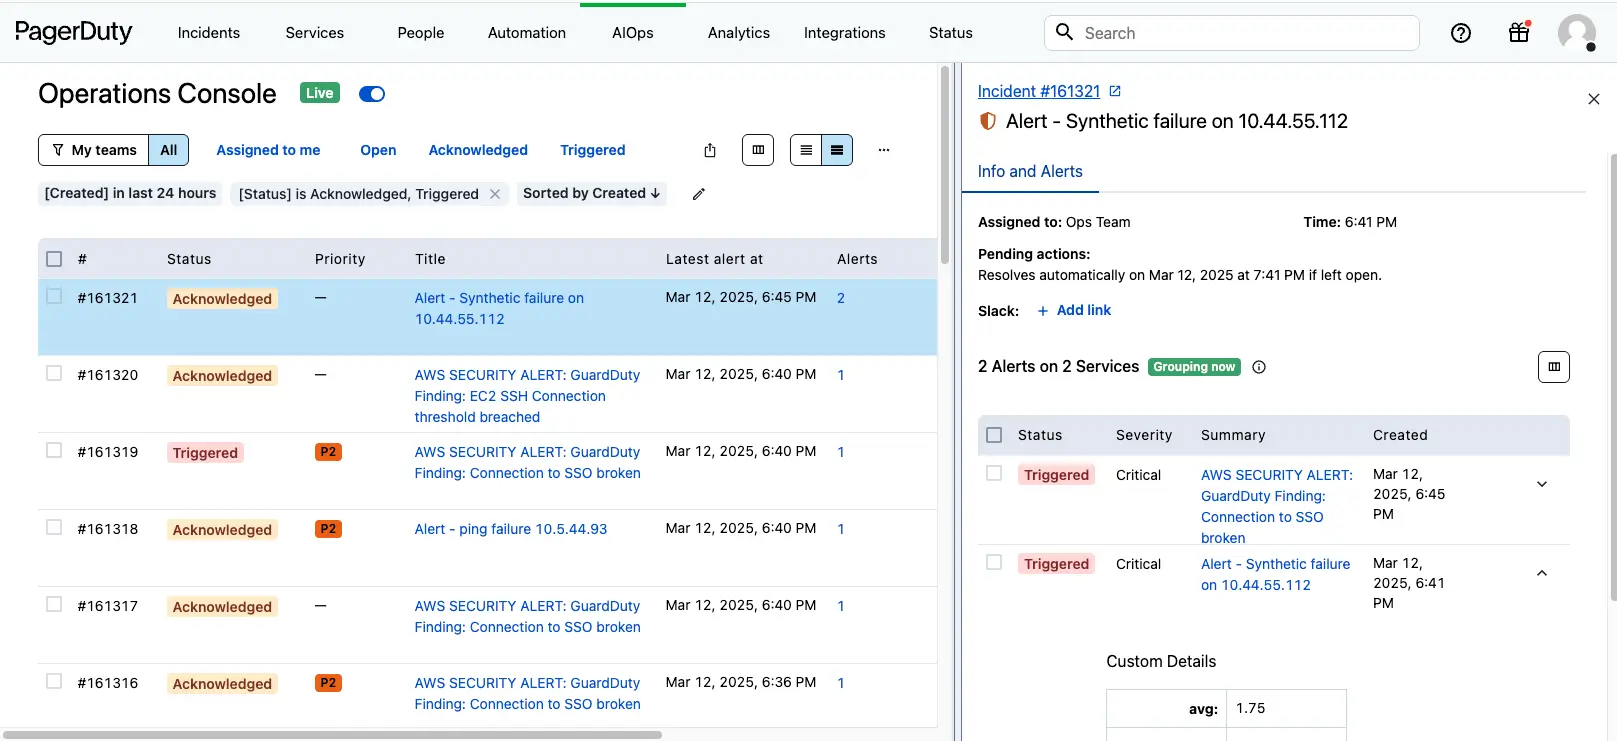 *Operations Console side panel* ### Filters and Search At the highest level, you can show: - **All** incidents - **My teams** to display just incidents belonging to your [Teams](/account-admin/teams). You can also quickly filter by incident status: - **Assigned to me** - **Open** - **Acknowledged** - **Triggered** > **AIOps Service Incidents Only:** Only incidents on [AIOps services](/ai-automation/aiops/overview#aiops-service-configuration) will display in the Operations Console. If you would like to view incidents created on non-AIOps services, you must navigate to the **Incidents** page. For more granular filters: 1. Click to open the filter panel. 2. Click **Add** and select from the following: 1. **Alert Services** 2. **Assignee** 3. **Auto Resolved** 4. **Duration** 5. **Date** 6. **Escalation Policy** 7. **External Reference** 8. **Incident Number** 9. **Latest Note** 10. **Main Service** 11. **Priority** 12. **Responder** 13. **Status** 14. **Teams** 15. **Title** 16. **Urgency** 17. **User** 18. [**Custom Fields on Incidents**](/incident-management/incidents/custom-fields-on-incidents) 19. [**Custom Details**](#custom-details) on Alerts (Available by request) 3. Depending on the field(s) you select, enter the appropriate criteria and click **Apply Filters**. 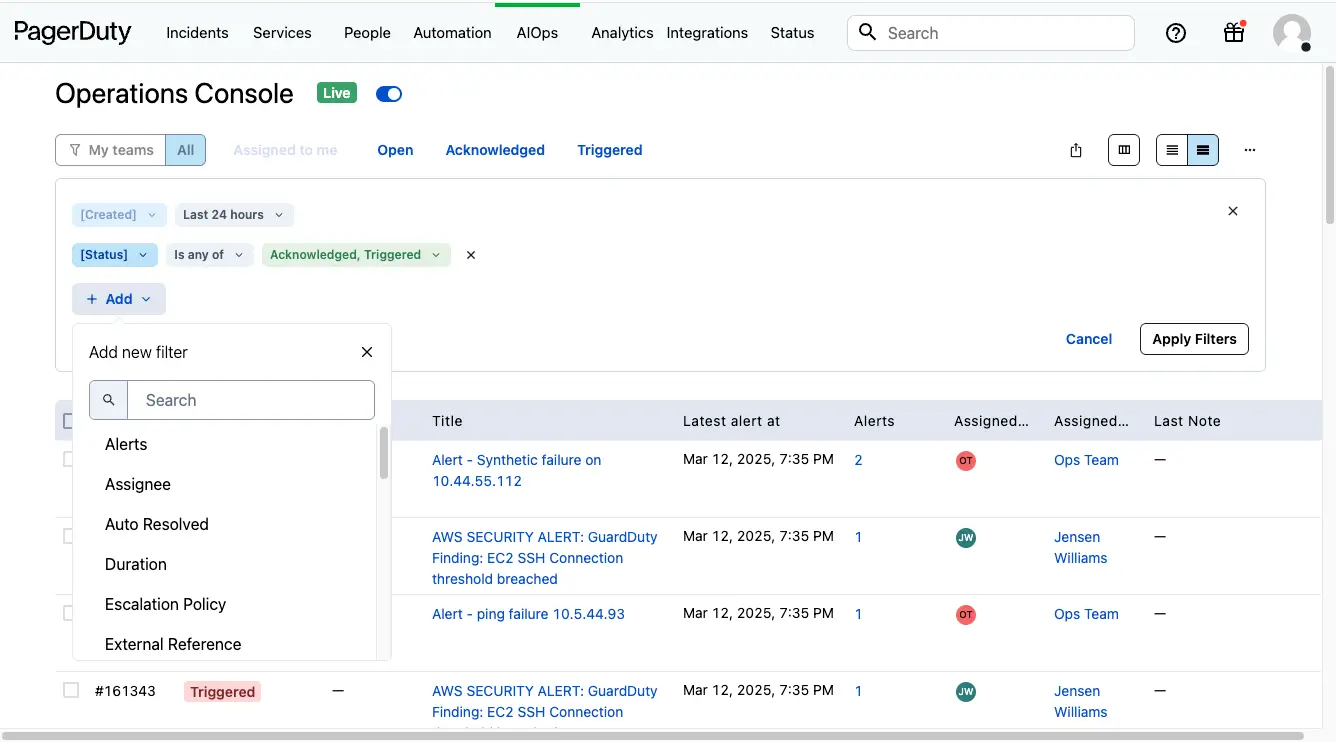 *Filters and search* Additionally, users can perform keyword search to filter on incident **Title**, **Incident number** and **Latest note**. > **Tip:** You can perform keyword search with conditions such as **contains**, **starts with**, **equals**, **does not contain**, and combine `AND`/`OR` operators to filter across a number of fields such as Incident Title, Incident Number, Last Notes. You can define up to five keywords with `AND`/`OR` operators. > > For optimal performance, enter at least three characters for searches with the **contains** filter. > >  > *Keyword search* ### Actions To take action on incidents within Operations Console, select the checkbox to the left of the incident(s) and click your desired action: - **Resolve** - **Acknowledge** - **Add Responder** - **Reassign** - **Run** - **Merge** - **Snooze** - **Update Priority** - **Add Note**  *Incident actions* #### Bulk Actions When you want to perform actions on multiple incidents at once, you can click the selection box at the top of the incident table. This will select the first 50 incidents on the current page, and list the bulk action options at the bottom of your screen. Select from the following actions: - **Acknowledge** - **Resolve** - **Add Responder** - **Reassign** - **Merge** - **Snooze** - **Update Priority** - **Add Note** ### Incident Feed Update Frequency To optimize performance or during incident storms, you can toggle between **Live** and **Paused** update modes. By default, the console is set to **Live** updates, which continuously adds new incidents, and corresponding updates, to the feed.  You can optionally pause live updates by clicking the toggle. While **Paused**, new incidents will not be added to the Operations Console, but updates to existing incidents will still be displayed. Users can manually update the incident table by refreshing the page.  ### Custom Details > **Available By Request:** This feature is available by request only. Please reach out to your account team to request this feature. You can define and add specific custom details fields from your alert payload to the incidents table. 1. Click to open the column selector panel. 2. Scroll to the bottom of the list and click **Add Custom Detail**. 3. In the modal, enter a **Table Header** and the **Custom Details Path** (e.g., the name of the field as it appears in the alert payload, such as `source` or `application`). 1. _Optionally_ click **+ Add Column** to add multiple custom detail columns at once. 4. Click **Add Columns**.  *Custom columns* ## Service Health Visualization Service Health Visualization aggregates active incidents by Service into an interactive graph in the Operations Console to quickly identify hotspots and emerging issues. ### Access Service Health Visualization 1. In the PagerDuty web app, click **AIOps** → **Operations Console**. 2. Click the **View by** dropdown. 3. Select **Service Health**.  ### Use the Incidents-by-Service Graph - **Multi-select filters**: Combine filters to refine results during active incidents. - **Click to drill in**: Select a service and time to view incident count and links to incident details. If more than 20 incidents exist, a link to the full Open Incidents list is provided. - Only services with active incidents will be accessible in the graph. - Services are automatically sorted by the number of active incidents. #### Apply Filters 1. Click to open the filter panel. 2. Click **Add** and select from the following: - Created - Team - Service - Priority 3. Depending on the field(s) you select, enter the appropriate criteria and click **Apply Filters**. #### Triage Example 1. **Spot the spike**: Identify a sudden increase in incidents for a particular service on the graph. 2. **Focus on service(s)**: Apply a service filter to isolate that service and any related dependencies. 3. **Drill in**: Click the service to view links to active incidents. 4. **Coordinate**: Use your incident workflows to mobilize teams and update stakeholders. ### Troubleshooting the Service Health Visualization **The graph looks empty** - Verify the time window—short ranges may show fewer incidents in quiet periods. - Clear any Service filters. - Confirm that incidents are actively open in the selected window. **Incident count seems off** - The graph updates automatically, but there may be a brief delay between incident creation and display. Refresh the page to capture the latest data. - Confirm that your filters (time and service) match your expectations. ## FAQ **How can I troubleshoot connection issues if the Operations Console does not load?** We use server-sent events (SSEs) to provide real-time updates. Your security or IT team may use a proxy/software to block these requests. If you encounter issues loading the Operations Console, please verify with your IT department whether SSEs are handled by proxies or third party software (e.g., antivirus programs or plugins). If so, you can request that they evaluate and enable our main SSE endpoint: `/api/v1/opsconsole/incident_module/search`. You can analyze the HAR file for the affected session to check if the request to `/api/v1/opsconsole/incident_module/search` is present and successful. Missing, blocked, or canceled requests may indicate that something in your network is preventing the SSE connection.  *Loading incidents...* **Can I add event custom fields from the alert payload to the Operations Console?** Yes, you can define custom fields as filters to narrow down results or search for specific incidents. Please read [Custom Details](#custom-details) above for more information. **How many event custom fields can I display in the Operations Console?** You can add up to 10 custom details fields in the Operations Console's incident table. If there's a field you'd like to display but cannot, please deselect another custom field first. **What happens if I manually merge an incident on a non-AIOps service with an incident on an AIOps service?** The incident will merge as normal. All AIOps features on the incident shall be available. **What happens if I manually reassign an incident on an AIOps service to a non-AIOps service?** The incident will move as normal, however, the system will disable all AIOps features on the incident. **What counts are shown in the Service Health Visualization?** Active incidents associated with each service within the selected time window. **Can I export the data in the Service Health Visualization?** Not at this time. Use drill-through to work incidents directly from PagerDuty. **Does the Service Health Visualization include Business Services?** The visualization is centered on Technical Services. Please refer to the [Service Dependency graph](/incident-management/services/service-graph) to understand upstream/downstream impact. --- URL: https://docs.pagerduty.com/ai-automation/aiops/outlier-incident # Outlier Incident View the frequency of similar incidents to gain helpful context during incident triage The Outlier Incident feature provides incident responders with immediate context on how often similar incidents have occurred on a specific service, helping them quickly determine whether an issue is familiar or new. This is particularly valuable for IT operations teams and DevOps engineers who need to identify patterns and irregularities to make informed decisions during response efforts. By categorizing incidents as frequent, rare, or anomalous, the feature streamlines the analysis process, allowing teams to focus on resolution and ultimately improve service reliability. > **AIOps / Signal Intelligence Feature:** This feature is included with the [PagerDuty AIOps](/ai-automation/aiops/overview) add-on, or included as Signal Intelligence in PD Reliability Platform plans. To sign up for a trial of PagerDuty AIOps features, read [PagerDuty AIOps Trials](/ai-automation/aiops/overview#pagerduty-aiops-trials). > **AIOps Service Configuration:** Your service configuration must have AIOps enabled to use this feature. See [Configurable Service Settings](/incident-management/services/configurable-service-settings#manage-aiops) for more information and enablement steps. > **Legacy Availability:** This feature is also available with [Legacy Event Intelligence](/ai-automation/aiops/legacy-event-intelligence). ## View Outlier Incident in the Web App 1. From the Incidents page or a service’s detail page, click your desired incident’s **Title** to see its detail page. 2. If an incident has been categorized as a frequent, rare or anomalous incident these details will appear below the incident title. 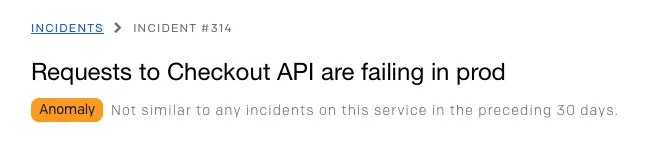 *Incident with "Anomaly" Outlier Incident label* ## Outlier Incident Labels Outlier Incident uses data science techniques to dynamically map incidents to templates and determine how often each type of incident occurs on a service. The following labels are applied below the incident title on the incident's details page: - **Frequent**: Incident types representing 20% or more of all incidents in the previous 30 days. - **Rare**: Incident types representing 5% or less of all incidents in the previous 30 days. - **Anomaly**: Incident types that have not occurred on the service in the previous 30 days. For the purpose of determining which of the labels above to use, incident data from the 30 days prior to an incident’s trigger date is used. --- URL: https://docs.pagerduty.com/ai-automation/aiops/overview # AIOps / Signal Intelligence Overview Minimize noise, accelerate resolution and automate event processing PagerDuty AIOps helps teams to reduce alert noise, improve incident visibility and triage more efficiently—eliminating manual, repetitive tasks from the incident response process. With quick implementation and no ongoing maintenance, teams can experience fewer incidents, resolve issues faster, and boost productivity in days, not months. > **AIOps and Signal Intelligence:** AIOps and Signal Intelligence are the same capability, offered under different plans: > - **AIOps** is a standalone add-on for Incident Management and legacy plans. > - **Signal Intelligence** is included in PD Reliability Platform plans. > > On PD Reliability Platform plans, Signal Intelligence is disabled by default on newly created services and Event Orchestrations. > **Purchase PagerDuty AIOps:** - PagerDuty AIOps launched in April 2023 and it's the [current evolution](/ai-automation/aiops/legacy-event-intelligence) of PagerDuty's Legacy Event Intelligence add-on. > - If you would like to migrate from Event Intelligence to PagerDuty AIOps, or purchase the add-on for the first time, please read [Purchase PagerDuty AIOps](#purchase-pagerduty-aiops). ## Feature Sets PagerDuty AIOps can be broken down into the following feature sets: - [Noise Reduction](#noise-reduction) - [Triage and RCA](#triage-and-rca) - [Event Orchestration and Automation](#event-orchestration-and-automation) - [Operations Console](#operations-console) - [Increased Event Ingestion](#increased-event-ingestion) ### Noise Reduction Reduce incident noise with the click of a button. Use built-in machine learning (ML) models that learn and adapt based on user behavior, or create your own logic. You can even group alerts across services using [Global Alert Grouping](/ai-automation/aiops/noise-reduction/alert-grouping/global-alert-grouping).  *Noise Reduction Settings on a PagerDuty Service* **Read more about our Noise Reduction features**: - [Global Alert Grouping](/ai-automation/aiops/noise-reduction/alert-grouping/global-alert-grouping) - [Intelligent Alert Grouping](/ai-automation/aiops/noise-reduction/alert-grouping/intelligent-alert-grouping) - [Preview Intelligent Alert Grouping](/ai-automation/aiops/noise-reduction/alert-grouping/preview-intelligent-alert-grouping) - [Content-Based Alert Grouping](/ai-automation/aiops/noise-reduction/alert-grouping/content-based-alert-grouping) - [Unified Alert Grouping](/ai-automation/aiops/noise-reduction/alert-grouping/unified-alert-grouping) - [Time-Based Alert Grouping](/ai-automation/aiops/noise-reduction/alert-grouping/time-based-alert-grouping) - [Auto-Pause Incident Notifications](/ai-automation/aiops/noise-reduction/auto-pause-incident-notifications) - [Event Orchestration: Alert Suppression](/ai-automation/aiops/event-orchestration#incident-data) ### Triage and RCA Responders can leverage machine learning to immediately surface critical incident information. When an incident occurs, you can quickly discover the probable origin of the incident, if the incident has previously occurred, and if a change was the likely cause.  *Probable Origin Feature on a PagerDuty Incident* **Read more about our Triage and RCA features**: - [Past Incidents](/ai-automation/aiops/past-incidents) - [Related Incidents](/ai-automation/aiops/related-incidents) - [Outlier Incident](/ai-automation/aiops/outlier-incident) - [Probable Origin](/ai-automation/aiops/probable-origin) - [Recent Changes](/ai-automation/aiops/recent-changes) ### Event Orchestration and Automation Event Orchestration provides state-of-the-art automation capabilities that are a force-multiplier across the entire technical ecosystem. Teams can enrich events and create complex logic within a service, or across services. This end-to-end event-driven automation ensures faster resolution and requires less input from humans who are needed for value-add work.  *Global Orchestration Configuration Screen* **Read more about Event Orchestration**: - [Event Orchestration](/ai-automation/aiops/event-orchestration) ### Operations Console The PagerDuty Operations Console offers live visibility into incidents, and you can create customized views to triage and take immediate action on issues. This feature provides central IT teams and technical stakeholders with at-a-glance context on their technical environment in order to more efficiently triage incidents, and minimize MTTA and MTTR.  *Operations Console* **Read more about the Operations Console**: - [Operations Console](/ai-automation/aiops/operations-console) ### Increased Event Ingestion Upon request, increase the Events API rate limit from 120 events/min per key, up to 10,000 events/min per key. Please contact your account team or Support to request a higher limit. ## PagerDuty AIOps Pricing PagerDuty AIOps is priced by event consumption, so you only pay for the events you ingest. PagerDuty is committed to providing customers with the best value and experience. With that in mind, PagerDuty's pricing is: - **Transparent**: Each event that PagerDuty accepts and processes is counted. This includes events sent while a service is in a [Maintenance Window](/incident-management/services/maintenance-windows). Historic and current data is viewable on your subscription page (**User Icon** → **Subscriptions**). - **Flexible**: The draw-down model with wide tiers simplifies estimation and minimizes the impact of event spikes. - **Informative**: Historical event data is visible on the PagerDuty subscription page so that you can better predict the future based on the past. - **Proactive**: Early warning notifications that alert you on your event usage can help you make the right decision. > **Event Notification Thresholds:** When an account reaches 50, 80, 90, 100, or 150% of purchased AIOps Events, a notification email will be sent to the Account Owner, as well as any recipients of [Additional Notification Emails](/account-admin/billing#additional-notification-emails) in Account Settings. Check out our [pricing page](https://www.pagerduty.com/pricing/aiops/) for more details or [contact Sales](https://www.pagerduty.com/contact-us/) to learn more. ## AIOps Service Configuration AIOps Service Configuration (Signal Intelligence on PD Reliability Platform) provides you with flexibility and control over how AIOps features apply. This approach allows you to enable AIOps on the [services](/incident-management/services/services-and-integrations) and [Event Orchestrations](/ai-automation/aiops/event-orchestration) that are most relevant to your needs. AIOps Service Configuration maximizes value and efficiency, and ensures that you're using advanced capabilities where they have the greatest impact. Benefits include: - **Cost-Effective Adoption**: Pay for AIOps on the services where teams will actively use it. This is especially valuable for larger organizations where not every team is ready to implement advanced AIOps features. - **Maximum Flexibility**: Roll out AIOps at your own pace and avoid unexpected event overages. - **Better Control, Better Experience**: Empower teams that want AIOps to use it, while others can stick with standard event management. Optimize both your incident response and your budget. ### How it Works - When you purchase AIOps, all services and Event Orchestrations have AIOps enabled by default. - You can disable or re-enable AIOps for [individual services](/incident-management/services/configurable-service-settings#manage-aiops) or [orchestrations](/ai-automation/aiops/event-orchestration#manage-aiops). - Only events sent to AIOps-enabled services or Event Orchestrations count toward your AIOps event volume tier. There is no change to how accepted events are counted, only which accepted events count against your AIOps event volume tier. ### Manage AIOps > **Required User Permissions:** - Account Owners > - Admins and Global Admins > - Manager base role and team roles > - Manager team roles can only manage services associated with their team > **Disable Behavior:** Please note that when you disable AIOps on a service or event orchestration, you can expect the following to occur: > > - **Event Throughput**: Any increased event throughput for AIOps reverts to the standard 120 events/minute. > - **Operations Console**: Only AIOps services and their incidents are accessible on the Operations Console. > - **Noise Reduction and Root Cause Feature Access**: The system disables advanced AIOps features (like Outlier Incident, Probable Origin, Related Incidents, Past Incidents, Auto Pause, Alert Grouping, and Recent Changes) for non-AIOps Services. > - **Advanced Orchestration Capabilities**: Only AIOps-enabled Event Orchestrations can use Global Orchestrations and Dynamic Service Routing. If a non-AIOps Orchestration has AIOps rules, the system will skip these rules during event ingestion. > - **Advanced Service Orchestration Rules**: Only AIOps-enabled Services can use advanced orchestration rules. If a non-AIOps Service has advanced rules, the system will skip these rules during event ingestion. #### Services Please see our [Configurable Service Settings](/incident-management/services/configurable-service-settings#manage-aiops) article for instructions to enable or disable AIOps on a service. #### Event Orchestration Please see our [Event Orchestration](/ai-automation/aiops/event-orchestration#manage-aiops) article for instructions to enable or disable AIOps on an Event Orchestration. ## PagerDuty AIOps Trials If you'd like to take PagerDuty AIOps for a spin before activating a trial, you can do so with our [interactive product tour](https://pagerduty.navattic.com/265z0hdg). You can activate a trial of PagerDuty AIOps via the following methods depending on your PagerDuty account status: - [Current Customers](#current-customers) - [Prospective Customers](#prospective-customers) ### Current Customers For current customers, the Account Owner can activate a trial on the account settings page: 1. In the PagerDuty web app, navigate to **User Icon** → **Account Settings**. 2. In the section **Product Trials**, select **Activate PagerDuty AIOps Trial**. 3. Your trial will automatically activate. ### Prospective Customers If you are not yet a PagerDuty customer, you can fill out [this form](https://www.pagerduty.com/try-pagerduty-aiops) and a representative will reach out about initiating a trial of PagerDuty AIOps. ### PagerDuty AIOps Trials FAQ **What happens at the end of the trial?** At the end of your trial, the Account Owner has the option to purchase PagerDuty AIOps. If you decide not to continue with a paid version of AIOps, at the end of 30 days the account will revert to its original state, removing AIOps features. This will delete most configured AIOps settings (and PagerDuty will not retain them). All services will revert to not having alert grouping configured, and if you were to sign up again the account would have to start from a clean slate. Consult the table below for the specific features PagerDuty retains: | Feature Category | Features | Retained / Not Retained by PagerDuty | | :-------------------------------- | :------------------------------------------------------------------------------------------------------------------------------------------------------------------------------------------------------------------------------------------------------------------------------------------------------------- | :----------------------------------- | | Ingestion | Recent Changes
Custom Change Event Transformer
High Ingestion Volumes | Not Retained | | Advanced Event Orchestration | Dynamic Field Enrichment & Extraction
Threshold Conditions
Recurring Conditions
Schedule Conditions
Rule Nesting
Paused incident notifications
Webhooks
Global Event Orchestration
Event Orchestration Variables
Dynamic Routing
Dynamic Escalation Policies | Retained | | Noise Reduction | Alert Suppression
Auto-Pause Incident Notifications
Time-Based Alert Grouping
Intelligent Alert Grouping (w/ Flexible Time Window)
Content-based Alert Grouping
Unified Alert grouping (IAG & CBAG)
Global Alert grouping | Not Retained | | Triage /
Root Cause Analysis | Change Correlation
Past Incidents
Related Incidents
Outlier Incidents
Probable Origin
Triage Widget (PD for Datadog) | Not Retained | | Dashboarding | Visibility Console
Operations Console | Not Retained | **How can I purchase PagerDuty AIOps?** Once your trial ends, there are several ways to purchase PagerDuty AIOps: 1. **Reseller Partner**: If you previously purchased PagerDuty via a reseller, please contact either the reseller or PagerDuty directly to proceed with your AIOps purchase. PagerDuty works with a wide network of reseller partners, and we are happy to assist in completing your transaction. 2. **Self-Serve (Tier 5 or Below)**: If you need the Tier 5 event allotment or lower, you can easily add AIOps to your subscription. Simply navigate to **User Icon** → **Account Settings** → **Subscriptions**, and manually include PagerDuty AIOps in your plan. 3. **Contact Sales (Above Tier 5)**: For event allotments beyond Tier 5, or if you prefer to speak with a sales representative, please contact your PagerDuty account representative or email [sales@pagerduty.com](mailto:sales@pagerduty.com). We'll gladly assist in customizing your PagerDuty AIOps subscription to fit your needs. ## Determine Your Event Volume PagerDuty AIOps is licensed per accepted event. Accepted events are any valid events that are sent to and processed by PagerDuty. We do not charge for events that were found to be invalid, rated-limited, or that resulted in a non-successful response to the client. There are two ways to determine your event volume based on your current status as a PagerDuty customer: - [Customers](#customers-1) - [Prospective Customers](#prospective-customers-1) ### Customers > **Required User Permissions:** Account Owners can view event volume. If you are a current PagerDuty customer, you can view your event volume by navigating to **User Icon** → **Subscriptions** or you can use our [Event Analytics](/incident-management/analytics/event-analytics) page at **Analytics** → **Event Analytics**. If you have a newer account without enough data, you can also follow the prospective customer process below. ### Prospective Customers 1. Determine how many events per month are generating from the noisiest integration you intend to send to PagerDuty. 2. Determine what percentage of your monthly events that integration sends. Some monitoring/observability tools indicate the number of events they are generating. 3. Calculate: Baseline events per month = (events/month for noisiest integration)/(% of total events from noisiest integration). ## Purchase PagerDuty AIOps If you're looking to enhance your incident response process and achieve fewer incidents with faster resolution, you should consider purchasing PagerDuty AIOps. > **Required User Permissions:** Account Owners can purchase PagerDuty AIOps. ### Legacy Event Intelligence Customers For legacy Event Intelligence customers, please [contact our Sales team](https://www.pagerduty.com/contact-us/) about migrating to PagerDuty AIOps. ### New Customers If you do not currently have PagerDuty's Legacy Event Intelligence product and you are interested in purchasing PagerDuty AIOps, please follow the instructions below. 1. First, you must [determine your event volume](#determine-your-event-volume). Take note of this information, as you will use it to select your event volume tier in step 4. 2. Next, navigate to **User Icon** → **Subscriptions** and click **Upgrade Plan**. 3. Select any **plan** (if you wish to stay on your current plan, select **Current Plan**). 4. On the next screen, select your preferred **Billing Cycle** and then check the **PagerDuty AIOps** checkbox. 5. Using the event volume information you found in step 1, select your **event volume tier** from the dropdown. 6. Complete checkout. If you'd like to talk to someone about your current plan, or how you can benefit from PagerDuty AIOps, please [contact our Sales team](https://www.pagerduty.com/contact-us/). ### Edit Your Event Volume Tier If you've already purchased PagerDuty AIOps and you'd like to edit your [event volume](#determine-your-event-volume) tier, please follow the instructions below. 1. Navigate to **User Icon** → **Subscriptions** and click **Upgrade Plan**. 2. Select any **plan** (if you wish to stay on your current plan, select **Current Plan**). 3. In the **PagerDuty AIOps** box, select your **event volume tier** from the dropdown. 4. Complete checkout. --- URL: https://docs.pagerduty.com/ai-automation/aiops/pagerduty-aiops-quickstart-guide # PagerDuty AIOps Quickstart Guide Set up PagerDuty AIOps in 90 minutes For many teams, adopting [PagerDuty AIOps](/ai-automation/aiops/overview) is key to seeing fewer incidents and faster resolution. By leveraging Machine Learning (ML) and automation, our customers can see faster resolution, fewer incidents, and are able to adopt automation faster than non-AIOps customers. This guide provides instructions to configure PagerDuty AIOps in 90 minutes, and in that short amount of time you can see less noise and reduce toil across your services. > **Create Better Services:** A [service](/incident-management/services/services-and-integrations#create-a-service) is defined as a discrete piece of functionality owned by a single team. Creating better services helps our ML improve accuracy of triage context and Intelligent Alert Grouping. Refer to our [Service Standards](/incident-management/services/service-directory#service-standards) guide to learn more about how to correctly create services in PagerDuty. ## Operations Console (5 Minutes) Many organizations look for a centralized overview during incident response. The [Operations Console](/ai-automation/aiops/operations-console) is the best place to understand your operations' current state. It offers live visibility into incidents, and users can create customized views to triage and take immediate action on issues. The Operations Console offers: - [Filters and Searches](/ai-automation/aiops/operations-console#filters-and-search): Need to focus on a specific group of incidents? Leverage a configurable table and filter components (such as [Services](/incident-management/services/services-and-integrations) , [Priority](/incident-management/incidents/incident-priority) , [Escalation Policy](/incident-management/schedules/escalation-policies) ) to create your refined view. - [Customized and Shared Views](/ai-automation/aiops/operations-console#column-selector): Want to see additional columns? Add, remove, and resize columns in the Operations Console to suit your needs. You can also share your view with your team members so everyone is working from a single source of truth in one centralized location. - [Incident Actions](/ai-automation/aiops/operations-console#actions): Need to run an incident workflow or add bulk notes? Take a variety of actions directly within the Operations Console to minimize your MTTA and MTTR. You can take a guided five minute [product tour](https://pagerduty.navattic.com/operations-console). We recommend adjusting the filters and columns to build your desired views. ## Automation and Orchestration (60 Minutes) PagerDuty AIOps uses [Event Orchestration](/ai-automation/aiops/event-orchestration), an automation engine that allows you to create rules that normalize and enrich your data. There are four components to Event Orchestration that you can configure: - **[Integrations](/ai-automation/aiops/event-orchestration#global-integrations)**: Use Global Integration keys in your monitoring tools to send data to an Event Orchestration. - **[Global Orchestrations](/ai-automation/aiops/event-orchestration#global-and-service-orchestration-rules)**: Allow multiple services to enrich data according to global sets of rules. ITOps or SRE teams usually create and manage Global Orchestrations. - **[Service Routes](/ai-automation/aiops/event-orchestration#manage-routing-rules)**: Ensure that when certain conditions are met, incidents are routed to the right team. - **[Service Event Orchestrations](/ai-automation/aiops/event-orchestration#service-orchestrations)**: Create service-level orchestrations to enrich data according to the service owner’s criteria. Service-owning teams can self-serve and manage their own Service Event Orchestrations. You will use these components to build the recommended Event Orchestration types below. > **Incoming Data:** By putting PagerDuty AIOps at the front of your event stream, PagerDuty acts as a centralized overview across monitoring tools and is a force multiplier for automation. To get the most value and best results for noise reduction and automation, all your events should flow through PagerDuty AIOps. To learn about how we integrate with your tools, see our [integrations page](/integrations). For teams just getting started, here are five common use cases for Event Orchestration that we recommend creating within your account: - **[Service Routing](/ai-automation/aiops/event-orchestration#manage-routing-rules)**: With [Global Integration keys](/ai-automation/aiops/event-orchestration#global-integrations), you can use a single key to ingest all events for all services relevant to your team. After events are ingested, you can configure [Service Routing Rules](/ai-automation/aiops/event-orchestration#manage-routing-rules) to define how events are distributed to downstream teams. (5-60 minutes, depending on organization size) - **[Rules-based Noise Reduction](/ai-automation/aiops/event-orchestration#configure-a-global-or-service-orchestration-rule)**: Event Orchestration has powerful noise reduction actions based on different conditions or scenarios. These tools include [suppression, notification pausing, and incident dropping](/ai-automation/aiops/event-orchestration#incident-data). Create broad conditions that describe classes of events that don't provide value to your teams. Then select the **Suppress** action to stop those events from generating notifications. (15 minutes) - **[Standardized Incident Response Procedures](/ai-automation/aiops/event-orchestration#configure-a-global-or-service-orchestration-rule)**: For well-understood incidents, add notes to incidents when they’re created. These [notes](/ai-automation/aiops/event-orchestration#incident-data) should define the standard response procedures for the incident. This is especially helpful to have in place for junior responders who need more context. (5-60 minutes depending on your existing documentation) - **[Major Incident Management](/ai-automation/aiops/event-orchestration/cache-variables)**: With Event Cache Orchestration variables, you can quickly identify when a major incident is occurring based on historical event data and adjust how rules are applied in those situations. This can help facilitate incident response during a major incident and ensure the right responders are being pulled in. (15 minutes) - **[Automated Incident Triage](/ai-automation/aiops/event-orchestration#configure-a-global-or-service-orchestration-rule)**: Event Orchestration can automatically assign priorities and severities to events when they are ingested, ensuring related incidents are treated correctly. To do this, define all the conditions that describe a high, medium, or low priority incident in your environment and specify the appropriate priority. (15 minutes) Once you’ve created these Orchestrations, you will only receive incidents relevant to your team and you’ll be able to resolve them faster with less toil and better data. Most of our customers see a reduction in MTTR and are able to create automation faster. ## Noise Reduction (20 Minutes) [Noise reduction](/ai-automation/aiops/overview#noise-reduction) is a top priority for all teams. It’s a significant quality-of-life improvement for incident responders, whether they’re a NOC operator or a DevOps engineer. 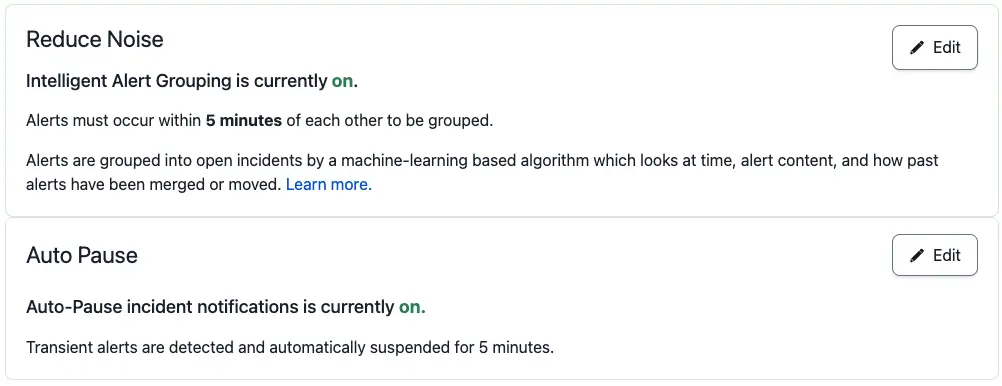 *Noise Reduction settings on a service* There are six ways you can set your noise level threshold. We recommend that new users configure their noise reduction settings as such: - **[Intelligent Alert Grouping](/ai-automation/aiops/noise-reduction/alert-grouping/intelligent-alert-grouping)**: Leverages ML to group related alerts based on previous incident data and human interaction. This option uses a rolling grouping window with a duration between five minutes to an hour. We recommend starting with five minutes. If Intelligent Alert Grouping groups an alert incorrectly while it learns, you can regroup the alert. This will train the model to group alerts like this in the future. - **[Auto-Pause Incident Notifications](/ai-automation/aiops/noise-reduction/auto-pause-incident-notifications)**: Leverages ML to identify alerts that typically auto-resolve on their own and pauses incident creation. Select a duration ranging from 2-15 minutes. If the alert does not auto-resolve within the configured time period, PagerDuty will create an incident. Intelligent Alert Grouping is the best way to see immediate noise reduction in the environment. For teams with specific alert grouping requirements, we also recommend the following: - **[Content-Based Alert Grouping](/ai-automation/aiops/noise-reduction/alert-grouping/content-based-alert-grouping)**: Create custom alert grouping based on known fields between alerts. Alerts that share an exact match on a set of chosen fields will be grouped together into the most recent open incident. You can even leverage Event Orchestration to add custom details that then are grouped by content. - **[Unified Alert Grouping](/ai-automation/aiops/noise-reduction/alert-grouping/unified-alert-grouping)**: Combines Content-Based Alert Grouping and Intelligent Alert Grouping with a flexible time window for increased precision and correlation control. - **[Global Alert Grouping](/ai-automation/aiops/noise-reduction/alert-grouping/global-alert-grouping)**: Allows you to reduce noise by using Content-Based Alert Grouping to group alerts across multiple technical services. - **[Time-Based Alert Grouping](/ai-automation/aiops/noise-reduction/alert-grouping/time-based-alert-grouping)**: Allows you to group alerts based on a static time increment of your choice, ranging from 2 minutes to 24 hours, or even until the incident is resolved. This option is helpful for services that generate many alerts. We recommend starting with 2-5 minutes. > **PagerDuty AIOps ML Model:** PagerDuty AIOps’ unique ML model is always analyzing data signals, so when you turn it on, there is minimal-to-zero training necessary. For existing customers who are new to AIOps, the model will start working immediately, as the platform is continuously learning from responder actions. For new users, the model will begin learning as soon as you begin using PagerDuty. The model will become more accurate as you send more events to PagerDuty, and resolve more incidents. ## Triage and Root Cause Analysis (1 Minute) PagerDuty AIOps comes with several ML [triage features](/ai-automation/aiops/overview#triage-and-rca) to provide you with more context during incident response. This also removes the toil of digging through documentation and postmortems to find the key information you’re looking for. **Triage and Root Cause Analysis (RCA) features require zero configuration**. When you turn on AIOps, the ML algorithms begin processing data. Similar to other ML-based features, the more data you add to PagerDuty, the more effective these tools will be for you and the faster the model will learn. Our ML-based triage and RCA features include: - **[Outlier Incident](/ai-automation/aiops/outlier-incident)**: Tells you if an incident is frequent, rare, or an anomaly. Helps responders understand how novel an incident is. The more novel, the more they might want to have help. - **[Past Incidents](/ai-automation/aiops/past-incidents)**: Shares if an incident like this has occurred in the past, as well as the incident frequency over the last six months. If so, you can click into the past incident and view incident metadata – like who was involved or what remediation efforts were used. - **[Related Incidents](/ai-automation/aiops/related-incidents)**: Shows other active incidents within the system that may be related. This helps you understand dependencies and cascading impact of an incident, and it allows you to provide feedback to improve recommendations over time. - **[Probable Origin](/ai-automation/aiops/probable-origin)**: Determines the most likely service origin of the incident. This scopes the incident and tells you which team to coordinate with for more insights. - **[Change Correlation](/ai-automation/aiops/recent-changes#change-correlation)**: Uses machine learning to correlate which incidents happen with certain changes. The incident shows recent changes on that service or related services. As most incidents are change-related, this gives you a jump start on triage. **Video: PagerDuty AIOps Triage and RCA** ## Resources ### PagerDuty AIOps Support If you’re a current PagerDuty AIOps customer and you have further questions, please read [PagerDuty AIOps](/ai-automation/aiops/overview), or reach out to your account team. If you’re interested in PagerDuty AIOps, you can [sign up for a trial](https://www.pagerduty.com/try-pagerduty-aiops/) or [take our interactive product tour](https://pagerduty.navattic.com/265z0hdg). ### Deeper Learning If you'd like to go deeper into the information presented in this article, you can enroll in our PagerDuty University [AIOps Knowledge Series](https://university.pagerduty.com/path/aiops-knowledge-series), and work towards becoming a PagerDuty-certified AIOps specialist. --- URL: https://docs.pagerduty.com/ai-automation/aiops/past-incidents # Past Incidents View previous incidents to gain helpful context during incident triage The Past Incidents feature allows incident responders to view historical incidents that had similar metadata and were generated on the same service as their current active incident. Past Incidents adds helpful context for accurate triage, which can lead to shorter resolution time. Responders receive the following helpful information: - Whether they, or someone on their team, was involved in a previous incident. - When these types of incidents happened. - Incident details that show what remediation steps were taken in the past. > **AIOps / Signal Intelligence Feature:** This feature is included with the [PagerDuty AIOps](/ai-automation/aiops/overview) add-on, or included as Signal Intelligence in PD Reliability Platform plans. To sign up for a trial of PagerDuty AIOps features, read [PagerDuty AIOps Trials](/ai-automation/aiops/overview#pagerduty-aiops-trials). > **AIOps Service Configuration:** Your service configuration must have AIOps enabled to use this feature. See [Configurable Service Settings](/incident-management/services/configurable-service-settings#manage-aiops) for more information and enablement steps. > **Legacy Availability:** This feature is also available with [Legacy Event Intelligence](/ai-automation/aiops/legacy-event-intelligence). ## View Past Incidents Users can see the Past Incidents feature in multiple places: - [Web app](#view-past-incidents-in-the-web-app) - [Mobile app](#view-past-incidents-in-the-mobile-app) - [REST API](#access-past-incidents-via-api) ### Web App 1. From the Incidents page or a service’s page, click your desired incident’s **title**. 2. On the incident’s detail page, select the **Past Incidents** tab. 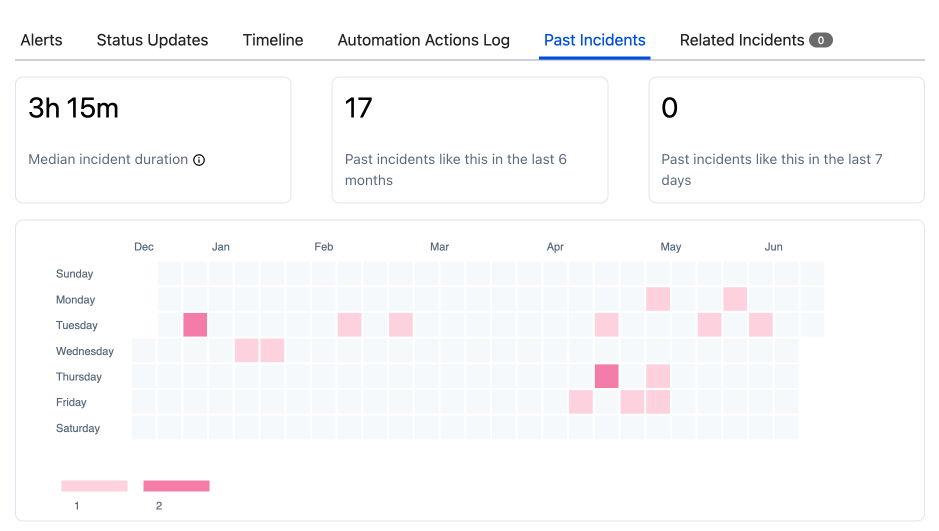 *Past Incidents in the web app* ### Mobile App In the mobile app: 1. Select an incident to navigate to its details page. 2. Scroll to the section **Past Incidents** and tap **View Past Incidents**.  *Past Incidents in the mobile app* > **View Incident Details:** On the **Past Incidents** screen, select an incident to navigate to its details page. #### Sort Order You can adjust whether the list of Past Incidents sorts by recency or relevance. 1. At the top of the screen, tap **Recent**.  *Tap "Recent"* 2. Select **Recent** or **Relevant**.  *Select "Recent" or "Relevant"* ### REST API To access Past Incidents via API, please visit our [API documentation](/developer/api/reference/rest/incidents/get-past-incidents). ## Past Incidents Details and Behavior The Past Incidents feature uses machine learning to display a historical list of incidents from the same service that are similar to the incident you are currently investigating. Past Incidents are determined by four main factors: - The semantics of the incident title. - Which responders have responded to past incidents. - The duration of the past incident. - The date and time of the past incident’s creation. 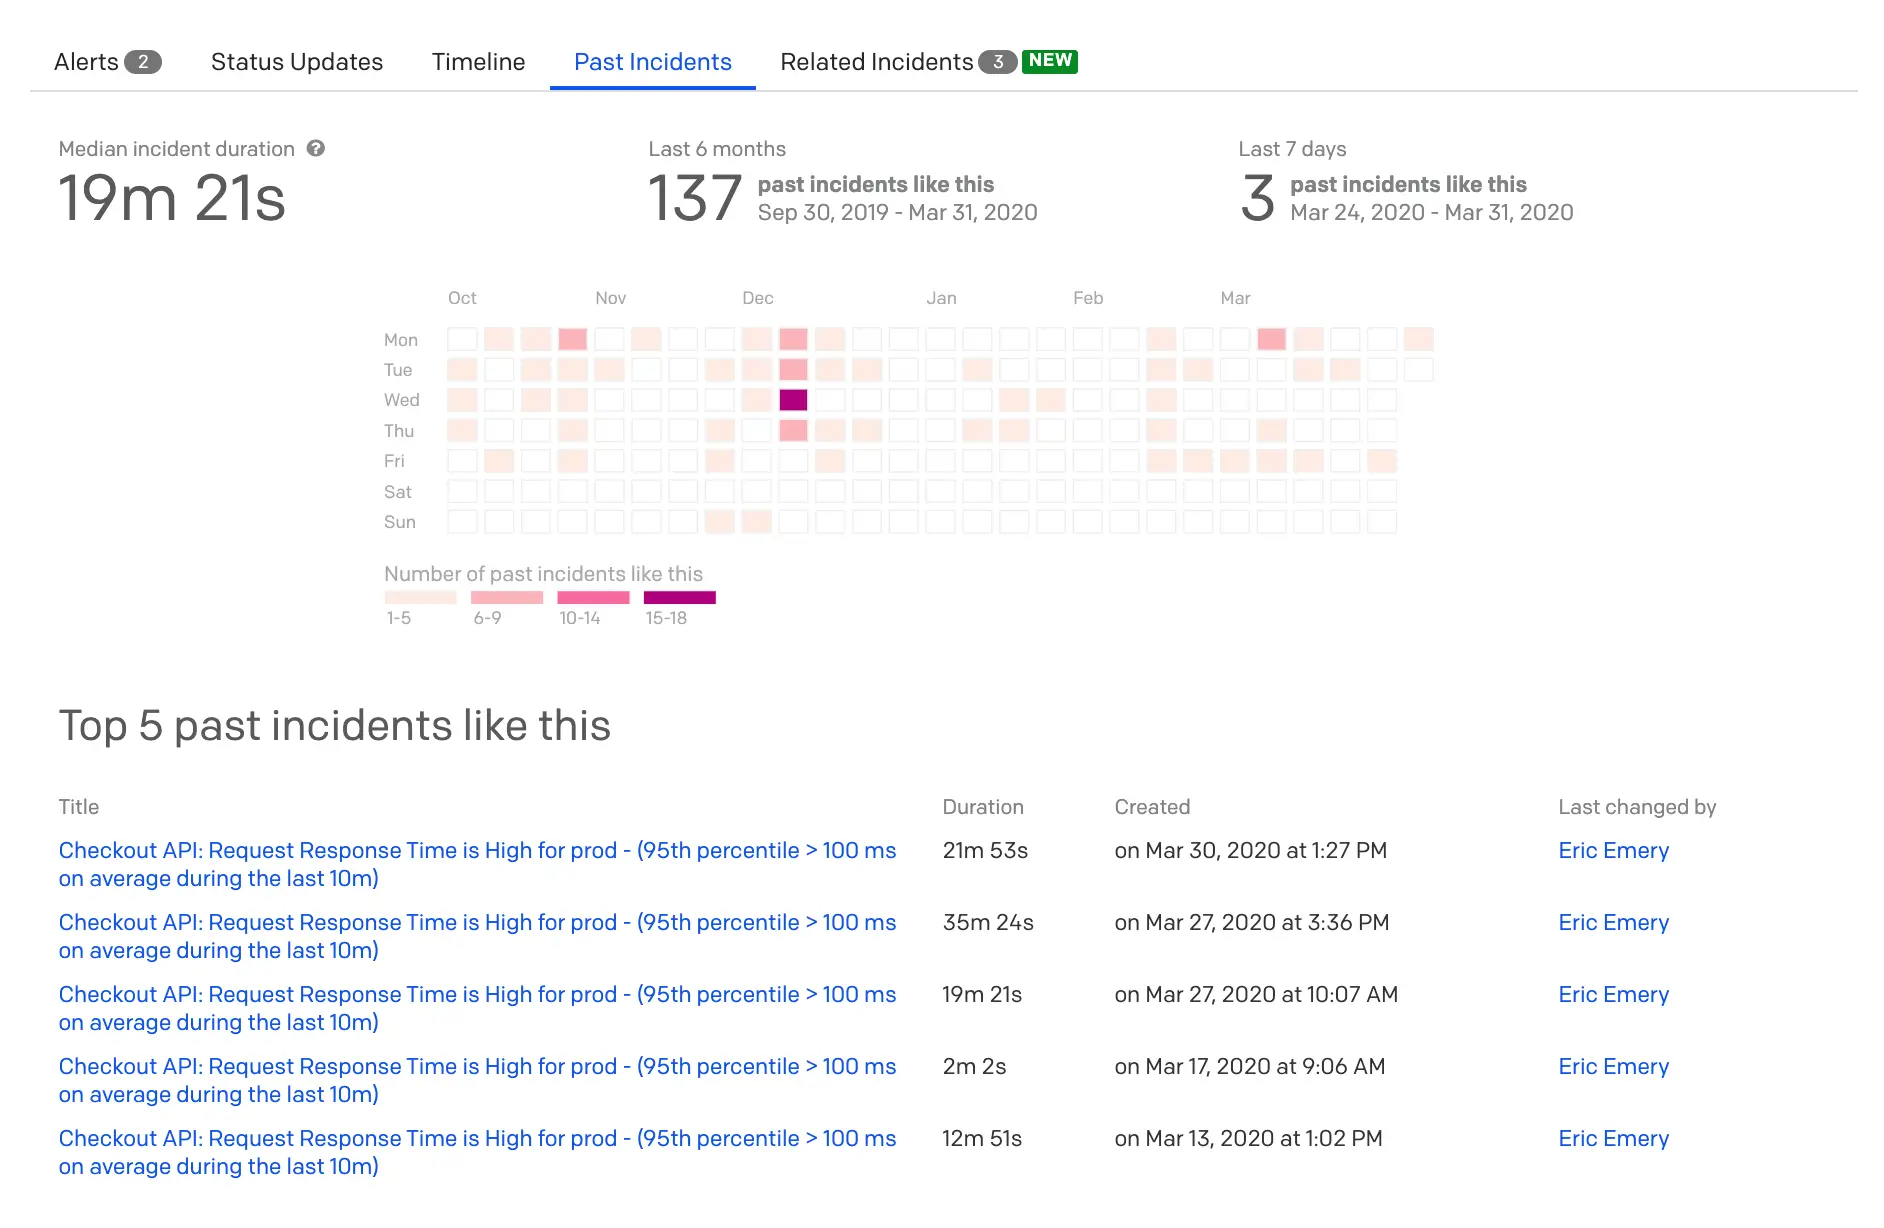 The Past Incidents heat map provides a high-level overview of incidents on the same service from the past six months that are similar to the one you are viewing. Darker squares on the heat map represent days when a higher concentration of past incidents, while lighter squares indicate a lower concentration. The legend for the number of past incidents will dynamically change relative to the range of past incidents observed in a single day. To view more details for a specific day, you can hover over a square to see past incidents' titles. Click on a square to populate the top five past incidents from that day in the Past Incidents list. You can then easily access those incidents for additional context by clicking the linked incident title. 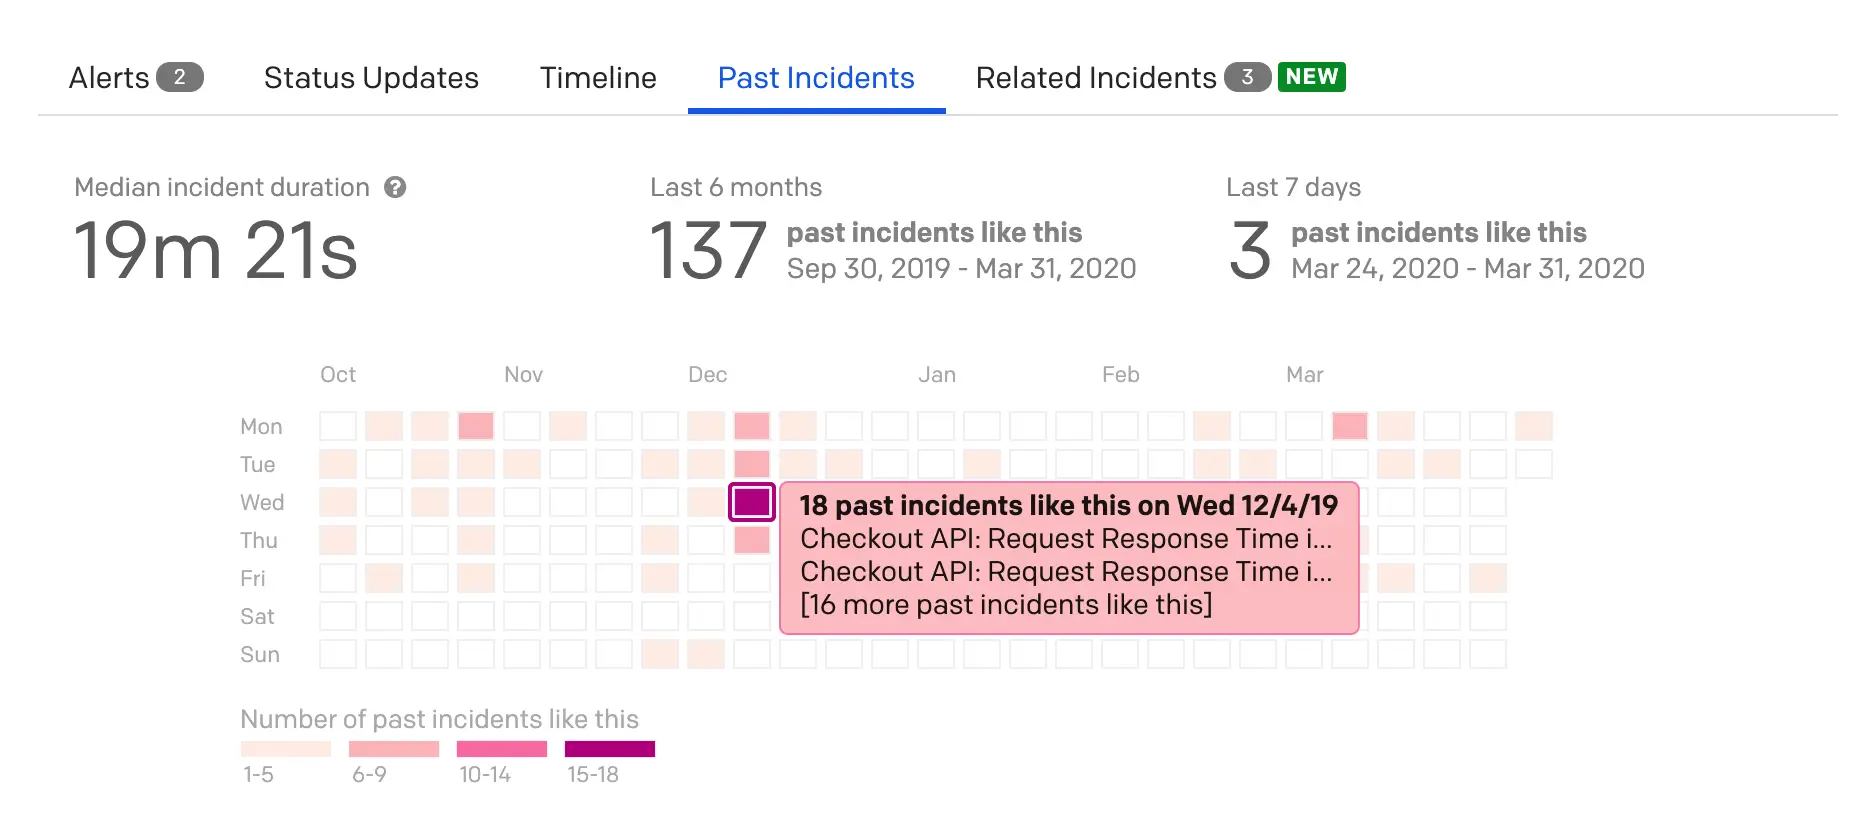 *Past Incidents heatmap detail* The Past Incidents list displays historical incidents with specific metadata fields and links. For each past incident, you can see the following: - **Title:** The incident title in its current state. If the incident title was manually edited, the final title will be displayed here. - **Duration:** Duration of the incident. - **Created:** Date and time the incident was created. - **Last Changed By:** The PagerDuty user who last made a change to this incident. If this incident was not edited by any PagerDuty user, this field will be blank, “--”. This can happen, for example, if the incident was triggered and then resolved by the integrated monitoring tools. > **Important Notes:** - Past Incidents will only return incidents from the same service as the incident you are viewing. > > - If you would like to hide Past Incidents, please [contact PagerDuty Support](https://www.pagerduty.com/contact-us/). ## FAQ **Can I tell the system that an incident in the Past Incidents list is not similar to my current incident?** There are no configuration options for Past Incidents. We welcome your comments and feedback for what you would like to configure about Past Incidents. **How is this different from Alert Grouping?** [Alert Grouping](/ai-automation/aiops/overview#noise-reduction) combines alerts that are currently part of the same incident. In contrast, Past Incidents looks at similar incidents from any point in time to help users get the context needed to resolve an incident. **Do suppressed alerts show up in Past Incidents?** No, the goal of Past Incidents is to show relevant incidents from your incident management history. If you’ve decided to suppress alerts on a service, those alerts will not be part of your service’s history. We take that as an indication that those alerts are not relevant to the current incident and therefore will not be displayed under Past Incidents. ### Can I see Past Incidents when I write Postmortems? Past Incidents are not an explicit part of the [Postmortems](/incident-management/incidents/post-incident-reviews-and-postmortems#create-a-postmortem) feature. You can always use information from historical incidents to help add context to the postmortem. --- URL: https://docs.pagerduty.com/ai-automation/aiops/pd-reliability-console # PD Reliability Console An overview of the PD Reliability Platform Console The PD Reliability Console is your operational home for incident response — a single, real-time view of incidents, on-call coverage, and PagerDuty agent activity. It extends the existing [Operations Console](/ai-automation/aiops/operations-console) with visibility into Paige, PagerDuty's SRE Agent, and Scribe Agent alongside existing monitoring capabilities, and can function as your default landing page upon login. > **Availability:** The PD Reliability Console is exclusive to PD Reliability Platform customers. Legacy package accounts retain their existing Operations Console and Incident List unchanged. > **Required User Permissions:** All users may view the console's incident data, on-call coverage, and agent status. Only Admins can enable or configure PagerDuty agents; non-Admin users may request activation from the Agents drawer. ## View the PD Reliability Console In the web app, navigate to **Console** in the left menu. > **Default Landing Experience:** The console automatically displays as the first page after login. Navigate elsewhere via the left menu. ## PagerDuty Agents in the PD Reliability Console The console displays enablement status for four agents: [Paige (SRE Agent)](/ai-automation/advance/sre-agent), [Scribe Agent](/ai-automation/advance/scribe-agent), [Insights Agent](/ai-automation/advance/insights-agent), and [Shift Agent](/ai-automation/advance/shift-agent). 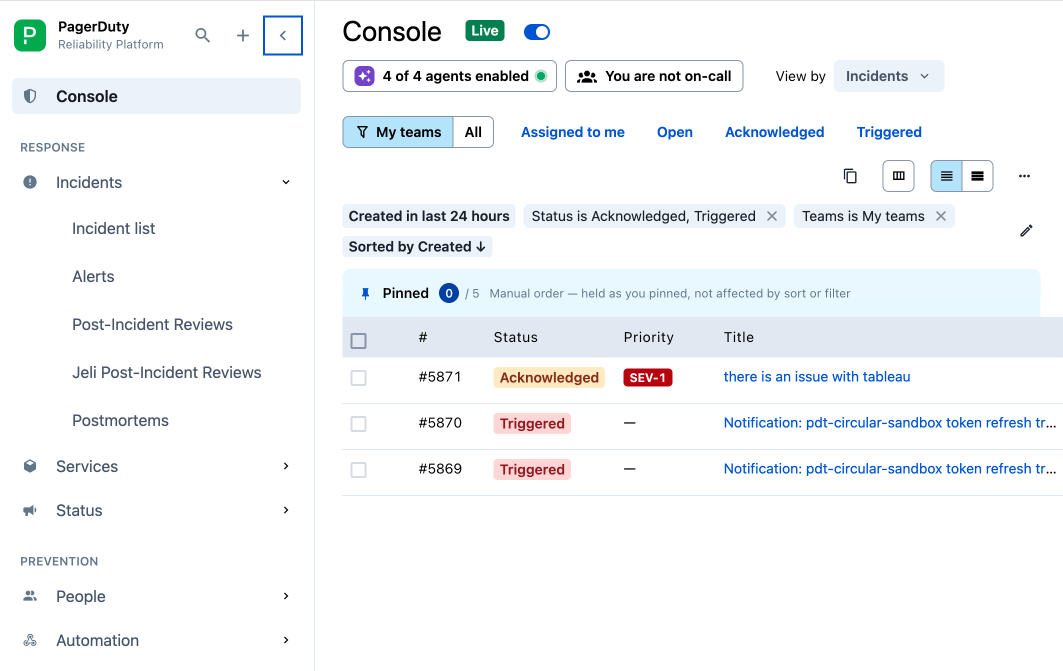 ### AI Agents Widget The AI status widget indicates enablement status. Click it to open the Agents drawer. Each agent row includes a description, and displays connected surfaces if enabled (for example, Paige may show Slack, Datadog, and GitHub connections; Scribe Agent may show Zoom, Slack, or Microsoft Teams). - **Paige**: investigates incidents, correlates signals, and posts triage findings and recommendations - **Scribe Agent**: captures chat, calls, and timeline updates into incident records automatically - **Insights Agent**: surfaces patterns, recurring causes, and learnings across services as incidents close - **Shift Agent**: preps on-call handoffs and briefs incoming responders on open work For disabled agents, click **Agent Settings** to configure. 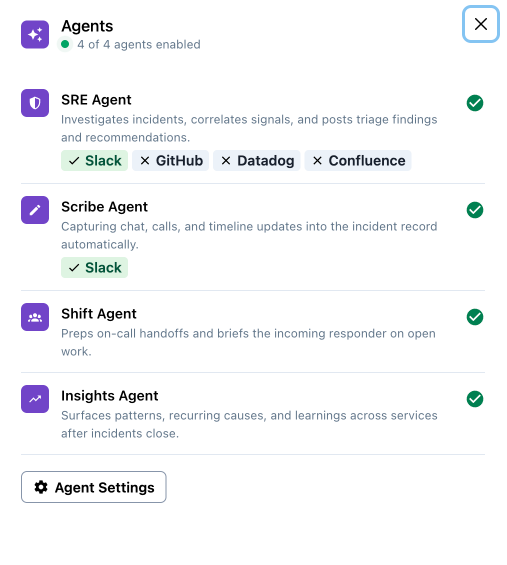 *PD Reliability Console - Agents View* ### On-Call Widget The On-Call Widget displays your current on-call status: - **You are on-call**: your avatar with a green dot - **You are not on-call**: a team icon Click it to open the on-call drawer. 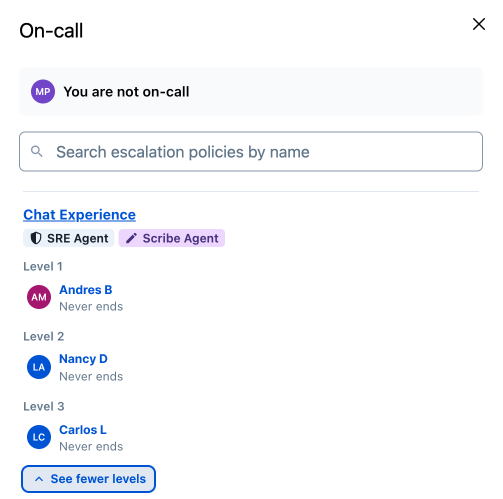 *On-Call Widget* The status card, pinned at the top, shows: - Your on-call status indicator - Each escalation policy with your level and coverage end time - Upcoming shifts, including your next shift if you're not currently on-call Below the status card, the roster shows: - Responders grouped by escalation policy - Paige and Scribe Agent enablement badges per policy - Each on-call level, its responders, and shift end time You can search the roster by service, escalation policy, or responder. > **Escalation Policy Limit:** With 10 or more escalation policies, the roster shows the first ten with a link to the full Escalation Policies page. ## Shared Operations Console Functionality The PD Reliability Console uses the same incident table, filtering, and action capabilities as the [Operations Console](/ai-automation/aiops/operations-console), with matching default columns. Refer to the Operations Console documentation for: - Column selector - Side panel - Filters and search, including keyword search - Incident actions and bulk actions - Custom Details - Service Health Visualization > **Data Lookback Window:** The console displays a limited history window, showing incidents from up to 60 days in the past. Access the Incidents page for older incidents. > **Row and Selection Limits:** Maximum 1,000 rows in memory; 50-row cap per bulk action selection, matching Operations Console limits. ## FAQ **Can I still see incidents older than the console's lookback window?** Yes. Navigate to the Incidents page to view incident history beyond the PD Reliability Console's lookback window. **Who can enable PagerDuty agents from the console?** Only Admins can enable or configure agents. Non-Admin users may submit activation requests from the Agents drawer. **What happens to my Operations Console if I am not on PD Reliability Platform?** No changes occur. Legacy package accounts retain existing Operations Console and Incident List functionality. **Does the agent card show what an agent is doing right now?** No. The Agents drawer displays enablement and configuration status, not a live stream of current agent activity. --- URL: https://docs.pagerduty.com/ai-automation/aiops/probable-origin # Probable Origin Analyze past patterns and identify likely incident origins Probable Origin provides responders with suggestions of incidents and services that are likely to be the origin point of the incident currently under investigation. This feature uses data science techniques to analyze past patterns over the prior six months to recognize when a recurring pattern of cascading incidents takes place. Viewing the suggested services and incidents, responders can map impact radius and quickly get to an incident origin point. This ensures the right team is quickly brought to the response, reducing the need for swarming and elimination processes, and freeing up resources on unconnected services. > **AIOps / Signal Intelligence Feature:** This feature is included with the [PagerDuty AIOps](/ai-automation/aiops/overview) add-on, or included as Signal Intelligence in PD Reliability Platform plans. To sign up for a trial of PagerDuty AIOps features, read [PagerDuty AIOps Trials](/ai-automation/aiops/overview#pagerduty-aiops-trials). > **AIOps Service Configuration:** Your service configuration must have AIOps enabled to use this feature. See [Configurable Service Settings](/incident-management/services/configurable-service-settings#manage-aiops) for more information and enablement steps. > **Legacy Availability:** This feature is also available with [Legacy Event Intelligence](/ai-automation/aiops/legacy-event-intelligence). ## View Probable Origin in the Web App 1. From the **Incidents** page or a service’s detail page, click your desired incident’s **Title** to see its detail page. 2. If results are available, a **Probable Origins** card on the right side of the screen will display up to three suggested origin incidents. 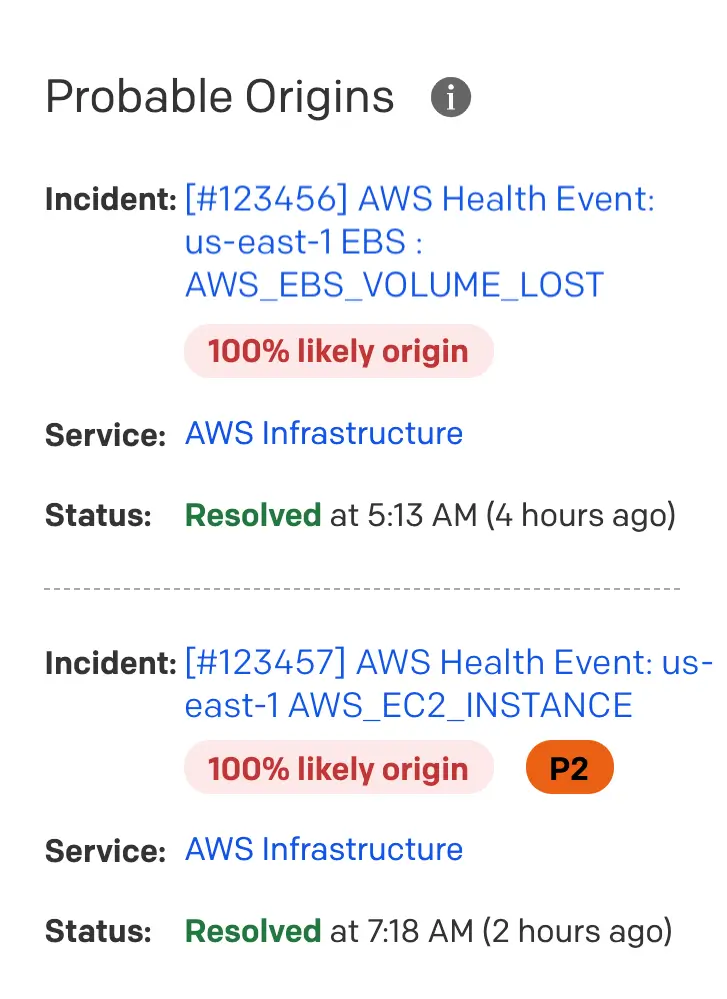 Suggested incidents are ordered by the likelihood of a connection to the current incident being investigated. Likelihood is determined by how often the suggested incident occurred immediately before an incident similar to the primary incident. ### Probable Origin Fields - **Incident**: A link to the Probable Origin incident, the percentage likelihood that the incident was the origin of the incident currently under investigation, and the Probable Origin incident's priority (if applicable). - **Service**: A link to the service that the Probable Origin incident was on. - **Status**: The status of the Probable Origin incident with timestamp information. ## FAQ **Will every incident have Probable Origin suggestions available?** No, not every incident will have Probable Origin results. Past occurrence patterns determine Probable Origin suggestions. If a particular incident has not typically occurred in a similar pattern with other incidents, no Probable Origin suggestions will display. **As a new PagerDuty customer, when will Probable Origin suggestions appear for me?** For existing PagerDuty customers that purchase the [AIOps add-on, or the Enterprise for Incident Management or Digital Operations (Legacy) plans](https://www.pagerduty.com/pricing/aiops/), Probable Origin suggestions will be available immediately, based on incident data from the past six months. For new PagerDuty customers, Probable Origin results will not be immediately available, since we rely on historical incident patterns to provide recommendations. The time required to start producing recommendations will depend on your incident volume. For customers with large volumes of incident data, expect suggestions within the first month of using PagerDuty. **How is Probable Origin different from Related Incidents?** Probable Origin and [Related Incidents](/ai-automation/aiops/related-incidents) provide complementary information to help form a full picture of the impact radius of an incident. Related Incidents uses real-time machine learning and service dependency data to find correlated incidents that are actively impacting other responders and PagerDuty services. Related Incidents uses alert metadata to determine if incidents are related. In contrast, Probable Origin uses occurrence pattern data to determine when one incident may have caused the incident under investigation. Related Incidents suggests incidents that have occurred on any service, _except_ the service with the incident that is actively being viewed. Probable Origin suggests incidents that have occurred on any service, _including_ the service with the incident that is actively being viewed. --- URL: https://docs.pagerduty.com/ai-automation/aiops/recent-changes # Recent Changes Send change events to provide context on recent service changes Change events represent service changes such as deploys, build completion, configuration updates, etc. This information can prove critical during incident triage or hypercare, when a system or product has recently launched. You can send change events via product-specific integrations or directly to the [Events API](/developer/api/reference/events-v2/send-change-event/create-change-event). Change events do not create alerts, incidents or notifications. > **AIOps / Signal Intelligence Feature:** This feature is included with the [PagerDuty AIOps](/ai-automation/aiops/overview) add-on, or included as Signal Intelligence in PD Reliability Platform plans. To sign up for a trial of PagerDuty AIOps features, read [PagerDuty AIOps Trials](/ai-automation/aiops/overview#pagerduty-aiops-trials). > **AIOps Service Configuration:** Your service configuration must have AIOps enabled to use this feature. See [Configurable Service Settings](/incident-management/services/configurable-service-settings#manage-aiops) for more information and enablement steps. ## Configure an Integration to Send Change Events There are a number of integrated tools which support sending change events to PagerDuty. You can find these in our [integrations library](/integrations) by selecting the **CI/CD and Change** filter:  Select your preferred guide and follow the setup instructions to complete the integration. ## Configure Integration via the Recent Changes Page You can also add an integration on the **Recent Changes** page: 1. Navigate to **AIOps** → **Recent Changes** and click **New Change Integration**. 2. Choose one of the following options: - **PagerDuty Integrations**: Select your preferred vendor from the **Select a vendor** dropdown. - **PagerDuty Events API**: Select this option to create custom change events with the [PagerDuty Events API](/developer/custom-change-event-transformer). 3. Enter an **Integration Name** (_optional_), select a service from the dropdown, and click **Next**. 4. In the modal, copy the integration key. Click **View documentation** to see [Send a Change Event](/developer/api/reference/events-v2/send-change-event/create-change-event) documentation from our developer docs. 5. Click **View Integration** to see the integration on the service you selected, or **Done** to close the modal. 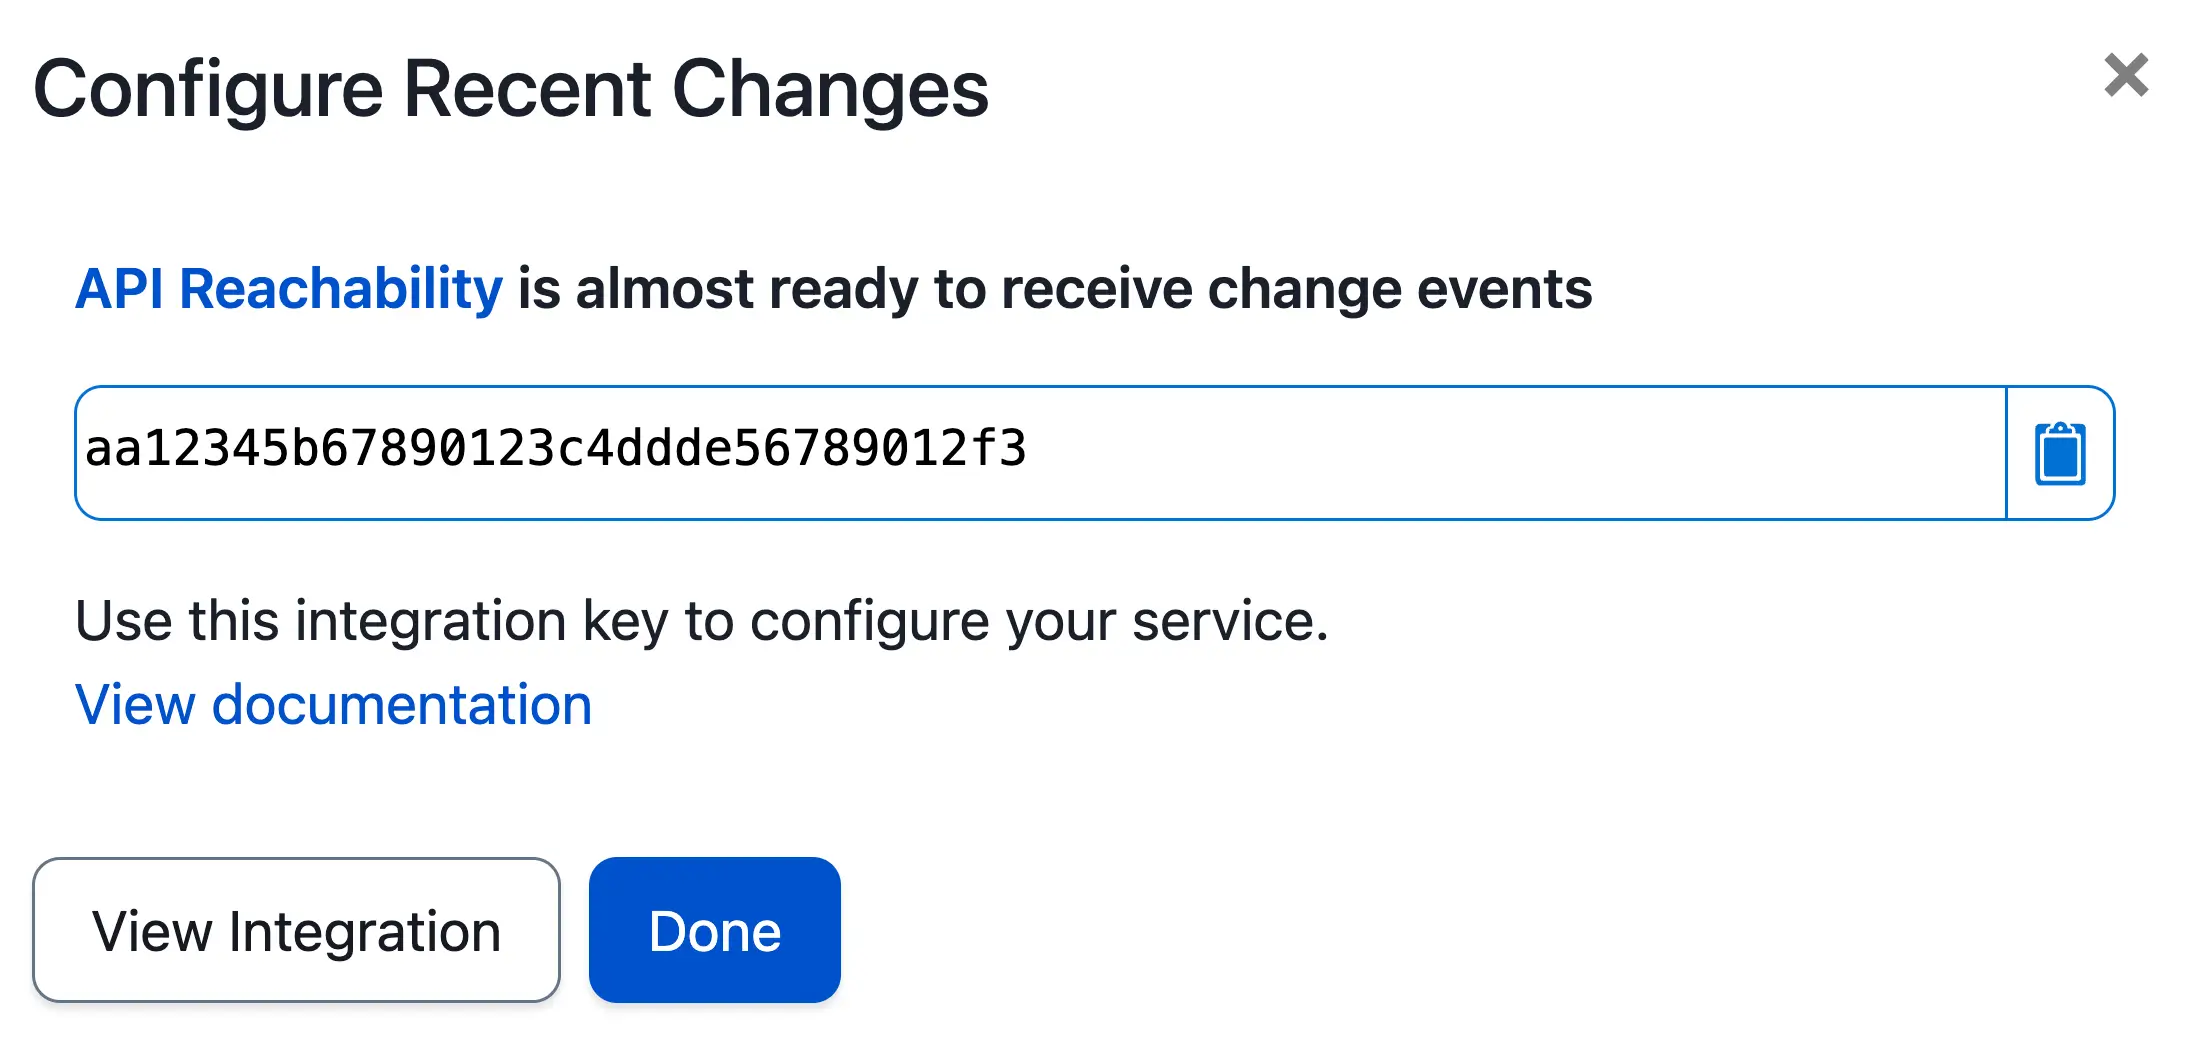 *Configure recent changes* ## Send Change Events via Events API You can send change events [via the Events API v2](/developer/api/reference/events-v2/send-change-event/create-change-event). The [Events API v2 Overview](/developer/events-api-v2-overview#change-events) offers guidance on when to send a change event instead of an alert event. You can send both event types using the same Events API v2 integration key; what differs is the endpoint: - **Alert events endpoint**: `https://events.pagerduty.com/v2/enqueue` - **Change events endpoint**: `https://events.pagerduty.com/v2/change/enqueue` ## Send Change Events via Custom Change Event Transformer You can also use a [Custom Change Event Transformer](/developer/custom-change-event-transformer) to reliably convert the payload that integrations send into a format that PagerDuty can understand as a change event. ## View Change Events in the Web App ### View and Filter Change Events Across All Services To view and filter change events across all services: 1. Navigate to **AIOps** → **Recent Changes**. 2. Optionally filter by **Team**, **Service**, integration **Type** and **Last Changed** time range. 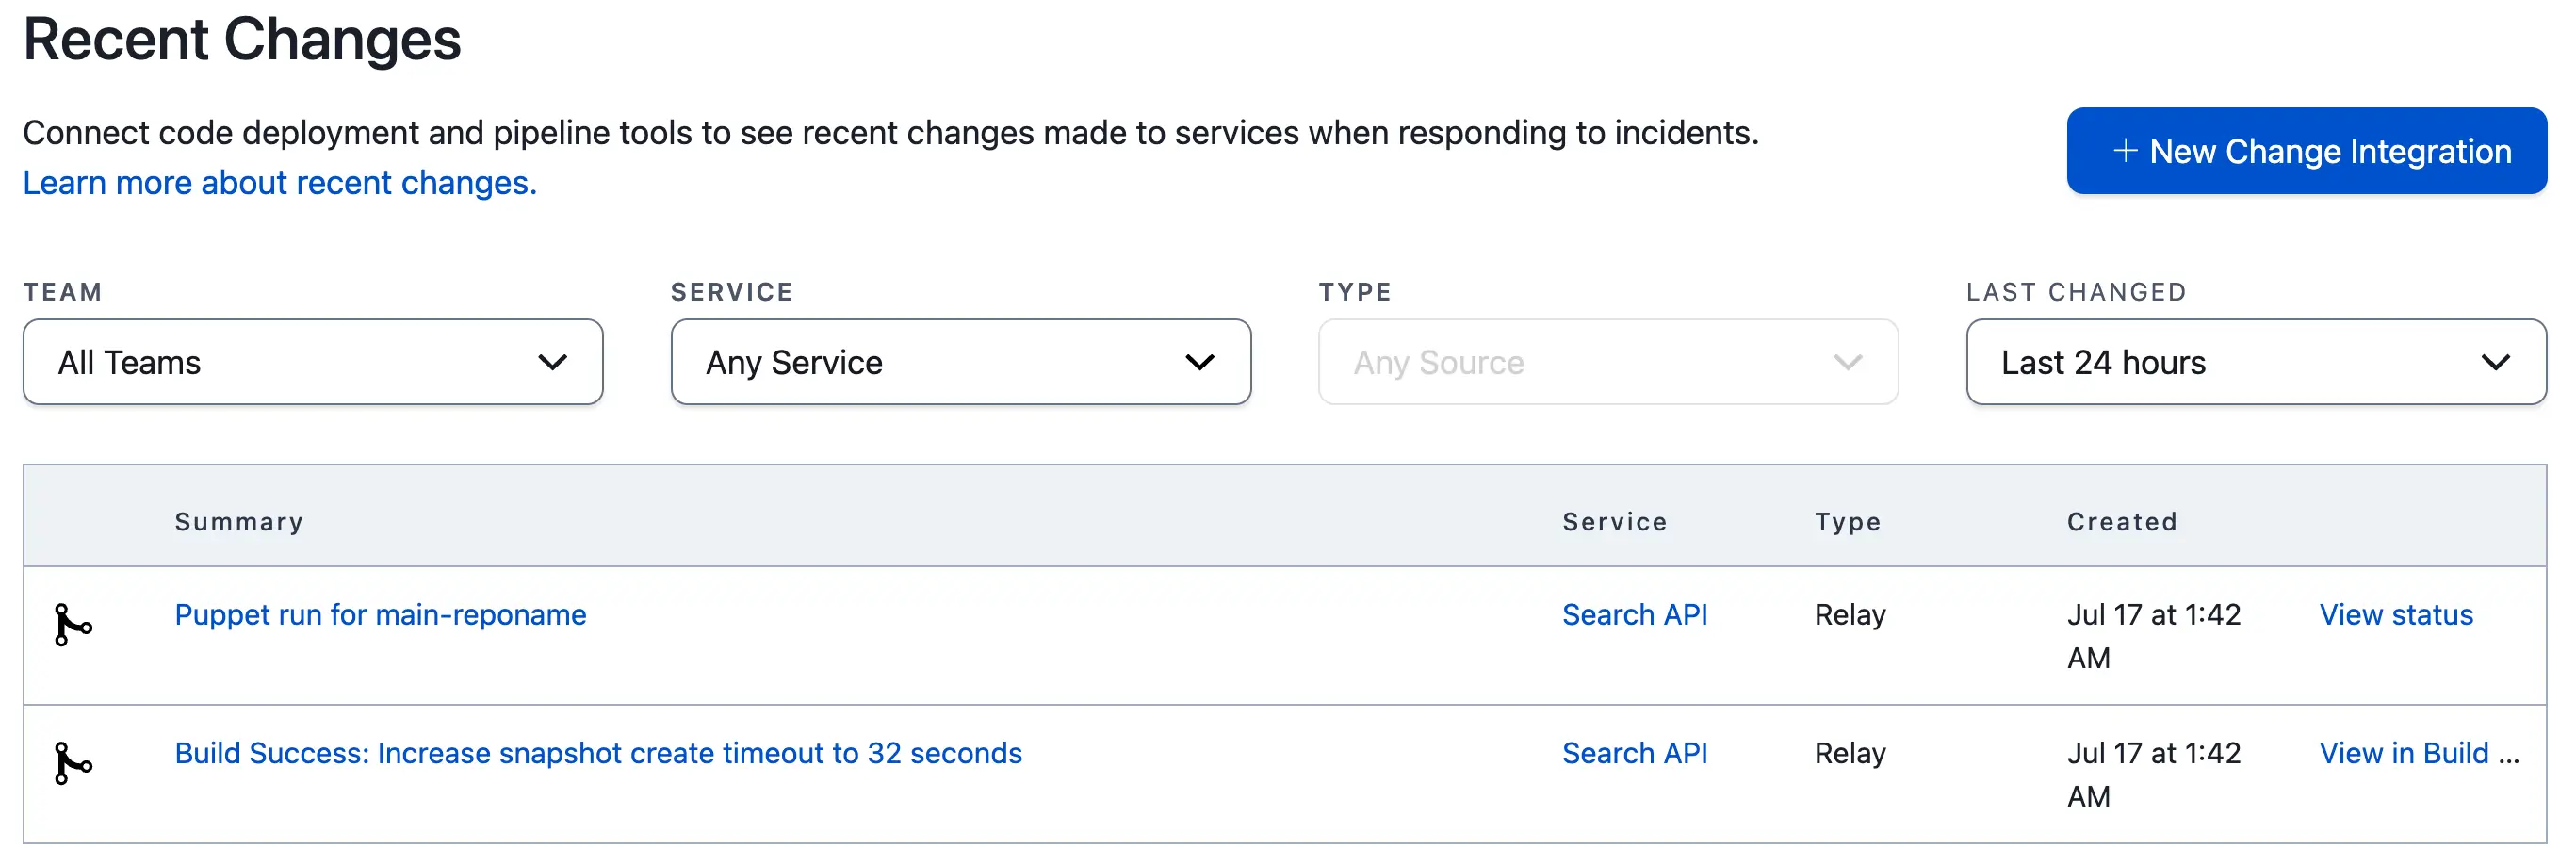 *Changes events* > **Time Range:** This table will not display change events that happened more than 90 days in the past. ### View Change Events on a Service 1. Navigate to **Services** → **Service Directory** and click the **title** of the integrated service. 2. The **Recent Changes** table displays a list of change events. ### View Change Event Details To view a change event's details, click the change event's **title**. The detail view displays information that was included in the change event request body, for example, the **Service**, **Type**, **Timestamp**, **Summary**, **Source** and **Links** (e.g., to the pull request, the integrated repository and the user's profile). The **Custom Details** section displays any additional information that was included in the event's `payload.custom_details` parameter. You can select from two display formats as needed: **Formatted** or **Raw**. 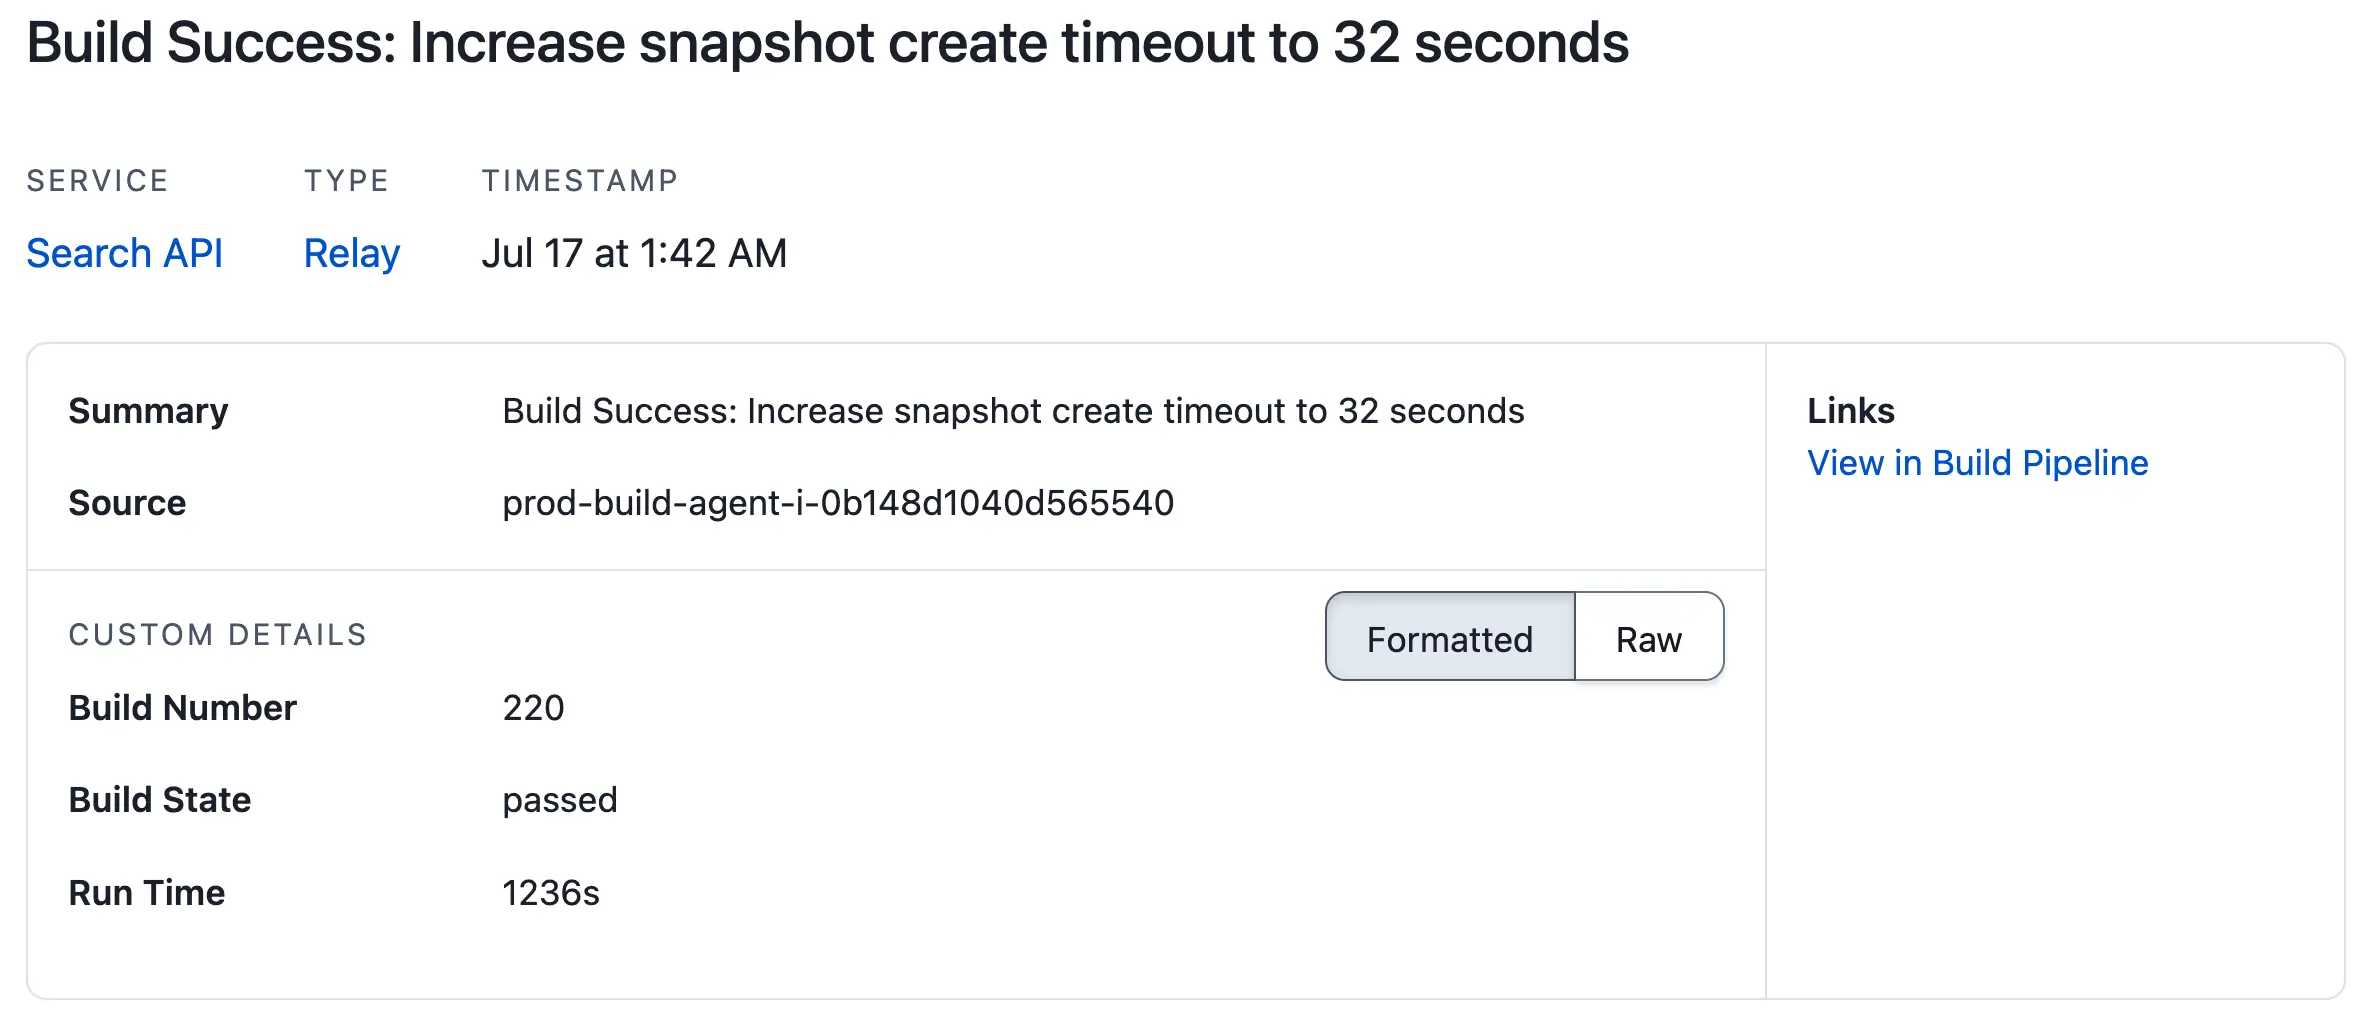 *Change event details* ## View Change Events in the Mobile App Change events are available in two areas of the mobile app: - [Incident Detail](/ai-automation/aiops/recent-changes#incident-detail) - [Service Detail](/ai-automation/aiops/recent-changes#service-detail) ### Incident Detail To view change events on an incident’s detail screen, tap your desired **incident** and scroll to the **Change Events** section. A maximum of two recent changes are displayed. Tap **View Change Event(s)** to view a list of all change events, or tap **** to the right of a specific change event's title to view more details about the change event. The change event detail area will include **Change Correlations**. For more information, please read the section [Change Correlation](#change-correlation) below.  ### Service Detail To view change events on a service, navigate **Services**, select your desired service and scroll to the **Change Events** section. A maximum of two recent changes are displayed. Tap **** to the right of the change event title to view details about the change event. ## Change Correlation Change correlation provides responders with recent change events that are most relevant to an incident. Once you have configured change event integrations, no specific setup is required to start seeing change correlations on incidents. Each change event will have context as to why it was correlated based on three factors: time, related service or intelligence (i.e., machine learning). With valuable context available at a glance, responders can triage incidents quickly and reduce time-to-resolution. To extract the most value from related service change correlations, ensure that your [business and technical services dependencies](/incident-management/services/service-profile#service-dependencies-tab) are configured properly. Regarding intelligent correlation, the more change event data you send across your services, the more data the learning model will have to analyze and draw correlations between past change events and current incidents. ### View Change Correlations 1. Navigate to an incident and click its **Title** to view the details page. 2. The **Recent Changes** section displays up to three recent change correlations from the past 24 hours, as well as a correlation reason.  ### Time-Based Change Correlation Time-based change correlations indicate that change events occurred on the service within the past 24 hours. You can identify a time-based correlation by viewing the context under the change event title: `This incident occurred X minutes/hours after this change`  ### Related Service Change Correlation Both business services and technical services may appear as a related service change correlation. You can identify a related service correlation by viewing the context under the change event title: `This change occurred on a service related to [THIS INCIDENT’S SERVICE NAME]`  ### Intelligent Change Correlation Intelligent change correlations (machine learning) are determined by three main factors: - How close in time the previous incidents and change events occurred. - How related are the change event and incident metadata. - The frequency that a particular change event and incident occurred. You can identify an intelligent change correlation by viewing the context under the change event title: `Similar incidents have previously occurred with changes like this`  ### Change Correlation via API To access change correlation via API, please [visit our API documentation](/developer/api/reference/rest/change-events/list-change-events). ## FAQ **Is it possible to modify change events using Event Orchestration?** Not at this time. We’d be interested to learn about what you would like to accomplish. Please [contact our Support team](https://www.pagerduty.com/contact-us/#contact-support) with your use case and any feedback. **Can change events be sent to a global integration key?** Not at this time. Change events must be sent to a service-level integration key. --- URL: https://docs.pagerduty.com/ai-automation/aiops/related-incidents # Related Incidents View active related incidents across all services to gain helpful context during incident triage The Related Incidents feature provides responders with up to 20 recent incidents on other services that are potentially related to the incident they are investigating. This feature uses a completely online and real-time machine learning algorithm and service dependency data to provide an at-a-glance-view of the full scope of incident impact. Related Incidents enriches incidents with deep contextual insights to help responders coordinate an effective team response and mitigate business disruption. > **AIOps / Signal Intelligence Feature:** This feature is included with the [PagerDuty AIOps](/ai-automation/aiops/overview) add-on, or included as Signal Intelligence in PD Reliability Platform plans. To sign up for a trial of PagerDuty AIOps features, read [PagerDuty AIOps Trials](/ai-automation/aiops/overview#pagerduty-aiops-trials). > **AIOps Service Configuration:** Your service configuration must have AIOps enabled to use this feature. See [Configurable Service Settings](/incident-management/services/configurable-service-settings#manage-aiops) for more information and enablement steps. > **Legacy Availability:** This feature is also available with [Legacy Event Intelligence](/ai-automation/aiops/legacy-event-intelligence). ## View Related Incidents You can view the Related Incidents feature in multiple places: - [Web app](#web-app) - [Mobile app](#mobile-app) - [REST API](#rest-api) ### Web App 1. From the **Incidents** page or on a service’s detail page, select your desired incident’s **Title**. 2. On the incident’s detail page, select the **Related Incidents** tab.  The **Related Incidents** tab includes the following information: - **Related Incidents - `#`**: A total count of related incidents. - **Impact Summary**: A list of impacted responders, business services and technical services.  - **List of Related Incidents on a Timeline**: Related Incidents on the timeline include the following: - **Incident Details**: You may click on an incident’s title, number of alerts, **Assigned To** user or **Service** to view more details. - **Dependency Pane**: If incidents are related due to a Technical or Business Service dependency relationship, that dependency will be shown here. If there is no service dependency relationship for that incident, you can click **Add One** to define your service dependencies. Related Incidents with no dependencies are those that were correlated via machine learning. Read our section on [types of Related Incidents](#related-incident-types) to learn more. - **Information Icon**: View why the incident was suggested as related by clicking on the icon in the top right corner of the **Related Incidents** card. - **Thumbs Up/Thumbs Down**: Indicate whether you agree that an incident is or isn’t related to the one you are investigating, and give our machine learning model feedback. Feedback is real-time, completely processed online, and is applied to suggest future Related Incidents. You can click the numbers below the thumbs up/down to view who voted for each option. **Note**: the thumbs up/thumbs down component is only visible on incidents generated by the machine learning algorithm, and it takes about 5–10 human inputs to train our algorithm on a new behavior. 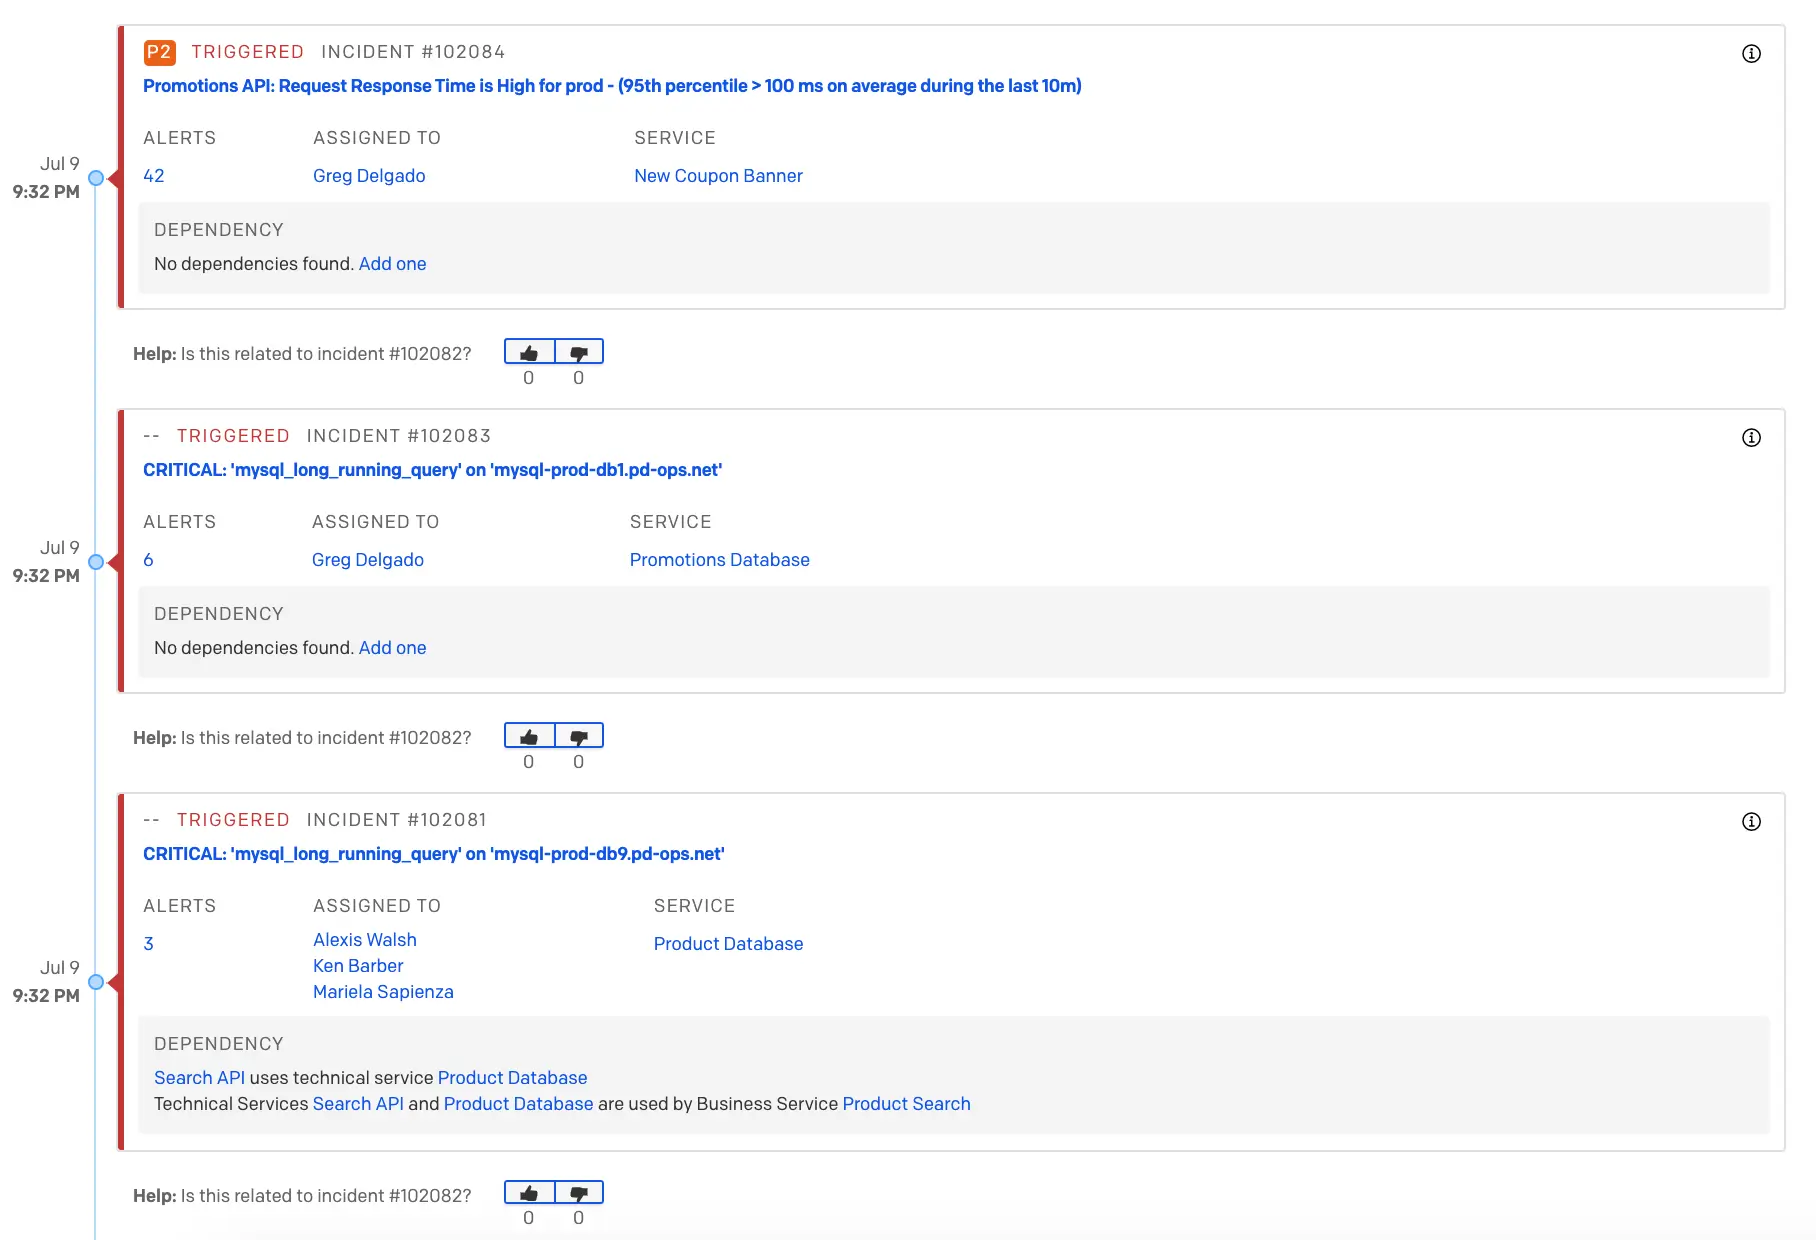 ### Mobile App 1. On the **Open Incidents** screen, select an incident to navigate to its details page. 2. Tap **Overview**, scroll down to the **Triage **section and tap **Related Incidents**.  *Related Incidents in the mobile app*  ### REST API To access Related Incidents via the REST API, please [visit our API documentation](/developer/api/reference/rest/incidents/get-related-incidents). ## Related Incident Types There are two types of Related Incidents: - [Machine-Learning-Based Related Incidents](#machine-learning-based-related-incidents) - [Dependency-Aware Related Incidents](#dependency-aware-related-incidents) ### Machine-Learning-Based Related Incidents Machine-Learning-Based Related Incidents are determined by three main factors: - How close in time the incidents were created. - How related the alert metadata is. - Human response behavior: Thumbs up/thumbs down and/or [merging incidents](/incident-management/incidents/edit-incidents#merge-incidents) across services. You can identify Machine-Learning-Based Related Incidents by clicking on the icon or by the presence of the thumbs up/thumbs down feedback mechanism. ### Dependency-Aware Related Incidents Some Related Incidents may be determined by your [technical or business service dependencies](/incident-management/services/service-profile#service-dependencies-tab). When two incidents are triggered within five minutes of each other and one service is directly dependent on the other, these incidents will be marked as related. Similarly, if incidents occur within this time frame and share a parent business service, they will also be marked as related. These service relationships will be identified in the **Dependency** pane on individual Related Incident cards. 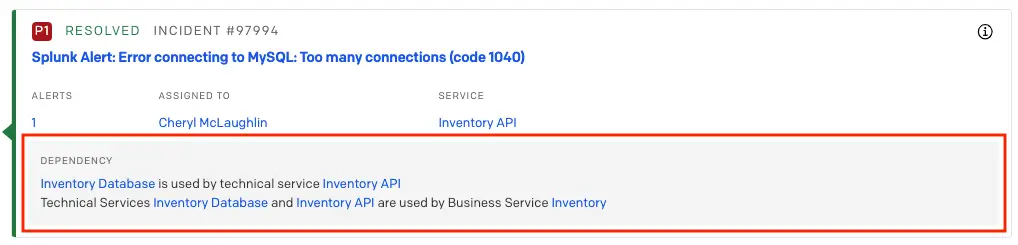 ## FAQ **Related Incidents vs. Past Incidents: What's the difference?** [Past Incidents](/ai-automation/aiops/past-incidents) is a tab that displays _resolved_ incidents from the past that were _on the same service_ that may be similar to a current, open incident. Related Incidents, on the other hand, uses machine learning to determine what other _active_ incidents (i.e., **triggered** or **acknowledged**), across _all_ services are related to a current incident. In other words, Past Incidents answers the question “Have similar incidents happened on this service in the past?” while Related Incidents answers “What is going on right now that I should be aware of?” **Why don't I see any related incidents?** Here are some common reasons: - **The incident seems unique**: The algorithm was unable to find another recent incident with metadata related to this one. If it identifies any while this incident is still open, they will appear in the **Related Incidents** tab. - **There isn’t enough data yet**: Your account doesn’t have enough data yet to start finding relationships among incidents. Continue to use PagerDuty normally and Related Incidents will begin to appear. **Why do my Related Incidents appear to have the same title?** The incident title is often determined by the title of initial alert that triggers an incident. It is likely that our machine learning algorithm determined that alerts created close in time and with the same title are related. **Why am I seeing resolved related incidents?** While Related Incidents is designed to surface ongoing incidents from other services, on occasion responders may see recently resolved incidents that provide additional context for the incident they’re currently working on. **Why don't I see Related Incidents from the same service?** This is by design. If you notice a high volume of related or duplicate incidents on a particular service, we recommend enabling [Intelligent Alert Grouping](/ai-automation/aiops/noise-reduction/alert-grouping/intelligent-alert-grouping) to reduce noise on that service and prevent duplicate incidents from being created. **How do I configure Related Incidents?** This feature does not require any setup to begin working with it. Through continued use and [user feedback](#how-do-i-improve-future-related-incidents-results), you can expect its results to become more relevant over time. Please keep in mind that you must have access to the [PagerDuty AIOps](/ai-automation/aiops/overview) add-on product to access this feature. **How do I improve future Related Incidents results?** Our machine learning algorithm can be influenced by user feedback. The machine learning algorithm looks at human response behavior including thumbs up/down feedback as well as [cross-service merges](/incident-management/incidents/edit-incidents#merge-incidents) in order to improve future Related Incidents. --- URL: https://docs.pagerduty.com/ai-automation/aiops/rulesets # Rulesets Route events and take action based on predefined event rules The Rulesets feature allows you to route events to an endpoint and create collections of event rules, which define sets of actions to take based on event content. Accounts with Free, Starter (legacy), Team (legacy), and Professional plans will have access to a single global ruleset, while Business, Enterprise for Incident Management and Digital Operations (Legacy) plans will now have the ability to create multiple, unlimited global rulesets. For these higher-tier plans, each ruleset will have an individual endpoint and they can be associated with specific Teams, giving Team Managers edit-access to their rules. Reference [Rulesets Advanced Configuration](/ai-automation/aiops/rulesets/rulesets-advanced-configuration) for more configuration options. > **End-of-Life:** Rulesets and Event Rules reached end-of-life on January 31, 2025 and are no longer visible in the PagerDuty web app. We highly recommend that you [migrate to Event Orchestration](/ai-automation/aiops/migrate-to-event-orchestration). Access and modifications to event rules are still possible via the [API](/developer/global-event-rules-api). ## Ruleset Types There are two ways to organize event rules in your account, based on your integration use case: - [Global Rulesets](#section-global-rulesets): When a new integration event stream has more than one service destination, you can use global event rules and a global Integration Key to ingest and route your events to the right service. If your existing service integrations have the same event stream integrated into multiple services, consider migrating those integrations to a global ruleset and use routing rules to direct events to the correct services. Global rulesets support event rules for email integrations, but do not support Custom Event Transformers. - [Service Event Rules](#section-service-event-rules): When integrations already exist on a Service, you can use Service Event Rules to evaluate your events instead of migrating them to a global event rule. Service event rules support Custom Event Transformers, but do not support event rules for email integrations. ### Global Rulesets Events sent to a global ruleset Integration Key or emails sent to a global email address will be evaluated by the destination global ruleset. In order to create alerts and incidents on a destination service, a global event rule must have **Create an incident on a service** selected as one of its actions. When an event is routed to a service that contains service event rules, then it will also be evaluated by service event rules at the time of event ingestion, after global event rules have been evaluated. All plans will have access to a Default Global Ruleset that is available out-of-the-box. Accounts on Business, Enterprise for Incident Management, and Digital Operations (Legacy) plans have the option to create multiple additional rulesets, and they can opt to assign these additional rulesets to [Teams](/account-admin/teams). To view your rulesets using the API: - Use the [List Rulesets](/developer/api/reference/rest/rulesets/list-rulesets) endpoint to list the details for all rulesets on your account, including a ruleset’s ID. - Use the [List Service Event Rules](/developer/api/reference/rest/services/list-service-event-rules) endpoint to see the rules for a specific ruleset. #### Create Multiple Rulesets and Assign Teams > **Required User Permissions:** - The Account Owner, Admins and Global Admins can create/edit/delete rulesets by default. Users with Team Manager roles can create/edit/delete rulesets for their assigned Team. > - Business, Enterprise for Incident Management and Digital Operations (Legacy) plans have the ability to create multiple, unlimited global rulesets, each of which can be assigned to a Team. **Note**: If you do not assign a new ruleset to a team, then it will behave as an additional global ruleset. > - Account Owners and Admins have view access to all rulesets. Users below Admin will only be able to view rulesets associated with Teams they are assigned to. Please refer to our [API documentation](/developer/api/reference/rest/rulesets/create-ruleset) for more information on how to create a new ruleset. If you wish to assign a Team, you can include the Team’s ID in the payload of your request. ### Service Event Rules Events that are sent to any [service](/incident-management/services/services-and-integrations#add-integrations-to-an-existing-service) Integration Key will be evaluated by the event rules present on that service at the time that an event is ingested. This behavior is different from global rulesets, which apply rules to all inbound events sent to a global integration key. Service event rules are available on all plans. #### Create Service Event Rules Please refer to our [API documentation](/developer/api/reference/rest/services/create-service-event-rule) for more information on how to create new event rules for a service. ## Create Event Rules Event rules allow you to set actions that should be taken on events that meet your designated rule criteria. You can choose whether you would like criteria-satisfying events to trigger incidents, or if you would like them to be suppressed and viewable in your [Alerts](/incident-management/incidents/alerts#view-alerts) table. Depending on your plan and account add-ons, you may have [additional actions](#section-event-rule-actions) to take on incidents or suppressed alerts. Event rules must be created in a global ruleset or on a service. Follow the instructions in the above sections to determine [where you are creating your event rules](#section-ruleset-types), and then proceed with the following steps. Both Global Event Rules and Service Event Rules are managed via API. Please refer to our API documentation to create a new [Global Event Ruleset](/developer/api/reference/rest/rulesets/create-ruleset) or [Service Event Rule](/developer/api/reference/rest/services/create-service-event-rule). > **Event Rule Limitations:** Each ruleset has a limitation of 25,000 event rules. Once the limit of 25,000 rules is met, users will not be able to add any further event rules to the ruleset. ### Recommended Preparation We recommend sending an alert to your PagerDuty account in order to inspect the alerts’ JSON key:value pairs and build rule conditions from there. Please [read our API documentation](/developer/api/reference/events-v2/send-event/create-v2-event) for more information on how to send a simple alert into PagerDuty. Example in CURL: ```curl curl --location --request POST 'https://events.pagerduty.com/v2/enqueue' \ --header 'Content-Type: application/json' \ --data-raw '{ "payload": { "summary": "Example alert on host2000.example.com", "timestamp": "2020-06-17T08:42:58.315+0000", "source": "monitoringtools:cloudvendor:central-region-dc-01:002000987:cluster/api-stats-prod-003", "severity": "info", "component": "postgres", "group": "prod-datapipe", "class": "deploy", "custom_details": { "ping time": "1600ms", "load avg": 0.90 } }, "dedup_key": "uniquededupkey", "routing_key": "R015DM1NF3UYE4NSWN8WBF6FS062ZZZZ", "images": [{ "src": "https://www.pagerduty.com/wp-content/uploads/2016/05/pagerduty-logo-green.png", "href": "https://example.com/", "alt": "Example text" }], "links": [{ "href": "https://example.com/", "text": "Link text" }], "event_action": "trigger", "client": "Sample Monitoring Service", "client_url": "https://monitoring.example.com" }' ``` ### Configure Conditions Depending on your preferences, indicate the **condition(s)** that should be met when this event rule searches inbound events. Below are some concepts to keep in mind when configuring conditions: #### Path References > **Case Sensitivity:** Field names are case-sensitive. **Events Sent Through the API**: You can use the JSON field names directly, i.e. `description`. For nested fields, separate names with a dot (.), i.e. `payload.summary`. If you are sending data through additional fields, enter them exactly as they are sent to PagerDuty. For example, if your events have a `tags` field, enter that field name in your rule condition as `tags`. **Events Sent Through Email** (**Note**: Only available in global rulesets, not with service event rules): Rules may be based on the content of an email by entering the appropriate email field as the event field. The most common email fields are: - `headers.from.0.address` (the from address) \*\* Note: `.0.address` refers to the 1st position in a list of emails. If you would like to generally search through a list of emails (either in the "to" field or the "from" field), please set to `headers.from` or `headers.to` - `headers.subject` (the subject line) - `body` (the email body) If your monitoring tool sends emails with **custom headers**, you can create rules based on those headers by including the prefix headers in front of the email header name when you enter that field name in your rule _condition_. #### Subcondition Operators Subcondition operators are used to determine how the chosen event field is filtered: - The field contains/does not contain a value. - The field equals/does not equal a value (this operation requires the field to be passed in as a string). - The field exists/does not exist. - The field matches/does not match a regular expression. Regular expressions must use [RE2 syntax](https://github.com/google/re2/wiki/Syntax). Note that unlike service-level event rules, global rules only support one (e.g. the first) capture group within the regex. > **Negative Operations:** Rules with negative operations, such as **does not contain** or **does not equal**, will match events that do not contain your specified value _and_ events that do not contain the field at all. As an example: > > - severity field does not equal `critical` > > This will match events where the severity field does not equal `critical` _and_ events that do not contain a severity field at all. > > If you'd like to avoid this, you must add an additional condition that matches only when the field exists. For example: > > When all conditions are true: > > - severity field exists > - severity field does not equal `critical` > > Note that you must configure the rule so that **all conditions must be true** for the rule to match. ### Configure Actions Determine which **actions** you would like this rule to take when an event meets the **condition(s)** you set. Please refer to our [API documentation](/developer/api/reference/rest/rulesets/create-ruleset) for more information on the available actions. ## Edit Rulesets and Event Rules ### Edit a Global Ruleset's Event Rules Please refer to our [API documentation](/developer/api/reference/rest/rulesets/update-ruleset-event-rule) for more information on editing event rules. ### Edit a Global Ruleset’s Details Please refer to our [API documentation](/developer/api/reference/rest/rulesets/update-ruleset) for more information on editing rulesets. ### Edit Service Event Rules Please refer to our [API documentation](/developer/api/reference/rest/services/update-service-event-rule) for more information on editing a service's event rules. ## Disable Event Rules If you would like to pause an event rule’s activity, you can disable and re-enable it at a later time. This feature allows you to manually initiate integration-specific disablement during maintenance or testing on a tool. Please refer to our [API documentation](/developer/api/reference/rest/rulesets/update-ruleset-event-rule) for more information on disabling event rules. ## Switch to Service Orchestrations Service Orchestrations provide updated functionality to Service Event Rules. If you would like to switch from Service Event Rules to Service Orchestrations, please read our [Event Orchestration](/ai-automation/aiops/event-orchestration#switch-to-service-orchestrations) documentation. --- URL: https://docs.pagerduty.com/ai-automation/aiops/rulesets/rulesets-advanced-configuration # Rulesets Advanced Configuration Configure Dynamic Field Enrichment & Extraction and deduplication keys to normalize event payloads and enrich alerts using Event Rules. > **End-of-Life:** Rulesets and Event Rules reached end-of-life on January 31, 2025 and are no longer visible in the PagerDuty web app. We highly recommend that you [migrate to Event Orchestration](/ai-automation/aiops/migrate-to-event-orchestration). Access and modifications to event rules are still possible via the [API](/developer/global-event-rules-api). ## Customize Event Fields (Optional) ### Dynamic Field Enrichment & Extraction Dynamic Field Enrichment & Extraction is a tool used to normalize event payloads using Event Rules. This capability allows you to copy important data from any combination of source event fields into any PagerDuty Common Event Format (CEF) field. Translate difficult machine terms and code into helpful context for responders so they can effectively respond to the problem. Dynamic Field Enrichment & Extraction can also be used to enhance PagerDuty AIOps capabilities by customizing alerts, influencing the Intelligent Alert Grouping and Intelligent Triage machine learning algorithms. > **Custom Event Fields vs. Custom Fields on Incidents:** This feature is intended to customize [event fields within Alerts](/incident-management/incidents/alerts), as opposed to creating custom fields in the incident UI. To create the latter, please read [Custom Fields on Incidents](/incident-management/incidents/custom-fields-on-incidents). > **Availability:** This feature is available with the [PagerDuty AIOps](/ai-automation/aiops/overview) add-on. Please [contact our Sales Team](https://www.pagerduty.com/contact-sales/) if you would like to purchase this product. Dynamic Field Enrichment & Extraction is composed of two functions: - **Create Custom Variables**: Capture snippets from a source event using regex matching for later use. - **Replace Common Event Format Fields**: Enrich and update and CEF field or even create new key values within the Custom Details object using custom variables. When events are sent to PagerDuty, they are transformed into Common Event Format. Previously, Event Rules could only replace Summary or add a Deduplication Key, and these abilities were limited to a direct mapping from one field as a full replacement. Now, this ability is extended to replace any CEF field or even create new key values within the Custom Details object. Dynamic Field Enrichment & Extraction is available with both Global Event Rules and Service Event Rules. For Service Event Rules, custom variables must extract from CEF fields of the event payload, where for Global Event Rules, custom variables can extract from any field of the event payload. Global and Service Event Rules are evaluated against the original event. Fields created from Global Event rules via Dynamic Field Enrichment & Extraction cannot be evaluated by Service Event Rules. ### Configure Dynamic Field Enrichment & Extraction When using the API to create [service event rules](/developer/api/reference/rest/services/create-service-event-rule) or event rules in a [ruleset](/developer/api/reference/rest/rulesets/create-ruleset-event-rule), you can use the `extractions` object in your request payload to define the `source`, `value`, and `regex`. 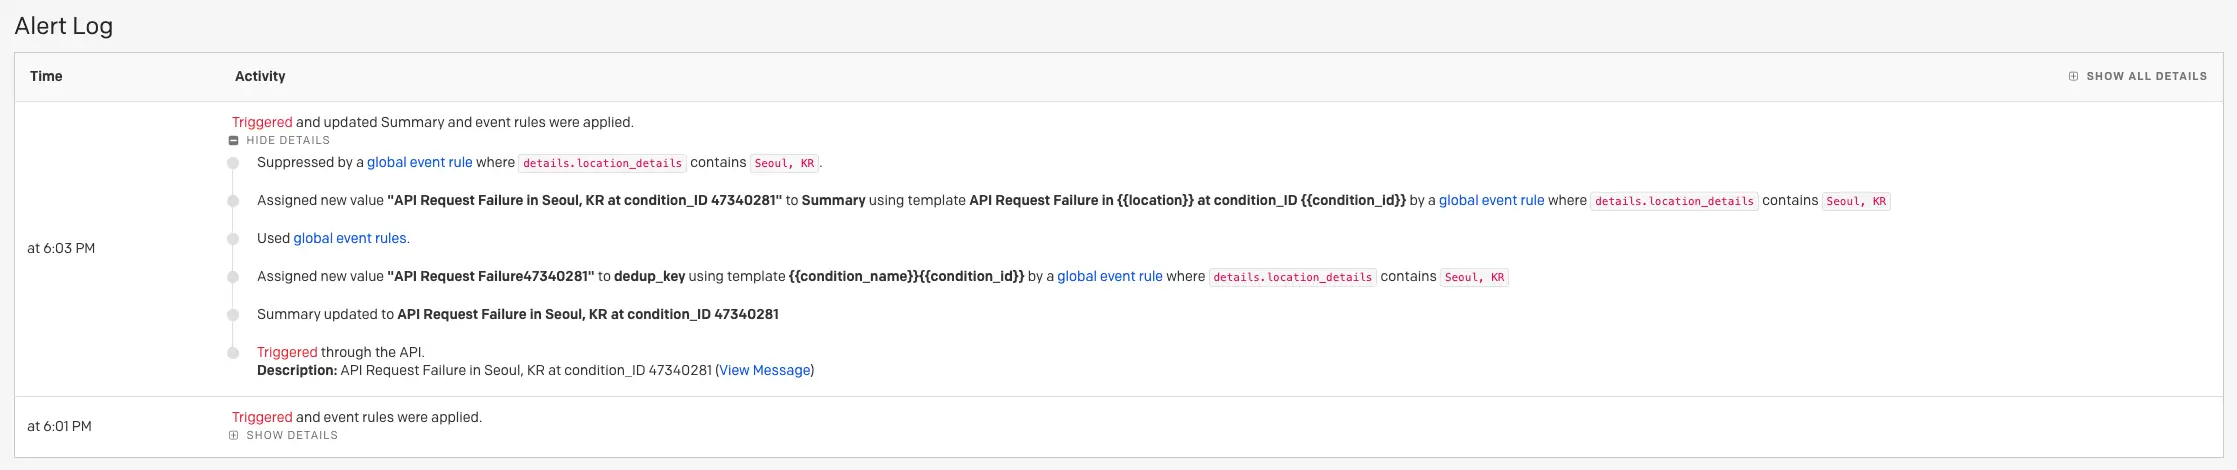 ### Set a Deduplication Key with Event Rules The `dedup_key` field is used to merge events into a single alert. Events with the same `dedup_key` can update the status of the alert they are automatically merged into. Below is an example of a ruleset configured to set a deduplication key using the `details.error_summary` field: ``` { "ruleset": { "id": "14e56445-ebab-4dd0-ba9d-fc28a41b7e7b", "position": 0, "disabled": false, "catch_all": false, "self": "https://api.pagerduty.com/rulesets/0e84de00-9511-4380-9f4f-a7b568bb49a0/rules/14e56445-ebab-4dd0-ba9d-fc28a41b7e7b", "conditions": { "operator": "and", "subconditions": [ { "operator": "contains", "parameters": { "value": "mysql", "path": "details.host" } } ] }, "time_frame": { "active_between": { "start_time": 1577880000000, "end_time": 1580558400000 } }, "actions": { "annotate": { "value": "This incident was created by a Global Event Rule" }, "route": { "value": "PI2KBWI" }, "priority": { "value": "PCMUB6F" }, "severity": { "value": "warning" }, "extractions": [ { "target": "dedup_key", "source": "details.error_summary", "regex": "Host (.*) is experiencing errors" } ] } } } ``` ## Add or Replace the Summary Field with Event Rules The `summary` field is used to create the incident title. Titles should be descriptive and tell responders what is happening. Below is an example of a rule using a custom variable to replace the default summary value with a custom `error_title` field value: ``` { "rule": { "actions": { "annotate": null, "automation_actions": [], "event_action": null, "extractions": [ { "regex": null, "source": null, "target": "summary", "template": "{{newSummary}}" } ], "priority": null, "route": { "value": "P9XD19J" }, "severity": null, "suppress": null, "suspend": null }, "catch_all": false, "conditions": { "operator": "and", "subconditions": [ { "operator": "contains", "parameters": { "path": "payload.source", "value": "webAPI" } } ] }, "disabled": false, "id": "a1582b38-e753-486a-bc5c-bb7c6895e00c", "position": 0, "self": "https://api.pagerduty.com/rulesets/1d9089cd-fc3a-406e-9ddc-625bbeb43601/rules/a1582b38-e753-486a-bc5c-bb7c6895e00c", "time_frame": null, "variables": [ { "name": "newSummary", "parameters": { "path": "payload.custom_details.error_title", "value": "(.*)" }, "type": "regex" } ] } } ``` ## Using Dynamic Field Enrichment & Extraction for Email Events Dynamic Field Enrichment & Extraction capabilities are available only for email events sent to Global Event Rules. Users can extract from the email event using regex matching into multiple variables. Currently, only Summary and Dedup_Key Common Event Fields can be replaced for email events. Service Event Rules do not apply to emails because they aren’t CEF and therefore, dynamic field enrichment & extraction capabilities are not available for email service integrations. ## Enhancing Alert Grouping Capabilities Dynamic Field Enrichment & Extraction can be powerfully leveraged for improving the accuracy for [Intelligent Alert Grouping](/ai-automation/aiops/noise-reduction/alert-grouping/intelligent-alert-grouping) and [Content Based Alert Grouping](/ai-automation/aiops/noise-reduction/alert-grouping/content-based-alert-grouping). This capability can add and replace key information from the raw event payload to create more contextualized alerts, allowing for more flexible and accurate alert grouping options. ## Paused Incident Notifications As a feature of [Rulesets](/ai-automation/aiops/rulesets), paused incident notifications allows rules to be set to create alerts, but pause incident creation and notifications for a predefined amount of time. During the pause period, new alerts will be viewable in the [Alerts table](/incident-management/incidents/alerts/alerts-table) with a **Suspended** status. These suspended alerts have new actions, allowing users to **Trigger** an incident from the alert during the pause period, or **Resolve** the alert, preventing the incident and its notifications from being created altogether. > **Availability:** - The Paused Incident Notifications functionality is part of our [PagerDuty AIOps](/ai-automation/aiops/overview) product, which is purchased separately from the core PagerDuty platform. Please [contact our Sales Team](https://www.pagerduty.com/contact-sales/) if you would like to purchase this product. > - Paused Incident Notifications is only available on incidents generated by our [Events API](/developer/events-api-v2-overview), and does not work with those generated from our [REST API](/developer/rest-api-overview). To configure paused incident notifications, please refer to our [API documentation](/developer/api/reference/rest/rulesets/create-ruleset) for more information. ### View and Take Action on Paused Alerts To view alerts in a paused state, navigate to the **Alerts** table in the upper menu of the web app. Alerts with paused incident notifications will have a **Suspended** status: 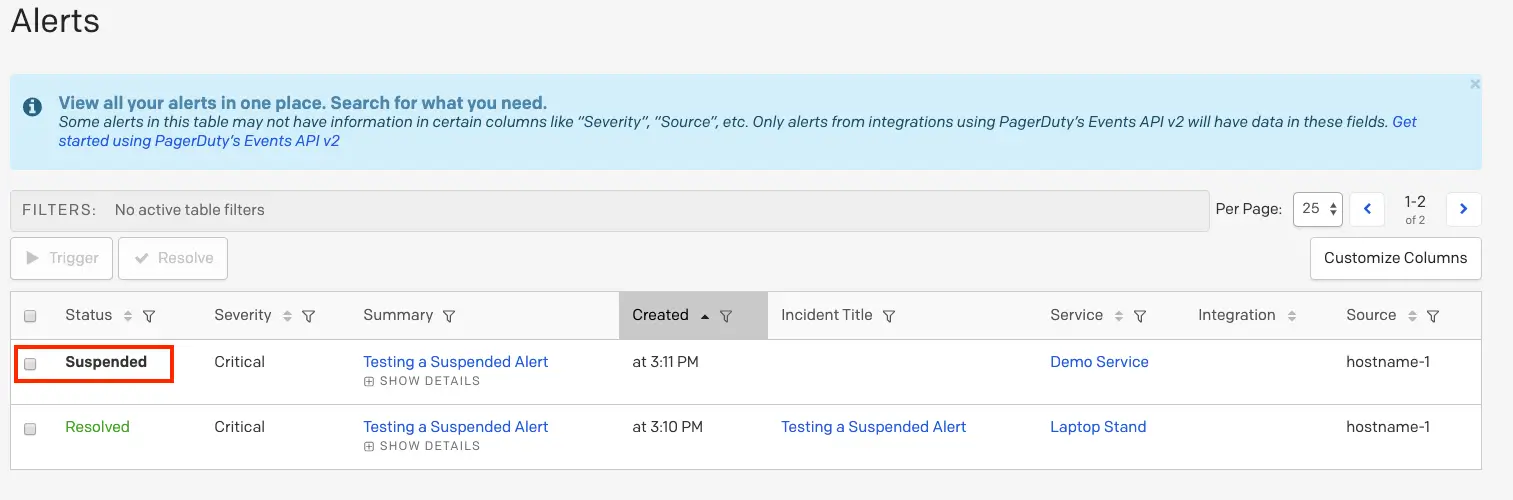 To take action on a paused alert: 1. Click the incident **title** to view its details page. 2. On the right hand side, click **Trigger** to trigger an incident and send notifications, or **Resolve** if you would like to resolve the alert without triggering an incident/notifications. You will see a green dialog that confirms that the alert has been triggered or resolved. 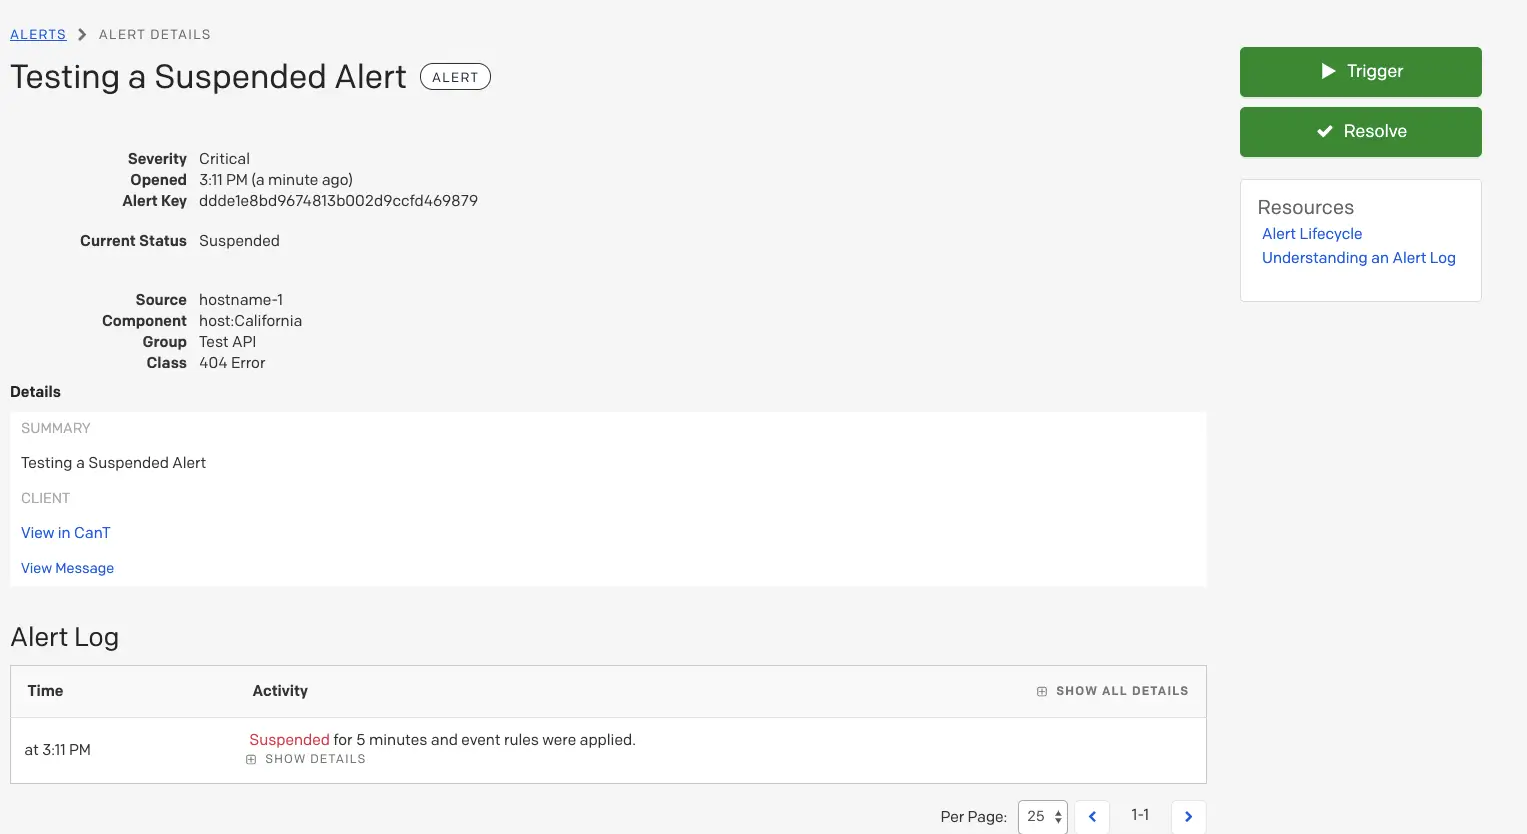 The pause period and action taken will also appear in the Alert Log timeline, accessible by clicking an alert's **title** to view the detail page: 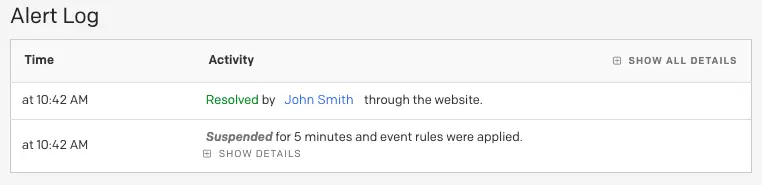 ## Suppress, but Create Triggering Thresholds with Event Rules Receive PagerDuty notifications only when your customized alert conditions breach your specified limits. In this way, responders effectively reduce alert noise without missing critical issues. > **Availability:** The Threshold Alerts functionality is part of our [PagerDuty AIOps](/ai-automation/aiops/overview) product, which is purchased separately from the core PagerDuty platform. Please [contact our Sales Team](https://www.pagerduty.com/contact-sales/) if you would like to purchase this product. To configure triggering thresholds for suppressed incidents, please refer to our [API documentation](/developer/api/reference/rest/rulesets/create-ruleset) for more information. ## Set Severity with Event Rules For events that do not have a [severity level](/developer/api/pd-cef#pd-cef-fields) (such as emails), users can define one, or a new severity level can be set. All [current pricing plans](https://www.pagerduty.com/pricing/) include incident severity. To set severity, please refer to our [API documentation](/developer/api/reference/rest/rulesets/create-ruleset) for more information. ## Set Incident Urgency with Event Rules through Dynamic Notifications Severity can be used for [Dynamic Notifications](/incident-management/incidents/dynamic-notifications), which are defined by the service settings. To use Dynamic Notifications, the events must be routed to a service that sets Dynamic Notifications based on severity levels. With severity controlled via event rules and the service configured to use dynamic notification, you can [control the incident urgency](/incident-management/incidents/dynamic-notifications#eventalert-severity-levels). ## Set Priority with Event Rules [Incident priority](/incident-management/incidents/incident-priority) allows the classification of incidents based on a level of prioritization. Incident priority must be [enabled on your account](/incident-management/incidents/incident-priority#configure-incident-priority) before it can be set with event rules. To set priority, please refer to our [API documentation](/developer/api/reference/rest/rulesets/create-ruleset) for more information. ## Add a Note to an Incident with Event Rules [Notes](/incident-management/incidents/edit-incidents#add-a-note-to-an-incident) can be used to help responders resolve incidents quicker by including information or links related to the system that the event comes from. > **Notes:** - Adding notes via event rules is available with our [PagerDuty AIOps](/ai-automation/aiops/overview) product, which is purchased separately from the core PagerDuty platform. Please [contact our Sales Team](https://www.pagerduty.com/contact-sales/) if you would like to purchase this product. > - The note is added when an incident is created. If a new alert is [deduplicated](/incident-management/incidents/event-management#deduplicate-alerts) into the incident, then the deduplicated alert will not add an additional note nor change the original. To add a note with event rules, please refer to our [API documentation](/developer/api/reference/rest/rulesets/create-ruleset) for more information. ## Set a Custom Trigger / Resolve Action with Event Rules If you would like to automatically trigger an alert or resolve an alert based on your event rule conditions, under **Enrichment & Transformations**, please refer to our [API documentation](/developer/api/reference/rest/rulesets/create-ruleset) for more information on configuring this action. All pricing plans include incident custom trigger/resolve actions with event rules. ## Automated Triggers Automated Triggers allow response teams to easily define a dynamic webhook using event rules, sending a custom payload to a specified endpoint. This enables responders to automate actions like restarting a server, clearing logs, and reverting bad deploys. The payload can be set using a combination of several predefined variables, created using [Dynamic Field Enrichment and Extraction](#dynamic-field-enrichment-extraction). Automated Triggers can be created using both global event rules and service level event rules. > **Availability:** Automated Triggers are a feature of our [PagerDuty AIOps](/ai-automation/aiops/overview) product, which is purchased separately from the core PagerDuty platform. Please [contact our Sales Team](https://www.pagerduty.com/contact-sales/) if you would like to purchase this product. ## Configure Automated Triggers To configure automated triggers, please refer to our [API documentation](/developer/api/reference/rest/rulesets/create-ruleset) for more information. ### Use Automated Triggers Once the rule is created, a custom push-button action will be available the next time the rule is applied. Users can find the Automated Triggers action in the **More...** dropdown on the incident details page, and activity related to the custom rule action will be visible in the incident timeline. There is a limit of one Automated Trigger per rule. If Intelligent Alert Grouping is enabled on a Service, each additional alert grouped to the incident can add an additional unique action button, up to a limit of 5 buttons. 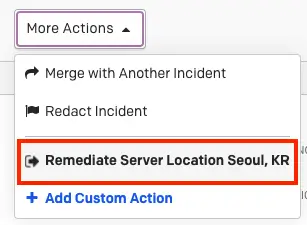 A modal will appear when the Automated Triggers action is clicked, and users can confirm the details of the webhook payload (fields were set in the rule configuration phase). For all webhooks, the PagerDuty incident ID will be included as a mandatory field. If the action is triggered, a response log will be shown in the incident timeline to let users know if the webhook was successfully received. 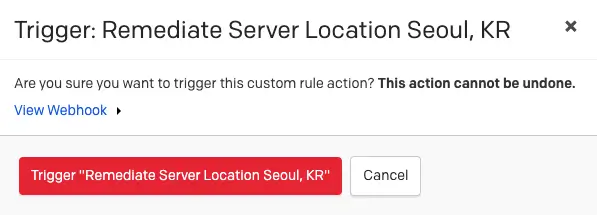 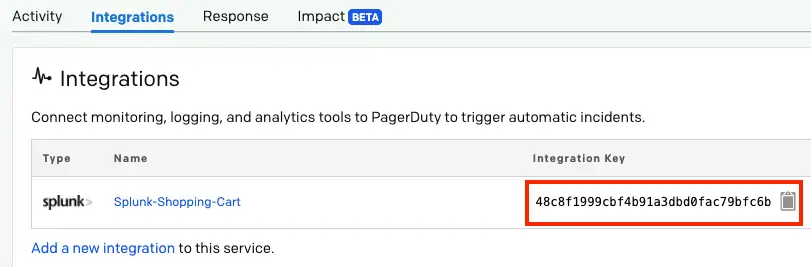 ## Configure Time Frame While configuring a rule via the API, you can optionally define a specific time frame or schedule for when you would like this rule to be active using the `time_frame` object. If you omit `time_frame` from your request, this rule will always run (24/7/365) when your conditions are met. ### Scheduled Event Rules You can gain a greater degree of control over your event rules by detailing a single specific time in the future in which they will be active. This can be useful for testing rules and for planned maintenance. Users can then specify what actions are to be performed within this specific time window. For instance, if you schedule a rule to be active during a single hour window, and the action set was to suppress alerts, alerts would be suppressed during that hour, and once it ended they would begin generating incidents again. > **Availability:** Scheduled Rules functionality is available with our Business, Enterprise for Incident Management and Digital Operations (Legacy) plans, or as part of our [PagerDuty AIOps](/ai-automation/aiops/overview) product, which is purchased separately from the core PagerDuty platform. Please [contact our Sales Team](https://www.pagerduty.com/contact-sales/) if you would like to purchase this product. ### Recurring Event Rules If there are specific hours of the day or day(s) within a week when you would like an event to follow a particular rule, you can set its activity on an automatic, weekly recurring schedule. This feature is specific to each individual event rule and you can make additional changes, such as changing severity/priority, based on time of day. > **Availability:** The Recurring Event Rules functionality is available with our Business, Enterprise for Incident Management and Digital Operations (Legacy) plans, or as part of our [PagerDuty AIOps](/ai-automation/aiops/overview) product, which is purchased separately from the core PagerDuty platform. Please [contact our Sales Team](https://www.pagerduty.com/contact-sales/) if you would like to purchase this product. ## Send Test Events > **Unsupported Integration Types:** The following types of integrations cannot use ruleset integration keys: > > - Integrations that connect via account authorization are not supported. > - Custom Event Transformer integrations are not supported. > - Integrations that use the REST API are not supported. ### Send Events to a Global Ruleset Each global ruleset will have a routing **integration key**, as well as an **HTTP endpoint for API** and **email address** that you can use for routing. The HTTP endpoint used for rulesets is `https://events.pagerduty.com/v2/enqueue`. You can view a ruleset's routing key by making a request to the [Get a Ruleset](/developer/api/reference/rest/rulesets/get-ruleset) endpoint. A ruleset's email address will follow the formula `routing_key@your_subdomain.pagerduty.com`. Use this information to send events based on your preferred integration method: - Use the **Integration Key** to [integrate with your preferred tool](/integrations). - Use the **Integration Key** to send an event through one of the Events APIs. - If using the [V2 events API](/developer/events-api-v2-overview), use your routing Integration Key as your `routing_key` value in your event JSON. - If using the [V1 events API](/developer/events-api-v1-overview), use your routing Integration Key as your `service_key` value in your event JSON. - Use the **Email address** to [send email events](https://www.pagerduty.com/docs/guides/email-integration-guide/). > **Case Sensitivity:** Integration keys are case-sensitive. This will allow you to test how your event rules will modify them and take the actions configured in previous steps. Your event rule is now complete! If you would like to create more event rules, repeat steps 1-4 as needed. ## Send Events to Service Event Rules Add your preferred [tool integration](/incident-management/services/services-and-integrations#add-integrations-to-an-existing-service) or a [Custom Event Transformer](/developer/custom-event-transformer) integration on the service where you configured the above rule(s). Once you have added the integration to your service, you will be directed to the **Integrations** tab, where you can access its **Integration Key**: 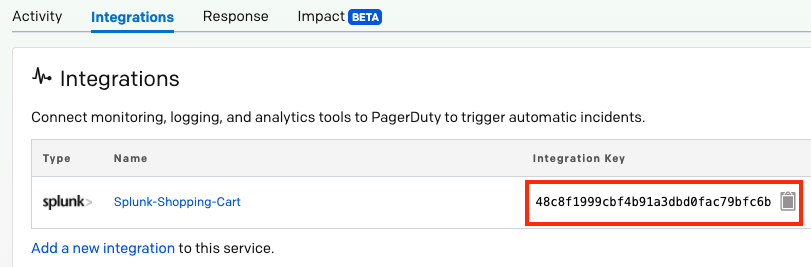 Use this Integration Key to complete your integration and send test events to your service. This will allow you to test how your event rules will modify them and take the actions configured in previous steps. Your event rule is now complete! If you would like to create more event rules, repeat steps 1-4 as needed. --- URL: https://docs.pagerduty.com/ai-automation/aiops/rulesets/rulesets-faq # Rulesets FAQ Answers common questions about how global and service event rules process, transform, suppress, and deduplicate incoming events. > **End-of-Life:** Rulesets and Event Rules reached end-of-life on January 31, 2025 and are no longer visible in the PagerDuty web app. We highly recommend that you [migrate to Event Orchestration](/ai-automation/aiops/migrate-to-event-orchestration). Access and modifications to event rules are still possible via the [API](/developer/global-event-rules-api). ## FAQ **Are email integration filters and rules, or custom event transformers supported?** This depends on where you create event rules: - **Global rulesets**: Email filters and rules **are supported**. Custom event transformers **are not supported**; however, global event rules autodetect and transform events sent to a global endpoint. - **Service event rules**: Only basic **email filters are supported**, while email rules **are not supported**. Custom event transformers **are supported**. **Are events transformed into our Common Event Format (CEF)?** - Events that are routed transform into [CEF](/developer/api/pd-cef). - **Global rulesets**: Custom event transforms (CETs) **are not supported**. - **Service event rules**: Custom event transforms (CETs) **are supported**. **What happens to events that do not match any rules?** - **Global rulesets**: Any events sent through event rules that do not match any rules are suppressed, and you can find them [in the alerts table](/incident-management/incidents/alerts/alerts-table). You can change this default behavior by editing the catch-all rule at the bottom of your rules list. - **Service event rules**: Any events sent through service event rules that do not match any rules turn into incidents and are not suppressed. **Is there a way to bulk add, delete, or edit global event rules?** Yes. You can leverage the [Rulesets API](/developer/api/reference/rest/rulesets/create-ruleset) to allow this functionality. **Once an event routes to a service from global event rules, are the event rules set up on the service respected?** Yes. Service event rules work in conjunction with your global event rules this way. **Can I send a second event with the same dedup_key and have it follow different actions?** If a second event with the same incident key passes and deduplicates into the open incident via global, team, or service event rules, the system does not follow the actions (such as raising priority or adding a note) **except** when severity is raised. **What happens if I do not create a deduplication key for an email sent to a ruleset?** As emails process, the email subject serves as a default deduplication key. In other words, emails with the same subject line automatically deduplicate. To change this behavior, add a custom deduplication key with an event rule action. **Is there a difference between the types of events processed by global event rules vs. service event rules?** Yes, global event rules are written against raw and untransformed events, whereas service event rules are written against [transformed/PD-CEF](/developer/api/pd-cef) events. **Why was my event not suppressed by a rule?** If there is an existing unresolved alert with the same dedup key as the incoming event, this event deduplicates into that alert and the "suppress" action in the event rules is ignored. --- URL: https://docs.pagerduty.com/ai-automation/aiops/rulesets/rulesets-troubleshooting # Rulesets Troubleshooting Diagnose why event rules aren't triggering, from misconfigured integration keys to incorrect field names and rule ordering. > **End-of-Life:** Rulesets and Event Rules reached end-of-life on January 31, 2025 and are no longer visible in the PagerDuty web app. We highly recommend that you [migrate to Event Orchestration](/ai-automation/aiops/migrate-to-event-orchestration). Access and modifications to event rules are still possible via the [API](/developer/global-event-rules-api). ## None of Your Rules Are Working This may be because you have not set up the integration key correctly in your monitoring tool. For event rules to work, you must use the integration key for the event rules you have configured. **Service Event Rules **: You will find your integration key in the PagerDuty web app by navigating to **Services** → **Service Directory** → click the **name** of the service that has your desired event rule configured → select the **Integrations** tab. You will see your **integration key** to the right of the integration’s name. **Global Rulesets**: You can view a ruleset's routing key by making a request to the [Get a Ruleset](/developer/api/reference/rest/rulesets/get-ruleset) endpoint. If you are sending events through the Events API, use this integration key in the `service_key` field ([Events API V1](/developer/events-api-v1-overview)) or the `routing_key` field ([Events API V2](/developer/events-api-v2-overview)). ## One of Your Rules Is Not Working This may be because you have not entered the field name correctly in the rule conditions. The field name is based on the data that is sent to PagerDuty, and _is not necessarily the same as the field name visible in the alert or incident in PagerDuty_. Refer to the data in your monitoring tool or integration for the correct field name. For nested fields, format the field name with periods separating each level. For example, `field_group.sub_field.another_sub_field`. If you have confirmed your field names are set up correctly, you may have a rule that is too broad that is ordered before the rule that is not working. Re-order your rules so that more specific rules are listed first. You may also want to check for rules with negative conditions ("does not contain" or "does not equal"), as these rules can match many events that do not contain the specified field. For nested fields, format the field name with periods separating each level of the object path. For example, `field_group.sub_field.another_sub_field`. --- URL: https://docs.pagerduty.com/ai-automation/automation/automation-actions # PagerDuty Automation Actions Run diagnostic or remediation actions at the push of a button PagerDuty Automation Actions invoke jobs that are staged in Runbook Automation (SaaS or Self-Hosted). An Automation Action can also invoke a script run by an installed Runbook Automation Self-Hosted Runner. By associating Automation Actions with a PagerDuty service, responders get push-button access to a library of defined diagnostic or remediation actions, resulting in shorter resolution times and fewer disruptive escalations. Automation Actions can also be used as part of an [Event Orchestration](/ai-automation/aiops/event-orchestration#automation) to enrich incident data with diagnostics information or perform remediation actions on incidents automatically. > **Automated Diagnostics:** Check out our [Automated Diagnostics](https://docs.rundeck.com/docs/learning/solutions/automated-diagnostics/solution-overview.html) solution, which offers a prebuilt library of automation jobs that were specifically designed to be invoked using Automation Actions from within PagerDuty. > **Availability:** Automation Actions are available for accounts with Runbook Automation (SaaS or Self-Hosted). > > If you are not yet a Runbook Automation customer, you can [sign up for a trial](https://www.pagerduty.com/sign-up/runbook-automation/). ## Configure Automation Actions > **Runner Configuration:** A Runner is the piece of software that invokes of an Automation Action. There are two types of Runners: [Runbook Automation Self-Hosted](#create-a-runbook-automation-self-hosted-runner) and [Runbook Automation](#create-a-runbook-automation-runner). > > You must download, install, and configure a software package when using a Runbook Automation Self-Hosted Runner. This type of Runner is best paired with PagerDuty Runbook Automation Self-Hosted, but it can also be used to invoke a local script or a job in Rundeck OSS (version 4.0 and greater). > > When configuring a Runbook Automation Runner, an API token for a valid Runbook Automation account is required to complete the setup wizard and create a link between your PagerDuty Incident Response and Runbook Automation accounts. > **Required User Permissions:** A **PD Automation Actions** user license is required for this feature. Please read [Flexible Licensing](/account-admin/billing#flexible-licensing) for more information about assigning users a specific license type. > > Users with the following roles can **create, edit and delete** Automation Actions and Runners: > > - Account Owner > - Admin/Global Admin > > Users with the following roles can **create, edit and delete** Automation Actions and Runners associated with their [Teams](/account-admin/teams): > > - Manager Team roles > > Users with the following roles can **run** Automation Actions on incidents: > > - Account Owner > - Admin/Global Admin > - Manager base roles > - Responder > > Users with the following roles can **view** all Automation Actions and Runners: > > - Account Owner > - Admin/Global Admin > - Manager > - Responder > - Observer There are two ways to create a Runner with PagerDuty: - [Create A Runbook Automation Self-Hosted Runner](#create-a-runbook-automation-self-hosted-runner) for our self-hosted automation platform. - [Create A Runbook Automation Runner](#create-a-runbook-automation-runner) for our SaaS-based workflow automation. ### Create A Runbook Automation Self-Hosted Runner #### Create a PagerDuty API Key In the PagerDuty web app: 1. Navigate to **Integrations** → **API Access Keys** and click **Create New API Key**. 2. Enter a **Description** that will help you identify the key later on. If you would like it to be read-only, check the **Read-only** option. 3. Click **Create Key**. 4. This will generate a unique key for the [REST API](/developer/api-changelog). Copy it to a safe place, as you will not have access to copy this key again. Once it has been copied, click **Close**. 1. **Note**: If you lose a key, you will need to delete it and create a new one. #### Create a PagerDuty Runbook Automation Self-Hosted Token In PagerDuty Runbook Automation Self-Hosted: 5. Go to **User Icon** → **Profile**. 6. To the right of **User API Tokens**, click . 7. Enter a **name** for the API token and click **Generate New Token**. 8. Copy the User API Token and keep it in a safe place for later use. #### Create a PagerDuty Runbook Automation Self-Hosted Project 9. Create a [Runbook Automation Self-Hosted Project](https://docs.rundeck.com/docs/manual/projects/project-create.html#project-create) that will contain the Job you’d like PagerDuty responders to be able to execute. #### Create a PagerDuty Runbook Automation Self-Hosted Job 10. Create a [Runbook Automation Self-Hosted Job](https://docs.rundeck.com/docs/manual/creating-jobs.html) in the Project. After the job is created, copy its ID and keep it in a safe place for later use. #### Create a Runbook Automation Self-Hosted Runner Next, you will add a new runner to generate an ID and secret. 11. In the PagerDuty web app, navigate to **Automation** → **Automation Actions** → **Runners** tab → **Add Runner**. 12. Select the **Process Automation** runner type, and click **Continue**. 13. Enter a **Runner Name** and **Runner Description**. 14. _Optional_: If you'd like to limit who has access to the runner, select one or more [Teams](/account-admin/teams) from the **Teams** dropdown. 15. On the following screen, click **Download ID and Secret** to download the file `credentials.pdrunner-creds`, and click **Create Runner**. 16. Open `credentials.pdrunner-creds` in your preferred text editor, replace `
`"Host 'acme-andromeda-sv1-c40 :: 179.21.24.50' is DOWN"` | | **Severity** | Indicates the severity of the impact to the affected system. | Enum | Required | `{Info, Warning, Error, Critical}` | | **Source** | Specific human-readable unique identifier, such as a hostname, for the system having the problem. | String | Required | `"prod05.theseus.acme-widgets.com"`
`"171.26.23.22"`
`"aws:elasticache:us-east-1:852511987:cluster/api-stats-prod-003"`
`"9c09acd49a25"` | | **Timestamp** | When the upstream system detected / created the event. This is useful if a system batches or holds events before sending them to PagerDuty. | Timestamp | Optional - Will be auto-generated by PagerDuty if not provided. | `2015-07-17T08:42:58.315+0000` | | **Component** | The part or component of the affected system that is broken. | String | Optional | `"keepalive"`
`"webping"`
`"mysql"`
`"wqueue"`
`"LOAD_AVERAGE"` | | **Group** | A cluster or grouping of sources. For example, sources “prod-datapipe-02” and “prod-datapipe-03” might both be part of “prod-datapipe” | String | Optional | `["production-app-stack"]`
`"prod-datapipe"`
`"www"`
`"web_stack"` | | **Class** | The class/type of the event. | String | Optional | `"High CPU"`
`"Latency"`
`"500 Error"` | | **Custom Details** | Free-form details from the event. | Object | Optional | `{"ping time": "1500ms", "load avg": 0.75 }` | ### PD-CEF Fields on an Alert Below is an example of what PD-CEF information on an alert might look like in the web app:  *PD-CEF Fields on an Alert* ### PD-CEF in the Alerts Table The [alerts table](/incident-management/incidents/alerts#section-alerts-table) highlights PD-CEF fields in your alerts: **Severity**, **Summary**, **Source**, **Class**, **Component**, and **Group**. To customize the fields shown on the Alerts table, navigate to **Incidents** → **Alerts** and click **Customize Columns** on the right side. ## Events API v2 The Events API v2 offers a streamlined way to use PD-CEF fields in your alerts. Monitoring partners can now directly send events in the PD-CEF format, giving you the benefit of the format without the need to manually convert your events. Custom monitoring can also use this format to take advantage of the PD-CEF display and workflow features in PagerDuty. Review our [developer documentation](/developer/events-api-v2-overview) for more information about the Events API v2 and how to use it. ### Example PD-CEF Payload The following example shows PD-CEF fields inside an Events API v2 [trigger event's payload](/developer/send-alert-event#example-request-payloads): ```json { "payload": { "summary": "Example alert on host1.example.com", "timestamp": "2015-07-17T08:42:58.315+0000", "source": "monitoringtool:cloudvendor:central-region-dc-01:852559987:cluster/api-stats-prod-003", "severity": "info", "component": "postgres", "group": "prod-datapipe", "class": "deploy", "custom_details": { "ping time": "1500ms", "load avg": 0.75 } } ... } ``` ## Developer Agreement Your access to and use of the PagerDuty Developer Services is governed by the [PagerDuty Developer Agreement](/developer/pagerduty-developer-agreement). --- URL: https://docs.pagerduty.com/developer/app-overview # App Overview Explains what a PagerDuty app is, who can build one, and the difference between apps for private use versus public distribution. > **Note:** This section is intended for developers building an app with PagerDuty. For information on how to add or remove an existing app on your PagerDuty account, visit our [Knowledge Base](/integrations/apps) ## What is an app? An app allows customers to set up other web-enabled businesses to work with PagerDuty or to make PagerDuty more useful. Apps can send data to PagerDuty, receive data from PagerDuty, or both. ## Who builds apps? Apps are built by PagerDuty, our partners, our customers, system integrators, and the open source community! Any PagerDuty customer or developer with a [PagerDuty developer account](/developer/developer-account-faq) has access to PagerDuty app development tools. ## Can my app be used by other PagerDuty accounts? Yes, apps can be created for either _private use_ (on your account only) or _public use_ which can be installed and used by other PagerDuty customers. See [Private Apps](/developer/private-apps) and [Publish an App](/developer/publish-an-app). ## Getting Started 1. Not a PagerDuty customer? [Sign up for a developer account to get access to PagerDuty](/developer/signup). 1. [Register your app and add functionality to it](/developer/register-an-app) 1. [Publish an app (completely optional)](/developer/publish-an-app) ## App Functionality There are two kinds of app functionality: Events Integration, or OAuth. An app can have either, or both. ### Events Integration [Events Integration](/developer/events-integration-functionality) sends machine events **from** your tool **to** PagerDuty via the [v2 Events API](/developer/events-api-v2-overview). This is the best way for a monitoring tool to connect with PagerDuty, and it can trigger, acknowledge, and resolve incidents. The Events API is asynchronous and designed for high volume. Events flow through PagerDuty's [Event Intelligence](https://www.pagerduty.com/platform/event-intelligence-and-automation/) features, which group, deduplicate, and triage them to reduce noise and speed up response. It can also send [Change Events](/developer/send-change-event) — informational signals about recent changes such as code deploys and system config changes, which are displayed in PagerDuty rather than triggering an incident. Two optional pieces come with it: * The [Simple Install Flow](/developer/events-integration-functionality#simple-install-flow-optional-but-recommended) lets your users connect to PagerDuty from inside your tool, instead of copying and pasting integration keys. See the demo [here](https://acme.pagerduty.dev). * An [Event Transformer](/developer/events-integration-functionality#add-an-event-transformer) converts a payload PagerDuty does not understand natively into the Events API v2 format. ### OAuth Integration [OAuth](/developer/oauth-functionality) connects your app to the [REST API](/developer/api/reference), which manages PagerDuty resources — users, teams, services, schedules, escalation policies, and so on. This is what you want for an app that administers PagerDuty or reads data out of it, such as a chat tool integration. The REST API can also trigger and manage incidents, through the [/incidents endpoint](/developer/api/reference/rest/incidents/create-incident). Use it when you specifically intend to create one incident — typically in response to a human action such as opening a ticket, clicking a button, or typing a chat command. It is synchronous, so you get a reference to the incident back, and it has an [operation-specific rate limit](/developer/rest-api-rate-limits#operation-specific-limits) of 300 req/min. For machine events at volume, use Events Integration instead. There are two kinds of OAuth functionality: * [Classic User OAuth](/developer/oauth-functionality#classic-user-oauth) acts as a PagerDuty user via an authorization code grant, with a blanket `read` or `write` scope. A user on any account can authorize it as soon as it is registered, without publishing. * [Scoped OAuth](/developer/oauth-functionality#scoped-oauth) scopes access per resource type, and supports both the authorization code and client credentials grants, to act as a user or as the app itself, respectively. It works on the account that created the app as soon as it is registered; once [published](/developer/publish-an-app#scoped-oauth-apps-on-other-accounts) and installed on other accounts, it can act as a user there too. For chat integrations, see also [lita-pagerduty](https://github.com/PagerDuty/lita-pagerduty) and the [hubot library](https://github.com/hubot-scripts/hubot-pager-me). ## Other ways to integrate with PagerDuty These are not app functionality — you configure them outside of app registration — but they are often part of an integration. | | | |--- |--- | |Webhooks|PagerDuty will send messages **to** your tool when certain activities occur. For example: when an incident is triggered, when a note is added to an incident, etc).
There are 2 ways to create a webhook subscription:
- Over the REST API with the [/webhook_subscriptions endpoint](/developer/api/reference/rest/webhooks/create-webhook-subscription)
- [In the PagerDuty web interface](/integrations/webhooks)
Two ways to create add-ons:
- [In the PagerDuty user interface](/integrations/add-ons)
- Using the [/addons endpoint](/developer/api/reference/rest/add-ons/create-addon) on the REST API
Access all audit records
[`/audit/records/` View API Reference](/developer/api/reference/rest/audit/list-audit-records) | Admin (global API token or user / OAuth token for an admin user) | Show records of all users deleted between May and July **Resource-level**
Access audit records of changes made to a single resource
`/{resource_type}/{id}/audit/records/` | Any API token that has Read access to the resource | Show records of changes made to Ellen's user profile ## API Access The Audit API is part of PagerDuty's REST API. Please see documentation for the [REST API](/developer/rest-api-overview) for more information about authentication, pagination, rate limiting, etc. ## Request Format & Errors Please see the [API Reference](/developer/api/reference/rest/audit/list-audit-records) for detailed information about the request format (including filtering query parameters), the response format, and possible error codes. You can also make a request directly from the API Reference. The Admin audit endpoint is under **Audit** in the side navigation. Resource-level endpoints are labeled **List audit records for a...** under each resource type. For example, you can [view the audit records for a single service](/developer/api/reference/rest/services/list-service-audit-records). ## Record Format Each record describes an `ACTION` executed on an aggregate (identified by the aggregate "root_resource") by `ACTOR`s using a `METHOD`. ### Record Skeleton ```json { "records":[ { "action":"update", # <-- The action (from the aggregate point of view) "actors": [ { "id": "USERID", "type": "user_reference" } ], "method": { "type": "method_type" }, "details":{ // ... // Change details // ... "resource":{ # <-- The resource in the aggregate that was acted upon "id":"ROOT_OR_NON_ROOT_RESOURCE", "type":"resource_reference" } }, "root_resource":{ # <-- Aggregate root resource "id":"ROOTRESOURCE", "type":"resource_reference" } } ] } ``` The details of the action are captured in the `details` object. Changes can be made to the root resource or any other resource in the aggregate. The `details` object provides the `resource` reference that identifies the resource that changes were made to. If the change was made to the root resource itself, the `details.resource` reference will be the same as the `root_resource` reference. > **Note:** Actions can be split across multiple records, but records produced by a single API request will share the `execution_context.request_id` ### Change Details The record `details` object describes the changes made to the resource. It may describe changes made to the resource's `fields`, `references` or both. **Example: Setting the `urgency` of a notification rule to `high`** ```json { "records":[ { <...> "details":{ "fields":[ { "name":"urgency", "value":"high" } ], "resource":{ "id":"P4SBFXI", "type":"notification_rule_reference" } }, <...> } ] } ``` **Example: Adding a user to a team's `members` collection** ```json { "records":[ { <...> "details":{ "references":[ { "added":[ { "id":"PKWWAM2", "type":"user_reference" } ], "name":"members" } ], "resource":{ "id":"PGVLPJ5", "type":"team_reference" } }, <...> } ] } ``` > **Note:** A `details` object might have multiple objects in the `fields` and `references` array. All of them apply to the resource identified by the `resource` reference. ## Data Retention Audit records are accessible for up to 12 months after they are created. You may fetch and store records if you wish to access them after 12 months. > **Warning:** Note that PagerDuty began producing audit records on December 2, 2020, so no audit records exist before this time. See the [Resources Tracked](#resources-tracked) table to see when the first audit records were produced for a given resource type. ## Developer Agreement Your access to and use of the PagerDuty Developer Services is governed by the [PagerDuty Developer Agreement](/developer/pagerduty-developer-agreement). --- URL: https://docs.pagerduty.com/developer/authentication # Authentication Covers how to authenticate REST API requests using an account or user API token sent via the Authorization request header. > **Warning:** All REST API requests must be made over HTTPS. Connections made using HTTP will be refused. All REST API calls require authentication. In order to make successful requests to the REST API, you must provide a valid form of authorization. ## API Token Authentication The PagerDuty REST API supports authenticating via an account or user API token. - Account API tokens have access to all of the data on an account, can either be granted read-only access or full access to read, write, update, and delete, and are tied to the account rather than the user that created them. - User API tokens are available for PagerDuty accounts with [Advanced Permissions](/account-admin/advanced-permissions), and these user API tokens have access to all of the data that the associated user account has access to. Only account administrators have the ability to [generate account API tokens](/account-admin/api-access-keys#generate-a-general-access-rest-api-key). Tokens should be sent in the request as part of an `Authorization` header, using this format: ``` Authorization: Token token=y_NbAkKc66ryYTWUXYEu ``` Below is how to set the header in a few popular HTTP libraries. Note that this only sets the header; other code may be needed to create and process the request. **JavaScript (Node.js)** ```javascript /* This example uses PDJS for Node.js https://github.com/PagerDuty/pdjs */ import {api} from '@pagerduty/pdjs'; const pd = api({token: 'someToken1234567890'}); pd.get('/incidents') .then({data, resource, next} => console.log(data, resource, next)) .catch(console.error); ``` **JavaScript (Client-side)** ```javascript /* This example uses the PDJS library for client-side JavaScript. https://github.com/PagerDuty/pdjs */ PagerDuty.api({token: 'someToken1234567890', endpoint: '/incidents'}) .then(response => console.log(response.data)) .catch(console.error); ``` **Python** ```python /* This example uses the "pagerduty" library for Python https://github.com/PagerDuty/python-pagerduty */ from pagerduty import RestApiV2Client client = RestApiV2Client('your-token-here') for user in client.iter_all('users'): print(user['id'], user['email'], user['name']) ``` **Go** ```go authtoken := "your-access-token" var opts pagerduty.ListUsersOptions client := pagerduty.NewClient(authtoken) if users, err := client.ListUsers(opts); err != nil { panic(err) } else { for _, p := range users.Users { fmt.Println(p) fmt.Println() } } ``` **Ruby** ```ruby pagerduty_conn = Faraday.new(url: 'https://api.pagerduty.com') do |conn| conn.headers['Authorization'] = "Token token=#{authorization_token}" conn.headers['Accept'] = 'application/vnd.pagerduty+json;version=2' conn.adapter :net_http end pagerduty_conn.get '/users' ``` Please note that this format must be followed precisely or you will receive a `401 Unauthorized` response. > **401 Unauthorized:** Requests that cannot be authenticated will return a `401 Unauthorized` error response. > If you are receiving a `401`, check: > - is your `Authorization` header being sent? > - is your `Authorization` header formatted properly? > - are you using a valid, active API token? ## Developer Agreement Your access to and use of the PagerDuty Developer Services is governed by the [PagerDuty Developer Agreement](/developer/pagerduty-developer-agreement). --- URL: https://docs.pagerduty.com/developer/build # Third-Party Tools Links to PagerDuty's API client libraries and code samples, plus the legal disclaimer covering their use, warranties, and support. - [API Client Libraries](/developer/api-client-libraries) - [API Tools & Code Samples](/developer/api-tools-and-code-samples) ## Disclaimer THE SAMPLE CODE ON SUPPORT.PAGERDUTY.COM IS PROVIDED “AS IS” AND ANY EXPRESS OR IMPLIED WARRANTIES, INCLUDING THE IMPLIED WARRANTIES OF MERCHANTABILITY AND FITNESS FOR A PARTICULAR PURPOSE ARE DISCLAIMED. IN NO EVENT SHALL PAGERDUTY OR CONTRIBUTORS BE LIABLE FOR ANY DIRECT, INDIRECT, INCIDENTAL, SPECIAL, EXEMPLARY, OR CONSEQUENTIAL DAMAGES (INCLUDING, BUT NOT LIMITED TO, PROCUREMENT OF SUBSTITUTE GOODS OR SERVICES; LOSS OF USE, DATA, OR PROFITS; OR BUSINESS INTERRUPTION) SUSTAINED BY YOU OR A THIRD PARTY, HOWEVER CAUSED AND ON ANY THEORY OF LIABILITY, WHETHER IN CONTRACT, STRICT LIABILITY, OR TORT ARISING IN ANY WAY OUT OF THE USE OF THIS SAMPLE CODE, EVEN IF ADVISED OF THE POSSIBILITY OF SUCH DAMAGE. Code on support.pagerduty.com is not covered by any PagerDuty Service Level Agreements. ## Developer Agreement Your access to and use of the PagerDuty Developer Services is governed by the [PagerDuty Developer Agreement](/developer/pagerduty-developer-agreement). --- URL: https://docs.pagerduty.com/developer/build/rest-api-rate-limits # REST API Rate Limits How PagerDuty's REST API rate limits work, plus recommendations, FAQs, and troubleshooting steps for applications that hit them. Rate limits on PagerDuty's [REST API](/developer/rest-api-overview) help ensure that our resources remain available for users and their apps, and protect against fraudulent activity. > **Recommendations:** In order to make the best use of REST API rate limits and minimize disruptions to your applications, we recommend the following: > > - **Make use of rate limit headers**: You can update your application to parse the `ratelimit-limit`, `ratelimit-remaining` and `ratelimit-reset` response headers. If your application is being rate limited, the `ratelimit-reset` header will let you know how many seconds to wait before retrying. > - **Use one "bot user" per application deployment**: If you use PagerDuty [user API keys](/account-admin/api-access-keys#generate-a-user-token-rest-api-key) as bot users for applications, create a separate bot user for each application deployment (e.g., "Acme Production Bot User", "Acme Test Bot User", etc.). With this approach, rate limits for each application deployment will be kept separate. > - **Use the latest Terraform PagerDuty provider version**: If you are using the Terraform PagerDuty provider, we recommend using [v3.2.2](https://registry.terraform.io/providers/PagerDuty/pagerduty/3.2.2/docs) or later so that you will have the latest API retry logic and timing patches. ## Troubleshooting If you experience throttling due to our [REST API Rate Limits](/developer/rest-api-rate-limits), we recommend trying the following steps in the order presented : 1. If you're using [user API keys](/account-admin/api-access-keys#generate-a-user-token-rest-api-key), we recommend adding more users and spreading out the REST API request load. 2. If you have a bot user, we recommend registering one scoped OAuth app per environment (e.g., "staging," "production," etc.) and using the appropriate app token to access the REST API. Please read our developer documentation [Register an App](/developer/register-an-app) for more information. This approach is especially advantageous, since [global API keys](/account-admin/api-access-keys#generate-a-general-access-rest-api-key) may be deprecated in the future for security's sake. 3. You can also register a private scoped OAuth app in addition to using a user token. The user will first go through the user login and consent screen, and will then be able to access the REST API. This will effectively double your API rate limit, since you can use the token associated with the registered app, as well as with the user. ## FAQ **Will rate limits affect my application?** PagerDuty applications typically experience generous rate limits. However, rate limiting can be complicated and there may be some exceptions depending on how your application uses the REST API. If you have never experienced rate limiting _or_ your code already gracefully responds to `429` HTTP response codes, you likely will not encounter issues with rate limiting. **How can I prepare for rate limits?** We provide rate limiting headers on HTTP responses from our REST API (i.e., `ratelimit-limit`, `ratelimit-remaining` and `ratelimit-reset`). If your application is mission critical or does not handle rate limiting, you can incorporate these headers into your applications to minimize disruptions. Please see [REST API Rate Limits](/developer/rest-api-rate-limits) in our developer documentation for more information. **When did rate limits go into effect?** Rate limiting headers were made available for app consumption in October and November 2023. PagerDuty started sending `429` responses for apps that reached the rate limit in the initial weeks after feature rollout. ## Developer Agreement Your access to and use of the PagerDuty Developer Services is governed by the [PagerDuty Developer Agreement](/developer/pagerduty-developer-agreement). --- URL: https://docs.pagerduty.com/developer/custom-change-event-transformer # Custom Change Event Transformer Shows how to write a JavaScript transform that converts an integration's incoming payload into a PagerDuty change event object. > **Apps are the preferred way to create Event Transformers:** [Create an app](/developer/events-integration-functionality#add-an-event-transformer) to get these new benefits: > * Use your Event Transformer on any PagerDuty service on your account > * Publish your Event Transformer as an integration for all PagerDuty users > * Syntax highlighting and linting to catch errors > * More modern JavaScript (ES6) A Custom Change Event Transform allows users to reliably convert a payload sent by integrations to a payload understood by PagerDuty, using JavaScript (ES5), in order to generate a change event. ## Writing your first Custom Change Event Transform  1. Create a new service, or add an integration to an existing service, and for **Integration Type**, select **Custom Change Event Transformer**. 2. Once you have created the integration or service, go to the view page of the integration. * Click **Show JavaScript**. * You have some pre-populated code which would create an event with the raw body of the request in the body. 3. Send a test payload via HTTP POST to the integration URL. 4. Once you have sent the test payload, a change event will be created on that service. The custom details in your change event contains the body of the request that was sent, which demonstrates the structure of data available to you within the scope of the JavaScript. 5. Note the option **Debug mode**. This can be disabled once you are done designing your Custom Change Event Transform to ignore events that are incompatible with your transform, which includes people accidentally opening the integration URL in their web browser.  To understand the pre-populated code and how to get your function to emit change events to PagerDuty, see **The PD Object** below. ## The PD Object ### Constants #### PD.inputRequest This object allows you to access the request that your integration just sent to PagerDuty. * `PD.inputRequest.uri` - an object with the details of the URI that the request was sent to * `PD.inputRequest.rawBody` - the raw, unparsed body of the request * `PD.inputRequest.body` - the parsed body of the request, if a supported `Content-Type` was given. Supported `Content-Type`s are `application/json`, `application/x-www-form-urlencoded` and `multipart/form-data` * `PD.inputRequest.headers` - the HTTP headers present in the request * `PD.inputRequest.method` - the HTTP method used to make the request ### Methods #### PD.assertType * `PD.assertType` is a utility function used to assert the type of a field. If the assertion fails, we will drop the event and the function execution will stop. If the assertion passes, the function execution continues. * Signature: `PD.assertType(type, value, value_human_name)` Examples: * `PD.assertType(Array, x, "the key x in object inputRequest.body")` * `PD.assertType([Boolean, Number], x, "the key x in object inputRequest.body")` #### PD.fail * `PD.fail` is used to indicate that the event should be dropped * Signature: `PD.fail(error_message)` Example: `PD.fail("Failed to parse event")` #### PD.emitChangeEvents * `PD.emitChangeEvents` is used to emit a change event or multiple change events into the PagerDuty ecosystem * Signature: `PD.emitChangeEvents([the_pagerduty_payload])` ### The PagerDuty Payload The PagerDuty change event payload is fairly simple. It is a JSON object in the same form as [accepted by Events API v2](/developer/send-alert-event), with the exception that `routing_key` is not required or needed in the payload. > **Debug Mode:** Setting your Custom Change Event Transform to debug mode allows you to test your universal transform as you write it. If there are any errors in your code, you will still receive a triggered incident with a brief description of the error. > You can set the integration to debug mode by changing the configuration of the integration the service. ## Examples ### A simple service that creates basic change events Here's the most basic custom change event transformer possible. It generates a sparse change event on every request to the integration URL -- even opening it up in a web browser: ```javascript var changeEvent = { payload: { summary: 'Basic change event', custom_details: PD.inputRequest } }; PD.emitChangeEvents([changeEvent]); ``` Assuming a request body that has corresponding fields, we can define a transformer that just does a straight mapping. ```javascript var data = PD.inputRequest.body var changeEvent = { payload: { summary: data.summary, timestamp: data.timestamp, source: data.source, custom_details: data.details }, links: [{ href: data.link, text: data.link_description }] }; PD.emitChangeEvents([changeEvent]); ``` ### Github This script takes GitHub issue webhooks and turns them into change events: ```javascript var webhook = PD.inputRequest.body; var changeEvent = { payload: { summary: webhook.issue.title, source: "Github issues", custom_details: { issue_number: webhook.issue.number, description: webhook.issue.body } }, links: [{ href: webhook.issue.html_url, text: "View on Github" }] }; if(webhook.action=="opened") PD.emitChangeEvents([changeEvent]); ``` ### Instagram → Zapier → PagerDuty Keep track of when your Instagram changes. This script takes a **Zapier** webhook triggered from **Instagram** and makes it a PagerDuty change event: ```javascript var webhook = PD.inputRequest.body; var changeEvent = { payload: { summary: 'Incoming kitten from ' + webhook.user.username, source: 'Instagram', custom_details: { image: webhook.images.standard_resolution.url, alt: webhook.caption.text } }, links: [] }; if (webhook.caption.text.indexOf('cute') > -1) { changeEvent.links.push({ href: 'https://runbooks.example.com/columbo-investigates-the-cuteness-overload', text: '[Runbook] How to handle cuteness overload' }); } PD.emitChangeEvents([changeEvent]); ``` ## Developer Agreement Your access to and use of the PagerDuty Developer Services is governed by the [PagerDuty Developer Agreement](/developer/pagerduty-developer-agreement). --- URL: https://docs.pagerduty.com/developer/custom-event-transformer # Custom Event Transformer Shows how to write a JavaScript transform that converts an integration's raw incoming payload into a PagerDuty alert event. > **Apps are the preferred way to create Event Transformers:** [Create an app](/developer/events-integration-functionality#add-an-event-transformer) to get these new benefits: > * Use your Event Transformer on any PagerDuty service on your account > * Publish your Event Transformer as an integration for all PagerDuty users > * Syntax highlighting and linting to catch errors > * More modern JavaScript (ES6) A Custom Event Transform allows users to reliably convert a payload sent by integrations to a payload understood by PagerDuty, using JavaScript (ES5). ## Writing your first Custom Event Transform  1. Create a new service, or add an integration to an existing service, and for **Integration Type**, select **Custom Event Transformer**. 2. Once you have created the integration or service, go to the view page of the integration. * Click **Show JavaScript**. * You have some pre-populated code which would create an event with the raw body of the request in the body. 3. Send a test payload via HTTP POST to the integration URL. 4. Once you have sent the test alert, an incident will be triggered. The details in your incident contains the body of the request that was sent, which demonstrates the structure of data available to you within the scope of the JavaScript. 5. Note the option **Debug mode**. This can be disabled once you are done designing your Custom Event Transform to ignore events that are incompatible with your transform, which includes people accidentally opening the integration URL in their web browser. 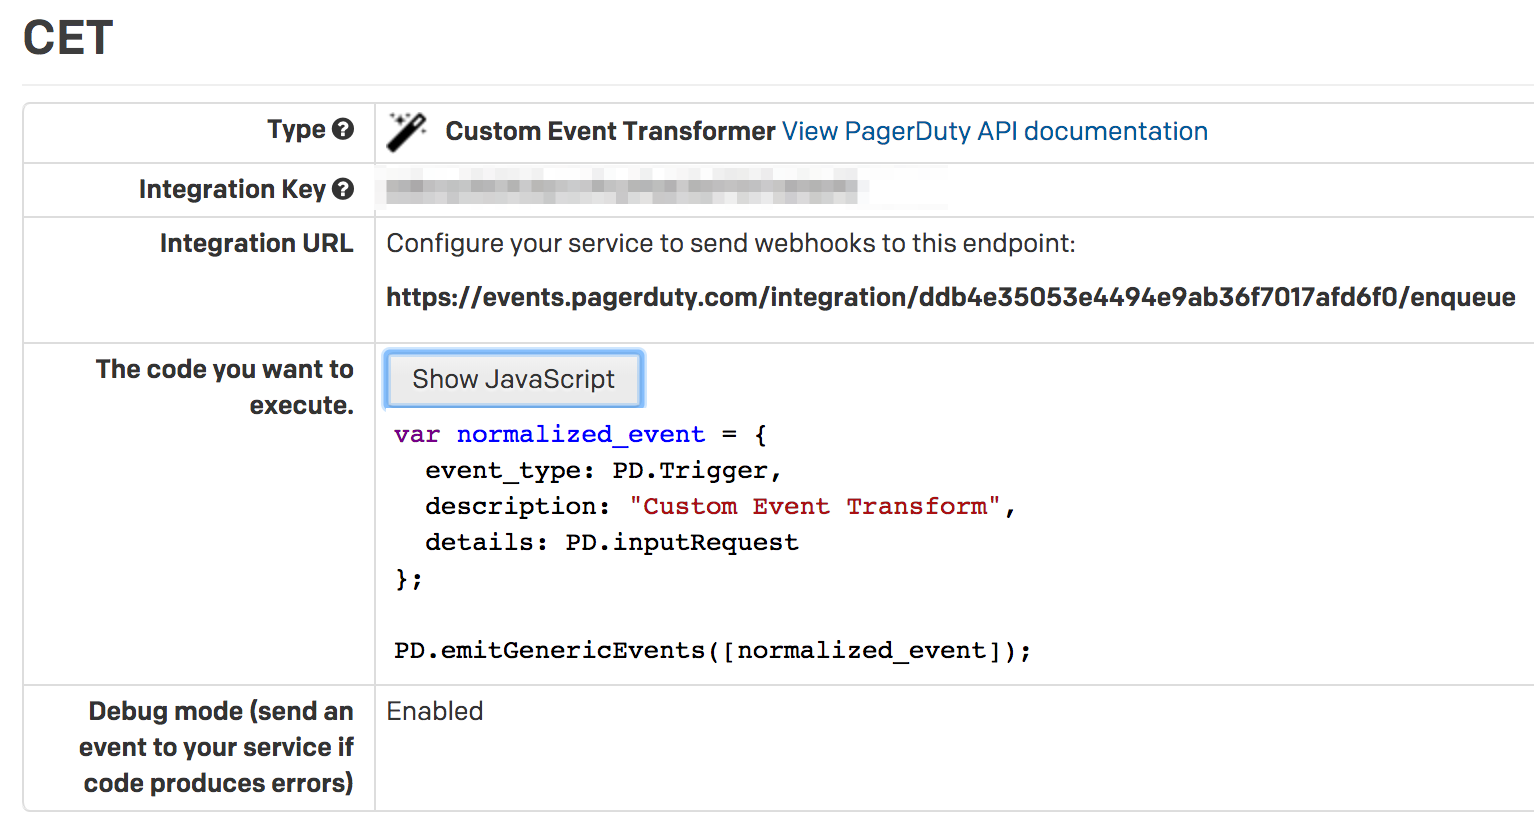 To understand the pre-populated code and how to get your function to emit events to PagerDuty, see **The PD Object** below. ## The PD Object ### Constants #### Event types Use one of these three constants to indicate the type of event in the normalized event. * `PD.Trigger` - use this event type to trigger a new event * `PD.Resolve` - use this event type to resolve a triggered incident * `PD.Acknowledge` - use this event type to acknowledge a triggered incident #### PD.inputRequest This object allows you to access the request that your integration just sent to PagerDuty. * `PD.inputRequest.uri` - an object with the details of the URI that the request was sent to * `PD.inputRequest.rawBody` - the raw, unparsed body of the request * `PD.inputRequest.body` - the parsed body of the request, if a supported `Content-Type` was given. Supported `Content-Type`s are `application/json`, `application/x-www-form-urlencoded` and `multipart/form-data` * `PD.inputRequest.headers` - the HTTP headers present in the request * `PD.inputRequest.method` - the HTTP method used to make the request ### Methods #### PD.assertType * `PD.assertType` is a utility function used to assert the type of a field. If the assertion fails, we will drop the event and the function execution will stop. If the assertion passes, the function execution continues. * Signature: `PD.assertType(type, value, value_human_name)` Examples: * `PD.assertType(Array, x, "the key x in object inputRequest.body")` * `PD.assertType([Boolean, Number], x, "the key x in object inputRequest.body")` #### PD.fail * `PD.fail` is used to indicate that the event should be dropped * Signature: `PD.fail(error_message)` Example: `PD.fail("Failed to parse event")` #### PD.emitGenericEvents * `PD.emitGenericEvents` is used to emit an event or multiple events into the PagerDuty ecosystem. * Each invocation of `PD.emitGenericEvents` emits one additional event to the set of events that the incoming event is being transformed into. * For example, two invocations of `PD.emitGenericEvents` would mean the incoming event is transformed into two events. * An incoming event can be transformed into one or more events, but no more than 40. * Signature: `PD.emitGenericEvents([the_pagerduty_payload])` * PagerDuty imposes a limit on the number of events emitted by the `PD.emitGenericEvents` method that will be processed. * Though the `PD.emitGenericEvents` method may be invoked any number of times, only the first 40 events emitted will be processed. * Any events emitted in excess of the 40 event limit will be dropped and a single event will be generated saying "Event {{incoming event ID}} was transformed into {{total count}} fanout events. The first 40 were successfully processed. The remaining {{excess count}} excess fanout events were dropped." ### The PagerDuty Payload The PagerDuty event payload is fairly simple. It is a JSON object in the same form as [accepted by Events API v1](/developer/send-v1-event). For convenience, constants are provided for the `event_type` field: `PD.Trigger`, `PD.Acknowledge`, and `PD.Resolve`. **Debug Mode** Setting your Custom Event Transform to debug mode allows you to test your universal transform as you write it. If there are any errors in your code, you will still receive a triggered incident with a brief description of the error. You can set the integration to debug mode by changing the configuration of the integration the service. ## Examples ### A simple service that passes raw events Here's the most basic CET possible. It triggers on every request to the integration URL -- even opening it up in a web browser: ```javascript var normalized_event = { event_type: PD.Trigger, description: 'Raw event', details: PD.inputRequest }; PD.emitGenericEvents([normalized_event]); ``` ### Turn a Twilio message into a PagerDuty incident This CET triggers an incident from a Twilio **SMS/MMS** webhook, and even attaches images from MMS messages: ```javascript var contexts = [{ "type": "link", "href": "tel:" + PD.inputRequest.body.From, "text": "call " + PD.inputRequest.body.From }]; if (PD.inputRequest.body.MediaUrl0) { contexts.push({ "type": "image", "src": PD.inputRequest.body.MediaUrl0 }); } var normalized_event = { incident_key: PD.inputRequest.body.SmsMessageSid, event_type: PD.Trigger, description: PD.inputRequest.body.From + " " + PD.inputRequest.body.Body, contexts: contexts }; PD.emitGenericEvents([normalized_event]); ``` ### ServerGuard24 Here's a simple CET from one of our customers to handle webhooks from **ServerGuard24**: ```javascript var webhook = PD.inputRequest; var event_type = PD.Trigger; if(webhook.body.check_result == "OK") {event_type = PD.Resolve;} var normalized_event = { event_type: event_type, incident_key: webhook.body.server_name, description: webhook.body.check_output, details: webhook.body }; PD.emitGenericEvents([normalized_event]); ``` ### Visual Studio Team Foundation Server 2015 Here's a proof of concept that our support team wrote that creates PagerDuty incident from an issue in Visual Studio Team Foundation Server 2015: ```javascript function transform(PD) { var webhook = PD.inputRequest var body = webhook.body || JSON.parse(webhook.rawBody); var incident_key = (body.message.markdown||")").split(")")[0]; /*hacky, but resource.workItemId isn't populated on create*/ var description = body.message.text.split("\r\n")[0]; var url = null; if(incident_key.split("(").length==2) {url = incident_key.split("(")[1];} var event_type = PD.Trigger; try { if(body.resource.fields["System.State"].newValue == "Resolved") { event_type = PD.Resolve; } } catch (e) {} var normalized_event = { event_type: event_type, incident_key: incident_key, description: description, details: body.resource.fields, client: "View in Team Foundation Server", client_url: url }; PD.emitGenericEvents([normalized_event]); } ``` ### Github This script takes GitHub issue webhooks and turns them into incidents: ```javascript var webhook = PD.inputRequest.body; var normalized_event = { event_type: PD.Trigger, incident_key: webhook.issue.number, description: webhook.issue.title, details: { description: webhook.issue.body }, client: "Github issues", client_url: webhook.issue.html_url }; if(webhook.action=="opened") PD.emitGenericEvents([normalized_event]); ``` Some customers have started rewriting our supported integrations. For instance, here's the start of a CET that will handle **New Relic**'s generic webhooks: ```javascript var normalized_event = { event_type: PD.Trigger, incident_key: PD.inputRequest.body.incident_id, description: PD.inputRequest.body.policy_name+": "+PD.inputRequest.body.details, details: PD.inputRequest.body, client: "New Relic", client_url: PD.inputRequest.body.incident_url }; PD.emitGenericEvents([normalized_event]); ``` ### Instagram → Zapier → PagerDuty This CET was demoed on one of our [What's New webinars](https://www.pagerduty.com/whats-new/). It takes a **Zapier** webhook triggered from **Instagram** and makes it a PagerDuty incident: ```javascript var webhook = PD.inputRequest.body; var normalized_event = { event_type: PD.Trigger, description: 'Incoming kitten from ' + webhook.user.username, client: 'Instagram', client_url: webhook.link, contexts: [{ type: 'image', src: webhook.images.standard_resolution.url, href: webhook.link, alt: webhook.caption.text }] }; if (webhook.caption.text.indexOf('cute') > -1) { normalized_event.contexts.push({ type: 'link', href: 'https://runbooks.example.com/columbo-investigates-the-cuteness-overload', text: '[Runbook] How to handle cuteness overload' }); } PD.emitGenericEvents([normalized_event]); ``` ## Developer Agreement Your access to and use of the PagerDuty Developer Services is governed by the [PagerDuty Developer Agreement](/developer/pagerduty-developer-agreement). --- URL: https://docs.pagerduty.com/developer/developer-account-faq # Developer Account A free PagerDuty account for building and managing apps and integrations A PagerDuty developer account is a free account for building and managing apps and integrations with PagerDuty. It exists for developers who do not otherwise have access to a paid PagerDuty account, or who would rather not use their paid account for this. [Sign up for a developer account](/developer/signup), or go straight to [registering an app](/developer/register-an-app) if you already have an account. ## What you get Developer accounts are functionally the same as regular PagerDuty accounts, with two limits: ||| |-|-| |**Users**|3 full users and 2 stakeholder users| |**Notifications**|Email and push only — SMS and voice/phone notifications are not available| |**Cost**|Free| Neither limit can be raised, and a developer account cannot be converted into a paid account. If you need more users, SMS or voice notifications, or an account for commercial use, purchase a paid PagerDuty account. ## FAQ **Do I need a developer account?** If you already have a PagerDuty account, no. All PagerDuty accounts have access to our developer tools and you can get started [here](/developer/register-an-app). If you do not have a PagerDuty account then you can sign up for a Developer account [here](/developer/signup). **How many users can I add to my developer account?** You may add 3 full users and 2 stakeholder users to your developer account. **Are there any other restrictions for PagerDuty developer accounts?** Developer account users cannot receive SMS or voice/phone notifications. These cannot be enabled for any reason. If you require these notification types for testing, please purchase a paid PagerDuty account. **How does my developer account differ from my regular account?** Other than the limits on notifications and the user count, there are no differences - Partner Developer Accounts are meant for those without access to a paid PagerDuty account. **Can I convert my developer account into a paid account?** No, this account is meant for developing and testing apps and integrations with PagerDuty. Please sign up for a PagerDuty trial and purchase an account for commercial use. **What if I need more users on my developer account?** Unfortunately, the user restrictions on developer accounts cannot be increased for any reason. If you require more users, please purchase a paid PagerDuty account. **Is there any cost for a developer account?** No, PagerDuty developer accounts are free! **I have a question that wasn't answered here.** If you have questions about this process or your submission, please email apps@pagerduty.com as is mentioned on [Publish an App](/developer/publish-an-app). ## Developer Agreement Your access to and use of the PagerDuty Developer Services is governed by the [PagerDuty Developer Agreement](/developer/pagerduty-developer-agreement). --- URL: https://docs.pagerduty.com/developer/early-access-webhooks # Early Access Webhook Events Lists webhook event types still in Early Access, noting they may change shape or be removed before general availability. > ## Early Access > > The features described on this page are in an Early Access state and are subject to change. Please reach out to > us if you have any questions or need support. Early Access webhook events are provided here for informational purposes, but are subject to change in availability (may be removed) and design (contents and shape of response may change). They can be created via the `/webhook_subscriptions` REST API endpoint. ## Developer Agreement Your access to and use of the PagerDuty Developer Services is governed by the [PagerDuty Developer Agreement](/developer/pagerduty-developer-agreement). --- URL: https://docs.pagerduty.com/developer/endpoints # Endpoints Explains the index, show, create, update, and delete endpoint conventions shared across every REST API resource type and response. Within each resource, several types of endpoints are provided to accomplish different tasks concerning that resource. ## /resources (index) Index endpoints will return a collection of the given type of resource, optionally [filtered](/developer/filtering) and [sorted](/developer/sorting) by parameters you provide. The response to an index endpoint always contains a key with the plural name of the endpoint and a corresponding array of resource objects matching the query provided. ```json { "resources": [ // the actual resources are contained in this array. The endpoint producing this response would be /resources { // fields appear here } // one object is in the array for each resource ] } ``` Each resource object is identical to what would be returned on the equivalent [show](#get-resourcesid-show) endpoint. A `200 OK` response code is returned on a successful `index` request. ## GET /resources/:id (show) Show endpoints return a single resource, and may accept additional parameters to alter the presentation of fields within the resource. The response to a show endpoint always contains a key with the singular name of the endpoint/resource and a corresponding object containing the resource's fields: ```json { "resource": { // the endpoint producing this response would be /resources/:id … // fields appear here } } ``` The actual key name varies based on the endpoint. Consult the reference documentation for specifics. A `200 OK` response code is returned on a successful `show` request. ## POST /resources (create) Create endpoints will create a new resource according to the payload specified. They accept a body with the same format as in a `show` response, and will return a response reflecting what the created resource looks like. If properly specified, this will mirror the request body, but is likely to contain additional `readonly` fields generated by the server. If `readOnly` fields or unrecognized fields within the resource are submitted as part of the request, they will be ignored. A `201 Created` response code is returned on a successful `create` request. A `4xx` response code is sent if something in the request was invalid, such as omitting parameters required to create the resource. ## PUT /resources/:id (update single) Update single endpoints will modify the state of an existing resource, identified by the `id` and `type` fields within the request body. The body has the same format as would be returned from the equivalent `show` endpoint. Not all required fields for the resource must be specified; only those whose state is to be changed must be included. If `readonly` fields or unrecognized fields within the resource are submitted as part of the request, they will be ignored. A `200 OK` response code is returned on a successful `update single` request. A `4xx` response code is sent if something in the request was invalid, such as providing an invalid value for a field within the resource. ## PUT /resources (update multiple) Update multiple endpoints will modify the state of several resources at once, each identified by the `id` and `type` fields within the resource's body in the resource array. The request body mirrors the same format as would be returned from the equivalent `index` endpoint. Each resource specified in the array follows the same rules as would be followed in the equivalent `update single` endpoint. If any resource in the request is invalid, the entire request will be invalid and no resources will be updated. A `200 OK` response code is sent to a successful `update multiple` request. A `4xx` response code is returned if something in the request was invalid, such as providing an invalid value for a field within a given resource. ## DELETE /resources/:id (delete) Delete endpoints will cause the specified resource to be removed from the account. Subsequent requests to the associated `index` endpoint will not display the resource in the response, and subsequent requests to the associated `show` endpoint will return a `404` response code. However, the `id` of the resource deleted, in combination with its `type`, still serve to uniquely identify the deleted resource. No resources of the same `type` will have the same `id` in the future. In addition, deleted resources may still be referenced by other resources. In these cases, the deleted resource will always be shown as a resource reference. A `204 No content` response code is returned to a successful `delete` request. A `4xx` response code is sent if it was not possible to delete the resource. The response body will contain [more specific errors](/developer/errors) about why the delete request failed. ## POST /resources/:id/{verb} (verb) Verb endpoints exist where an action needs to be carried out on a resource that goes beyond updating its immediate state. These endpoints will take a set of parameters unrelated to the state of the resource itself and use them as input to an action that has effects on the resource's state. The response follows the same format as the related `show` endpoint (above), representing the resource's new state after the action has been applied. Consult the reference documentation for specifics on any verb endpoints. ## Developer Agreement Your access to and use of the PagerDuty Developer Services is governed by the [PagerDuty Developer Agreement](/developer/pagerduty-developer-agreement). --- URL: https://docs.pagerduty.com/developer/errors # Errors Lists the HTTP status codes the REST API returns on failure, along with the structure of the JSON error response message body. If an API request is successful, PagerDuty will respond to it with HTTP status code 2XX and the resources that match the query. If the API request is unsuccessful, PagerDuty will respond with a corresponding HTTP error status code and the response body will contain PagerDuty error details. The response body (with error details) will have the following properties: ## Error Response ```json { "error": { "message": "Error Message String", "code": 2001, "errors": [ "human-readable error details", "more details" ] } } ``` ## HTTP Responses The HTTP response can be used to determine if the request was successful, and if not, whether the request should be retried. | Code | HTTP Definition | Description | |:--------------|:------------------|:------| | 200 | OK | The request was successful | | 201 | Created | The request was successful and a new resource was created. | | 204 | No Content | The request was successful. No content is returned. | | 400 | Bad Request | Caller provided invalid arguments. Please review the response for error details. Retrying with the same arguments will *not* work. | | 401 | Unauthorized | Caller did not supply credentials or did not provide the correct credentials. See [Authentication](/developer/authentication). | | 402 | Payment Required | The PagerDuty account does not have access to one or more abilities needed to complete this request. Use the [Account Abilities API](/developer/api/reference/rest/abilities/list-abilities) to determine which abilities the account supports. | | 403 | Forbidden | Caller is not authorized to view the requested resource. | | 404 | Not Found | The requested resource was not found. | | 408 | Request Timeout | The request took too long to process. Please try again. | | 429 | Too Many Requests | The caller is making requests too frequently. Wait a moment before making further requests and make them at a reduced rate. See the [REST API Rate Limits](/developer/rest-api-rate-limits) and [Events API Rate Limits](/developer/events-api-rate-limits) pages for more detail. | | 500 | Internal Server Error | Internal error occurred while processing request, likely due to transient issues. Please try again. **Tip:** We recommend adding retry logic to your client to automatically try your request again later. | ## PagerDuty Error Codes In the case of an error, the PagerDuty error code can give further details on the nature of the error. This list of error codes is not exhaustive, but is representative of the kinds of errors you will see in API responses. | Code | Message | |:-----|:--------| | 1001 | Incident Already Resolved | | 1002 | Incident Already Acknowledged | | 1003 | Invalid Status Provided | | 1004 | Invalid ID Provided | | 1005 | Data Updated Since Last Request | | 1006 | Cannot Escalate | | 1007 | Assigned To User Not Found | | 1008 | Requester User Not Found | | 1009 | Error Parsing before_time Parameter | | 1010 | Before Time or Before Incident Number Not Found | | 1011 | Cannot process reassign action | | 1012 | Incident is not Acknowledged | | 1013 | Snooze Duration is Invalid | | 1014 | Escalation Policy Not Found | | 1015 | Escalation Policy Has No User On Call | | 1018 | Requester not authorized to perform action | | 1019 | Incident Already Merged | | 1020 | Invalid Priority | | 2000 | An internal error has occurred. PagerDuty team has been notified. | | 2001 |
- Cannot Delete Only Rule For Escalation Policy
- Cannot create more than 50 users at one time
- Escalation Policy has already been taken
- Incident could not be created
- Invalid Input Provided
- Users must be an array
- Schedule Not Found
- Unknown Schedule
- Invalid Override
- Override Not Found
- Affiliate Partner Not Found
- Color Not Found
- Escalation Policy Not Found
- Escalation Rule Not Found
- Incident Not Found
- Log Entry Not Found
- Maintenance Window Not Found
- User Next On-call Not Found
- Vendor Not Found
- Webhook Not Found
- Service Not Found
- Simple Log Entry Limit Reached
- google auth is not enabled
- pre_auth.authorizable? returned false
If there is no one on call for the service's escalation policy when the event is triggered, an incident will not be created.
Your monitoring tools should send PagerDuty a trigger event to report a new or ongoing problem. `acknowledge` | `acknowledge` events cause the referenced incident to enter the acknowledged state.
While an incident is acknowledged, it won't generate any additional notifications, even if it receives new trigger events.
Your monitoring tools should send PagerDuty an `acknowledge` event when they know someone is presently working on the problem. `resolve` | `resolve` events cause the referenced incident to enter the resolved state.
Once an incident is resolved, it won't generate any additional notifications. New trigger events with the same `incident_key` as a resolved incident won't re-open the incident. Instead, a new incident will be created.
Your monitoring tools should send PagerDuty a `resolve` event when the problem that caused the initial trigger event has been fixed. ## Incident De-duplication and incident_key Every incident has an `incident_key`: a string which identifies the incident. The `incident_key` can be specified when submitting the first `trigger` event that creates an incident. If omitted, it will be generated automatically by PagerDuty and returned in the Events API response. Submitting subsequent events for the same `incident_key` will result in those events being applied to an open incident matching that `incident_key`. Once the incident is `resolved`, any further events with the same `incident_key` will create a new incident (for `trigger` events) or be dropped (for `acknowledge` and `resolve` events). Subsequent events for the same `incident_key` will only apply to the open incident if the events are sent via the same `service_key` as the original `trigger` event. Subsequent `acknowledge` or `resolve` events sent via a different `service_key` from the original will be dropped. Incidents created within the PagerDuty web application are inaccessible via the Events API. If a `trigger` event is sent with no `incident_key`, it will always generate a new incident because the key is a [UUID](/developer/types#uuid). ## API Response Codes & Retry Logic The following table shows the possible results of the API request and if you need to retry the API call for that result: Response Code | Description | Retry? ---------------- | --------------------------------------------------------------------------------------------- | --- 200 | Event was received and processed successfully | No 400 | Invalid event format (i.e. JSON parse error) or incorrect event structure | No 403 | Rate limit reached (too many Events API requests) | Yes - retry after some time 500 or other 5XX | Internal Server Error - the PagerDuty server experienced an error while processing the event. | Yes - retry after some time Network Error | Error while trying to communicate with PagerDuty servers. | Yes - retry after some time ## Developer Agreement Your access to and use of the PagerDuty Developer Services is governed by the [PagerDuty Developer Agreement](/developer/pagerduty-developer-agreement). --- URL: https://docs.pagerduty.com/developer/events-api-v2-overview # Events API v2 Overview Describes the asynchronous Events API v2, which ingests alert and change events and routes them to a PagerDuty service for processing. The Events API v2 is a highly reliable, highly available **asynchronous API** that ingests machine events from monitoring tools and other systems like code repositories, observability platforms, automated workflow tools, and configuration management systems. Events sent to this API are ultimately routed to a [PagerDuty service](/incident-management/services/services-and-integrations) and processed. ## Event Types The Events API v2 can ingest multiple types of events. Each event type is described below. Event Type | Description | Example Events | Notifications can be sent? | ---------------- | ----------- | -------------- | ---------------------------| [Alert](/developer/send-alert-event)| A problem in a machine monitored system.
Follow up events can be sent to acknowledge or resolve an existing alert. | High error rate
CPU usage exceeded limit
Deployment failed | Yes | [Change](/developer/send-change-event)| A change in a system that does not represent a problem. | Pull request merged
Secret successfully rotated
Configuration update applied | No | *Note on ITSM and Ticketing:* Previously, the Events API was used to create PagerDuty incidents from ticketing systems and various other collaboration tools. Today, we recommend using the synchronous [Incidents API](/developer/api/reference/rest/incidents/create-incident) for this purpose. ## How Events Are Used In PagerDuty ### Alert Events * Alert events create incidents on a service in PagerDuty. The incident will be assigned to the person on-call. This will generate a notification (phone call, SMS, email, or mobile push notification depending on the on-call responder's preferences). * If an alert already exists for a problem, it can be grouped into a single incident (see [Alert De-Duplication](/developer/send-alert-event#alert-de-duplication)) [Try it out here](/developer/api/reference/events-v2/send-event/create-v2-event) ### Change Events Change events provide context to responders when triaging an incident. Currently, they are shown in the PagerDuty web application in these places. * [Service activity stream](/ai-automation/aiops/recent-changes#view-change-events-on-a-service) * [Incident details page](/ai-automation/aiops/recent-changes) (most recent change events) * [Recent changes page](/ai-automation/aiops/recent-changes#view-and-filter-change-events-across-all-services) [Learn more about utilizing change events in PagerDuty](/ai-automation/aiops/recent-changes#view-change-events-in-the-web-app) [Try it out here!](/developer/api/reference/events-v2/send-change-event/create-change-event) ## Getting Started To quickly start using the Events API v2 with PagerDuty services: 1. [Create an integration on any PagerDuty service](/incident-management/services/services-and-integrations#events-api-v2). 2. Select **Events API v2** as the Integration Type 3. Include the integration key for your new integration, as a `routing_key` in the event payload. 4. Send a [change-event](/developer/send-change-event) or [alert event](/developer/send-alert-event) payload to the appropriate endpoint. [View PagerDuty API client libraries.](/developer/api-client-libraries) Service integration keys can be used to send any type of event. Currently, change events cannot be sent to ruleset integration keys (these keys begin with the character `R`). > **Have you built an integration using the Events API?:** Let us know and [become a PagerDuty integration partner](https://pdconnect.wufoo.com/forms/contact-our-partnerships-team/) ## Response Codes & Retry Logic The following table shows the possible results of the API request and if you need to retry the API call for that result: Response Code | Description | Retry? ---------------- | --------------------------------------------------------------------------------------------- | --- 202 | Accepted - The event has been accepted by PagerDuty. | No 400 | Bad Request - Check that the JSON is valid. | No 429 | Too many API calls at a time. | Yes - retry after some time 500 or other 5XX | Internal Server Error - the PagerDuty server experienced an error while processing the event. | Yes - retry after some time Network Error | Error while trying to communicate with PagerDuty servers. | Yes - retry after some time ## API Limits ### Rate Limits There is a limit on the number of events that a service can accept at any given time. Depending on the behaviour of the incoming traffic and how many incidents are being created at once, we dynamically adjust our throttle limits. If each of the events your monitoring system is sending is important, be sure to retry on a 429 response code, preferably with a backoff of a few minutes. > **Note:** AIOps / Signal Intelligence accounts receive significantly higher Events API rate limits, up to 10,000 events/min per integration key, upon request. > > You can activate a trial of PagerDuty AIOps / Signal Intelligence depending on your PagerDuty account status: > - [Customers](/ai-automation/aiops/overview#customers) > - [Prospective Customers](/ai-automation/aiops/overview#prospective-customers-1) ### Size Limits Events API payloads are limited to **512 KB** ## PagerDuty Common Event Format (PD-CEF) The Events API v2 accepts data in the [PagerDuty Common Event Format](/developer/api/pd-cef), a schema for operations data released by PagerDuty in 2016. PD-CEF helps PagerDuty provide a more useful and consistent experience for our customers across all their different monitoring systems. Across different integrations, event types, services, and teams, users can see and use data to rapidly assess emerging situations, customize event, alert, and incident workflow, and optimize their operational processes. Field | Description | Type | Required? | Examples -------------- | ------------------------------------------------------------------------------------------------------------------------------------------- | -------------------- | ----------------------------------------------------------------| --------- Summary | A high-level, text summary message of the event. Will be used to construct an alert's description. | String | Required | "PING OK - Packet loss = 0%, RTA = 1.41 ms"
"Host 'acme-andromeda-sv1-c40 :: 179.21.24.50' is DOWN" Severity | How impacted the affected system is. Displayed to users in lists and influences the priority of any created incidents. | Enum | Required | Enum
{info, warning, error, critical} Source | Specific human-readable unique identifier, such as a hostname, for the system having the problem. | String | Required | "prod05.theseus.acme-widgets.com"
"171.26.23.22"
"aws:elasticache:us-east-1:852511987:cluster/api-stats-prod-003"
"9c09acd49a25" Timestamp | When the upstream system detected / created the event. This is useful if a system batches or holds events before sending them to PagerDuty. | Timestamp (ISO 8601) | Optional - Will be auto-generated by PagerDuty if not provided. | 2015-07-17T08:42:58.315+0000 Component | The part or component of the affected system that is broken. | String | Optional | "keepalive"
"webping"
"mysql"
"wqueue" Group | A cluster or grouping of sources. For example, sources "prod-datapipe-02" and "prod-datapipe-03" might both be part of "prod-datapipe" | String | Optional | "prod-datapipe"
"www"
"web_stack" Class | The class/type of the event | String | Optional | "High CPU"
"Latency"
"500 Error" Custom Details | Free-form details from the event | Object | Optional | {"ping time": "1500ms", "load avg": 0.75 } For more information about PD-CEF and how it is used in PagerDuty, please see [this knowledge base article](/developer/api/pd-cef). As a PagerDuty monitoring partner, adapting the new PD-CEF format provides your customers with a more streamlined and useful user experience within PagerDuty. Customers can see the most important details about an event front-and-center during initial triage, enabling them to rapidly determine whether a problem needs further investigation within the monitoring system, or whether action can immediately be taken. If you are a monitoring partner and interested in converting your integration to use PD-CEF, please email us at [partners@pagerduty.com](mailto:partners@pagerduty.com). ## Developer Agreement Your access to and use of the PagerDuty Developer Services is governed by the [PagerDuty Developer Agreement](/developer/pagerduty-developer-agreement). --- URL: https://docs.pagerduty.com/developer/events-integration-functionality # Events Integration Functionality Explains how to add Events Integration functionality to an app so it can send alert and change events via the Events API v2. ## What is Events Integration functionality? Events Integration allows you to send machine events **from** your tool **to** PagerDuty over our asynchronous [Events API v2](/developer/events-api-v2-overview) ## Why should I use Events Integration? This is the best way for monitoring tools to connect with PagerDuty in order to trigger incidents. You'll also be able to acknowledge and resolve incidents. Using the Events API means your app will work with PagerDuty's [Event Intelligence](https://www.pagerduty.com/platform/event-intelligence-and-automation/) features like intelligent grouping and triage. To add this functionality to an app, see [Adding Events Integration functionality](/developer/register-an-app#adding-events-integration-functionality). ## Simple Install Flow (optional, but recommended) The Simple Install Flow provides an interface for installing a PagerDuty integration directly from your application. Similar to OAuth! **Why should I use this flow?** * Better experience for users. They don't need to copy and paste keys from PagerDuty. * Less work for you (interface is built and maintained by PagerDuty) **See it in action here:** [acme.pagerduty.dev](https://acme.pagerduty.dev) Follow these steps to leverage Simple Install Flow for your app: 1. Add a redirect URL for your application. This is where we will redirect the browser to once the user completes the install flow. If you would like to pass through additional GET parameters or a URL fragment when redirecting back, you should URL-encode the `redirect_uri` parameter in the Integration Setup URL. 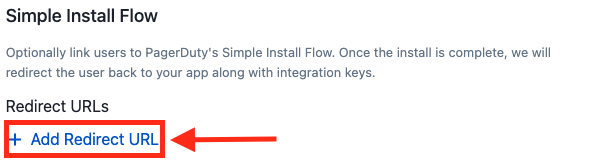 2. Implement a page in your app which will receive the request. You should be prepared to handle a request in the format below. Note: you will receive a collection of integration keys and should be prepared to handle more than one. ```http GET http://
Value must be set to `code`. | ✓ `scope` | Specifies the scope being requested, which must match [or be a subset of] what is configured for the OAuth functionality. Should be either `read` or `write` for Classic User OAuth, or a space separated set of scopes for Scoped OAuth. | ✓ `code_challenge` | Base64 URL encoded (without padding) SHA-256 digest of your app's one-time random `code_verifier`. | When using PKCE `code_challenge_method` | Specifies that we are using the PKCE SHA-256 signature.
Value must be set to `S256`. | When using PKCE With PKCE — always for Scoped OAuth, and recommended for Classic User OAuth: ``` GET https://identity.pagerduty.com/oauth/authorize?client_id={CLIENT_ID}&redirect_uri={REDIRECT_URI}&scope={SCOPE}&response_type=code&code_challenge={CODE_CHALLENGE}&code_challenge_method=S256 ``` Without PKCE — Classic User OAuth confidential clients only: ``` GET https://identity.pagerduty.com/oauth/authorize?client_id={CLIENT_ID}&redirect_uri={REDIRECT_URI}&scope={SCOPE}&response_type=code ``` ### Obtaining an Access Grant : Leg 2 of 3 Upon initiating an access grant there are three possibilities: #### #1 User Cannot Log In (Flow Stopped) The flow ends without a valid user credential. #### #2 User Logged In and Denied Permission to Client Application (Flow Stopped) The flow ends with access denied. PagerDuty will redirect to the specified URI with `error` and `error_description` parameters: ``` {REDIRECT_URI}?error=access_denied&error_description=The+resource+owner+or+authorization+server+denied+the+request. ``` #### #3 User Logged In and Approves Client Application Permission (Success) If the user authorizes the app, PagerDuty will redirect to the specified URI with the `code` (authorization code) in the URL: ``` {REDIRECT_URI}?code={AUTHORIZATION_CODE} ``` The authorization code is valid for 30 seconds. ### Exchanging Auth Code For Access Token : Leg 3 of 3 To exchange the authorization code for an access token, send a POST request to the Token Endpoint. The authorization code has a time to live of 30 seconds, and your POST request must be received within that time. The content type should be `application/x-www-form-urlencoded`. Parameter | Description | Required --------------- | ----------- | :-: `grant_type` | Value must be set to `authorization_code`. | ✓ `client_id` | An identifier issued when the app is created. | ✓ `code` | The authorization code issued upon a successful authorization request. | ✓ `redirect_uri` | Registered with the app when OAuth functionality is added. Must match the `redirect_uri` used on the authorization request. | ✓ `client_secret` | A secret issued when the app is created. | Confidential clients `code_verifier` | The original one-time random verifier used to generate the `code_challenge` on the authorization request. | When using PKCE #### Confidential clients Scoped OAuth apps send both a `client_secret` and a `code_verifier`: ```bash curl -X POST https://identity.pagerduty.com/oauth/token \ --header "Content-Type: application/x-www-form-urlencoded" \ -d "grant_type=authorization_code" \ -d "client_id={CLIENT_ID}" \ -d "client_secret={CLIENT_SECRET}" \ -d "redirect_uri={REDIRECT_URI}" \ -d "code={CODE}" \ -d "code_verifier={CODE_VERIFIER}" ``` Classic User OAuth confidential clients may omit `code_verifier` if they did not send a `code_challenge` on the authorization request, though we recommend using PKCE. #### Non-confidential clients Classic User OAuth non-confidential clients omit the `client_secret`, and `code_verifier` is required: ```bash curl -X POST https://identity.pagerduty.com/oauth/token \ --header "Content-Type: application/x-www-form-urlencoded" \ -d "grant_type=authorization_code" \ -d "client_id={CLIENT_ID}" \ -d "redirect_uri={REDIRECT_URI}" \ -d "code={CODE}" \ -d "code_verifier={CODE_VERIFIER}" ``` #### The token response The access token will be included in a JSON response. You may also want to take note of the ID token and the refresh token: ```json { "client_info":"prefix_legacy_app", "id_token":"eyJraWQiOiIxNzg3MzQ1MDA4IiwieDV0IjoiX2Nxbk1aWlBBcEF0V3kyVm11T1Y4dUc5VHNvIiwiYWxnIjoiUlMyNTYifQ.eyJleHAiOjE2NjYxOTk2MDEsIm5iZiI6MTY2NjE5NjAwMSwianRpIjoiODM3ODE1YzAtZTVmMi00M2RhLWFiYWYtYTE0ZjdhYzQ3ODYxIiwiaXNzIjoiaHR0cHM6Ly9hcHAucGFnZXJkdXR5LmNvbS9nbG9iYWwvb2F1dGgvYW5vbnltb3VzIiwiYXVkIjpbImh0dHBzOi8vYXBpLnBhZ2VyZHV0eS5jb20iLCI4ZTkxNDZmZS02NjllLTRjNjctYmIzOC1kODJhODg5YjM2ZWYiXSwic3ViIjoiUElZS0RCTiIsImF1dGhfdGltZSI6MTY2NjE5NTk5NSwiaWF0IjoxNjY2MTk2MDAxLCJwdXJwb3NlIjoiaWQiLCJhdF9oYXNoIjoiNkVqM3dzQUpDa2RPLTVtOFNuU29oUSIsImFjciI6ImFjcjpodG1sLWZvcm06dW5pdGVkc3RhdGVzIiwiZGVsZWdhdGlvbl9pZCI6ImM5YzliYWU1LWVkNzktNDg2Ny04NDQ1LWRmY2FkYmMwMzdiNSIsInByb2R1Y3RfYWJpbGl0aWVzIjpbXSwiYWNjb3VudF9pZCI6IlBFNlJMUTQiLCJ1c2VyX2lkIjoiUElZS0RCTiIsImF6cCI6IjhlOTE0NmZlLTY2OWUtNGM2Ny1iYjM4LWQ4MmE4ODliMzZlZiIsImFtciI6ImFjcjpodG1sLWZvcm06dW5pdGVkc3RhdGVzIiwic3ViZG9tYWluIjoicGR0LWhhbm5lbGUiLCJyZWdpb24iOiJVbml0ZWRTdGF0ZXMiLCJzaWQiOiJLRHo5V2h0bndqWXFKRnEzIn0.qBr2vJG-BkO0zAovDjxSkaxrenqzZC5Mcpy8Li-J37hae44j68PeIEJxMaknNZ3tMOyVjsd8AknjBoW2OeOv6Zk3RQMJd2inXDR9lIkEEMMgZ6PHI_tv3sM-9O4NR9OS4iCUtFMXjv6Sc-Dq_snjaTBw6ZK7vSERYwn57xe99z9JsaDzuLRX3mYhxApEUphr8GSty3TfI-fH_WIbuQhDOa6z8nExcKQWpNX18OEhig9AY2B88P21oBtYR3CnfqcRVH5nIXjAlGvCo6bcPM8MSVAmxY0spDFRNqaKNnPx4WMW_PyU7UxdMEZsO1fDOkTkHaS15FyRCoz0qhk5E3cYkg", "token_type":"bearer", "access_token":"pdus+_EXAMPLE_KEY_ID_EXAMPLE_TOKEN", "refresh_token":"pdus+_EXAMPLE_KEY_ID_EXAMPLE_TOKEN", "scope":"openid write", "expires_in":864000 } ``` Note that our access tokens do expire after a defined period of time — so you may want to make sure that you implement OAuth refresh to prevent users needing to re-authorize your app. See [Token Lifetimes](#token-lifetimes) for the expiries that apply to each type of OAuth functionality. For additional information about the user, account, and PagerDuty service region where your app is now authorized, you can look at [cracking open our PagerDuty-signed ID token](/developer/pagerduty-openid-token). For example, the `aud` field will help your integration with data residency and processing guarantees if you have customers located in Europe. ### Using an Access Token Once obtained, access tokens can be used to make [REST API](/developer/api/reference) requests on behalf of the user. When making an API request, include the version of the API in the `Accept` header. Access tokens must also be sent in the request as part of the `Authorization` header along with the `Bearer` token type, using this format: ```http Authorization: Bearer pdus+_EXAMPLE_KEY_ID_EXAMPLE_TOKEN Accept: application/vnd.pagerduty+json;version=2 ``` #### Troubleshooting: API Call results in 403 This means that although the OAuth credentials are valid, the token does not have access to that particular resource. For example, if you have a token with the read scope and try to write to a resource, it will result in 403. If you think you requested the correct scope and should have access to the resource, double check the `scope` field in the POST Token Endpoint response. If an invalid scope is requested, we currently do not return an error. Instead, we grant partial scopes which will only be the `openid` scope automatically attached to all tokens. Valid scopes for Classic User OAuth: - `Read` access should request the `read` scope (case sensitive) - `Read/Write` should request the `write` scope (case sensitive) For Scoped OAuth, request the specific scopes configured on your app. If a [REST API](/developer/api/reference) endpoint works with Scoped OAuth, the documentation for that endpoint will say "Scoped OAuth requires:" and list the required scope. ### Getting a new Access Token with a Refresh Token > **Securing credentials for non-confidential clients:** Note that we do not recommend storing OAuth client secrets in a browser or mobile app, although it is required to provide your credentials when implementing OAuth refresh (including the client secret). > Long-term, we would currently recommend using a [Backend-for-Frontend](https://datatracker.ietf.org/doc/html/draft-ietf-oauth-browser-based-apps#section-6.2) to store your OAuth client credentials securely. As mentioned, all of our current access tokens have an expiration date defined, so it would be to your benefit to implement OAuth refresh to prevent your users from logging in unnecessarily. Exchanging the refresh token for the access token is similar to using an authorization code: send a POST request to the Token Endpoint, but using the `refresh_token` grant type instead. The body of the request should include the following parameters: `client_id`, `client_secret`, the `refresh_token` previously received from PagerDuty, and `grant_type=refresh_token`. The content type should still be `application/x-www-form-urlencoded`. ```bash curl -X POST https://identity.pagerduty.com/oauth/token \ --header "Content-Type: application/x-www-form-urlencoded" \ --data-urlencode "grant_type=refresh_token" \ --data-urlencode "client_id={CLIENT_ID}" \ --data-urlencode "client_secret={CLIENT_SECRET}" \ --data-urlencode "refresh_token=pdus+_EXAMPLE_KEY_ID_EXAMPLE_TOKEN" ``` A successful response will include a new access token and a new refresh token: ```json { "token_type": "bearer", "access_token": "pdus+_EXAMPLE_KEY_ID_EXAMPLE_TOKEN", "refresh_token": "pdus+_EXAMPLE_KEY_ID_EXAMPLE_TOKEN", "scope": "openid write", "expires_in": 864000 } ``` ### Sample Code |Language|GitHub Repository| |-|-| |Javascript / Node.js|[pagerduty-oauth-sample-node](https://github.com/PagerDuty/pagerduty-oauth-sample-node)| |Python 3|[pagerduty-oauth-sample-python](https://github.com/PagerDuty/pagerduty-oauth-sample-python)| |Javascript, single page app with PKCE|[pagerduty-bulk-user-mgr-sample](https://github.com/PagerDuty/pagerduty-bulk-user-mgr-sample)| #### Generating a code verifier and challenge The `code_verifier` is a high-entropy random string, and the `code_challenge` is the Base64 URL encoded (without padding) SHA-256 digest of it. Since JavaScript's built-in Base64 operations are not Base64 URL encoded, we provide a generation mechanism here: ```javascript /* * Example of using these functions: * * const pkce = await generateCodePackage(); * * // These two fields are for leg 1: * pkce.code_challenge; * pkce.code_challenge_method; * * // This will need to be stored in sessionStorage, such that it is * // available when the page returns via redirect (leg 3): * pkce.code_verifier; */ async function generateCodePackage() { // 96 random bytes encode to a 128 character Base64 URL string, the maximum // code_verifier length allowed by the PKCE specification. const code_verifier = base64UrlEncode(window.crypto.getRandomValues(new Uint8Array(96))); // The challenge is the SHA-256 digest of the ASCII bytes of the verifier. const digest = await window.crypto.subtle.digest( "SHA-256", new TextEncoder().encode(code_verifier) ); return { code_verifier: code_verifier, code_challenge: base64UrlEncode(new Uint8Array(digest)), code_challenge_method: "S256", }; } function base64UrlEncode(bytes) { return btoa(String.fromCharCode.apply(null, bytes)) .replace(/\+/g, "-") .replace(/\//g, "_") .replace(/=+$/, ""); } ``` ## Token Lifetimes The tokens and user authorization involved in PagerDuty OAuth have a finite lifetime. All Classic User OAuth clients have the following expiry settings: - access token expiry of 30 days - refresh token expiry of 210 days - rolling refresh window of 3 years This means that if your Classic User OAuth app implements the refresh token flow, your customers will be able to use that app continuously with PagerDuty for three years, as long as there is some kind of activity with PagerDuty at least once every 210 days. For Scoped OAuth expiries, see [Token Lifetimes](/developer/private-apps#token-lifetimes) on Private Apps. ## Revoking Tokens In the event you believe your application's OAuth tokens to be compromised, you may choose to revoke all tokens currently issued to the application via the [App Registration](/developer/register-an-app) UI. The following options are available on the OAuth functionality Client screen of a PagerDuty App: 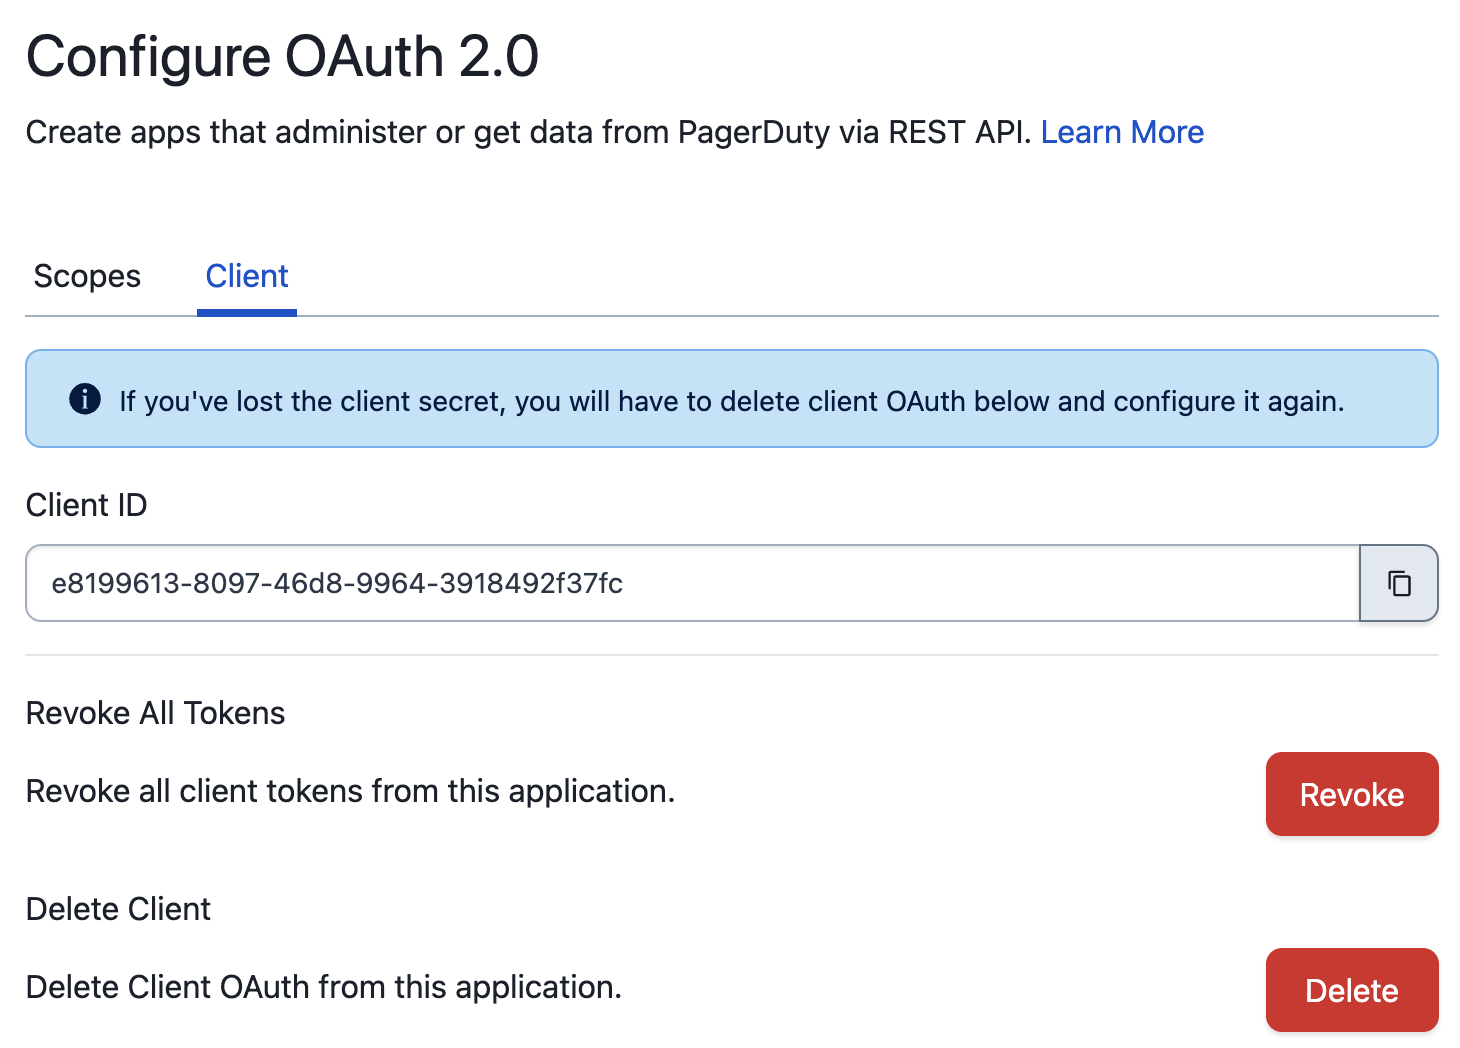 The "Revoke All Tokens" operation will invalidate all OAuth tokens for the current application. In the event you believe your application's `client_secret` to be compromised, you may choose to delete OAuth functionality from the application and recreate it. > **Note:** Deleting the OAuth functionality _does not_ automatically revoke existing tokens. If you wish to perform both operations, you must revoke > all tokens _before_ deleting the OAuth functionality. ## Developer Agreement Your access to and use of the PagerDuty Developer Services is governed by the [PagerDuty Developer Agreement](/developer/pagerduty-developer-agreement). --- URL: https://docs.pagerduty.com/developer/on-premise-agents # PagerDuty On-Prem Agent Lists PagerDuty's officially supported pdagent and community-maintained agents that connect on-prem tools like Nagios and Zabbix. The PagerDuty Agent is a program that lets you easily integrate your monitoring system with PagerDuty. The officially supported agent is `pdagent` and the full documentation can be found [here](/integrations/pagerduty-agent-integration-guide). A full list of PagerDuty agents is provided below. > **Community Support:** PagerDuty does not endorse or provide technical support for any API libraries or tools created and maintained by our user community. | Project Name | Language | Links | Integrates With | Supported By | |:-------------|:---------|:-----------------|:-----------|:-------------| | pdagent | Python | [Agent Install Guide](/integrations/pagerduty-agent-integration-guide), [PagerDuty/pdagent](https://github.com/PagerDuty/pdagent) | Nagios, Sensu, Zabbix | PagerDuty | | go-pdagent* | Golang | [PagerDuty/go-pdagent](https://github.com/PagerDuty/go-pdagent/) | | PagerDuty | | go-pdagent | Golang | [m-masataka/go-pdagent](https://github.com/m-masataka/go-pdagent) | Zabbix | Community | *This project originated inside of PagerDuty with the eventual goal of replacing the Python based `pdagent`. ## Developer Agreement Your access to and use of the PagerDuty Developer Services is governed by the [PagerDuty Developer Agreement](/developer/pagerduty-developer-agreement). --- URL: https://docs.pagerduty.com/developer/pagerduty-developer-agreement # PagerDuty Developer Agreement Sets out the legal terms governing your use of PagerDuty's APIs, MCP servers, and related developer service documentation. Last Modified: September 30, 2026 THANK YOU FOR YOUR INTEREST IN THE PAGERDUTY DEVELOPER AGREEMENT. WE WANT TO MAKE SURE YOU UNDERSTAND YOUR RIGHTS AND OBLIGATIONS REGARDING YOUR USE OF PAGERDUTY DEVELOPER SERVICES, INCLUDING PAGERDUTY API(S), PAGERDUTY MCP SERVER(S), AND RELATED DOCUMENTATION, UNDER THIS AGREEMENT. THIS PAGERDUTY DEVELOPER AGREEMENT ("AGREEMENT") IS A LEGAL BINDING AGREEMENT BETWEEN YOU OR THE COMPANY YOU REPRESENT (“YOU” OR “YOUR”) AND PAGERDUTY, INC. (“US”, “WE” OR “OUR”) GOVERNING YOUR ACCESS TO AND USE OF THE PAGERDUTY DEVELOPER SERVICES. BY ACCESSING OR USING ANY PAGERDUTY DEVELOPER SERVICES OR CLICKING A BOX INDICATING ACCEPTANCE, YOU, (A) ACKNOWLEDGE THAT YOU HAVE READ AND UNDERSTAND THIS AGREEMENT; (B) REPRESENT AND WARRANT THAT YOU HAVE THE RIGHT, POWER, AND AUTHORITY TO ENTER INTO THIS AGREEMENT; AND (C) ACCEPT THIS AGREEMENT AND AGREE THAT YOU ARE LEGALLY BOUND BY ITS TERMS. IF YOU DO NOT AGREE WITH THE TERMS OF THIS AGREEMENT, YOU SHOULD NOT INDICATE ACCEPTANCE AND YOU MUST NOT ACCESS OR USE THE PAGERDUTY DEVELOPER SERVICES. **1\. Definitions.** (a) "PagerDuty Developer Services" means the application programming interfaces, Model Context Protocol code, software and servers, and any other developer services, along with their related access, authentication or security tokens, Developer Accounts, documentation or other materials, made available by Us at [https://docs.pagerduty.com/developer](/developer). (b) "PagerDuty Developer Service Token" means any of the access, authentication or security keys We make available for You to access the PagerDuty Developer Services. (c) “Marks" means Your and/or Our proprietary trademarks, trade names, branding, or logos made available for use pursuant to this Agreement. (d) "Our Products" means the PagerDuty products and services that can be accessed by the PagerDuty Developer Services made available by Us to You. (e) “Party” means You or Us, individually. “Parties” means You and Us, collectively. (f) “Developer Account” means the PagerDuty developer account(s), as further described in Section 3, including the PagerDuty Developer Service Token for those account(s), established by You to enable You to access and use the PagerDuty Developer Services. (g) "Your Applications" means web, artificial intelligence or other software services or applications developed by You to interoperate with Our Products using the PagerDuty Developer Services and also includes any related materials, such as integration guides, support materials and product documentation, for such services or applications. **2\. License Grants.** (a) **License Grant to You.** Subject to and conditioned upon Your compliance with all terms and conditions set forth in this Agreement, We hereby grant You a limited, revocable, non-exclusive, non-transferable, non-sublicensable license during the term of the Agreement to: (i) use the PagerDuty Developer Services solely for Your internal business purposes in developing Your Applications that will communicate and interoperate with Our Products; and (ii) subject to Your compliance with Section 2(c) below, display certain of Our Marks in compliance with usage guidelines that We may specify from time to time. You acknowledge that there are no implied licenses granted to You under this Agreement. We reserve all rights that are not expressly granted. Some of the code or software that We provide for use with the PagerDuty Developer Services may be open source software and governed by open source licenses. If an applicable open source license provisions conflicts with this Agreement, the terms of the open source license will control for those provisions. (b) **License Grant to PagerDuty.** By using the PagerDuty Developer Services, You are granting Us a non-exclusive, royalty free, non-transferrable, non-sublicensable, world-wide right to provide, operate, maintain and improve the PagerDuty Developer Services, as well as to market, display and distribute information related to Your Applications and their interoperability with Our Products on Our website or other materials. (c) **Marks and Publicity.** (i) **Display of Interoperability.** Upon Your submission and Our acceptance and publication of Your Applications as required in Section 5(a), You may display Our Marks for the limited purpose of identifying the interoperability between Your Applications and Our Product, and to include a link from Your Applications to Our website or other location we specify. (ii) **No Publicity by You.** Other than allowed in Section 2(c)(i), You will not make any other public or marketing announcements in respect of this Agreement or the transactions contemplated hereby or otherwise communicate with any news media without Our prior written consent, review and approval. (iii) **Compliance with Marks Guidelines.** The foregoing licenses in Section 2 are subject to (i) licensee’s compliance with licensor’s Marks guidelines and policies, and (ii) as to the use of Our Marks by You, Your compliance with this Agreement. **3\. Developer Account.** We currently offer a free version of the Developer Account. The features and options available for Your Developer Account may change (or we may stop offering a free version altogether). We may also set and enforce limits on use of Your Developer Account and the PagerDuty Developer Services without notice at Our sole discretion. If your use of Your Developer Account exceeds the types of limit imposed by Us and/or we stop offering a free version of the Developer Account, we may require You to purchase paid versions of the PagerDuty Developer Services that matches your actual usage, and, if you refuse to pay or otherwise violate the terms and conditions of this Agreement, we may restrict, with or without notice, all or a part of Your PagerDuty Developer Services usage and/or terminate this Agreement as allowed under Section 12. **4\. Use Restrictions.** You may not use the PagerDuty Developer Services for any other purpose other than the ones listed in Section 2 without Our prior written consent. In addition, except as expressly authorized under this Agreement, You must not, nor have any third party: (a) copy, modify or create derivative works of the PagerDuty Developer Services in whole or in party; (b) rent, lease, lend, sell, license, sublicense, assign, distribute, publish, transfer, or otherwise make available the PagerDuty Developer Services; (c) reverse engineer, disassemble, decompile, decode, adapt, or otherwise attempt to derive or gain access to any software component of the PagerDuty Developer Services, in whole or in part; (d) remove any proprietary notices from the PagerDuty Developer Services, including, any logos, trademarks, links, copyright or other notices, legends or markings; (e) use the PagerDuty Developer Services in any manner or for any purpose that infringes, misappropriates, or otherwise violates any intellectual property right or other right of any person, or that violates any applicable law, rules or regulations (including applicable privacy, export, and AI laws, rules or regulations); (f) use the PagerDuty Developer Services in any manner or for any purpose banned by Our Acceptable Use Policy, located at [https://www.pagerduty.com/acceptable-use-policy/](https://www.pagerduty.com/acceptable-use-policy/); (g) incorporate any spyware, adware, or other malicious programs or code; (h) combine or integrate the PagerDuty Developer Services with any software, technology, services, or materials not authorized by Us; (i) design or permit Your Application(s) to disable, override, or otherwise interfere with any Our communications to Our end users, including consent screens, user settings, alerts, warnings, or the like; (j) use the PagerDuty Developer Services with any of Your Applications to replicate or attempt to replace the user experience of Our Products; (k) use the PagerDuty Developer Services to develop a product competitive to Our Products; or (l) attempt to cloak or conceal Your identity or the identity of Your Application(s) when requesting authorization to use the PagerDuty Developer Services. **5\. Your Additional Responsibilities.** (a) **Integration Review.** You agree to participate in any review or approval process applicable to the integration of Your Applications with Our Products. (b) **Compliance Requirements.** You and Your Applications will comply with all terms and conditions of this Agreement; all applicable laws, rules, and regulations (including applicable privacy, export, and AI laws, rules, and regulations); and all guidelines, standards, and requirements that may be posted on [https://docs.pagerduty.com/developer](/developer) from time to time. You agree that You are solely responsible for posting any privacy notices and obtaining any consents from Your end users required under applicable laws, rules, and regulations for their use of Your Applications. (c) **Protection of Developer Account.** You must not share Your Developer Account or PagerDuty Developer Service Token with any third party; must keep Your Developer Account and PagerDuty Developer Service Token secure; and must use the PagerDuty Developer Service Token as Your sole means of accessing the PagerDuty Developer Services. Your Developer Account and/or PagerDuty Developer Service Token may be revoked at any time by Us at Our sole discretion, with or without notice. If you believe that Your PagerDuty Developer Service Token has been obtained by any other person, or that Your Developer Account has been used in an unauthorized way, You agree to notify US immediately at the contact information provided in Section 19. (d) **Account Responsibility.** You are entirely responsible for any and all activities that occur related or due to Your Developer Account. You agree to monitor the use of Your PagerDuty Developer Services and Your Applications for any activity that violates applicable laws, rules, and regulations or any terms and conditions of this Agreement, and promptly restrict any offending users of Your Applications from further use of Your Applications. You agree to provide a resource for users of Your Applications to report abuse of Your Applications. As between You and Us, You are responsible for all acts and omissions of You and Your end users in connection with Your Applications and their use of the PagerDuty Developer Services. (e) **Infringement Protection.** You will use commercially reasonable efforts to safeguard the PagerDuty Developer Services, Our Products, and Our Marks (including all copies thereof) from infringement, misappropriation, theft, misuse, or unauthorized access. You will promptly notify us if You become aware of any infringement of any intellectual property rights in the PagerDuty Developer Services, Our Products, and Our Marks and will fully cooperate with us, in any legal action taken by us to enforce Our intellectual property rights. (f) **Updates.** We may update or modify the PagerDuty Developer Services from time to time and in Our sole discretion (in each instance, an "Update"). An Update may require You to obtain and use the most recent version(s). Please note an Update may adversely affect how Your Applications communicate with Our Products. As such, You are required to make any such changes to Your Applications that are required for continued interoperability with Our Products as a result of such Update at Your cost and expense. Your continued use of the PagerDuty Developer Services following an Update as Your binding acceptance of the Update. **6\. No Support.** For the free version of the Developer Account, there is no support for the PagerDuty Developer Services or the Developer Account. If You have entered into a separate agreement with Us where We provide support for the PagerDuty Developer Services, You will be provided support for the PagerDuty Developer Services as set forth in that agreement. **7\. Collection and Use of Your Information.** We may collect certain information about You or any of Your employees, contractors, or agents. By accessing, using, and providing information to or through the PagerDuty Developer Services or Our Products, You consent to all actions taken by us with respect to Your information in compliance with the then-current version of Our privacy policy and data protection requirements, available at [https://www.pagerduty.com/privacy-policy/](https://www.pagerduty.com/privacy-policy/). **8\. Intellectual Property.** (a) **Intellectual Property Ownership.** You acknowledge that, as between You and Us, We own all right, title, and interest, including all intellectual property rights, in and to the PagerDuty Developer Services, Our Products, and Our Marks. Excluding these aforementioned rights in this Section 8, We acknowledge that You own all right, title, and interest, including all intellectual property rights, in and to Your Applications and Your Marks. Any goodwill associated with the use of a Party’s Marks by the other Party will inure to the benefit of the Party that is the licensor of the Marks. Also, You will not contest the validity of Our Marks or use or register trademarks, trade names, branding, or logos that are confusingly similar to Our Mark. (b) **Feedback.** If You or any of Your employees, contractors, and agents sends or transmits any communications or materials to us by mail, email, telephone, or otherwise, suggesting or recommending changes to the PagerDuty Developer Services, Our Products, or Our Marks, including without limitation, new features or functionality relating thereto, or any comments, questions, suggestions, or the like ("Feedback"), all such Feedback is and will be treated as non-confidential. You hereby assign to Us on Your behalf, and on behalf of Your employees, contractors, and agents, all right, title, and interest in, and we are free to use, without any attribution or compensation to You or any third party, any ideas, know-how, concepts, techniques, or other intellectual property rights contained in the Feedback, for any purpose whatsoever, although we are not required to use any Feedback. **9\. Disclaimer of Warranties.** THE PAGERDUTY DEVELOPER SERVICES, OUR PRODUCTS, AND OUR MARKS ARE PROVIDED BY US "AS IS" AND WE SPECIFICALLY DISCLAIM ALL WARRANTIES, WHETHER EXPRESS, IMPLIED, STATUTORY, OR OTHERWISE. WE SPECIFICALLY DISCLAIM ALL IMPLIED WARRANTIES OF MERCHANTABILITY, FITNESS FOR A PARTICULAR PURPOSE, TITLE, AND NON-INFRINGEMENT, AND ALL WARRANTIES ARISING FROM COURSE OF DEALING, USAGE, OR TRADE PRACTICE. YOU EXPRESSLY AGREE THAT USE OF THE PAGERDUTY DEVELOPER SERVICES, INCLUDING ALL CONTENT OR DATA DISTRIBUTED BY, DOWNLOADED OR ACCESSED FROM OR THROUGH THE PAGERDUTY DEVELOPER SERVICES OR DEVELOPER ACCOUNT, IS AT YOUR SOLE RISK. WE MAKE NO WARRANTY OF ANY KIND THAT THE PAGERDUTY DEVELOPER SERVICES, OUR PRODUCTS, OR OUR MARKS, OR ANY PRODUCTS OR RESULTS OF THE USE THEREOF, WILL MEET YOUR OR ANY OTHER PERSON'S REQUIREMENTS, OPERATE WITHOUT INTERRUPTION, ACHIEVE ANY INTENDED RESULT, BE COMPATIBLE OR WORK WITH ANY OF YOUR OR ANY THIRD PARTY'S SOFTWARE, SYSTEM OR OTHER SERVICES, OR BE SECURE, ACCURATE, COMPLETE, FREE OF HARMFUL CODE, OR ERROR-FREE, OR THAT ANY ERRORS OR DEFECTS CAN OR WILL BE CORRECTED. SOME JURISDICTIONS MAY NOT ALLOW THE EXCLUSION OF IMPLIED WARRANTIES OR LIMITATIONS ON HOW LONG AN IMPLIED WARRANTY MAY LAST, SO THE ABOVE LIMITATIONS MAY NOT APPLY. IN THAT CASE SUCH WARRANTIES ARE LIMITED IN DURATION TO THE MINIMUM PERIOD REQUIRED BY LAW. NO WARRANTIES APPLY AFTER THAT PERIOD. YOU MAY HAVE OTHER RIGHTS THAT VARY FROM JURISDICTION TO JURISDICTION. **10\. Indemnification.** You agree to indemnify, defend, and hold harmless Us, including but not limited to, Our officers, directors, employees, agents, affiliates, successors, and assigns from and against any and all losses, damages, liabilities, deficiencies, claims, actions, judgments, settlements, interest, awards, penalties, fines, costs, or expenses of whatever kind, including reasonable attorneys' fees, arising from or relating to, (a) Your use or misuse of the PagerDuty Developer Services, Our Products, or Our Marks, (b) Your breach of this Agreement, and (c) Your Applications or Your Marks, including any end user's use thereof. In the event We seek indemnification or defense from You under this provision, We will promptly notify You in writing of the claim(s) brought against Us for which We seek indemnification or defense. We reserve the right, at Our option and in Our sole discretion, to assume full control of the defense of claims with legal counsel of Our choice. You may not enter into any third-party agreement that would, in any manner whatsoever, constitute an admission of fault by Us or bind Us in any manner, without Our prior written consent. In the event We assume control of the defense of such claim, We will not settle any such claim requiring payment from You without Your prior written approval. **11\. Limitations of Liability.** TO THE FULLEST EXTENT PERMITTED UNDER APPLICABLE LAW, IN NO EVENT WILL WE BE LIABLE TO YOU OR TO ANY THIRD PARTY UNDER ANY TORT, CONTRACT, NEGLIGENCE, STRICT LIABILITY, OR OTHER LEGAL OR EQUITABLE THEORY FOR (A) ANY LOST PROFITS, LOST OR CORRUPTED DATA, COMPUTER FAILURE OR MALFUNCTION, INTERRUPTION OF BUSINESS, OR OTHER SPECIAL, INDIRECT, INCIDENTAL, OR CONSEQUENTIAL DAMAGES OF ANY KIND ARISING OUT OF THE USE OR INABILITY TO USE THE PAGERDUTY DEVELOPER SERVICES, OUR PRODUCTS, OR OUR MARKS; OR (B) ANY DAMAGES, IN THE AGGREGATE, IN EXCESS OF ONE HUNDRED DOLLARS (US$100.00), EVEN IF WE HAVE BEEN ADVISED OF THE POSSIBILITY OF SUCH LOSS OR DAMAGES AND WHETHER OR NOT SUCH LOSS OR DAMAGES ARE FORESEEABLE OR WE WERE ADVISED OF THE POSSIBILITY OF SUCH DAMAGES. ANY CLAIM YOU MAY HAVE ARISING OUT OF OR RELATING TO THIS AGREEMENT MUST BE BROUGHT WITHIN ONE YEAR AFTER THE OCCURRENCE OF THE EVENT GIVING RISE TO SUCH CLAIM. THE PARTIES EACH ACKNOWLEDGE AND AGREE THAT THE PARTIES HAVE ENTERED INTO THE AGREEMENT IN RELIANCE UPON THE LIMITATIONS OF LIABILITY SET FORTH IN THIS SECTION 11, THAT THE SAME REFLECTS AN ALLOCATION OF RISK BETWEEN THE YOU AND US, INCLUDING THE RISK THAT A CONTRACT REMEDY MAY FAIL OF ITS ESSENTIAL PURPOSE AND CAUSE CONSEQUENTIAL LOSS, AND THAT THE SAME FORM AN ESSENTIAL BASIS OF THE BARGAIN BETWEEN THE PARTIES. **12\. Term and Termination.** The term of this Agreement commences on the earlier of when You acknowledge Your acceptance of this Agreement by clicking the "I ACCEPT" button (or equivalent) or access the PagerDuty Developer Services, and will continue in effect until terminated as set forth in this Section. We may immediately terminate or suspend this Agreement, any rights granted herein, and/or Your licenses under this Agreement, in Our sole discretion at any time and for any reason. In addition, this Agreement will terminate immediately and automatically without any notice if You violate any of the terms and conditions of this Agreement. You may terminate this Agreement at any time by ceasing Your access to and use of the PagerDuty Developer Services and Our Marks. Upon termination of this Agreement for any reason all licenses and rights granted to You under this Agreement will also terminate and You must cease using, destroy, and permanently erase from all devices and systems You directly or indirectly control all copies of the PagerDuty Developer Services and Our Marks. Any terms that by their nature are intended to continue beyond the termination or expiration of this Agreement will survive termination. Termination will not limit any of Our rights or remedies at law or in equity. **13\. Export Regulation.** The PagerDuty Developer Services may be subject to US export control laws, including the US Export Administration Act and its associated regulations. You must not, directly or indirectly, export, re-export, or release the PagerDuty Developer Services or Our Products to, or make the PagerDuty Developer Services or Our Products accessible from, any jurisdiction or country to which export, re-export, or release is prohibited by law, rule, or regulation. You must comply with all applicable federal laws, regulations, and rules, and complete all required undertakings (including obtaining any necessary export license or other governmental approval), prior to exporting, re-exporting, releasing, or otherwise making the PagerDuty Developer Services or Our Products available outside the US. **14\. US Government Rights.** The PagerDuty Developer Services is a "commercial item" as that term is defined at 48 C.F.R. § 2.101, consisting of "commercial computer software" and "commercial computer software documentation" as such terms are used in 48 C.F.R. § 12.212. Accordingly, if You are an agency of the US Government or any contractor therefor, You receive only those rights with respect to the PagerDuty Developer Services as are granted to all other end users under license, in accordance with (a) 48 C.F.R. § 227.7201 through 48 C.F.R. § 227.7204, with respect to the Department of Defense and their contractors, or (b) 48 C.F.R. § 12.212, with respect to all other US Government licensees and their contractors. **15\. Modifications.** You acknowledge and agree that We have the right, in Our sole discretion, to modify this Agreement from time to time. Where a new version of this Agreement is created by Us, We will date and post the new version for Your review at [https://docs.pagerduty.com/developer](/developer). Your continued use of the PagerDuty Developer Services after a new version of this Agreement is created by Us will be subject to the new version of this Agreement. You will be responsible for reviewing and becoming familiar with any such modifications. **16\. Governing Law and Jurisdiction.** This agreement is governed by and construed in accordance with the internal laws of the State of California without giving effect to any choice of conflict of law provision or rule that would require or permit the application of the laws of any jurisdiction other than those of the State of California. Any legal suit, action, or proceeding arising out of or related to this agreement or the licenses granted hereunder will be instituted exclusively in the federal courts of the United States or the courts of the State of California, in each case located in the City and County of San Francisco, and You irrevocably submit to the exclusive jurisdiction and venue of such courts in any such suit, action, or proceeding. To the extent permitted by law, choice of law rules, the United Nations Convention on Contracts for the International Sale of Goods, and the Uniform Computer Information Transactions Act as enacted shall not apply. Notwithstanding the foregoing, either Party may at any time seek and obtain appropriate legal or equitable relief in any court of competent jurisdiction for claims regarding such Party’s intellectual property rights. **17\. Entire Agreement.** This Agreement constitutes the entire agreement and understanding between You and Us with respect to the subject matter hereof and supersedes all prior and contemporaneous understandings, agreements, representations, and warranties, both written and oral, with respect to such subject matter. **18\. Further Assurances.** Each Party will, and will cause their respective Affiliates to, execute and deliver such additional documents, instruments, conveyances, and assurances and take such further actions as may be required to carry out the provisions hereof and give effect to the transactions contemplated herein. **19\. Notice.** Any notices to Us must be sent to Our corporate headquarters address at PagerDuty Inc., 600 Townsend St #200, San Francisco, CA 94103 and must be delivered either in person, by certified or registered mail, return receipt requested and postage prepaid, or by recognized overnight courier service, with a copy sent to the attention of PagerDuty General Counsel, and each are deemed given upon receipt by Us. Notwithstanding the foregoing, You hereby consent to receiving electronic communications from Us. These electronic communications may include notices about applicable fees and charges, transactional information, changes to this Agreement and other information concerning or related to the PagerDuty Developer Services. You agree that any notices, agreements, disclosures, or other communications that we send to You electronically will satisfy any legal communication requirements, including that such communications be in writing. **20\. Interpretation.** For purposes of this Agreement, (a) the words "include," "includes," and "including" are deemed to be followed by the words "without limitation;" (b) the word "or" is not exclusive; and (c) the words "herein," "hereof," "hereby," "hereto," and "hereunder" refer to this Agreement as a whole. Unless the context otherwise requires, references herein: (x) to sections, schedules, and exhibits mean the sections of, and schedules and exhibits attached to, this Agreement; (y) to an agreement, instrument, or other document means such agreement, instrument, or other document as amended, supplemented, and modified from time to time to the extent permitted by the provisions thereof; and (z) to a statute means such statute as amended from time to time and includes any successor legislation thereto and any regulations promulgated thereunder. This Agreement will be construed without regard to any presumption or rule requiring construction or interpretation against the Party drafting an instrument or causing any instrument to be drafted. The schedules and exhibits referred to herein will be construed with, and as an integral part of, this Agreement to the same extent as if they were set forth verbatim herein. **21\. Headings.** The headings in this Agreement are for reference only and will not affect the interpretation of this Agreement. **22\. Assignability.** This Agreement is personal to You and may not be assigned or transferred for any reason whatsoever without Our prior written consent and any action or conduct in violation of the foregoing will be void and without effect. This Agreement will be binding upon and will inure to the benefit of Us and Our respective permitted successors and permitted assigns. **23\. No Third-Party Beneficiaries.** This Agreement is for the sole benefit of the Parties hereto and their respective successors and permitted assigns and nothing herein, express or implied, is intended to or will confer upon any other person or entity any legal or equitable right, benefit, or remedy of any nature whatsoever under or by reason of this Agreement. **24\. Severability.** The invalidity, illegality, or unenforceability of any provision herein does not affect any other provision herein or the validity, legality, or enforceability of such provision in any other jurisdiction. Any failure to act by Us with respect to a breach of this Agreement by You or others does not constitute a waiver and will not limit Our rights with respect to such breach or any subsequent breaches. **25\. Waiver.** No waiver of any provisions by Us be effective unless explicitly set forth in writing and signed by Us. No waiver by Us will operate or be construed as a waiver in respect of any failure, breach, or default not expressly identified by such written waiver, whether of a similar or different character, and whether occurring before or after that waiver. No failure to exercise, or delay in exercising, any right, remedy, power, or privilege arising from this Agreement will operate or be construed as a waiver thereof; nor will any single or partial exercise of any right, remedy, power, or privilege hereunder preclude any other or further exercise thereof or the exercise of any other right, remedy, power, or privilege. **26\. Cumulative Remedies.** The rights and remedies under this Agreement are cumulative and are in addition to and not in substitution for any other rights and remedies available at law or in equity or otherwise, except to the extent expressly provided to the contrary herein. **27\. Equitable Remedies.** The Parties agree that irreparable damage may occur if any provision of this Agreement were not performed in accordance with the terms hereof and that the Parties may be entitled to equitable relief, including injunctive relief or specific performance of the terms hereof, in addition to any other remedy to which they are entitled at law or in equity. **28\. Force Majeure.** No Party will be liable or responsible to the other Party, nor be deemed to have defaulted under or breached this Agreement, for any failure or delay in fulfilling or performing any term of this Agreement, when and to the extent such failure or delay is caused by or results from acts beyond the affected Party's reasonable control, including, without limitation: (a) acts of God; (b) flood, fire, earthquake, or explosion; (c) war, invasion, hostilities (whether war is declared or not), terrorist threats or acts, riot, or other civil unrest; (d) government order or law; (e) actions, embargoes, or blockades in effect on or after the date of this Agreement; (f) action by any governmental authority; (g) national or regional emergency; (h) strikes, labor stoppages or slowdowns, or other industrial disturbances; and (i) shortage of adequate power or transportation facilities. The Party suffering a Force Majeure Event will give notice to the other Party within three days of the Force Majeure Event, stating the period of time the occurrence is expected to continue and will use diligent efforts to end the failure or delay and ensure the effects of such Force Majeure Event are minimized. **29\. Relationship of the Parties.** Nothing herein will be construed to create a joint venture or partnership between the Parties hereto or an employer/employee or agency relationship. Neither Party will have any express or implied right or authority to assume or create any obligations on behalf of or in the name of the other Party or to bind the other Party to any contract, agreement, or undertaking with any third party. --- URL: https://docs.pagerduty.com/developer/pagerduty-openid-token # PagerDuty OpenID ID Token Explains the JWT-based ID token PagerDuty issues alongside OAuth access tokens to convey account subdomain and region claims. PagerDuty uses ID Tokens [as defined by the OpenID specification][openid] to securely provide additional details (also called claims) associated with your access token, such as the account subdomain and service region. These tokens are structured as [JSON Web Tokens (JWT)](https://datatracker.ietf.org/doc/html/rfc7519). The token is encoded and signed by PagerDuty. [openid]: https://openid.net/specs/openid-connect-core-1_0.html#IDToken URL Name | URL | Description ----------------|------|------------ Public Key URL | https://identity.pagerduty.com/global/oauth/anonymous/jwks | Use the public key to verify that the token is unmodified and sent by PagerDuty Open ID Configuration | https://identity.pagerduty.com/global/oauth/anonymous/.well-known/openid-configuration | Additional details on OpenID features supported by PagerDuty The ID token will be returned with the access token on a successful call to `oauth/token`: ``` eyJraWQiOiIxNzg3MzQ1MDA4IiwieDV0IjoiX2Nxbk1aWlBBcEF0V3kyVm11T1Y4dUc5VHNvIiwiYWxnIjoiUlMyNTYifQ.eyJleHAiOjE2NDYwODYyNjAsIm5iZiI6MTY0NjA4MjY2MCwianRpIjoiYTlmZDQzYTQtYjAzNy00ZWViLTk4YjAtNDA1NDJlM2I5OGZmIiwiaXNzIjoiaHR0cHM6Ly9hcHAucGQtc3RhZ2luZy5jb20vZ2xvYmFsL29hdXRoL2Fub255bW91cyIsImF1ZCI6WyJodHRwczovL2FwaS5wZC1zdGFnaW5nLmNvbSIsIjkwYjE1M2JmLWNmZWItNDgzNy04YjZhLTg2NGI3ZmY4NTY1NiJdLCJzdWIiOiJmdGFudGF3aUBwYWdlcmR1dHkuY29tIiwiYXV0aF90aW1lIjoxNjQ2MDgyNjQ5LCJpYXQiOjE2NDYwODI2NjAsInB1cnBvc2UiOiJpZCIsImF0X2hhc2giOiJMTXRGS01MWWVGZXppTnR4OVBKV0hBIiwiYWNyIjoiYWNyOmh0bWwtZm9ybTp1bml0ZWRzdGF0ZXMiLCJkZWxlZ2F0aW9uX2lkIjoiNjU2NjAyN2QtNzcwNy00MjhmLTg3NTItM2VmOTcxYjc4ZDFhIiwiYWNjb3VudF9pZCI6IlA5SkVITUsiLCJ1c2VyX2lkIjoiUDhPR01JSyIsImF6cCI6IjkwYjE1M2JmLWNmZWItNDgzNy04YjZhLTg2NGI3ZmY4NTY1NiIsImFtciI6ImFjcjpodG1sLWZvcm06dW5pdGVkc3RhdGVzIiwic3ViZG9tYWluIjoicGR0LWZhcmVzIiwicmVnaW9uIjoiVW5pdGVkU3RhdGVzIiwic2lkIjoiTGR1Mm03RnFuUDdjSDZHbCJ9.uhbXVou8raKUtx56D8pGmWn3VyX8X1ZhadKYAwftcnc5DNHvEXco8MJKle8w5a1v1f9l881eGHLCsrRUb-B0AOHsWVF0EJTGOhWKgVpx9_SrsGXa7qyVlS3fBh-Gh2IrvDHTBWfe2bQ2g_qEfvCneIBIaELVdOeCysxMShygYgd7iOWwM6m3KGNrtCM4RK0JqYSdTRFpXP-OCBVy6JenJqK3maevffi0-7Z0Q0XFuMIwRR-M3A90Wt9349AhwXNK2kL7mvI3ZltnuomoTcB6rRMUylTp7YXyFjhc4nwA8ZlBw6T8SYPvjXy7iRE0ud4TxEh0J_bfs0gOfqgvKY47aQ ``` The main parts of the ID token are the following: Name | Description ----------------- | ----------- `Header` | Contains token metadata such as the type of token and hash used `Payload` | Contains the user, authorization, and claims `Signature` | Used to verify the token and check for tampering Each part of the token is encoded using the algorithm specified in the header, split by `.`. Every part is structured in the JSON format. ## Header The header includes three fields. The algorithm used to encrypt and decrypt the token is a variant of SHA-256 called RS256, and is declared as the first part of the header. The next part of the header is the Key ID, which is later used for verification. The last part is the certificate (x5t) which is base64url encoded. Putting these parts together, the header is formed. The main purpose of the header is to determine a decoding algorithm to use for the rest of the token and what key is used for validation. All valid header parameters can be found [here](https://datatracker.ietf.org/doc/html/rfc7515#section-4.1), but the most common ones are the following: Claim | Description ----------------- | ----------- `alg` | Algorithm used for signature of the token `kid` | At a given point, PagerDuty may support multiple signing keys. This id identifies which signing key was used for this token. `x5t` | Fingerprint of the certificate used In the sample ID token above, the header portion is the first section: ```eyJraWQiOiIxNzg3MzQ1MDA4IiwieDV0IjoiX2Nxbk1aWlBBcEF0V3kyVm11T1Y4dUc5VHNvIiwiYWxnIjoiUlMyNTYifQ``` After being base64 decoded, the sample JSON header looks something like this: ``` json { "alg": "RS256", "kid": "1787345008", "x5t": "_cqnMZZPApAtWy2VmuOV8uG9Tso" } ``` ## Payload The payload contains claims about the access token, which are statements about the user along with any additional data needed. PagerDuty uses two types of claims: Type | Description ----------------- | ----------- Registered Claims | Predefined recommended claims that are reserved by [the JWT standard](https://datatracker.ietf.org/doc/html/rfc7519#section-4.1). The most common ones used are `iss` (issuer), `aud` (audience), `sub` (subject), `exp` (expiration time). Some of the less common ones are `nbf` (not before), `iat` (issued at), and `jti` (JWT ID). Private Claims | PagerDuty includes a number of private claims related to the user and account for convenience. The claims included in the PagerDuty ID Token are described here in detail: Claim | Description ---------------- | ---------------------------------- `exp` | Expiry time, in a Unix timestamp `nbf` | Unix timestamp that identifies the time before the ID Token must NOT be accepted (not before) `jti` | Unique JWT ID `iss` | The principal/issuer that issued the ID Token. This should always be `https://identity.pagerduty.com/global/oauth/anonymous`. `aud` | Intended receiver of the token (audience). For PagerDuty ID Tokens, this will include a URL specific to the account's service region, either `https://api.pagerduty.com` or `https://api.eu.pagerduty.com`, as well as the client ID. `sub` | Subject of the ID Token. For PagerDuty ID tokens, this can be used to uniquely identify the user that authorized the oauth client. `auth_time` | Time when authentication occurred, in a Unix timestamp `iat` | Time when the ID Token was issued, in a Unix timestamp `purpose` | Purpose of the JWT. For PagerDuty ID tokens, this is always identification. `at_hash` | Hash value of corresponding access token issued `acr` | The authentication context class reference, which gives context about how the user authenticated the oauth client. `delegation_id` | A delegation represents that authorization was granted by a user to your oauth client, similar to a session. It will be consistent across the history of all access tokens and refresh tokens for that authorization. `account_id` | PagerDuty account ID linked to the token `user_id` | PagerDuty user ID linked to the token `azp` | The authorized party that was issued the ID Token, which is the client ID `amr` | Authentication method references. Similar to the `acr` field, this gives context about how the user authenticated the oauth client. `subdomain` | PagerDuty subdomain linked to the ID token `region` | User and account service region `sid` | Session ID Here is a sample decrypted payload for a PagerDuty ID token: ```json { "exp": 1646086260, "nbf": 1646082660, "jti": "a9fd43a4-b037-4eeb-98b0-40542e3b98ff", "iss": "https://identity.pagerduty.com/global/oauth/anonymous", "aud": [ "https://api.pagerduty.com", "90b153bf-cfeb-4837-8b6a-864b7ff85656" ], "sub": "example@pagerduty.com", "auth_time": 1646082649, "iat": 1646082660, "purpose": "id", "at_hash": "LMtFKMLYeFeziNtx9PJWHA", "acr": "acr:html-form:unitedstates", "delegation_id": "6566027d-7707-428f-8752-3ef971b78d1a", "account_id": "P9JEHMK", "user_id": "P8OGMIK", "azp": "90b153bf-cfeb-4837-8b6a-864b7ff85656", "amr": "acr:html-form:unitedstates", "subdomain": "pdt-sample", "region": "UnitedStates", "sid": "Ldu2m7FqnP7cH6Gl" } ``` ## Signature The signature is used to verify that the message still has its original integrity and hasn't been tampered with and is sent from a trusted issuer. You can find the public key that PagerDuty uses to sign the token at the following URL: https://identity.pagerduty.com/global/oauth/anonymous/jwks Please note however that the signing key could be rotated at any time, so we would recommend fetching the signing key from PagerDuty on each use instead of storing it locally. This signature is created using the hash algorithm from the header, and to verify a token, you must do the following: * Retrieve the algorithm used to hash the token from the header * Use the `x5t` or `kid` parameter from the header to retrieve the public key * Separate the signature from the message * Convert the remaining parts to an ASCII array * Decode the signature using Base64Url * Use the decoded signature to validate the ASCII array generated previously ## Decoding the full ID token with Node and Javascript Once an ID token has been received from PagerDuty, it can be decrypted. The following code sample uses [jsonwebtoken], [jwks-rsa], and [node https] to fetch the public PagerDuty key, verify the signature on the ID Token, and returns a Promise that contains the extracted payload details. [jsonwebtoken]: https://www.npmjs.com/package/jsonwebtoken [jwks-rsa]: https://www.npmjs.com/package/jwks-rsa [node https]: https://nodejs.org/api/https.html ```javascript function verifyAndExtractIdTokenPayload(oauthTokenResponseJson) { const jwt = require('jsonwebtoken'); const jwksClient = require('jwks-rsa'); const https = require('https'); const { idToken, domain, jwtIssuer } = oauthTokenResponseJson; return new Promise((resolve, reject) => { https.get('https://identity.pagerduty.com/global/oauth/anonymous/jwks', (jwksResponse) => { let jwksData = ''; jwksResponse.on('data', (chunk) => { jwksData += chunk; }); jwksResponse.on('end', () => { const client = jwksClient({ jwksUri: JSON.parse(jwksData).jwks_uri }); jwt.verify( idToken, async (header, cb) => { const key = await client.getSigningKey(header.kid); const signingKey = key.getPublicKey(); cb(null, signingKey); }, { algorithms: ['RS256'], issuer: jwtIssuer }, (err, decodedToken) => { if (err) { reject(`ID Token signature validation failed due to ${err}`); } else { resolve(decodedToken); } } ); }).on('error', (err) => { reject(`Fetching the PagerDuty public key failed due to ${err}`); }); }); }); } ``` ## Developer Agreement Your access to and use of the PagerDuty Developer Services is governed by the [PagerDuty Developer Agreement](/developer/pagerduty-developer-agreement). --- URL: https://docs.pagerduty.com/developer/pagination # Pagination Covers classic offset-and-limit pagination plus the newer cursor-based pagination now supported on some index endpoints. When you retrieve a collection over the API, the results are returned in portions, also known as pages. > **Note:** Currently, most endpoints use classic pagination. However, a growing list of [endpoints support cursor-based pagination.](#endpoints-supporting-cursor-based-pagination) ## Classic pagination Many [index endpoints](/developer/endpoints#resources-index) employ the classic pagination approach. Initially, only a certain number of results will be returned at a time. The default is 25. You can override this by passing a `limit` parameter to set the maximum number of results, but cannot exceed 100. Specifying a number for `offset` sets the starting point for the result set, allowing you to fetch subsequent resources that are not in the initial set of results. Every response from endpoints employing this pagination approach contains additional fields, as seen in the example below: ### Classic Pagination Response Fields ```json { "limit": 25, // echoes the 'limit' value that was used "offset": 0, // echoes the 'offset' value that was used "more": true, // indicates if there are more resources available than were returned "total": 44 // the total number of resources matching the query } ``` The `more` field will always be `true` or `false`, indicating whether there are more resources matching the query than present in the response (because of the request's `limit`). If `true`, you may want to make subsequent requests with a different `offset` until `more` is `false` in order to retrieve all of the resources. The `total` field is `null` by default. This behavior will provide the fastest response times when the total number of records is not important. If you need to know how many records match the query, pass a `total=true` parameter as part of the request and this field will be populated. > **Maximum upper limit of classic pagination:** The REST API permits retrieving a maximum of 10000 records via pagination. That is to say, the sum of the `offset` and `limit` parameters cannot exceed 10000, or the REST API will respond with status 400. > If the `total` parameter is greater than 10000, then not all records in the set can be retrieved. As an alternative, one should constrain the results to under 10000 by [using a filter](/developer/filtering) and then adjust the filter to encompass more of the target set to be retrieved. ## Cursor-based pagination Responses from PagerDuty APIs employing cursor-based pagination will include the following fields: ### Cursor-Based Pagination Response Fields ```json { "limit": 25, // The minimum of the 'limit' parameter used in the request or the maximum request size of the API "next_cursor": "UExIMUhLVg==" // An opaque string used to fetch the next set of results or 'null' if no additional results are available } ``` The next set of results can be obtained by providing the `next_cursor` value from the previous request in a `cursor` query parameter on the subsequent request. Excluding the `cursor` query parameter will return results from the beginning of the list. When a response returns a `null` value for `next_cursor` then the end of the list has been reached. ### Endpoints supporting cursor-based pagination * [/audit/records](/developer/api/reference/rest/audit/list-audit-records) ## Developer Agreement Your access to and use of the PagerDuty Developer Services is governed by the [PagerDuty Developer Agreement](/developer/pagerduty-developer-agreement). --- URL: https://docs.pagerduty.com/developer/pcl-overview # PagerDuty Condition Language (PCL) Introduces the boolean expression syntax PCL uses to write conditions for Event Orchestrations beyond what Rulesets allow. The PagerDuty Condition Language (PCL) gives [Event Orchestrations](/ai-automation/aiops/event-orchestration) the power of boolean expressions, more powerful than are available with Rulesets. For example, with PCL, you can now define an expression like: ``` event.summary matches part 'prod' and (event.location == 'US' or event.location == 'Canada') ``` This document will provide an overview of the PCL expression language. ## Syntax ### Expressions A PCL expression is made up of a combination of paths, literals, built-in operations, and custom functions. Evaluation of an expression follows the rules of precedence described below. The final PCL expression must evaluate to `true` or `false`. A sub-expression can return a different type of value, such as an integer or string. As long as this non-boolean is used in the proper context, an error will not be returned. During evaluation, a sub-expression might not be able to evaluate successfully. This will result in an evaluation warning but will _not_ prevent the expression from being evaluated as a whole. See [Non-Boolean Evaluation] for more details. ### Precedence PCL expressions are made up of boolean sub-expressions and the final expression must return a boolean value. Sub-expressions can be combined with `and`, `or`, and `not` to form more complex boolean expressions. When creating expressions, these precedence rules apply: 1. parenthesized expressions 2. built-in operations 3. custom functions 4. `not` 5. `and` 6. `or` For example: ``` event.x > 5 and not event.y < 6 or event.z == 2 ``` is treated the same as: ``` ((event.x > 5) and (not (event.y < 6))) or (event.z == 2) ``` where: ``` event.x > 5 and (not event.y < 6 or event.z == 2) ``` is treated like: ``` (event.x > 5) and ((not (event.y < 6)) or (event.z == 2)) ``` ### Paths A PCL expression is evaluated within the context of an Event being evaluated by your Event Orchestration. You use a path in your PCL expression to access nested object and array structures from an Event payload. An `event` path can be used to access [PD-CEF fields](/developer/api/pd-cef#pd-cef-fields) like `event.summary` or `event.custom_details.load`. A `raw_event` path can be used to access the values of the JSON Event payload that was originally sent to PagerDuty. Object fields can be accessed using *dot notation* (`"."`). Field names accessed using the dot notation must be a valid identifier. Valid identifiers begin with an ASCII letter (`a-zA-Z`) or an underscore (`"_"`). The following characters of the identifier can be any of those plus the numerical digits (`0-9`). Object field names that do not conform to the identifier description above can be accessed using *bracket notation* by providing the field name as a single-quoted string inside square brackets, e.g. (`object['invalid identifier']`). Also, array elements can only currently be accessed using integers inside square brackets. When a `path` is used in an expression, then it is evaluated to the value at that path in the data context before being used in the expression. If a final path doesn't exist, then `nil` is returned from the expression. The exception to this is the `exists` operation which checks whether or not the path exists in the context. For example, if you sent this JSON payload via the V2 Events API: ```json { "payload": { "custom_details": { "system diagnosis": { "important_field": "This is an important value" } } }, "links": [ { "href": "https://diag.test/details", "text": "Diagnosis details" } ] } ``` You'd be able to access data from that event using these PCL paths: ``` event.custom_details['system diagnosis'].important_field -> "This is an important value" raw_event.links[0].href -> "https://diag.test/details" raw_event.images[0].src -> nil ``` ### Types PCL understands these data types: - strings - integers and floats - booleans - local datetimes - durations - schedules - nil Values of a certain type cannot currently be converted to another type, but some built-in operations will do conversions or handle multiple types. #### String A string is any sequence of utf-8 characters wrapped in single quotes. You can insert a single quote into a string by preceding it with a backslash character to escape it. You can also escape a backslash with a backslash. No other escape sequences are available at this time. ``` 'this is a string' 'Mercury' 'the system\'s down' 'this has a single \\ backslash in it' 'こんにちは世界' ``` #### Number A number can be an integer or a float. A number can be positive or negative. - Integers are 64-bit signed integers between `-2^63` and `2^63 - 1` - Floats are double precision (64-bit) IEEE floating point numbers. They must begin with a digit and must have a decimal point. Scientific notation of floats is also supported using a lowercase `e`. ``` 42 0.7 -12 4.5e10 ``` #### Boolean The values `true` or `false`. Written without quotes. ``` true false ``` #### Local Datetime A moment in time specified with a date, time, and timezone. The date format is `YYYY-MM-DD`. The time uses a 24-hour notation in the format `HH:MM:SS`. The timezone must be a valid entry from the [tz database][1]. ``` 2021-12-04 19:00:42 America/Los_Angeles 2022-01-01 08:00:00 Etc/UTC ``` When you want the current datetime, use [`now`](#now) #### Duration A duration of time that is represented by a positive integer followed by a time unit. The time unit is one of: `"second"`, `"minute"`, `"hour"`, `"day"` with an optional trailing `"s"`. You can string multiple units together as long as you only have one of each maximum. Format: ``` [D day(s)] [h hour(s)] [m minute(s)] [s second(s)] ``` `D`, `h`, `m`, `s` all must be integer values. 1. At least one time unit is required. 2. If more than one time unit is included, the units can be in any order as long as there is only one of each i.e. seconds can come before days can come before minutes, e.g. `5 seconds 3 days 12 minutes` is valid, `4 hours 2 days` is also valid. 3. The trailing "s" in the unit name is optional and does not have any semantic meaning, e.g. `5 hour` is the same as `5 hours`, `1 day` equivalent to `1 days`. ``` 2 minutes 1 hour 1 hour 30 minutes ``` #### Schedule A set of weekdays combined with a time range and a timezone to form a weekly schedule. The day of the week can be one-or-many of: `"Mon"`, `"Tue"`, `"Wed"`, `"Thu"`, `"Fri"`, `"Sat"`, `"Sun"`. Multiple days may be provided by delimiting with commas (no spaces surrounding the commas). These represent the "start" days of a schedule (which becomes more important when the time range spans over multiple days). The order of the days does not matter, but at least one must be provided. The time range is made up of a start and end time separated with the word `"to"`. The times use 24-hour notation in the format `HH:MM:SS`. ``` # Week days from 9am through 9pm using New York time # (EST or EDT depending on the current date) Mon,Tue,Wed,Thu,Fri 09:00:00 to 17:00:00 America/New_York ``` If the end time is "earlier" than the start time, that indicates the time window ends on the next weekday. ``` # From Wed at 10pm through Thurs at 8am using UTC time. 8am is earlier than 10pm. # (UTC never observes daylight saving time) Wed 22:00:00 to 08:00:00 Etc/UTC ``` If the two times are the same, that indicates a 24 hour period. ``` # From Sat noon through Mon noon using Cairo time # (Currently Cairo is on EGY time year round & does not observe daylight saving time) Sat,Sun 12:00:00 to 12:00:00 Africa/Cairo ``` The allowable timezones are defined in the [tz database][1]. When doing comparisons of times, PCL compares the times according to what a clock on the wall would say in that timezone. That is, local daylight saving time is factored in. This can cause slightly unexpected behavior during the times when the clock changes from daylight saving time to standard time and vice versa. For example, when daylight saving time ends, the clocks are changed from 2:00 AM back to 1:00 AM. This means that a wall clock, will repeat the 1:00 AM to 2:00 AM hour that day. Considering a PCL condition that evaluates to `true` from 1:30am through 3:00 AM on Sundays in New York, when the clocks rollback to 1:00 AM, then the half hour between 1:00 AM and 1:30 AM produces a gap in the schedule. The following table shows the evaluation at various points in time around when DST ends: **PCL Schedule: `Sun 01:30:00 to 03:15:00 America/New_York`** Wall Clock Time | UTC Time | Matches Schedule? | Notes -- | -- | -- | -- [01:00 EDT (UTC-0400)](https://www.timeanddate.com/worldclock/converter.html?iso=20211107T050000&p1=179&p2=1440) | 05:00 UTC | ❌ No | 01:30 EDT (UTC-0400) | 05:30 UTC | ✅ Yes | DST ends: [01:00 EST (UTC-0500)](https://www.timeanddate.com/worldclock/converter.html?iso=20211107T060000&p1=179&p2=1440) | 06:00 UTC | ❌ No | This is the gap 01:15 EST (UTC-0500) | 06:15 UTC | ❌ No | This is the gap 01:30 EST (UTC-0500) | 06:30 UTC | ✅ Yes | 02:00 EST (UTC-0500) | 07:00 UTC | ✅ Yes | 02:30 EST (UTC-0500) | 07:30 UTC | ✅ Yes | 03:00 EST (UTC-0500) | 08:00 UTC | ✅ Yes | 03:30 EST (UTC-0500) | 08:30 UTC | ❌ No | Another example similar to the above, but when DST starts. **PCL Schedule: `Sun 01:30:00 to 03:15:00 America/New_York`** Wall Clock Time | UTC Time | Matches Schedule? | Notes -- | -- | -- | -- 00:00 EST (UTC-0500) | 05:00 UTC | ❌ No | 00:30 EST (UTC-0500) | 05:30 UTC | ❌ No | 01:00 EST (UTC-0500) | 06:00 UTC | ❌ No | 01:30 EST (UTC-0500) | 06:30 UTC | ✅ Yes | 01:59 EST (UTC-0500) | 06:59 UTC | ✅ Yes | DST begins: 03:00 EDT (UTC-0400) | 07:00 UTC | ✅ Yes | 2:00 AM skipped to 3:00 AM 03:15 EDT (UTC-0400) | 07:15 UTC | ✅ Yes | 03:30 EDT (UTC-0400) | 07:30 UTC | ❌ No | 04:00 EDT (UTC-0400) | 08:00 UTC | ❌ No | 04:30 EDT (UTC-0400) | 08:30 UTC | ❌ No | #### Nil A `nil` value represents the absence of any other value type. ### Built-in Operations PCL has a variety of built-in operations: - boolean operations: `and`, `or`, `not` - numeric comparison operations: `>`, `>=`, `<`, `<=` - string comparison operations: `matches [exactly]`, `matches part [exactly]`, `matches regex [exactly]` - threshold conditions: `trigger_count`, `resetting_trigger_count` - other operations: `==`, `in`, `exists`, `now` NOTE: `now`, `trigger_count`, and `resetting_trigger_count` are only available to Event Intelligence (EI) customers. If you don't have EI, then trying to create a condition with these functions will return an error. The operations described below will have an initial codeblock which shows the syntax of the operation. It will look something like: ``` [integer] < [integer] -> [boolean] ``` where to the left of the `->` we show the types of the arguments and the way the operation is used, and to the right of the `->`, we show the type of the return value. In both cases the type will be surrounded by `[]` to distinguish it from the operation name. #### Boolean Operations ##### `not` Returns the boolean `not` of the argument, i.e. the opposite boolean value to the one passed in as an argument. ``` not [boolean] -> [boolean] ``` Should be used in combination with the other operators. Has higher precedence than the other boolean operators - use parentheses if you need to change the order of precedence. ```json { "data": { "foo": "code" } } not data.foo matches 'www' -> true not data.missing exists and data.foo matches 'www' -> false not (data.missing exists and data.foo matches 'www') -> true not (data.foo exists and data.foo matches 'code') -> false ``` A `not` will also treat [Non-Boolean Evaluations][Non-Boolean Evaluation] as `false`. Expression | Evaluates like | Result | Explanation -- | -- | -- | -- `raw_event.invalid_path > 2` | `nil > 2` | ❌ `false` | `>` can only compare two `[number]` or `[date]` types but got `[nil] > [number]` `not raw_event.invalid_path > 2` | `not (nil > 2)` | ✅ `true` | `nil > 2` evaluates as `false` and then `not` inverts the result. ##### `and` Returns the boolean `and` of the two arguments, i.e. returns `true` if both arguments are `true` and `false` otherwise. ``` [boolean] and [boolean] -> [boolean] ``` No conversions are performed; returns `false` if either arg is not a `boolean` type. Returns `false` if either args is a [Non-Boolean Evaluation]. Can be used with boolean literals or be used for creating nested expressions by joining the other operators. Has higher precedence than `or`, but lower precedence than `not`. If the first argument evaluates to `false`, the second argument is not evaluated (short-circuiting). Note that when short-circuiting takes place, any errors or warnings that may have occurred in the evaluation of the second argument will not be returned. ```json { "data": { "foo": "code" } } data.foo matches 'www' and data.missing matches 'hello' -> false (no warnings) data.missing matches 'hello' and data.foo matches 'www' -> false (type mismatch warning) data.foo matches 'code' and not data.missing exists -> true (no warnings) ``` ##### `or` Returns the boolean `or` of the two arguments, i.e. returns `false` if both arguments are `false` and `true` otherwise. ``` [boolean] or [boolean] -> [boolean] ``` No conversions are performed; returns `false` if either arg is not a `boolean`. Treats [Non-Boolean Evaluation] as `false`. Can be used with boolean literals or be used for creating nested expressions by joining the other operators. Has lower precedence than `and`. If the first argument evaluates to `true`, the second argument is not evaluated (short-circuiting). Note that when short-circuiting takes place, any errors or warnings that may have occurred in the evaluation of the second argument will not be returned. ```json { "data": { "foo": "code" } } data.foo matches 'code' or data.missing matches 'hello' -> true (no warnings) data.missing matches 'hello' or data.foo matches 'code' -> true (type mismatch warning) data.foo matches 'www' or data.missing exists -> false (no warnings) ``` #### Numeric Comparison Operations ##### `>`, `>=`, `<`, `<=` ``` [datetime] > [datetime] -> [boolean] [datetime] >= [datetime] -> [boolean] [datetime] < [datetime] -> [boolean] [datetime] <= [datetime] -> [boolean] [number] > [number] -> [boolean] [number] >= [number] -> [boolean] [number] < [number] -> [boolean] [number] <= [number] -> [boolean] ``` If both args are of type `datetime`, then evaluate the condition using datetimes. Datetimes further in the past are considered "less than" datetimes further in the future. If both args are of type `number`, then evaluate the condition using numbers. If both are integers or both are floats, then the numbers will compare as expected. If one number is an integer and the other is a floating point number, then the rule described in [Note About Comparing Integers and Floats] applies. Otherwise, returns a [Non-Boolean Evaluation], which will be evaluated like a `false` response. #### String Comparison Operations For the `matches`, `matches part`, and `matches regex` operations, comparisons are case-insensitive by default. Use the `exactly` modifier for a case-sensitive comparison. For `matches` and `matches part` the following apply to both arguments. For `matches regex` the following applies to the first argument. 1. If either or both args are `nil`, returns `false` 2. If either argument isn't a `string`, then it is converted to a `string` before the comparison. - integers - the digit by digit conversion to string is made - floats - if the value is smaller than xyz, then the string will be an integer with a decimal part - if the value is larger than zzz, then the float will be converted to scientific notation with an `e` - objects and lists - the object / list is converted to a JSON string ##### `matches` If the two strings match, then `true` is returned. Otherwise, returns `false`. ``` [string] matches [string] -> [boolean] [string] matches exactly [string] -> [boolean] ``` "Matching" means that the arguments (after conversion) are equivalent character by character in their entirety, including any leading and trailing whitespace, taking into account the appropriate case-sensitivity. Examples ``` 'this is a test' matches 'This Is A Test' -> true 'trailing whitespace ' matches 'trailing whitespace' -> false ``` ##### `matches part` If the second argument is a part of the first argument, then `true` is returned. Otherwise, returns `false`. ``` [string] matches part [string] -> [boolean] [string] matches part exactly [string] -> [boolean] ``` Examples ``` '[PROD] Disk space low' matches part 'prod' -> true '[TEST] CPU usage high' matches part 'cpu' -> true '[PROD] Network down' matches part 'disk' -> false ``` ##### `matches regex` If the second argument treated as a regex matches the first argument, then `true` is returned. Otherwise, returns `false`. ``` [string] matches regex [string] -> [boolean] [string] matches regex exactly [string] -> [boolean] ``` The second argument must be a literal string value representing a valid regular expressing using the [RE2 syntax](https://github.com/google/re2/wiki/Syntax). An error will be returned at parse time if this is not the case. Case-insensitive by default via the `i` flag - removed when the `exactly` modifier is used. The regex is also run with [the `s` and `m` flags](https://github.com/google/re2/wiki/Syntax#user-content-flags). The `s` flag allows `.` to match newlines (`\n`) and the `m` flag turns on multi-line mode: `^` and `$` match begin/end line in addition to begin/end text. If you do not want these, they can be turned off by negating them: ``` (?-sm)myregex.* ``` If the `exactly` modifier and the `i` flag are both used, the `i` flag wins; flags in the regex have higher precedence than the `exactly` modifier. For example, if you sent this JSON payload via the V2 Events API: ```json { "payload": { "custom_details": { "system diagnosis": { "issue": "Low disk" } } }, "links": [ { "href": "https://diag.test/details", "text": "Diagnosis details" } ], "important_field": "This is an important value", "another_field": "This has a newline\nin it" } ``` this is how these regular expressions would evaluate ``` raw_event.important_field matches regex 'this' -> true raw_event.important_field matches regex exactly 'this' -> false raw_event.important_field matches regex exactly '(?i)this' -> true raw_event.important_field matches regex '(?-i)this' -> false raw_event.another_field matches regex '.in it' -> true raw_event.another_field matches regex '(?-s).in it' -> false raw_event.another_field matches regex '^in it' -> true raw_event.another_field matches regex '(?-m)^in it' -> false ``` #### Threshold Conditions Threshold conditions will evaluate to `true` when that particular condition is evaluated a certain number of times _recently_ within a given time period. Note that the threshold conditions will never return `0` because the "current" event being evaluated is counted as part of the count. Thus the lowest possible value is `1` and conditions like `trigger_count over 5 seconds < 1` should be avoided. ##### `trigger_count` Returns a count of how many trigger events have occurred on this rule _recently_ within the given time period ``` trigger_count over [duration] ``` Generally will be used in conjunction with a numerical operator like these examples: ``` trigger_count over 10 seconds > 5 trigger_count over 1 hour < 10 ``` ##### `resetting_trigger_count` (Legacy Threshold Behavior) Exactly the same as `trigger_count` except that once the condition is evaluated to `true`, the internal counter is reset to `0`. Because of this, it doesn't really make sense to combine this with either of the "less than" operators (`<`, `<=`) because the count will constantly reset. ``` resetting_trigger_count over [duration] ``` Examples: ``` resetting_trigger_count over 10 seconds > 5 resetting_trigger_count over 1 hour > 50 ``` #### Other Operations ##### `==` Returns `true` if both arguments are equivalent and `false` otherwise. ``` [any type] == [any type] -> [boolean] ``` - When using `==` there will be no conversion of arguments - Comparisons of strings will be case sensitive - Floats and Integers are comparable. For example, `3.0 == 3` will result in a `true` evaluation. For more information, see the [Note About Comparing Integers and Floats] - Comparison of non-comparable types returns `false`. ##### `in` Returns `true` when the first argument falls within the schedule specified by the second argument. Otherwise, returns `false`. ``` now in [schedule] -> [boolean] ``` The `in` operator is only for creating _scheduled_ conditions. The first arg must be [`now`](#now). The second arg must be a `schedule`. For example, if you send an Event to an Event Orchestration on Monday, January 3rd, 2022 at noon in Los Angeles (which is 20:00 UTC): ``` now in Mon,Wed,Fri 01:00:00 to 15:00:00 America/Los_Angeles -> true now in Mon,Wed,Fri 01:00:00 to 15:00:00 Etc/Utc -> false ``` See [the `schedule` type documentation](#schedule) to learn about the types of recurring schedules you can create in PCL. ##### `exists` Returns `true` if the path exists in the context, `false` otherwise. ``` [path] exists -> [boolean] ``` Generally, a `path` used in an expression will evaluate to the value of the path in the context. In this case, `exists` checks to see if the path exists rather than retrieving the value at the path. `exists` will still return `true` if the `path` exists even if the value at that path is set to `nil`. ```json { "a": { "b": nil, "c": 5 } } a.b exists -> true a.b -> nil a.c exists -> true a.c -> 5 a.d exists -> false a.d -> nil ``` ##### `now` A built-in PCL function that has no arguments and returns a `datetime` representing the "current" time. For consistency during the evaluation of a complex exression, a single UTC value is determined before the entire expression is evaluated and that value is returned by this function. Could be used for the `datetime` argument in the one-time or recurring schedule conditions in Event Orchestrations. ``` now > 2020-01-01 00:00:00 Etc/UTC now in Mon,Fri 09:00:00 to 17:00:00 America/New_York ``` ### Non-Boolean Evaluation [Non-Boolean Evaluation]:#non-boolean-evaluation Evaluation of a PCL sub-expression can produce results are ambiguous / non-sensical. A classic example is an invalid type comparison like `2 > 'two'`. Since PCL will be used as part of the Event processing pipeline, throwing an error and giving up on the entire event evaluation isn't helpful since there is no user available to handle the error. So PCL treats all non-boolean evaluation as a `false`, allowing the PCL expression to be evaluated consistently as a whole, without error. Expression | Evaluates like | Result | Warning -- | -- | -- | -- `2 > 'two'` | `non-boolean evaluation` | ❌ `false` | Type mismatch: `>` requires a [number] or [datetime] on both sides but got `[number] > [string]` `not 2 > 'two'` | `not (non-boolean evaluation)` -> `not (false)` -> | ✅ `true` | Type mismatch: `>` requires a [number] or [datetime] on both sides but got `[number] > [string]` `2 >= 'two' or 2 < 10` | `(non-boolean evaluation) or true` -> `false or true` | ✅ `true` | Type mismatch: `>=` requires a [number] or [datetime] on both sides but got `[number] >= [string]` `2 <= 'two' and 2 < 10` | `(non-boolean evaluation) and true` -> `false and true` | ❌ `false` | Type mismatch: `<=` requires a [number] or [datetime] on both sides but got `[number] <= [string]` ## Note About Comparing Integers and Floats [Note About Comparing Integers and Floats]:#note-about-comparing-integers-and-floats When comparing an integer with a float, the following rule applies: The number that has less precision is converted to the type of the other number before the comparison occurs. - If the floating point number is within the range `-2^53` to `2^53`, then the floating point has more precision than the integer, so the integer is converted to a float and the numbers are compared. - If the floating point number is outside that range, then the floating point representation cannot represent contiguous integers. So, the integer will have more precision, and the floating point number is converted to an integer and the numbers are compared. Since the floating point representation cannot represent all integers greater than `2^53`, i.e. `9007199254740992`, this leads to some awkward behavior. This is not considered a bug, but a recognized artifact of the inaccuracy of floating point in general and beyond this limit specifically. All programming languages that support floating point numbers have similar issues. Here are some examples with explanations: ``` 9007199254740992 == 9007199254740992.0 -> true ``` This is as expected the integer and the corresponding floating point number are equal. ``` 9007199254740992 == 9007199254740993.0 -> true ``` What is happening here is that `9007199254740993.0` cannot be represented in the floating point representation. So, the floating point number that is chosen is the closest one that _can_ be represented. That happens to be the original number `9007199254740992.0`. The equality then just compares the two numbers which are now the same. ``` 9007199254740992 == 9007199254740994.0 -> false ``` Again, as expected. `9007199254740994.0` is the next number that can be represented in floating point, so PCL can tell that they are not the same. Note that as the floats get larger, the gap between representable numbers also gets larger. For more information about floating point numbers and their peculiarities: - [What Every Programmer Should Know About Floating-Point Arithmetic](https://floating-point-gui.de) - [0.30000000000000004.com](https://0.30000000000000004.com) - [Floating Point Arithmetic: Issues and Limitations](https://docs.python.org/3/tutorial/floatingpoint.html) ## Reserved Words Below is a list of reserved words in PCL. In order to use one of these words in a PCL condition it needs to be wrapped in quotes, ex: `event.custom_details['namespace']` ``` at, do, as, break, const, continue, def, else, end, eq, for, function, gte, gt, if, import, is, let, lte, lt, loop, namespace, package, require, return, var, void, when, while ``` ## Limits Below are the limits built-in to PCL, exceeding these limits will result in an error response. limit name | limit | description --|--|-- condition length | 2048 bytes | a single PCL condition cannot be longer than 2048 bytes data length for matches operator | 65536 bytes (64K) | the left side of any of the matches operators will be truncated to 64K before the match operation executes levels of parenthesized nesting | 32 | a valid PCL condition will never go deeper than 32 levels of parentheses number of factors | 64 | only up to 64 factors combined with `and` or `or` are allowed literal integer range | 64-bit signed int | integers must fall between -263 to 263 - 1 literal float range | 64-bit double precision float | floating point numbers follow the [IEEE 754 spec](https://en.wikipedia.org/wiki/IEEE_754) literal string length | 1024 bytes | a literal string can only be up to 1024 bytes number of path elements | 32 | a path can only contain up to 32 elements, e.g. `x.y.z[5]` has four elements [1]: https://en.wikipedia.org/wiki/List_of_tz_database_time_zones "List of TZ database timezones" ## Developer Agreement Your access to and use of the PagerDuty Developer Services is governed by the [PagerDuty Developer Agreement](/developer/pagerduty-developer-agreement). --- URL: https://docs.pagerduty.com/developer/private-apps # Private Apps Private apps work only on the account that created them, with Scoped OAuth for per-resource REST API access ## What is a private app? A private app is a PagerDuty App that is only used on the account that created it. You register it on your own account, and it works there and nowhere else. Private apps are not reviewed or published by PagerDuty. An app is private by default: its **App Type** is Private when you register it, and stays that way unless you change it and submit it for [review](/developer/publish-an-app). A **Scoped OAuth** app that has not been published only works on the account that registered it, so it is a private app until you [publish it](/developer/publish-an-app#scoped-oauth-apps-on-other-accounts). > **App Type does not apply to Classic User OAuth:** [Classic User OAuth](/developer/oauth-functionality#classic-user-oauth), the legacy OAuth functionality, works across accounts regardless of App Type: users on any account can use the OAuth authorization code flow with it as soon as it is registered. > > If you want OAuth functionality only for users in your account, use [Scoped OAuth](#scoped-oauth) and leave the App Type as Private. A private app can also have [Events Integration functionality](/developer/events-integration-functionality), which is a common way to reuse a single [Event Transformer](/developer/events-integration-functionality#add-an-event-transformer) across all of your services. ## Why build a private app? **Scoped access to the REST API for internal tooling.** Scoped OAuth grants access per resource type rather than handing over everything the authorizing user can reach, the way a User API Key would. A script that closes stale incidents needs `incidents.write` and nothing else. See [Scoped OAuth](#scoped-oauth) below. **Acting as the app rather than as a person.** A Scoped OAuth app can obtain an app token with no user involved, which suits server-to-server work like responding to a webhook or running a scheduled job. **Writing one Event Transformer and reusing it everywhere.** If some system sends you a payload that PagerDuty does not understand natively, you can write a single [Event Transformer](/developer/events-integration-functionality#add-an-event-transformer) on the app that converts that payload into the Events API v2 format — and then add that one integration to every PagerDuty service that receives the payload. ## Scoped OAuth If a private app needs to access the PagerDuty REST API, it uses Scoped OAuth. An app with Scoped OAuth can obtain an app token, a user token, or both. The access a token has depends on its type: * With an **app token**, access is limited only by the scopes granted to the app. If the app has the `incidents.read` scope, it can read all incidents on the account. * With a **user token**, access is the intersection of the app's scopes and the user's permissions. If an app has the `incidents.read` scope and is acting as user Pagey, it can only read incidents that Pagey has permission to see. ### User Tokens To obtain a **user token**, follow [Obtaining a User OAuth Token](/developer/oauth-functionality#obtaining-a-user-oauth-token) — the flow is the same one Classic User OAuth uses, with the following caveats specific to Scoped Apps: * The `client_secret` must be sent on the token request. Scoped Apps do not support non-confidential clients. * PKCE must be used. ### App Tokens Before proceeding you should [register a PagerDuty App](/developer/register-an-app) with Scoped OAuth functionality to obtain the `client_id`, `client_secret`, and scopes. App tokens are only issued for the account that created the app. On other accounts, a published Scoped OAuth app obtains [user tokens only](/developer/publish-an-app#scoped-oauth-apps-on-other-accounts). An app token is obtained by making an OAuth 2.0 client credentials request. Send a `POST` request to `https://identity.pagerduty.com/oauth/token` with a `Content-Type` of `application/x-www-form-urlencoded` and the following form parameters: |Parameter|Description| |-|-| |`grant_type`|The OAuth 2.0 grant type. Value must be set to `client_credentials`| |`client_id`|An identifier issued when the Scoped OAuth client was added to a PagerDuty App| |`client_secret`|A secret issued when the Scoped OAuth client was added to a PagerDuty App| |`scope`|A space separated list of scopes available to the client. Must contain the `as_account-` scope that specifies the PagerDuty Account the token is being requested for using a `{REGION}.{SUBDOMAIN}` format. Currently accepted service regions are `us` or `eu`.| The following curl request could be used to obtain an access token for the `companysubdomain` account in the `us` service region: ```bash curl -i --request POST \ https://identity.pagerduty.com/oauth/token \ --header "Content-Type: application/x-www-form-urlencoded" \ --data-urlencode "grant_type=client_credentials" \ --data-urlencode "client_id={CLIENT_ID}" \ --data-urlencode "client_secret={CLIENT_SECRET}" \ --data-urlencode "scope=as_account-us.companysubdomain incidents.read services.read" ``` The JSON response includes the access token, the scopes that were actually issued to the token, and the number of seconds before the token expires. ```json { "access_token": "pdus+_EXAMPLE_KEY_ID_EXAMPLE_TOKEN", "scope": "as_account-us.companysubdomain incidents.read services.read", "token_type": "bearer", "expires_in": 86400 } ``` In the client credentials OAuth flow, it is not necessary to refresh an access token. When a particular access token expires, the application should simply request a new token. ### Using an Access Token The access token can be used to access the [REST API](/developer/api/reference) as a PagerDuty App. When making an API request, include the version of the API in the `Accept` header. Access tokens must also be sent in the request as part of the `Authorization` header along with the `Bearer` token type, using this format: ```http Authorization: Bearer pdus+_EXAMPLE_KEY_ID_EXAMPLE_TOKEN Accept: application/vnd.pagerduty+json;version=2 ``` A `403 - Forbidden` response will be returned if the token does not contain the scope required to access a particular API endpoint or the API endpoint does not yet support API Scopes. When the token expires a `401 - Unauthorized` response will be returned and a new token must be obtained. ## Which APIs require which scopes? Every REST API endpoint supports Scoped OAuth access tokens. The required scope is in its description in our [API Reference](/developer/api/reference). For example, the list incidents endpoint requires the `incidents.read` scope. 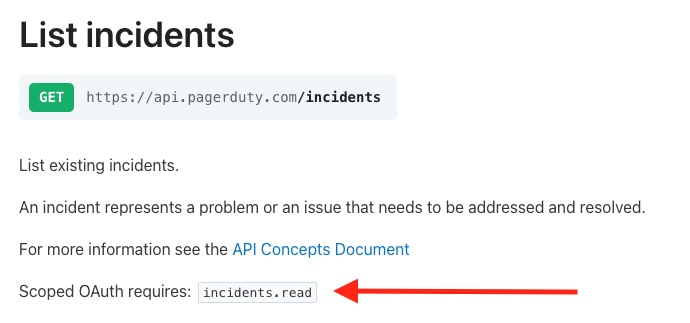 ## Token Lifetimes All Scoped OAuth clients have the following settings: - access token expiry of 1 day - refresh token expiry of 30 days - rolling refresh window of 1 year Refresh tokens only apply to user tokens. When an app token expires, the application can simply request a new token. Scoped OAuth applications that implement the refresh token flow for user tokens will allow your customers to use your application continuously for one year, as long as they use it at least once every 30 days. See [Token Lifetimes](/developer/oauth-functionality#token-lifetimes) for the Classic User OAuth expiries, and [Revoking Tokens](/developer/oauth-functionality#revoking-tokens) if you believe your app's tokens or `client_secret` have been compromised. ## Developer Agreement Your access to and use of the PagerDuty Developer Services is governed by the [PagerDuty Developer Agreement](/developer/pagerduty-developer-agreement). --- URL: https://docs.pagerduty.com/developer/publish-an-app # Publish an App Walks through submitting a built app for PagerDuty review so it can be distributed to accounts beyond the one that built it. Once you are done building your app, you can submit it for review to be published. Publishing is **required** for an app with [Events Integration](/developer/events-integration-functionality) functionality to work on accounts other than the one that created it. It also enables the [Simple Install Flow](/developer/events-integration-functionality#simple-install-flow-optional-but-recommended), and adds your app to the **Add Integrations** list in the Service Directory:  Publishing is **required** for an app with [Scoped OAuth](/developer/oauth-functionality#scoped-oauth) functionality to work on accounts other than the one that created it. After approval, an admin on each account must also install it — see [Scoped OAuth apps on other accounts](#scoped-oauth-apps-on-other-accounts) below. Publishing is **recommended** for an app with [Classic User OAuth](/developer/oauth-functionality#classic-user-oauth) functionality. Those apps already work across accounts as soon as they are registered, but publishing adds yours to our [integrations library](https://www.pagerduty.com/integrations/). ## Manage Distribution On your app's configuration page, scroll down to the **App Type** section and select the Public option and click on the Distribution Form button. Before the App can be made public the Distribution Form needs to be completed.  ## Publish To All PagerDuty Users You can optionally publish your app for all PagerDuty users to discover and use. Follow these steps to submit your app for review. 1. On the **Distribution Form** page (see above), enter information for your app listing (like documentation and support contact) and provide instructions for testing your app. 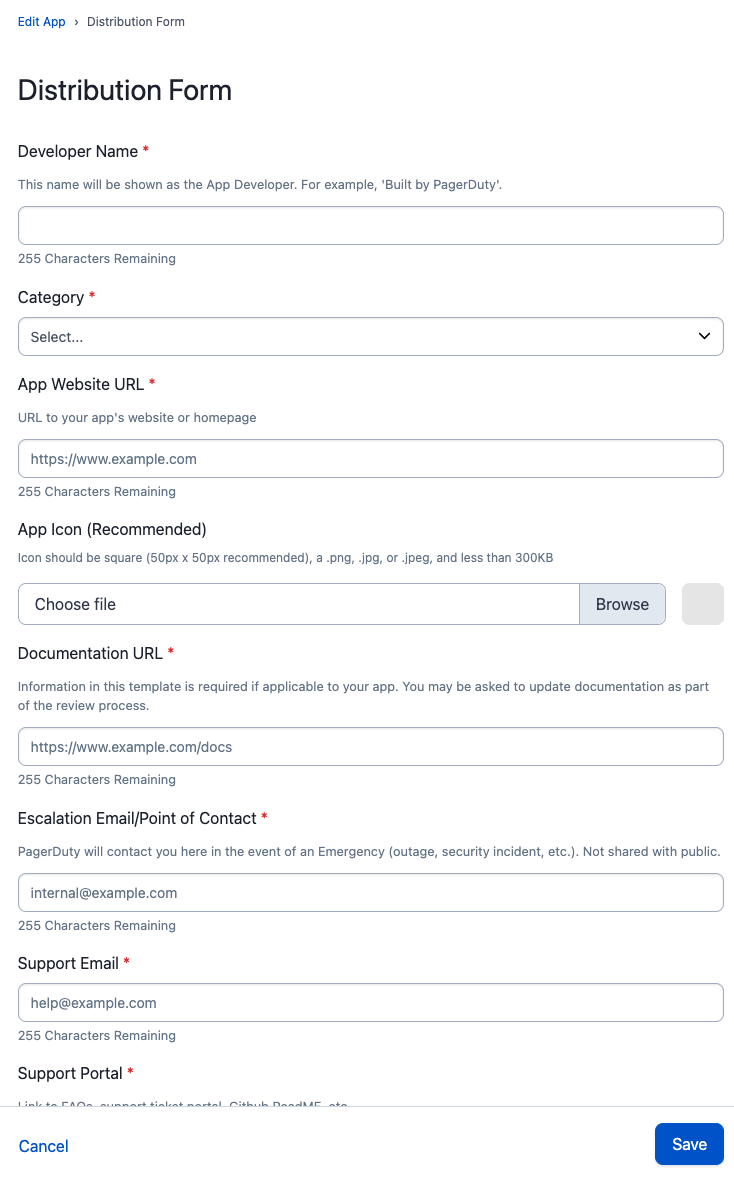 2. At the bottom of the **Distribution Form** page click the **Save** button. Upon returning to the Edit App page, click **Save** and confirm that you want to submit the app for review.  Once you submit, you will no longer be able to make updates to your app. If you need to make changes after you submit, please contact apps@pagerduty.com to get your app back into an editable draft state. You should receive a confirmation email once your app is submitted for review. ## Review Process We aim to review your submission and approve or reply with feedback within 5 business days. **During the review process, we will:** * Test your app's functionality * Review documentation for completeness and accuracy (please use this [documentation template](https://github.com/PagerDuty/app-documentation-templates/blob/master/integration-guide-template.md) to avoid change requests during review) * Ensure all required information is submitted and accurate for your listing (support contact, website links, etc) If we find issues with your submission or have questions, we will contact you at the email used for your PagerDuty account. The reviewer may ask for additional info or updates to your app or documentation before your submission is approved. If you have questions about this process or your submission, please email **apps@pagerduty.com**. ## Scoped OAuth apps on other accounts A [Scoped OAuth](/developer/oauth-functionality#scoped-oauth) app works on the account that created it as soon as it is registered. Until it has been submitted for review and approved, it behaves as a [private app](/developer/private-apps): it only works on the account that created it. Once published, your app can be used on other accounts to obtain **user tokens**, by taking a user on that account through the [user token flow](/developer/oauth-functionality#obtaining-a-user-oauth-token) to get their authorization and consent. Its access there is the intersection of the scopes granted to the app and the permissions of the authorizing user. App tokens are not available on other accounts — the [client credentials flow](/developer/private-apps#app-tokens) only works on the account that created the app. ### Installation by an account admin Before any user on another account can authorize your app, an admin on that account must install it. Until the app is installed, authorization requests from users on that account will not succeed. To have your app installed on an account, give an admin on that account the following installation link, replacing `[app_id]` with the ID of your app: ``` https://app.pagerduty.com/oauth_apps/[app_id] ``` The admin will be shown your app's name, the scopes it is requesting, and the kinds of token it can obtain. From here they can install it on their account: 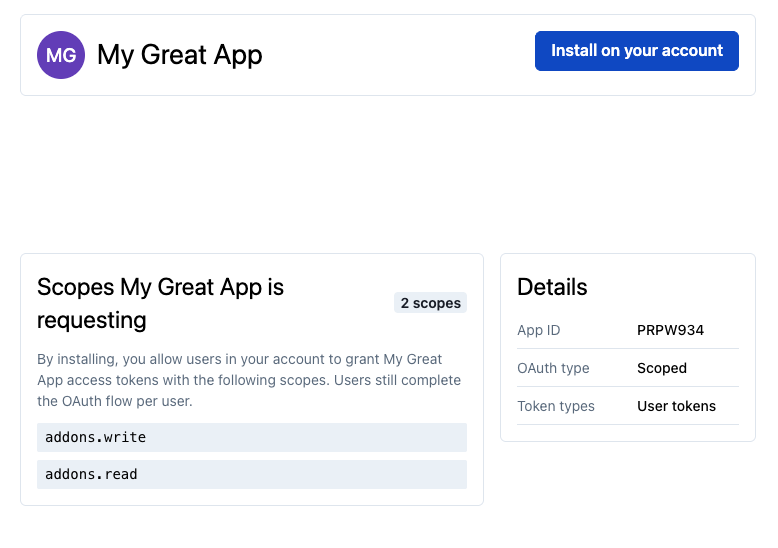 Installing does not by itself grant your app any access. It permits users on that account to authorize your app — each user still completes the OAuth flow individually. Once the admin has installed it, users on that account can authorize your app through the [user token flow](/developer/oauth-functionality#obtaining-a-user-oauth-token) as normal. ## Developer Agreement Your access to and use of the PagerDuty Developer Services is governed by the [PagerDuty Developer Agreement](/developer/pagerduty-developer-agreement). --- URL: https://docs.pagerduty.com/developer/register-an-app # Register an App Walks through creating and configuring a new app from the My Apps page, including adding API or OAuth functionality to it. ## Accessing App Registration Page When you log into a developer account, you'll be taken straight to the App Registration page. If you're on a PagerDuty customer account, follow these steps: **Note:** App Registration is available only to users with a base role of Manager, Global Admin or Account Owner. 1. Log in to your PagerDuty account. 2. From the menu, select **Integrations**. 3. Select **Developer Tools**, then **App Registration** from the menu to navigate to the **My Apps** page. 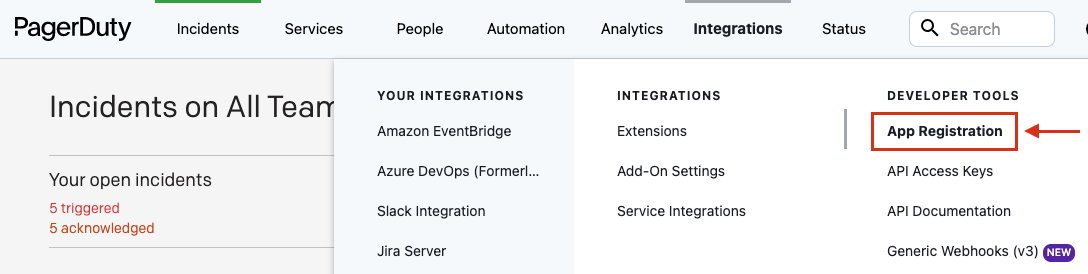 ## Creating an app > **Note:** Apps are associated with a PagerDuty subdomain and a user and cannot be moved between subdomains or users. Continued access to this subdomain and user is needed to make any configuration changes to the app. On the **My Apps** page, select **New App**. Enter a name for your app and a brief description, and complete the rest of the New App wizard as necessary. 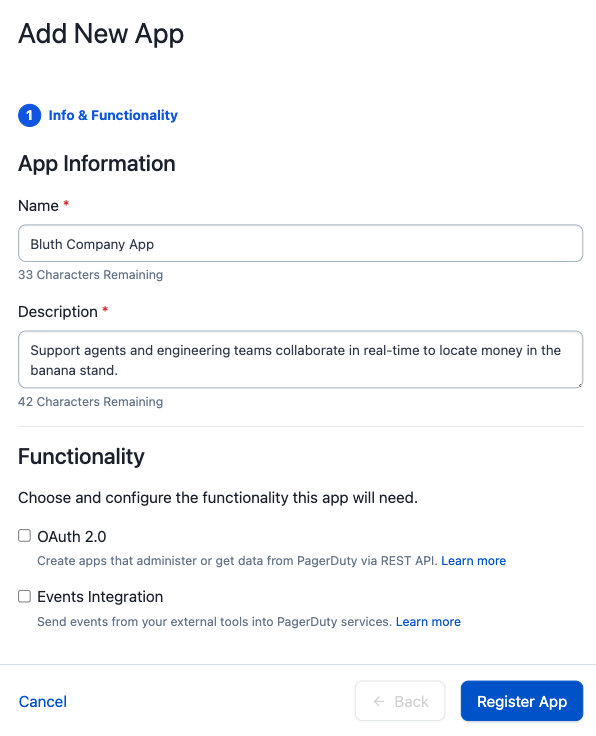 The new app will now appear under **My Apps** in the **App Registration** page. ## Editing your app configuration By selecting an app from the **My Apps** page, you will be directed to the **Edit App** page. From this page you can: - Edit the app name and description. - Add API and/or OAuth functionality, as described below. - [Change your App Type to distribute/publish your app](/developer/publish-an-app) and share with all PagerDuty customers. 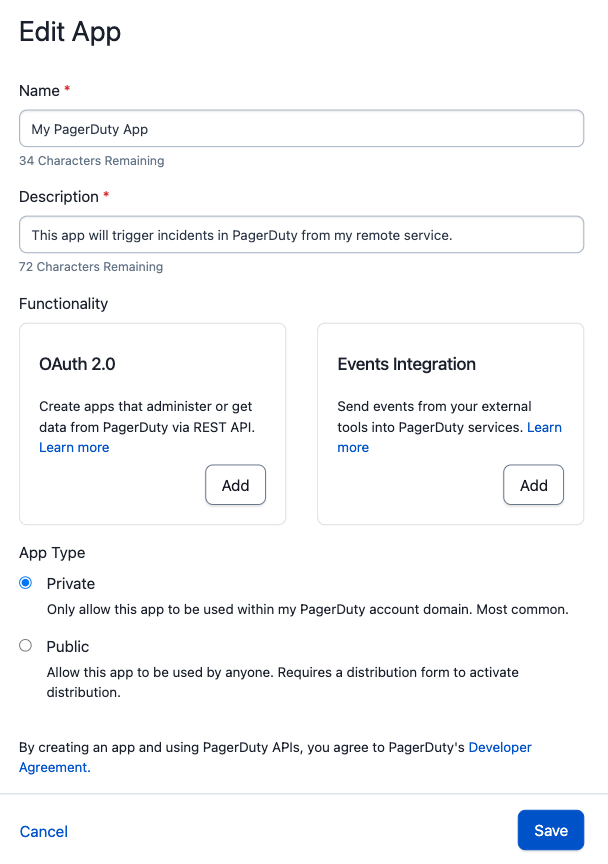 ## Adding functionality to your app A newly registered app does not do anything on its own. Add functionality to make it useful — see [App Functionality](/developer/app-overview#app-functionality) for what is available and which option fits your needs. 1. Go to the configuration page for your app. See [Editing your app configuration](#editing-your-app-configuration) above. 2. Scroll down to the **Functionality** section of the page and click the **Add** button on the card which represents the functionality you would like to add. 3. On the next page, you'll be asked for more information to configure that app functionality. 4. Click **Save** to save the configuration and add that functionality to your app. 5. Click the **Manage** button to make edits or remove functionality from an app. 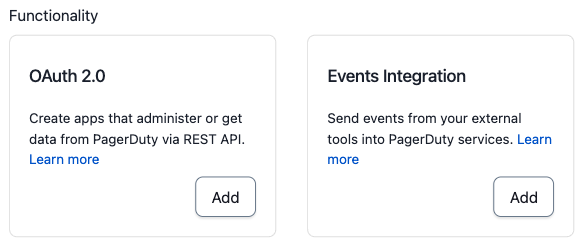 ### Adding Events Integration functionality In the **Functionality** section, click **Add** next to Events Integration. Then click **Save** on the Events Integration config page. 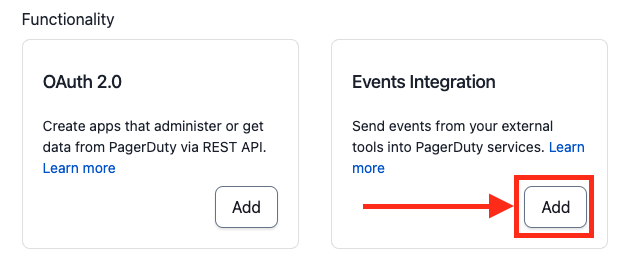 From there you can set up the [Simple Install Flow](/developer/events-integration-functionality#simple-install-flow-optional-but-recommended) and [add an Event Transformer](/developer/events-integration-functionality#add-an-event-transformer). ### Adding OAuth functionality In the **Functionality** section, click **Add** on the OAuth card, then choose between Classic User OAuth and Scoped OAuth on the **Configure OAuth 2.0** screen. See [OAuth Functionality](/developer/oauth-functionality) for the difference between them, and [Private Apps](/developer/private-apps) if your app will only be used on your own account. ## Removing functionality from your app > **Warning:** This action cannot be undone. Be sure that app functionality is not needed before you remove it. 1. Go to your app's configuration page. See [Editing your app configuration](#editing-your-app-configuration) above. 2. Scroll down to the **Functionality** section of the page and click the **Manage** button on the card which represents the functionality you would like to remove. 3. To remove Events Integration Functionality scroll to the **Danger Zone** at the bottom of the page and click **Delete**  To remove OAuth functionality, navigate to the Client tab and click Delete. 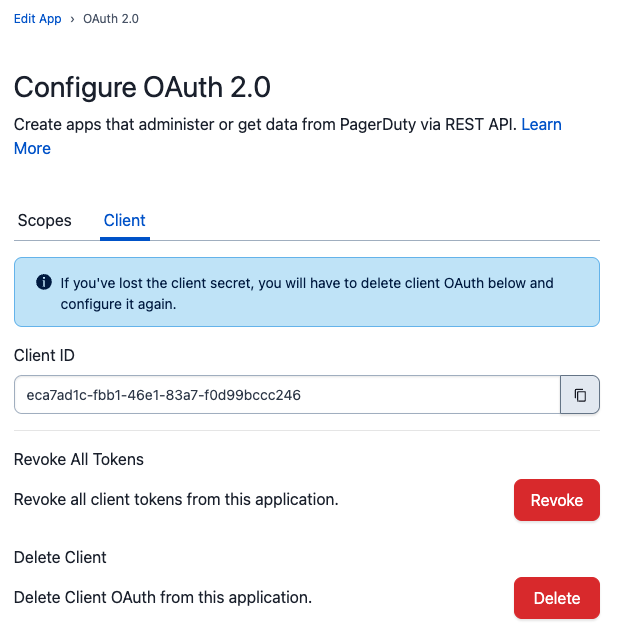 4. Confirm that you would like to remove app functionality  > **Note:** Deleting OAuth functionality _does not_ automatically revoke existing tokens. If you wish to perform both operations, you must [revoke all tokens](/developer/oauth-functionality#revoking-tokens) _before_ deleting the OAuth functionality. ## Developer Agreement Your access to and use of the PagerDuty Developer Services is governed by the [PagerDuty Developer Agreement](/developer/pagerduty-developer-agreement). --- URL: https://docs.pagerduty.com/developer/resource-references # Resource References Defines the five-field reference object, id, type, summary, self, and html_url, used to point at a related API resource. A key component of the REST API is the use of `references` to represent a pointer to a resource. A reference consists of five fields: - `id` (required, readOnly) - `type` (required) - `summary` (readOnly) - `self` (readOnly) - `html_url` (readOnly) References are used anywhere that the identification of an object is important, but the object itself cannot be modified. In this regard, you can think of a reference like an alias — a different object type that represents a resource. They also provide an essential subset of information about the resource that tells a client how to uniquely identify it, provides some information about what it represents, and offers locations where more information can be found about it. References will be used to represent relationships between resources. If a resource has a relationship with other types of entities, they may be displayed as part of the resource's schema and contain references to the resources of that type that make up the other end of the relationship. Modifying the reference or references in this field — identified only by `id` and `type` (see below) — will update the relationship between resources. Modifying any other fields of the reference has no effect on the resource it represents. ## `id` and `type` Every PagerDuty resource can be uniquely identified by the combination of its `id` and `type`, ignoring the distinction between a given `type` and the corresponding `type_reference`. The `type` field indicates what kind of resource it is, which is [equivalent to specify its schema](/developer/resource-schemas) ## `summary` The summary field contains a string that provides a brief, human-readable summary of what this particular resource instance represents. This is server-generated and cannot be specified by the client. It should be used whenever naming a resource in a client, such as in a title, list, or link. ## `self` and `html_url` These fields provide the full [API `show` URL](/developer/endpoints#get-resourcesid-show) at which the resource can be accessed in full form, and the full URL at which the resource can be viewed and manipulated in the PagerDuty web application, if applicable. If the resource cannot be accessed directly in the API or in the web application, one or both of these fields may be `null`. ## Developer Agreement Your access to and use of the PagerDuty Developer Services is governed by the [PagerDuty Developer Agreement](/developer/pagerduty-developer-agreement). --- URL: https://docs.pagerduty.com/developer/resource-schemas # Resource Schemas Explains how every REST API resource maps to a single canonical schema identified by type, including generic vs. specific schemas. All resources in the REST API have a single, canonical schema uniquely identified by the resource's `type`. Simply put, the same set of fields will always be present for a resource of a given `type`. Every field within the schema adheres to a single [primitive types.](/developer/types) In some cases, a resource may not contain a value for a field. The field will still be present in the resource and the value will be `null`. If the field can contain multiple values but the resource does not have any values for that field, the field will still be present and the value will be an empty array (`[]`). To promote forward compatibility, clients should expect and ignore any extra fields in the schema that they do not recognize. This also enables the use of generic schemas for specific types. ## Type specificity While the value of a `type` field always provides the most specific information available about a resource's schema, there may be a more generic schema available that can also be used to understand the resource. More specific schemas are purely additive to the corresponding generic schema. For instance, while there may be a schema corresponding to `cat_animal`, any `cat_animal` resource will also conform to the `animal` schema. A client concerned about `animal`s in general and not the specifics of `dog_animal` vs. `cat_animal` vs. `mouse_animal` can interpret every response from the `/animals` endpoint, or any `type` ending in `_animal` across the API as having a valid `animal` schema. Similarly, *any* resource always conforms to a valid `reference` schema. If the client is only interested in displaying a list of resources by their [using a filter](/developer/resource-references#summary), it does not need to know anything about the `type` of those resources as they can all be interpreted as valid `reference`s. ## Developer Agreement Your access to and use of the PagerDuty Developer Services is governed by the [PagerDuty Developer Agreement](/developer/pagerduty-developer-agreement). --- URL: https://docs.pagerduty.com/developer/rest-api-ips # REST API IPs Lists the outbound IP addresses your systems must safelist on port 443 for REST API access in each PagerDuty service region. > Notice: This safelist of IP addresses will take effect December 18th, 2023 This page lists the IP addresses that your system must be able to make outbound connections to on TCP port 443 to access our REST API in each of our service regions. The full list of IP addresses that our REST API may use is: ## US Service Region ### IP Addresses download: [plain](/ip-safelists/rest-api-us-service-region) | [json](/ip-safelists/rest-api-us-service-region-json) 44.237.102.140 35.163.146.4 52.36.64.228 34.212.97.30 44.226.85.110 52.24.121.31 ## EU Service Region ### IP Addresses download: [plain](/ip-safelists/rest-api-eu-service-region) | [json](/ip-safelists/rest-api-eu-service-region-json) 3.126.2.17 3.79.124.225 18.192.170.210 3.79.82.135 3.66.104.172 3.73.115.116 Please review the list and update your firewall settings where necessary every 30 days to avoid any disruptions to your integrations with PagerDuty. ## Developer Agreement Your access to and use of the PagerDuty Developer Services is governed by the [PagerDuty Developer Agreement](/developer/pagerduty-developer-agreement). --- URL: https://docs.pagerduty.com/developer/rest-api-overview # REST API Overview Introduces the REST API's RESTful design, JSON-only request and response format, and its single api.pagerduty.com host address. > ## Importing Pagerduty OpenAPI Specs into Postman > > * The "Run in Postman" Button was removed in favor of this more concrete workflow as described in Postman's [documentation](https://learning.postman.com/docs/integrations/available-integrations/working-with-openAPI/) on integrating Postman with OpenAPI > * Use [this URL](https://raw.githubusercontent.com/PagerDuty/api-schema/main/reference/REST/openapiv3.json) in the OpenAPI import tool to integrate Postman with OpenAPI The REST API provides a way for third parties to connect to a PagerDuty account and access or manipulate configuration data on that account. It is not for connecting your monitoring tools to send events to PagerDuty; for that, use the [Events API](/developer/events-api-v2-overview). ## What and Where This API is designed around RESTful principles. It's based on managing [resources](/developer/resource-schemas) via the HTTP methods `GET`, `POST`, `PUT`, and `DELETE`. All requests to the REST API are made to the same host: ``` api.pagerduty.com ``` Based on the [authentication](/developer/authentication) that you provide, you'll receive data for the associated account. ## How Only JSON is supported in the REST API. Other content types are currently not supported and may produce unpredictable results. Request bodies should supply JSON data and responses will come back as JSON. Consult the topics on the left to learn more about the conventions of the REST API. If you're comfortable with the layout and structure of the API, or want to get started right away, head over to the [API Reference](/developer/api/reference). The reference documentation contains a comprehensive set of REST API [endpoints](/developer/endpoints), parameters, and responses. You'll be able to find the resources you need and try making requests right from your browser! ## HTTP Request Headers The following headers should be set as applicable when making HTTP requests to the REST API: * `Accept`: to optionally specify a different API version than the version of the API token; see [Versioning](/developer/versioning). * `Authorization`: required for all requests; see [Authentication](/developer/authentication). * `Content-Type`: required when making a `POST` or `PUT` request. The MIME media type should be `application/json`. * `From`: the email address of the user to record as having taken the action. Should be used when [creating a user](/developer/api/reference/rest/users/create-user) or when performing [Incident Creation](/developer/incident-creation-api) in the REST API. ## TLS Connecting to the PagerDuty REST API requires using [TLS (Transport Layer Security)](https://en.wikipedia.org/wiki/Transport_Layer_Security). Our REST API supports TLS protocol versions 1.2 and 1.3. We recommend using TLS 1.3 where supported, as it provides improved security and performance. TLS 1.2 remains fully supported for backwards compatibility. Our server certificate is issued and signed by DigiCert. Client systems will need to have an up-to-date certificate bundle that includes DigiCert root certificates in their local trust store. CA certificates, if needed, can be obtained directly [from DigiCert](https://www.digicert.com/digicert-root-certificates.htm). ## Developer Agreement Your access to and use of the PagerDuty Developer Services is governed by the [PagerDuty Developer Agreement](/developer/pagerduty-developer-agreement). --- URL: https://docs.pagerduty.com/developer/rest-api-rate-limits # Rate Limits Details the 960-requests-per-minute limit applied per account key, user key, and app OAuth token on the REST API access. > This page describes the rate limits for the PagerDuty REST API. The rate limits for the > PagerDuty Events API are described [here](/developer/events-api-rate-limits). ## What are the limits? The PagerDuty REST API uses rate limits to provide a consistent experience for all of our customers. The limits depend on the type of authorization token being used. Each PagerDuty App has its own set of limits that are separate from both API keys and other apps. ### Rate limits The limits described in this section apply to every request made to the PagerDuty REST API. **Account API Keys** Each Account API Key is allowed 960 requests per minute. **User API Keys** User API Keys act as a PagerDuty User and are limited as such. Each user is allowed 960 requests per minute across all of the user's API keys. **PagerDuty App - App OAuth Tokens** When a PagerDuty App [uses an app token](/developer/private-apps#app-tokens) it is acting as the PagerDuty App. Each PagerDuty App is allowed 960 requests per minute against each PagerDuty Account it is authorized to access. **PagerDuty App - User OAuth Tokens** When a PagerDuty App [uses a user token](/developer/oauth-functionality#obtaining-a-user-oauth-token) it is acting as the PagerDuty User. Each PagerDuty App is allowed 960 requests per minute per User it is authorized to act as. ### Operation specific limits In a few exceptional circumstances, individual REST API operations may apply additional limits. If an endpoint applies additional limits; it will be noted in the [REST API](/developer/api/reference) documentation for that endpoint. The `ratelimit-` response headers described later in this document will provide information to the client about the current status of the limit and when it resets. ## Working with limits How can your application gracefully interact with these limits? This section describes how our API informs client applications about limiting and covers some best practices. ### Rate limit headers Requests that have been evaluated for rate limiting will include the following HTTP response headers: |Header Name|Description| |-|-| |`ratelimit-limit`|The allowed number of requests for the current time window.| |`ratelimit-remaining`|The remaining number requests in the current time window before limiting occurs.| |`ratelimit-reset`|The number of seconds until the limit is reset.| Note that when working with API endpoints that have operation specific limits; these headers will represent the limit that is closest to being reached. ### Reaching the limit In the event that your application reaches a limit: the HTTP response code will be `429`, the rate limit headers will be present, and the response body will indicate that limiting has occurred: ```bash HTTP/2 429 Too Many Requests date: Tue, 03 Oct 2023 16:46:39 GMT ratelimit-limit: 960 ratelimit-remaining: 0 ratelimit-reset: 20 { "error": { "message": "Rate Limit Exceeded", "code": 2020 } } ``` Note that there may be exceptional scenarios where an application receives a `429` response code _without_ the rate limit headers or the response body above. ### Best practices #### Ensure your application is ready to handle being rate limited Update your application to slow down the rate of requests after receiving a 429 response code. For fine-grained control your application can make use of the `ratelimit-reset` header to wait the appropriate number of seconds before retrying. #### Avoid hitting rate limits These guidelines will help your application avoid hitting rate limits: * Make requests serially for a given authentication token. * Avoid excessive polling for changes whenever possible. Make use of available [Webhooks](/developer/webhooks-overview) to receive push updates to data. #### One "bot user" per application deployment If you use PagerDuty Users / User API Keys as "bot users" for applications; create a separate bot user for each deployment of the application (e.g. "Acme Production Bot User", "Acme Test Bot User", etc.). This will keep the limits for each deployment of the application separate. ## Developer Agreement Your access to and use of the PagerDuty Developer Services is governed by the [PagerDuty Developer Agreement](/developer/pagerduty-developer-agreement). --- URL: https://docs.pagerduty.com/developer/retrieve-incident-details # Retrieving Incident Details Shows how to use the Log Entries API with channels included to recover the original event payload behind a triggered incident. The original details of any event sent from your monitoring tools to PagerDuty, whether an email sent through an email integration or JSON-encoded data through an API-based integration, can be retrieved through the REST API. This process requires the use of our Log Entries API with channels included, which will expose the original data received through the integration. ## Introduction As noted on our [Log Entries API](/developer/api/reference/rest/log-entries/list-log-entries) documentation: > PagerDuty keeps a log of all the events that happen to an incident. These are exposed as log entries. Log entries give you more insight into how your team or organization is handling your incidents. Log entry data includes details about the event(s) that affected the incident throughout its lifecycle, such as: * the data contained in events sent by the integration * what users were notified and when * how they were notified * what user(s) acknowledged or resolved the incident * any automatic actions that occurred to the incident * other manual user actions, such as a reassignment or a note ### How to obtain the data To obtain the event data sent through the integration, we'll be retrieving a specific type of log entry called the trigger log entry. For this, you will need the ID (a string of alphanumeric characters that starts with `P`, `Q`, or `R`) or the number of the incident that the event triggered. In both cases, we'll be making requests to the log entries API. We will need to append the `channels` value to the array-type URL parameter `include[]` when obtaining log entries. In other words, the query part of the URL (after `?`) will contain `include[]=channels`, to enable including this feature in the response. The two ways of getting the trigger log entry are as follows: 1. **With just the incident number (or ID):** 1. Obtain the first trigger log entry (which initially triggered the incident) by [retrieving the incident via `GET /incidents/{id}`](/developer/api/reference/rest/incidents/get-incident), where `{id}` could be the ID or the incident number. 2. From the `first_trigger_log_entry` property in the response, make a second `GET` request to the URL in its `self` property, which should lead to [the endpoint to retrieve an individual log entry, `/log_entries/{id}`](/developer/api/reference/rest/log-entries/get-log-entry) 2. **With the incident ID:** You can obtain all trigger log entries in one or more API calls by: 1. Use the [incident log entries endpoint at `/incidents/{id}/log_entries`](/developer/api/reference/rest/incidents/list-incident-log-entries), where `{id}` is the incident ID. 2. Use the first log entry in the array (`log_entries` property in the response), which should contain a `log_entry` type object whose `type` value is `trigger_log_entry`. Note that using the second method, it is possible to obtain subsequent alert data sent by the monitoring tool (after the incident was initially triggered) by iterating through all log entries and selecting the entries whose `type` value is `trigger_log_entry`. ## The channel property of log entries Each log entry object returned will then contain a `channel`, if `channels` was in the `include` parameter. This property will itself contain an object with the triggering event data. Note the following about this property: * The structure of the object in the channel property will vary, but it will always contain a property named `type`. * For trigger log entries, the type property will be `api`, `email` or `web_trigger`. * The overall structure of the `channel` object depends on the `type` value. > **Disclaimer:** The description of the structure of the `log_entry.channel` produced here only reflects what it was observed to be as of this writing. A full specification of the `log_entry.channel` property's schema has not yet been published in our API Reference because it may be subject to change until a permanent structure is decided upon. Channel Type | Description -------------- | ------------ `api` | It will contain the properties of the event that was received through the integration. **Note:** This type appears for both Event and REST API. `email` | It will contain aptly-named properties `subject`, `body`, `from` and `to`, in addition to a property `summary` containing the short event description extracted from the email per management rules (if nothing, this will be the subject header of the email). `website` | Will contain `subject` (short description / incident title), `details` (long description entered in the "New Incident" form) and `summary` (usually same as the title) `mobile` | It will contain the `summary` which is identical to the subject and details. ## Developer Agreement Your access to and use of the PagerDuty Developer Services is governed by the [PagerDuty Developer Agreement](/developer/pagerduty-developer-agreement). --- URL: https://docs.pagerduty.com/developer/sample-code-disclaimer # Sample Code Disclaimer States that all sample code published on docs.pagerduty.com/developer is provided as-is and isn't covered by PagerDuty's SLAs. THE SAMPLE CODE ON DOCS.PAGERDUTY.COM/DEVELOPER IS PROVIDED “AS IS” AND ANY EXPRESS OR IMPLIED WARRANTIES, INCLUDING THE IMPLIED WARRANTIES OF MERCHANTABILITY AND FITNESS FOR A PARTICULAR PURPOSE ARE DISCLAIMED. IN NO EVENT SHALL PAGERDUTY OR CONTRIBUTORS BE LIABLE FOR ANY DIRECT, INDIRECT, INCIDENTAL, SPECIAL, EXEMPLARY, OR CONSEQUENTIAL DAMAGES (INCLUDING, BUT NOT LIMITED TO, PROCUREMENT OF SUBSTITUTE GOODS OR SERVICES; LOSS OF USE, DATA, OR PROFITS; OR BUSINESS INTERRUPTION) SUSTAINED BY YOU OR A THIRD PARTY, HOWEVER CAUSED AND ON ANY THEORY OF LIABILITY, WHETHER IN CONTRACT, STRICT LIABILITY, OR TORT ARISING IN ANY WAY OUT OF THE USE OF THIS SAMPLE CODE, EVEN IF ADVISED OF THE POSSIBILITY OF SUCH DAMAGE. Code on docs.pagerduty.com/developer is not covered by any PagerDuty Service Level Agreements. ## Developer Agreement Your access to and use of the PagerDuty Developer Services is governed by the [PagerDuty Developer Agreement](/developer/pagerduty-developer-agreement). --- URL: https://docs.pagerduty.com/developer/schedules-v2-to-v3-upgrade # Schedules API: v2 → v3 Upgrade Guide Maps common Schedules API v2 requests to their v3 shift-based equivalents, with worked end-to-end automation task examples. Side-by-side examples showing how common requests against PagerDuty's existing public Schedules API (v2) translate to the new shift-based schedules API (v3). The doc covers a few core endpoint comparisons (list schedules, get a single schedule, create an override) and worked end-to-end examples for common automation tasks (reading on-call across all schedules, post-PR-merge claim of coverage, offboarding a user from a rotation). --- ## Conventions ### Base URLs | API | Base URL | | :---- | :---- | | v2 (existing public) | `https://api.pagerduty.com` | | v3 (shift-based schedules) | `https://api.pagerduty.com` (same host; routes prefixed `/v3/schedules`) | ### Headers v2 and v3 use the same standard PagerDuty REST API headers. ``` Authorization: Token token=YOUR_API_KEY Accept: application/vnd.pagerduty+json;version=2 Content-Type: application/json ``` ### Schedule IDs v2 and v3 use the same opaque schedule IDs (e.g. `PL5FQHC`). A schedule that has been upgraded keeps its ID — references from escalation policies, teams, URLs, and integrations are preserved. Only the **shape** of the schedule changes. ### Type discriminators Once a schedule is upgraded, its `type` flips: | Schedule kind | `type` value | Detail endpoint to call | | :---- | :---- | :---- | | Layer-based (v2-shaped) | `schedule` | `https://api.pagerduty.com/schedules/{id}` | | Shift-based (v3-shaped) | `schedule_v3` | `https://api.pagerduty.com/v3/schedules/{id}` | In list responses, references use the corresponding `_reference` form: `schedule_reference` vs. `schedule_v3_reference`. Sub-resources (overrides, custom shifts, rotations, events) live under the same prefix as the schedule they belong to. ### When you don't know whether a schedule has been upgraded If you have a schedule ID but don't yet know whether the schedule is layer-based or shift-based, query the v3 endpoint first and fall back to v2 on a `400` response. v3 returns `400` when the ID resolves to a schedule that hasn't been upgraded; v2 will then succeed for the same ID. ```py import requests def get_schedule(schedule_id, params, headers): """Fetch a schedule whose type isn't known in advance.""" resp = requests.get( f"https://api.pagerduty.com/v3/schedules/{schedule_id}", headers=headers, params=params, ) if resp.status_code == 400: # Schedule is still layer-based — fall back to v2. resp = requests.get( f"https://api.pagerduty.com/schedules/{schedule_id}", headers=headers, params=params, ) resp.raise_for_status() return resp.json() ``` Once you have a successful response, branch on `schedule["type"]` for any shape-specific handling. --- ## 1. List schedules ### v2 — `GET /schedules` ```shell curl -G https://api.pagerduty.com/schedules \ -H 'Authorization: Token token=YOUR_API_KEY' \ -H 'Accept: application/vnd.pagerduty+json;version=2' \ --data-urlencode 'limit=25' \ --data-urlencode 'offset=0' \ --data-urlencode 'query=primary' ``` Response (abridged): ```json { "schedules": [ { "id": "PL5FQHC", "type": "schedule", "summary": "Primary On-Call", "self": "https://api.pagerduty.com/schedules/PL5FQHC", "html_url": "https://acme.pagerduty.com/schedules/PL5FQHC", "name": "Primary On-Call", "time_zone": "America/Los_Angeles", "description": "..." } ], "limit": 25, "offset": 0, "more": false, "total": null } ``` ### v3 — `GET /v3/schedules` ```shell curl -G https://api.pagerduty.com/v3/schedules \ -H 'Authorization: Token token=YOUR_API_KEY' \ -H 'Accept: application/vnd.pagerduty+json;version=2' \ --data-urlencode 'limit=100' \ --data-urlencode 'offset=0' \ --data-urlencode 'query=engineering' ``` Response (abridged): ```json { "schedules": [ { "id": "PL5FQHC", "type": "schedule_v3_reference", "summary": "Engineering On-Call", "self": "https://api.pagerduty.com/v3/schedules/PL5FQHC", "html_url": "https://acme.pagerduty.com/schedules/PL5FQHC" } ], "limit": 100, "offset": 0, "more": false, "total": null } ``` ### What changed - **List items are reference-shaped.** Each item carries only `id`, `type`, `summary`, `self`, and `html_url`. Fields like `name`, `description`, and `time_zone` move to the detail endpoint. - **`type` is `schedule_v3_reference`** for items in a v3 list. - **`self` URL points at the v3 path** (`/v3/schedules/{id}`). - **Pagination limit is the same as v2.** v3's `limit` defaults to 25 (max 100). Like v2, `total` is `null` unless you send `total=true`. ### What stayed the same - IDs and `html_url` are stable across the two versions. - `limit` and `offset` query parameters work the same way, with the same default (25) and cap (100). - The `query` parameter filters the list by schedule name, the same as in v2. - Pagination semantics (`more` flag, `offset`/`limit` cursoring) are unchanged. ### Upgrade tip To see all schedules on the account, call both list endpoints: ```shell # layer-based schedules curl https://api.pagerduty.com/schedules ... # shift-based schedules curl https://api.pagerduty.com/v3/schedules ... ``` Each item's `type` tells you which detail endpoint to call next: `schedule_reference` → `GET /schedules/{id}`, `schedule_v3_reference` → `GET /v3/schedules/{id}`. --- ## 2. Get a single schedule This is the operation where the response shape diverges most. The high-level rule: Identity, metadata, teams/EPs, and iCal URLs all carry over unchanged. Anything that exposes the *internal layer structure* of a schedule will be replaced with rotations and events. The final-schedule view changes shape too — see below. ### v2 — `GET /schedules/{id}` ```shell curl -G https://api.pagerduty.com/schedules/PL5FQHC \ -H 'Authorization: Token token=YOUR_API_KEY' \ -H 'Accept: application/vnd.pagerduty+json;version=2' \ --data-urlencode 'time_zone=UTC' \ --data-urlencode 'since=2026-04-29T00:00:00Z' \ --data-urlencode 'until=2026-05-29T00:00:00Z' ``` Response (abridged): ```json { "schedule": { "id": "PL5FQHC", "type": "schedule", "summary": "Primary On-Call", "self": "https://api.pagerduty.com/schedules/PL5FQHC", "html_url": "https://acme.pagerduty.com/schedules/PL5FQHC", "name": "Primary On-Call", "description": "...", "time_zone": "America/Los_Angeles", "escalation_policies": [ { "id": "PESC123", "type": "escalation_policy_reference" } ], "teams": [ { "id": "PTEAM01", "type": "team_reference" } ], "http_cal_url": "https://acme.pagerduty.com/private/...", "web_cal_url": "webcal://acme.pagerduty.com/private/...", "schedule_layers": [ { "id": "PSLAYER1", "name": "Layer 1", "rotation_virtual_start": "2026-01-01T00:00:00-08:00", "rotation_turn_length_seconds": 604800, "users": [ { "user": { "id": "PUSER01", "type": "user_reference" } } ], "restrictions": [ { "type": "weekly_restriction", "start_day_of_week": 1, "start_time_of_day": "09:00:00", "duration_seconds": 28800 } ], "rendered_schedule_entries": [ /* rendered shifts for [since, until] */ ] } ], "overrides_subschedule": { "rendered_schedule_entries": [ /* override entries in [since, until] */ ] }, "final_schedule": { "rendered_schedule_entries": [ /* merged final layer */ ] }, "oncall": { "user": { "id": "PUSER01", "type": "user_reference" } }, "users": [ { "id": "PUSER01", "type": "user_reference" } ] } } ``` ### v3 — `GET /v3/schedules/{id}` ```shell curl -G https://api.pagerduty.com/v3/schedules/PL5FQHC \ -H 'Authorization: Token token=YOUR_API_KEY' \ -H 'Accept: application/vnd.pagerduty+json;version=2' \ --data-urlencode 'time_zone=UTC' \ --data-urlencode 'since=2026-04-29T00:00:00Z' \ --data-urlencode 'until=2026-05-29T00:00:00Z' \ --data-urlencode 'include[]=final_schedule' ``` Response (abridged): ```json { "schedule": { "id": "PL5FQHC", "type": "schedule_v3", "name": "Primary On-Call", "description": "...", "time_zone": "America/Los_Angeles", "self": "https://api.pagerduty.com/v3/schedules/PL5FQHC", "html_url": "https://acme.pagerduty.com/schedules/PL5FQHC", "escalation_policies": [ { "id": "PESC123", "type": "escalation_policy_reference" } ], "teams": [ { "id": "PTEAM01", "type": "team_reference" } ], "http_cal_url": "https://acme.pagerduty.com/private/...", "web_cal_url": "webcal://acme.pagerduty.com/private/...", "rotations": [ { "id": "ABCDEFGHIJKLMNOPQRSTUVWXY2", "type": "schedule_rotation", "events": [ { "id": "ABCDEFGHIJKLMNOPQRSTUVWXY3", "type": "schedule_event", "name": "Weekday business hours", "start_time": { "date_time": "2026-01-05T09:00:00-08:00", "time_zone": "America/Los_Angeles" }, "end_time": { "date_time": "2026-01-05T17:00:00-08:00", "time_zone": "America/Los_Angeles" }, "effective_since": "2026-01-05T17:00:00Z", "effective_until": null, "recurrence": ["RRULE:FREQ=WEEKLY;BYDAY=MO,TU,WE,TH,FR"], "assignment_strategy": { "type": "rotating_member_assignment_strategy", "shifts_per_member": 1, "members": [ { "type": "user_member", "user_id": "PUSER01" } ] } } ] } ], "final_schedule": { "type": "final_schedule", "rendered_coverage_percentage": 100, "computed_shift_assignments": [ { "type": "computed_shift_assignment", "start_time": "2026-04-29T16:00:00Z", "end_time": "2026-04-30T00:00:00Z", "member": { "type": "user_member", "user_id": "PUSER01" }, "source": { "type": "schedule_rotation", "rotation_id": "ABCDEFGHIJKLMNOPQRSTUVWXY2" } } ] } } } ``` ### What stays the same These fields are populated identically (down to the value) for the same underlying schedule: - `id`, `name`, `description` - `time_zone` - `escalation_policies` and `teams` references - `http_cal_url`, `web_cal_url` - `html_url` (UI link is unchanged) ### What changes | v2 field | v3 equivalent | Notes | | :---- | :---- | :---- | | `type: "schedule"` | `type: "schedule_v3"` | Discriminator. Branch on this if you handle both. | | `self: /schedules/{id}` | `self: /v3/schedules/{id}` | Path prefix differs. | | `schedule_layers[]` | `rotations[]` | Whole structure replaced; see below. | | `overrides_subschedule` | (separate sub-resource) | Overrides moved to `GET /v3/schedules/{id}/overrides`. Not returned inline. | | `final_schedule.rendered_schedule_entries[]` | `final_schedule.computed_shift_assignments[]` | Flat list of "who is on when" is preserved; field names differ. Returned only with `include[]=final_schedule`. The `final_schedule` itself now also carries `type: "final_schedule"` and `rendered_coverage_percentage` (0–100). | | `oncall` (singular) | — | Not part of the v3 schedule response. To recover "who's on call right now," pass `since=now` and `until=now+1s` with `include[]=final_schedule` and read the first entry from `final_schedule.computed_shift_assignments[]`. | | `oncalls[]` | — | Not part of the v3 schedule response. Same recovery as above (use a narrow `final_schedule` window). | | `since` / `until` query params | Same | Behavior is unchanged: bound the time window for the computed `final_schedule`. | ### Layers vs. rotations: the shape change The most material change in the response. v2 modeled a schedule as a stack of *layers*, each with its own *restrictions* (time-of-day / day-of-week filters). v3 models it as a list of *rotations*, each containing one or more *events* (think iCal `VEVENT` with an `RRULE`). | v2 concept | v3 concept | | :---- | :---- | | A `schedule_layer` with one or more `restrictions` | A `rotation` with one or more `events`, each carrying an `RRULE` | | `rotation_virtual_start` + `rotation_turn_length_seconds` | Encoded in the event's `start_time`/`end_time` and `RRULE` | | `users[]` on the layer (round-robin order) | `assignment_strategy` on the event (`rotating_member_assignment_strategy` or `every_member_assignment_strategy`, with `members[]`) | | `rendered_schedule_entries[]` per layer | `final_schedule.computed_shift_assignments[]` (merged across rotations) | Two shape details worth flagging: - An event's `start_time` and `end_time` are **objects**, not strings: `{"date_time": "2026-01-05T09:00:00-08:00", "time_zone": "America/Los_Angeles"}`. The `time_zone` is part of the value, not a separate query parameter. - Each `final_schedule.computed_shift_assignments[]` entry has a `source` object (`{type, rotation_id?, shift_id?, override_id?}`) that tells you which rotation, custom shift, or override the shift came from. `source.type` is one of `schedule_rotation`, `custom_shift`, `schedule_rotation_override`, `custom_shift_override`. Per-layer rendered entries are not exposed in v3 — group by `source.rotation_id` if you need per-rotation breakdowns. ### `include[]` behavior v3 makes more fields opt-in than v2 did. The only valid `include[]` value is **`final_schedule`**. ``` ?include[]=final_schedule ``` v3 has no `exclude[]` parameter on the GET endpoint. Fields like `teams`, `escalation_policies`, `http_cal_url`, and `web_cal_url` are returned by default when the schedule has them. ### The `final_schedule` field Both v2 and v3 expose a `final_schedule` field that flattens "who's on call when" over the requested `[since, until]` window. In v2 it's the merged top-of-stack output of the rotation layers and the override layer; in v3 it's the merged result of stacking rotations, custom shifts, and overrides. The conceptual purpose is the same; the shape and semantics shift in a few notable ways: | Property | v2 | v3 | | :---- | :---- | :---- | | Returned by default? | Yes (whenever `since` / `until` are set) | No — must pass `include[]=final_schedule` | | Wrapper discriminator | (none) | `type: "final_schedule"` | | Coverage summary | (none) | `rendered_coverage_percentage` (0–100) | | List field | `rendered_schedule_entries[]` | `computed_shift_assignments[]` | | Per-entry user data | `entry.user` (full user reference, name inline) | `entry.member` (only `type` and `user_id`) | | Source attribution | Override entries surfaced separately under `overrides_subschedule` | Each entry's `source` object names the rotation, custom shift, or override it came from | | Concurrent on-calls | Always one user at a time (the merged final layer collapses) | Can be multiple — separate entries with overlapping windows | | Empty windows | Omitted from the list | Present, with `member.type = "empty_member"` | Iterating the field in v2: ```py schedule = resp.json()["schedule"] for entry in schedule["final_schedule"]["rendered_schedule_entries"]: print(entry["start"], entry["end"], entry["user"]["summary"]) ``` The same loop in v3: ```py schedule = resp.json()["schedule"] for a in schedule["final_schedule"]["computed_shift_assignments"]: if a["member"]["type"] == "empty_member": continue print(a["start_time"], a["end_time"], a["member"]["user_id"]) ``` Same conceptual shape — a flat list of "who is on when" — with different field names and a richer per-entry structure (source attribution and concurrent-on-call support) on the v3 side. Note that v3 returns the on-call user as a `user_id` only; if you need the user's name, fetch it from `GET /users/{user_id}`. ### Upgrade tip A typical v2 → v3 read path looks like: 1. Call `GET /v3/schedules/{id}?since=...&until=...&include[]=final_schedule`. 2. If you previously relied on `schedule_layers[*].rendered_schedule_entries[]`, replace with `final_schedule.computed_shift_assignments[]` (and group by `source.rotation_id` if you need per-rotation breakdowns). 3. If you previously relied on `oncall` (singular) or `oncalls[]`, request a narrow `final_schedule` window (`since=now`, `until=now+1s`) and read `computed_shift_assignments[].member` to find the active on-call user(s). 4. If you previously read `overrides_subschedule.rendered_schedule_entries[]`, fetch `GET /v3/schedules/{id}/overrides?since=...&until=...` separately. --- ## 3. Create an override (and when to use a custom shift instead) This is the operation with the largest semantic shift between v2 and v3. Skim "When an override is **not** the right tool in v3" below before translating v2 override calls. ### v2 — `POST /schedules/{id}/overrides` In v2, an override is a flat statement: "during `[start, end)`, the on-call person for schedule `{id}` is **this user**, regardless of what the rotation layers say." The override layer has top priority and replaces whoever else would have been on-call. ```shell curl -X POST https://api.pagerduty.com/schedules/PL5FQHC/overrides \ -H 'Authorization: Token token=YOUR_API_KEY' \ -H 'Accept: application/vnd.pagerduty+json;version=2' \ -H 'Content-Type: application/json' \ -d '{ "overrides": [ { "start": "2026-05-10T09:00:00-07:00", "end": "2026-05-10T17:00:00-07:00", "user": { "id": "PUSER02", "type": "user_reference" }, "time_zone": "America/Los_Angeles" } ] }' ``` Response (abridged): ```json { "overrides": [ { "id": "PXXXXXX", "start": "2026-05-10T16:00:00Z", "end": "2026-05-11T00:00:00Z", "user": { "id": "PUSER02", "type": "user_reference" } } ] } ``` ### v3 — `POST /v3/schedules/{id}/overrides` In v3, an override is **scoped to a specific source**: either a `rotation_id` or a `custom_shift_id`. The override replaces the assigned member of that source's shifts during the time window — **not** the schedule's on-call as a whole. ```shell curl -X POST https://api.pagerduty.com/v3/schedules/PL5FQHC/overrides \ -H 'Authorization: Token token=YOUR_API_KEY' \ -H 'Accept: application/vnd.pagerduty+json;version=2' \ -H 'Content-Type: application/json' \ -d '{ "overrides": [ { "type": "override_shift", "rotation_id": "ABCDEFGHIJKLMNOPQRSTUVWXY2", "start_time": "2026-05-10T16:00:00Z", "end_time": "2026-05-11T00:00:00Z", "overridden_member": { "type": "user_member", "user_id": "PUSER01" }, "overriding_member": { "type": "user_member", "user_id": "PUSER02" } } ] }' ``` Response (abridged): ```json { "overrides": [ { "id": "ABCDEFGHIJKLMNOPQRSTUVWXY4", "type": "override_shift", "rotation_id": "ABCDEFGHIJKLMNOPQRSTUVWXY2", "start_time": "2026-05-10T16:00:00Z", "end_time": "2026-05-11T00:00:00Z", "overridden_member": { "type": "user_member", "user_id": "PUSER01" }, "overriding_member": { "type": "user_member", "user_id": "PUSER02" } } ] } ``` ### Field-by-field mapping | v2 field | v3 field | Notes | | :---- | :---- | :---- | | `start` | `start_time` | Renamed; ISO-8601 with offset still accepted. | | `end` | `end_time` | Renamed. | | `user` | `overriding_member` | The replacement person. v3 uses the `user_member` shape: `{"type": "user_member", "user_id": "PUSER..."}`. | | (implicit — "whoever is on-call") | **`overridden_member`** | **Required** in v3. Identifies the specific member being replaced (relevant when the source rotation has multiple concurrent members). | | `time_zone` | (none) | Send absolute UTC (or offset-bearing) timestamps in `start_time` / `end_time`. v3 has no per-override `time_zone`. | | (none) | **`rotation_id` or `custom_shift_id`** | One of these must be set; setting both is rejected. | | (none) | **`type`** | Must be `"override_shift"` on each override. | ### The semantic difference (read this) In **v2**, an override is unconditionally global to the schedule. There's a single override layer, and any override on it wins over every rotation layer for the override window. In **v3**, a schedule can have multiple rotations producing overlapping coverage. An override must therefore declare *which source* it modifies: - `rotation_id: ...` → "during `[start_time, end_time)`, replace the assigned member of shifts coming from this rotation." Other rotations in the same window are unaffected. - `custom_shift_id: ...` → "during `[start_time, end_time)`, replace the assigned member of this specific custom shift." For a simple, single-rotation schedule (which is what most schedules upgraded from v2 look like immediately after the upgrade), this distinction is invisible — `rotation_id` will be the schedule's only rotation, and the v3 override behaves the same as the v2 override. It starts to matter once you (or your customer) take advantage of multi-rotation schedules, or once you try to express something v2 overrides could only fudge. ### When an override is **not** the right tool in v3 If you find yourself writing an override that has no good answer to "which `rotation_id` or `custom_shift_id` does this target?", an override probably isn't what you want. Consider a **custom shift** instead in these cases: #### 1. Filling an empty period You want someone on-call during a window where no rotation is currently producing shifts (e.g. a one-off emergency coverage block on a holiday when the rotation is paused, or extending coverage past the rotation's `effective_until`). - v2 way: just `POST /schedules/{id}/overrides` — there's nothing being replaced, but v2 doesn't care. - v3 way: `POST /v3/schedules/{id}/custom_shifts`. There is no rotation to override against, so trying to express this as an override has no valid `rotation_id`. ```shell curl -X POST https://api.pagerduty.com/v3/schedules/PL5FQHC/custom_shifts \ -H 'Authorization: Token token=YOUR_API_KEY' \ -H 'Accept: application/vnd.pagerduty+json;version=2' \ -H 'Content-Type: application/json' \ -d '{ "custom_shifts": [ { "type": "custom_shift", "start_time": "2026-12-25T00:00:00Z", "end_time": "2026-12-26T00:00:00Z", "assignments": [ { "type": "shift_assignment", "member": { "type": "user_member", "user_id": "PUSER02" } } ] } ] }' ``` A custom shift takes **exactly one** assignment (`minItems: 1, maxItems: 1`). To put two people on-call simultaneously, create two separate custom shifts with the same `start_time`/`end_time`. #### 2. Adding coverage rather than swapping a person You want an *additional* person on-call during a window without removing the existing on-call person — for example, a second responder during a deployment. - v2 way: there is no clean way; v2 overrides replace the on-call user, they don't augment coverage. Customers often misuse overrides for this and end up with the wrong person paged. - v3 way: `POST /v3/schedules/{id}/custom_shifts`. Custom shifts add to the schedule rather than replacing rotation output. #### 3. The window doesn't correspond to a rotation's recurrence at all You want to express "Alice covers the on-call line for this maintenance window" and the window doesn't line up with any single rotation's shifts (e.g. it spans rotation boundaries, or it's a one-off that has nothing to do with the regular rotation). - v2 way: one override. - v3 way: a custom shift is usually the cleaner expression. An override is still valid if you genuinely want to *replace the rotation's contribution* during the window — but if the rotation's contribution is incidental to what you're modeling, custom shift first. ### Quick decision guide ``` Did the v2 override replace a person that the rotation would otherwise have produced for that exact window? ├── Yes — v3: override on that rotation's id (overriding_member). └── No / not really — v3: custom shift. ``` A useful sanity check: if removing the override would leave the schedule with the *correct* on-call person, the override is doing replacement work — keep it as an override. If removing the override would leave a *gap* (or remove an extra responder you wanted), what you actually wanted was a custom shift. ### What stays the same - The endpoint is still `POST` to `/.../{schedule_id}/overrides`. - The request body still wraps an array under `"overrides"`, supporting batch creation. - `DELETE /v3/schedules/{id}/overrides/{override_id}` mirrors v2's delete shape (just under the v3 path prefix). - Permissions to manage overrides are unchanged: a user who could create v2 overrides on a schedule can create v3 overrides on the upgraded schedule. --- ## 4. Worked example: print the current on-call user for every schedule A common script: List every schedule on the account and print who's on call right now. This is the kind of integration that breaks the day a schedule is upgraded from layer-based to shift-based, because the `/schedules/{id}/users` endpoint that v2 scripts lean on is layer-based and isn't the supported way to read on-call from a shift-based schedule. We'll start with a v2-only version that works only for layer-based schedules, then evolve it into a hybrid version that handles both shapes. All examples below assume `pip install requests` and `export PAGERDUTY_API_KEY=...`. ### v2-only: layer-based schedules ```py #!/usr/bin/env python3 """Print the current on-call user(s) for every schedule on the account. Works against the v2 PagerDuty Schedules API. Returns nothing useful for shift-based (v3-shaped) schedules. """ import os from datetime import datetime, timedelta, timezone import requests API_KEY = os.environ["PAGERDUTY_API_KEY"] BASE = "https://api.pagerduty.com" HEADERS = { "Authorization": f"Token token={API_KEY}", "Accept": "application/vnd.pagerduty+json;version=2", } def list_schedules(): """Yield every schedule on the account, one per item.""" offset, limit = 0, 100 while True: resp = requests.get( f"{BASE}/schedules", headers=HEADERS, params={"limit": limit, "offset": offset}, ) resp.raise_for_status() body = resp.json() yield from body["schedules"] if not body["more"]: return offset += limit def current_oncall_users(schedule_id): """Return the users on call for the schedule right now. Asking for `final_schedule` over a 1-second window centered on now gives us the active assignment(s) — `final_schedule` is the merged, on-call-resolution view of the schedule. """ now = datetime.now(timezone.utc) resp = requests.get( f"{BASE}/schedules/{schedule_id}", headers=HEADERS, params={ "since": now.isoformat(), "until": (now + timedelta(seconds=1)).isoformat(), "include[]": "final_schedule", }, ) resp.raise_for_status() final = resp.json()["schedule"].get("final_schedule") or {} return [ entry["user"]["summary"] for entry in final.get("rendered_schedule_entries", []) ] for schedule in list_schedules(): users = current_oncall_users(schedule["id"]) label = ", ".join(users) if users else "(no one on call)" print(f"{schedule['summary']}: {label}") ``` This works against layer-based schedules. Shift-based schedules don't appear in the `/schedules` list response, and `GET /schedules/{id}` against a shift-based schedule's ID won't return the `final_schedule.rendered_schedule_entries` shape this script reads from. The hybrid script below dispatches each schedule to the right endpoint by `type`. ### v2 + v3: handles both layer-based and shift-based schedules ```py #!/usr/bin/env python3 """Print the current on-call user(s) for every schedule on the account. Handles both layer-based and shift-based schedules by branching on the `type` field returned by the schedule list. """ import os from datetime import datetime, timedelta, timezone import requests API_KEY = os.environ["PAGERDUTY_API_KEY"] BASE = "https://api.pagerduty.com" HEADERS = { "Authorization": f"Token token={API_KEY}", "Accept": "application/vnd.pagerduty+json;version=2", } def list_schedules(): """Yield every schedule on the account — layer-based AND shift-based. The v2 and v3 list endpoints each return only their own schedule type, so we call both and chain the results. Each item's `type` field tells us which detail endpoint to use later. """ yield from _paginate(f"{BASE}/schedules") yield from _paginate(f"{BASE}/v3/schedules") def _paginate(url): offset, limit = 0, 100 while True: resp = requests.get( url, headers=HEADERS, params={"limit": limit, "offset": offset}, ) resp.raise_for_status() body = resp.json() yield from body["schedules"] if not body["more"]: return offset += limit def layer_based_oncall_users(schedule_id): """Layer-based path: who's on this schedule right now.""" now = datetime.now(timezone.utc) resp = requests.get( f"{BASE}/schedules/{schedule_id}", headers=HEADERS, params={ "since": now.isoformat(), "until": (now + timedelta(seconds=1)).isoformat(), "include[]": "final_schedule", }, ) resp.raise_for_status() final = resp.json()["schedule"].get("final_schedule") or {} return [ entry["user"]["summary"] for entry in final.get("rendered_schedule_entries", []) ] def shift_based_oncall_users(schedule_id): """Shift-based path: who's on this schedule right now. The v3 GET endpoint returns the computed final schedule for the requested time window. A 1-second window centered on "now" gives us the active assignment(s). """ now = datetime.now(timezone.utc) resp = requests.get( f"{BASE}/v3/schedules/{schedule_id}", headers=HEADERS, params={ "since": now.isoformat(), "until": (now + timedelta(seconds=1)).isoformat(), "include[]": "final_schedule", }, ) resp.raise_for_status() final = resp.json()["schedule"].get("final_schedule") or {} return [ a["member"]["user_id"] for a in final.get("computed_shift_assignments", []) if a["member"]["type"] == "user_member" ] def current_oncall_users(schedule): if schedule["type"] == "schedule_v3_reference": return shift_based_oncall_users(schedule["id"]) return layer_based_oncall_users(schedule["id"]) for schedule in list_schedules(): users = current_oncall_users(schedule) label = ", ".join(users) if users else "(no one on call)" print(f"{schedule['summary']}: {label}") ``` ### What changed and why Four concrete changes between the v2-only and the hybrid script: 1. **List both endpoints to enumerate every schedule.** `GET /schedules` returns only layer-based schedules; `GET /v3/schedules` returns only shift-based schedules. The script paginates each in turn and chains the results. Each list item's `type` field (`schedule_reference` for layer-based, `schedule_v3_reference` for shift-based) is the dispatch signal we use in step 2. 2. **Branch on `schedule["type"]`.** Layer-based items have `type: "schedule_reference"` (or `"schedule"` in some contexts); shift-based items have `type: "schedule_v3_reference"`. The on-call query path differs by shape — there is no single endpoint that answers "who's on call" for both kinds — so you have to dispatch. 3. **Same request, different path and response field for shift-based schedules.** Both halves of the script ask "who is on call during this window?" by fetching `final_schedule` over a 1-second window centered on now. What differs: | Aspect | v2 (layer-based) | v3 (shift-based) | | :---- | :---- | :---- | | Path | `GET /schedules/{id}` | `GET /v3/schedules/{id}` | | Window param | `since` / `until` | `since` / `until` | | Include | `include[]=final_schedule` | `include[]=final_schedule` | | Response field with assignments | `final_schedule.rendered_schedule_entries[]` | `final_schedule.computed_shift_assignments[]` | | Per-assignment user data | `entry.user` (full user reference: `id`, `summary`, `type`, `html_url`, `self`) | `entry.member` (only `type` and `user_id`) | On v3, an assignment's `member` may carry `type: "empty_member"` if the slot is intentionally unassigned; the script filters those out. 4. **Per-entry user data is just an ID on v3.** In v2, each `rendered_schedule_entries[].user` is a full user reference with `id`, `summary`, and `type` inline. In v3, each `computed_shift_assignments[].member` carries only `type` and `user_id`. The script above prints whatever each path natively returns (names from v2, IDs from v3); a real integration that needs names on both sides would resolve the v3 `user_id` via `GET /users/{user_id}`. Two subtler changes worth calling out: - **More than one user can be on call at the same time on v3.** A v2 schedule's `final_schedule.rendered_schedule_entries[]` collapses to at most one user at any given moment — the merged final layer always picks a single on-call. A v3 schedule can have multiple rotations producing concurrent shifts, or an event with `every_member_assignment_strategy`, either of which puts more than one user on call simultaneously. Scripts that previously assumed "one user per schedule per moment" (`users[0]`, `oncall.user.summary`, alerting "the on-call person") need to handle a list. The hybrid script above already returns a list and joins names with a comma — if your downstream expects a single name, decide deliberately whether to take the first, list all of them, or surface the multi-coverage state to the operator. - **No `oncall` (singular) field on v3.** A common v2 pattern is to call `GET /schedules/{id}` and read `schedule.oncall.user.summary`. The v3 schedule response has no `oncall` and no `oncalls` — the supported way to ask "who's on right now" is the narrow `final_schedule` query above. This is a direct consequence of the previous point: there isn't always a single `oncall` to return. What stays unchanged: - Pagination on `GET /schedules` (`limit`/`offset`/`more`). The `limit` default (25) and cap (100) match the v3 list endpoint (see the **List schedules** section above). - Authentication. Both endpoints accept the same `Authorization: Token token=...` header and the same scoped OAuth tokens. - `GET /users/{id}`. User identity lookup is the same in both worlds; only the schedule endpoints fork. --- ## 5. Worked example: put a user on call for the next hour after a PR merge A common automation pattern: after a pull request is merged, put the pull request author on call for the next hour so they're paged for any fallout from their change. On v2, this is an override; on v3, the same pattern fits a **custom shift** more cleanly than an override. ### v2: one override on the schedule ```py #!/usr/bin/env python3 """Put `user_id` on call for the next hour on a layer-based schedule.""" import os from datetime import datetime, timedelta, timezone import requests API_KEY = os.environ["PAGERDUTY_API_KEY"] BASE = "https://api.pagerduty.com" HEADERS = { "Authorization": f"Token token={API_KEY}", "Accept": "application/vnd.pagerduty+json;version=2", "Content-Type": "application/json", } def put_oncall_for_one_hour(schedule_id, user_id): now = datetime.now(timezone.utc) end = now + timedelta(hours=1) resp = requests.post( f"{BASE}/schedules/{schedule_id}/overrides", headers=HEADERS, json={ "overrides": [ { "start": now.isoformat(), "end": end.isoformat(), "user": {"id": user_id, "type": "user_reference"}, } ] }, ) resp.raise_for_status() return resp.json()["overrides"][0] ``` ### v3: one custom shift on the schedule ```py #!/usr/bin/env python3 """Put `user_id` on call for the next hour on a shift-based schedule.""" import os from datetime import datetime, timedelta, timezone import requests API_KEY = os.environ["PAGERDUTY_API_KEY"] BASE = "https://api.pagerduty.com" HEADERS = { "Authorization": f"Token token={API_KEY}", "Accept": "application/vnd.pagerduty+json;version=2", "Content-Type": "application/json", } def put_oncall_for_one_hour(schedule_id, user_id): now = datetime.now(timezone.utc) end = now + timedelta(hours=1) resp = requests.post( f"{BASE}/v3/schedules/{schedule_id}/custom_shifts", headers=HEADERS, json={ "custom_shifts": [ { "type": "custom_shift", "start_time": now.isoformat(), "end_time": end.isoformat(), "assignments": [ { "type": "shift_assignment", "member": {"type": "user_member", "user_id": user_id}, } ], } ] }, ) resp.raise_for_status() return resp.json()["custom_shifts"][0] ``` ### Why custom shift and not override For the post-merge use case, **a custom shift fits the intent more directly than an override**: - The intent is "add this person to the on-call set for the next hour," not "replace whoever is scheduled." The pull request author is the *additional* responder, on top of the regular rotation. An override would replace the rotation's on-call user, which is rarely what a post-merge hook actually wants. - A custom shift doesn't need to look up `overridden_member` — there's nothing being replaced. - A custom shift doesn't need a `rotation_id` — it stands on its own and survives even if the rotations change shape later. - A v3 schedule can have any number of users on call simultaneously, so adding one more is a first-class operation, not a workaround. Create an override on v3 only when you genuinely want to **replace** a specific rotation's assigned user (e.g. "Alice is sick, Bob covers her shift on the primary rotation"). For "add another responder," use custom shift instead. ### What changed and why - **v2 implicitly replaces; v3 explicitly adds.** v2's override layer wins over rotation layers, so the override-layer entry becomes the on-call. The new user is the sole on-call during the window. v3's custom shift is additive: the rotation's regular on-call user remains on call, and the custom shift's user is *also* on call. v3 lets a schedule have multiple users on call at the same time, and this is the v3-native way to express "another person is also responsible." - **Stacking behavior of repeated calls also differs.** If the post-merge hook fires three times in an hour on v2, the override layer ends up with three overrides for overlapping windows; the schedule's resolution rules pick one user as on-call. On v3, three custom shifts means all three users are on call simultaneously. If you want to keep that to one ad-hoc responder, see "Keeping at most one ad-hoc responder" below. - **The `overridden_member` lookup goes away.** Custom shifts don't replace anything, so the `final_schedule` query that the override-based v3 example would need is gone. ### Keeping at most one ad-hoc responder Sometimes you don't want post-merge custom shifts to pile up — only the most recent pull request author should be on call as the ad-hoc responder. v3 makes that decision explicit: list the existing custom shifts in the window, delete them, then create the new one. ```py def put_oncall_for_one_hour_replacing_others(schedule_id, user_id): now = datetime.now(timezone.utc) end = now + timedelta(hours=1) # List custom shifts overlapping the window and delete them first. resp = requests.get( f"{BASE}/v3/schedules/{schedule_id}/custom_shifts", headers=HEADERS, params={"since": now.isoformat(), "until": end.isoformat()}, ) resp.raise_for_status() for shift in resp.json().get("custom_shifts", []): requests.delete( f"{BASE}/v3/schedules/{schedule_id}/custom_shifts/{shift['id']}", headers=HEADERS, ).raise_for_status() # Create the new one. return put_oncall_for_one_hour(schedule_id, user_id) ``` Two things worth emphasizing about this variant: - **Deleting custom shifts only affects ad-hoc coverage.** Rotation-based on-call coverage is untouched; the regular rotation user remains on call regardless of how many custom shifts you delete. To replace the rotation user, you'd need an override on the rotation — a different operation. - **The "keep or delete" choice didn't exist on v2.** The v2 override layer applied its own resolution rules across stacked overrides (most recent wins, in practice). v3 surfaces the choice as data: each custom shift is a real, addressable resource you can list, delete, or leave alone deliberately. --- ## 6. Worked example: offboarding a user from a rotation A user is leaving the team and needs to come off a rotation. On v3, the natural shape of this is a two-phase flow built around the **unassigned slot** — a first-class concept where a member position in the rotation is intentionally vacant. The unassigned slot lets you remove a user without committing to a replacement in the same step, and without disturbing anyone else's place in the rotation. 1. **Now** — replace the user with an unassigned slot. They stop being paged immediately. The rotation's cadence stays exactly the same: the offboarded user's seat is just empty until you fill it, and every other member keeps the same on-call weeks they would have had. 2. **Later** — fill the unassigned slot with a replacement user once one is identified. ### v2: edit the rotation layer's `users` list In v2, a rotation layer's members live in `schedule_layers[*].users[]`. Removing a user is a `PUT /schedules/{id}` with the user dropped from that list: ```py schedule = requests.get(f"{BASE}/schedules/{schedule_id}", headers=HEADERS).json()["schedule"] # Remove the offboarded user from each rotation layer for layer in schedule["schedule_layers"]: layer["users"] = [u for u in layer["users"] if u["user"]["id"] != "PUSER01"] requests.put( f"{BASE}/schedules/{schedule_id}", headers=HEADERS, json={"schedule": schedule}, ) ``` v2 has no "unassigned slot" concept. Removing a user shrinks the rotation: the remaining users absorb the vacated shifts and the rotation cadence changes for everyone. A team that used to rotate weekly across three people now rotates weekly across two, so each person's on-call frequency goes up and the calendar slot they used to hold may shift to a different week. This churn — getting unrelated people moved around when one user leaves without an immediate replacement — is one of the rough edges of v2 rotation membership; v3 fixes it by treating the vacant slot as an explicit, first-class state. ### v3: delete the active event, create a successor Members live on each event's `assignment_strategy.members[]`. The catch: an active event (one that's already producing shifts) can't have its members changed in place. Swapping members on a live rotation always means **terminating the current event** and **starting a new one** with the swapped members from the cutover time onward. The simplest way to terminate an active event is to **delete** it. A `DELETE` on an event in v3 doesn't erase history: shifts the event already produced — past on-call assignments, paged users, escalations — remain on the schedule's record. What it does is stop the event from producing any further shifts, equivalent to capping it at the deletion time. So the offboarding flow per phase is two calls: `DELETE` the active event, then `POST` a successor with the new members. #### Phase 1 — replace the offboarded user with `empty_member` Delete the active event: ```py from datetime import datetime, timezone now = datetime.now(timezone.utc) requests.delete( f"{BASE}/v3/schedules/{schedule_id}/rotations/{rotation_id}/events/{event_id}", headers=HEADERS, ) ``` Then `POST` a successor with the same shape but the offboarded user replaced by `empty_member`: ```py requests.post( f"{BASE}/v3/schedules/{schedule_id}/rotations/{rotation_id}/events", headers=HEADERS, json={"event": { "name": "Primary on-call", "start_time": {"date_time": "...", "time_zone": "America/Los_Angeles"}, "end_time": {"date_time": "...", "time_zone": "America/Los_Angeles"}, "effective_since": now.isoformat(), "recurrence": ["RRULE:FREQ=WEEKLY;BYDAY=MO,TU,WE,TH,FR"], "assignment_strategy": { "type": "rotating_member_assignment_strategy", "shifts_per_member": 1, "members": [ {"type": "empty_member"}, # was PUSER01 {"type": "user_member", "user_id": "PUSER02"}, {"type": "user_member", "user_id": "PUSER03"}, ], }, }}, ) ``` `name`, `start_time`, `end_time`, and `recurrence` are typically copied from the event being replaced — fetch it first via `GET /v3/schedules/{id}/rotations/{rotation_id}/events/{event_id}`. The `members` list is the only thing that changes. After these two calls, the original event still produced shifts up to `now`, and the successor takes over from `now` with the rotation including an unassigned slot. `final_schedule` reads for windows after `now` show `member.type = "empty_member"` for the gap. #### Phase 2 — fill the unassigned slot with a new user Same two-call pattern, against the now-active successor event from Phase 1. List the rotation's events to find the active `event_id`, then `DELETE` it and `POST` another successor whose `assignment_strategy.members` fills the slot: ```py members = [ {"type": "user_member", "user_id": "PUSER04"}, # was empty {"type": "user_member", "user_id": "PUSER02"}, {"type": "user_member", "user_id": "PUSER03"}, ] ``` ### What changed and why - **Active event members are immutable.** v3 doesn't let you change the members of an event that's already producing shifts. To change *who's* on the rotation, you stop the running event and start a new one alongside it. `DELETE` is the cleanest way to stop the running event because it preserves history — shifts already produced keep their member assignments — and the deletion time becomes the implicit cutover. - **`empty_member` keeps the rotation's cadence intact.** Marking a position vacant is a normal rotation state in v3, not a hack. The rotation's other members continue producing shifts on the same weeks they would have anyway — replacing a user with `empty_member` does not shrink the cycle or shuffle anyone else's schedule. `final_schedule.computed_shift_assignments[]` surfaces the empty windows as `member.type = "empty_member"` so reporting and dashboards can flag the gap explicitly. (Compare with v2: dropping a user from `users[]` shrinks the rotation and changes everyone's on-call frequency.) - **Two phases, same shape.** Phase 1 swaps user → empty; Phase 2 swaps empty → user. Both use the same delete-then-POST pattern; the only difference is the `from` and `to` members in the new event's `members[]`. - **Future events can be edited in place.** If the event being changed has an `effective_since` in the future (it hasn't started producing shifts yet), `PUT` the event with the new members — no delete-and-recreate needed. A `PUT` replaces the full event: send the required fields (`name`, `start_time`, `end_time`, `effective_since`, `recurrence`, `assignment_strategy`), not only the members. Also include any optional field you want to keep, such as `effective_until`. A partial body returns `400` with `must not be null`. The pattern above is the safe default that works regardless of timing. ## Developer Agreement Your access to and use of the PagerDuty Developer Services is governed by the [PagerDuty Developer Agreement](/developer/pagerduty-developer-agreement). --- URL: https://docs.pagerduty.com/developer/send-alert-event # Sending an Alert Event Documents the /v2/enqueue endpoint parameters for submitting trigger, acknowledge, and resolve alert events to PagerDuty. ## Endpoint ```http https://events.pagerduty.com/v2/enqueue ``` ### Parameters | Parameters | Type | Description | | ------------------------------------ | ---------------- | -------------------------------------------------------------------------------------------------------------------------------------------------------------------- | | `routing_key`
**Required** | String | This is the 32 character Integration Key for an integration on a service or on a global ruleset. | | `event_action`
**Required** | String | The type of event. Can be `trigger`, `acknowledge` or `resolve`. | | `dedup_key`
| String | Deduplication key for correlating triggers and resolves. The maximum permitted length of this property is 255 characters. | | `payload.summary`
**Required** | String | A brief text summary of the event, used to generate the summaries/titles of any associated alerts. The maximum permitted length of this property is 1024 characters. | | `payload.source`
**Required** | String | The unique location of the affected system, preferably a hostname or FQDN. | | `payload.severity`
**Required** | String | The perceived severity of the status the event is describing with respect to the affected system. This can be `critical`, `error`, `warning` or `info`. | | `payload.timestamp` | timestamp | The time at which the emitting tool detected or generated the event. | | `payload.component` | String | Component of the source machine that is responsible for the event, for example `mysql` or `eth0` | | `payload.group` | String | Logical grouping of components of a service, for example `app-stack` | | `payload.class` | String | The class/type of the event, for example `ping failure` or `cpu load` | | `payload.custom_details` | Object | Additional details about the event and affected system | | `images` | Array of Objects | List of images to include. | | `links` | Array of Objects | List of links to include. | ### Alert De-Duplication Every alert event has a `dedup_key`: a string which identifies the alert triggered for the given event. The `dedup_key` can be specified when submitting the first trigger event that creates an alert. If omitted, it will be generated automatically by PagerDuty and returned in the Events API v2 response. Submitting subsequent events with the same `dedup_key` will result in those events being applied to an open alert matching that `dedup_key`. Once the alert is resolved, any further events with the same `dedup_key` will create a new alert (for `trigger` events) or be dropped (for `acknowledge` and `resolve` events). Alerts will only be created for events with an `event_action` of `trigger`. `Acknowledge` or `resolve` events without a currently open alert will not create a new one. Subsequent events for the same `dedup_key` will only apply to the open alert if the events are sent via the same `routing_key` as the original trigger event. Subsequent acknowledge or resolve events sent via a different `routing_key` from the original will be dropped. A trigger event sent without a `dedup_key` will always generate a new alert because the automatically generated `dedup_key` will be a unique [UUID](/developer/types#uuid). Alerts can be further grouped into Incidents, for centralizing incident response and context. For more information on the way events, alerts, and incidents interact, please see [this knowledge base article](/incident-management/incidents/alerts). ### Event Action Behavior Three actions can be specified in the `event_action` parameter. Each represents a different type of activity. | Event Action | Behavior in PagerDuty | | ------------- | ------------------------------------------------------------------------------------------------------------------------------------------------------------------------------------------------------------------------------------------------------------------------------------------------------------------------------------------------------------------------------------------------------------------------------------ | | `trigger` | A new alert is opened or a trigger log entry is created on an existing alert if one already exists with the same `dedup_key`.
Use this event action when a new problem has been detected. Additional triggers _may_ be sent when a previously detected problem has occurred again. | | `acknowledge` | The incident referenced with the `dedup_key` will enter the acknowledged state.
While an incident is acknowledged, it won't generate any additional notifications, even if it receives new trigger events.
Use this event action to indicate that someone is presently working on the problem. | | `resolve` | The incident referenced with the `dedup_key` will enter the resolved state.
Once an incident is resolved, it won't generate any additional notifications. New trigger events with the same `incident_key` / `dedup_key` as a resolved incident won't re-open the incident. Instead, a new incident will be created.
Use this event action when the problem that caused the initial trigger event has been fixed. | ### Example Request Payloads **Trigger** ```json /* This example shows how to send a trigger event without a dedup_key. In this case, PagerDuty will automatically assign a random and unique key and return it in the response object. You should store this key in case you want to send an acknowledge or resolve event to this incident in the future. */ { "payload": { "summary": "Example alert on host1.example.com", "timestamp": "2015-07-17T08:42:58.315+0000", "source": "monitoringtool:cloudvendor:central-region-dc-01:852559987:cluster/api-stats-prod-003", "severity": "info", "component": "postgres", "group": "prod-datapipe", "class": "deploy", "custom_details": { "ping time": "1500ms", "load avg": 0.75 } }, "routing_key": "samplekeyhere", "dedup_key": "samplekeyhere", "images": [ { "src": "https://www.pagerduty.com/wp-content/uploads/2016/05/pagerduty-logo-green.png", "href": "https://example.com/", "alt": "Example text" } ], "links": [ { "href": "https://example.com/", "text": "Link text" } ], "event_action": "trigger", "client": "Sample Monitoring Service", "client_url": "https://monitoring.example.com" } ``` **Acknowledge** ```json { "routing_key": "routingkeyhere", "dedup_key": "dedupkeyhere", "event_action": "acknowledge" } ``` **Resolve** ```json { "routing_key": "routingkeyhere", "dedup_key": "dedupkeyhere", "event_action": "resolve" } ``` ### Responses and Limits See the [Events API v2 Overview page](/developer/events-api-v2-overview#response-codes--retry-logic) for response codes and limits. ### Context Properties These properties can be used to attach informational assets to the incident record. Each element of these arrays is an [object](/developer/types#object). #### The `images` Property This property is used to attach images to the incident. Each object in the list has the following properties: | Name | Required | Description | | ------ | -------- | -------------------------------------------------------------------------------------------------- | | `src` | Yes | The source (URL) of the image being attached to the incident. This image must be served via HTTPS. | | `href` | No | Optional URL; makes the image a clickable link. | | `alt` | No | Optional alternative text for the image. | #### The `links` Property This property is used to attach text links to the incident. Each object in the list has the following properties: | Name | Required | Description | | ------ | -------- | -------------------------------------------------------------------------------------- | | `href` | Yes | URL of the link to be attached. | | `text` | No | Plain text that describes the purpose of the link, and can be used as the link's text. | ## Try it Out The Events API v2 requires a `routing_key`. You can [create an Events API v2 integration on any PagerDuty service](/incident-management/services/services-and-integrations#events-api-v2) in order to get a routing key that will route an event to that service. You can also use an integration key from a [ruleset](/ai-automation/aiops/rulesets#global-rulesets) to send alert events. [Try it out here](/developer/send-event-form) ## Developer Agreement Your access to and use of the PagerDuty Developer Services is governed by the [PagerDuty Developer Agreement](/developer/pagerduty-developer-agreement). --- URL: https://docs.pagerduty.com/developer/send-change-event # Sending a Change Event Documents the /v2/change/enqueue endpoint used to post non-incident change events tied to a service's integration routing key. ## Endpoint ```http https://events.pagerduty.com/v2/change/enqueue ``` ## Parameters Parameters | Type | Description ----------------------------------------------------------------- | ---------------- | ----------- `routing_key`
**Required** | String | This is the 32 character Integration Key for an Integration on a Service. The same Integration Key can be used for both alert and change events. `payload.summary`
**Required** | String | A brief text summary of the event. Displayed in PagerDuty to provide information about the change. The maximum permitted length of this property is 1024 characters. `payload.source` | String | The unique name of the location where the Change Event occurred. `payload.timestamp` | Timestamp | The time at which the emitting tool detected or generated the event. `payload.custom_details` | Object | Additional details about the event. `links` | Array of Objects | List of links to include. ## Example Request Payload ```json { "routing_key": "samplekeyhere", "payload": { "summary": "Build Success: Increase snapshot create timeout to 30 seconds", "timestamp": "2020-07-17T08:42:58.315+0000", "source": "acme-build-pipeline-tool-default-i-9999", "custom_details": { "build_state": "passed", "build_number": "2", "run_time": "1236s" } }, "links": [ { "href": "https://acme.pagerduty.dev/build/2", "text": "View more details in Acme!" } ] } ``` You should send Change Events with a valid routing key attached to a Service. PagerDuty will process Change Events when they are received and route them to the appropriate Service. ## Context Properties These properties can be used to attach informational assets to the incident record. Each element of these arrays is an [object.](/developer/types#object) Currently, the Change Events API only supports `links` as a custom property. ### The `links` Property This property is used to attach text links to the Change Event. Each object in the list has the following properties: Name | Required | Description ------ | -------- | ----------- `href` | Yes | URL of the link to be attached. `text` | No | Plain text that describes the purpose of the link, and can be used as the link's text. ## Responses and Limits See the [Events API v2 Overview](/developer/events-api-v2-overview#response-codes--retry-logic) for response codes and limits. ## Data Retention PagerDuty will only keep the last 90 days of Change Events, as per our data retention guidelines. ## Try it Out The Events API v2 requires a `routing_key`. You can [create an Events API v2 integration on any PagerDuty service](/incident-management/services/services-and-integrations#events-api-v2) in order to get a routing key that will route an event to that service. Note that the same Integration Key can be used to send both alert and change events. [Try it out here](/developer/send-event-form) ## Developer Agreement Your access to and use of the PagerDuty Developer Services is governed by the [PagerDuty Developer Agreement](/developer/pagerduty-developer-agreement). --- URL: https://docs.pagerduty.com/developer/send-v1-event # Send a v1 Event Documents the legacy generic event endpoint's trigger, acknowledge, and resolve parameters for the Events API v1 integration. ## Endpoint ```http https://events.pagerduty.com/generic/2010-04-15/create_event.json ``` ## Parameters Parameters | Type | Description ------------------------------ | ------------------- | ------------- `service_key` | String | A version 4 UUID expressed as a 32-digit hexadecimal number. This is the Integration Key for an integration on any given service. `event_type` | String | The type of event. Can be `trigger`, `acknowledge` or `resolve`. `incident_key` | String | Identifies the incident to `trigger`, `acknowledge`, or `resolve`. Required unless the event_type is `trigger`. The maximum permitted length of this property is 255 characters. `description` | String | Text that will appear in the incident's log associated with this event. Required for trigger events. The maximum permitted length of this property is 1024 characters. `details` | Object | An arbitrary JSON object containing any data you'd like included in the incident log. `client` | String | The name of the monitoring client that is triggering this event. (This field is only used for trigger events.) `client_url` | String | The URL to view the analogous event in the UI of the monitoring client, if any. (This field is only used for `trigger` events.) `contexts` | Array of Objects | Contexts to be included with the incident trigger such as links to graphs or images (see format below). (This field is only used for `trigger` events.) ## Using the Events API Your monitoring tools should send PagerDuty a `trigger` event to report a new or ongoing problem. When PagerDuty receives a `trigger` event, it will either open a new incident, or add a new trigger [log entry](/developer/api/reference/rest/log-entries/list-log-entries) to an existing incident, depending on the provided `incident_key`. Read more about event types and incident de-duplication in the [Events API v1 Overview](/developer/events-api-v1-overview). ## Example Request Payloads **Trigger Event** ```json /* This example shows how to send a trigger event without an incident_key. In this case, PagerDuty will automatically assign a random and unique key and return it in the response object. You should store this key in case you want to send an acknowledge or resolve event to this incident in the future. */ { "service_key": "e93facc04764012d7bfb002500d5d1a6", "event_type": "trigger", "description": "FAILURE for production/HTTP on machine srv01.acme.com", "client": "Sample Monitoring Service", "client_url": "https://monitoring.service.com", "details": { "ping time": "1500ms", "load avg": 0.75 }, "contexts": [ { "type": "link", "href": "http://acme.pagerduty.com", "text": "View in custom tool" }, { "type": "link", "href": "http://acme.pagerduty.com", "text": "View the incident on PagerDuty" }, { "type": "image", "src": "https://chart.googleapis.com/chart?chs=600x400&chd=t:6,2,9,5,2,5,7,4,8,2,1&cht=lc&chds=a&chxt=y&chm=D,0033FF,0,0,5,1" } ] } ``` **Acknowledge Event** ```json /* This example acknowledges an existing open incident with the incident key 'srv01/HTTP'. If there is no open incident with that service key, no action will be taken. */ { "service_key": "e93facc04764012d7bfb002500d5d1a6", "event_type": "acknowledge", "incident_key": "srv01/HTTP" } ``` **Resolve Event** ```json /* This example resolves an existing open incident with the incident key 'srv01/HTTP'. If there is no open incident with that service key, no action will be taken. */ { "service_key": "e93facc04764012d7bfb002500d5d1a6", "event_type": "resolve", "incident_key": "srv01/HTTP" } ``` ## Response Format If the event is improperly formatted, a `400 Bad Request` will be returned. There is a limit on the number of events that a service can accept at any given time. Depending on the behavior of the incoming traffic and how many incidents are being created at once, we reduce our throttle dynamically to ensure that important events continue to be processed. If the service has received too many events, a `403 Forbidden` will be returned. If it is vital that all events your monitoring tool sends be received, be sure to retry on a 403 response code (preferably with a backoff period). **200 Event Processed** ```json { "status": "success", "message": "Event processed", "incident_key": "73af7a305bd7012d7c06002500d5d1a6" } ``` **400 Invalid Event** ```json { "status": "invalid event", "message": "Event object is invalid", "errors": [ // This errors array indicates why the event was invalid "event_type is invalid (must be one of: trigger acknowledge resolve)" ] } ``` **403 Rate Limited** ## Contexts The `contexts` field is a JSON array of informational assets that can be attached to the incident. Every element of the array is a JSON object referred to as a `context`. Every `context` must have a `type`. There are a few different types of contexts supported; the fields allowed and required depend on the context type. ### Link Context The `link` type is used to attach hyperlinks to an incident. Name | Required | Description ------ | -------- | ----------- `type` | Yes | The type of context being attached. For link contexts, this must be `link`. `href` | Yes | The link being attached to the incident. `text` | No | Plain text that describes the purpose of the link, and can be used as the link's text. ### Image Context The `image` type is used to attach images to an incident. Images must be served via HTTPS. Name | Required | Description ------ | -------- | ----------- `type` | Yes | The type of context being attached to the incident. For image contexts, this must be `image`. `src` | Yes | The source (URL) of the image being attached to the incident. This image must be served via HTTPS. `href` | No | Optional link for the image. `alt` | No | Optional alternative text for the image. ## Developer Agreement Your access to and use of the PagerDuty Developer Services is governed by the [PagerDuty Developer Agreement](/developer/pagerduty-developer-agreement). --- URL: https://docs.pagerduty.com/developer/sorting # Sorting Explains the sort_by parameter, its comma-separated field ordering syntax, and the default sort behavior on index endpoints. Sorting refers to having the server sort the results by a field or combination of fields and returning the result set to the client in sorted order. It applies only to [index endpoints.](/developer/endpoints) This is especially important when [paginating](/developer/pagination), as not all results may be available in the first response. Sorting is specified by the client using a `sort_by` parameter, which uses comma-separated values. Multiple sort values are separated by commas. Each sort value consists of a field name that is eligible for sorting and an optional direction specifier. The direction specifier can be `:asc` or `:desc` and is appended to the name of the field. If no direction is specified, an ascending sort is assumed. If multiple values are provided, results will be sorted by the first value, using the second and subsequent values only to break ties with the previous value. All [index endpoints.](/developer/endpoints) have a consistent default sort. Resources will be returned in the same order across requests even if no `sort_by` parameter is specified. ## Developer Agreement Your access to and use of the PagerDuty Developer Services is governed by the [PagerDuty Developer Agreement](/developer/pagerduty-developer-agreement). --- URL: https://docs.pagerduty.com/developer/types # Types Defines the primitive field types, including IDs, UUIDs, timestamps, and nulls, used consistently across REST API resources. > **The null value:** Unless otherwise noted, any field in the PagerDuty API can contain the value `null`. This represents the absence of a value for that field. For example, if a resource does not have a `description`, it may return `"description": null`. > Fields that are `required` will never be `null`. ## ID IDs are represented in the PagerDuty API as strings. All IDs will be contained within an `id` key. These IDs are not globally unique, but will be unique across a given endpoint. For example, a schedule and a service may both have the id `PSWK4Q7`, but no two schedules will have the same id. > **Note:** An `id` field is never `null`. ## UUID UUID fields are designated with the presence of `uuid` in their key name, and contain string ID values. UUIDs can be considered unique across PagerDuty. That is, no two resources of any type will share the same UUID. > **Note:** A `uuid` field is never `null`. ## String A standard JSON string. Strings in the REST API use the UTF-8 character set. ## Integer Integer types are a number without a fractional or decimal component. ## Boolean A boolean has only two possible states: true and false. In responses, booleans are always represented by native JSON booleans — `true` or `false` without quotes. In query strings, booleans can also be represented by string values. `"1"` and `"true"` are acceptable to represent a truthy value, and `"0"` and `"false"` are acceptable to represent a falsy value. > **Note:** A boolean field is never `null`. ## Array A standard JSON array. Arrays may contain any number of values, from `0` to `n`, unless otherwise specified. The primitive data type of the values within an array will always be consistent. That is, while a single array may contain objects representing both Users and Schedules, it will never contain both [objects](#object) and [integers](#integer). > **Note:** An array field is never `null`. > If there are no values for the associated field, the value will be an empty array (`[]`). ## Object A standard JSON object. Objects consist of string keys paired with values that may be of any type. ## DateTime All dates and times must be represented in the [ISO 8601](https://en.wikipedia.org/wiki/ISO_8601) date/time format. The time element is optional. Example dates in [ISO 8601](https://en.wikipedia.org/wiki/ISO_8601) format: | Date and Time | ISO 8601 Representation | | :------------------------------------------- | :---------------------- | | May 6th, 2011 at 5pm UTC | 2011-05-06T17:00Z | | May 6th, 2011 at 3:30am PDT | 2011-05-06T03:30-07 | | May 6th, 2011 at midnight (time is optional) | 2011-05-06 | ## Time Zone A string of a recognized time zone identifier. The acceptable identifiers and their name/description are shown below. | Time Zone Identifier | Name/Description | | :----------------------------- | :--------------------------- | | Africa/Algiers | West Central Africa | | Africa/Cairo | Cairo | | Africa/Casablanca | Casablanca | | Africa/Harare | Harare | | Africa/Johannesburg | Pretoria | | Africa/Monrovia | Monrovia | | Africa/Nairobi | Nairobi | | America/Argentina/Buenos_Aires | Buenos Aires | | America/Bogota | Bogota | | America/Caracas | Caracas | | America/Chicago | Central Time (US & Canada) | | America/Chihuahua | Chihuahua | | America/Denver | Mountain Time (US & Canada) | | America/Godthab | Greenland | | America/Guatemala | Central America | | America/Guyana | Georgetown | | America/Halifax | Atlantic Time (Canada) | | America/Indiana/Indianapolis | Indiana (East) | | America/Juneau | Alaska | | America/La_Paz | La Paz | | America/Lima | Lima | | America/Lima | Quito | | America/Los_Angeles | Pacific Time (US & Canada) | | America/Mazatlan | Mazatlan | | America/Mexico_City | Guadalajara | | America/Mexico_City | Mexico City | | America/Monterrey | Monterrey | | America/Montevideo | Montevideo | | America/New_York | Eastern Time (US & Canada) | | America/Phoenix | Arizona | | America/Puerto_Rico | Puerto Rico | | America/Regina | Saskatchewan | | America/Santiago | Santiago | | America/Sao_Paulo | Brasilia | | America/St_Johns | Newfoundland | | America/Tijuana | Tijuana | | Asia/Almaty | Almaty | | Asia/Baghdad | Baghdad | | Asia/Baku | Baku | | Asia/Bangkok | Bangkok | | Asia/Bangkok | Hanoi | | Asia/Chongqing | Chongqing | | Asia/Colombo | Sri Jayawardenepura | | Asia/Dhaka | Astana | | Asia/Dhaka | Dhaka | | Asia/Hong_Kong | Hong Kong | | Asia/Irkutsk | Irkutsk | | Asia/Jakarta | Jakarta | | Asia/Jerusalem | Jerusalem | | Asia/Kabul | Kabul | | Asia/Kamchatka | Kamchatka | | Asia/Karachi | Islamabad | | Asia/Karachi | Karachi | | Asia/Kathmandu | Kathmandu | | Asia/Kolkata | Chennai | | Asia/Kolkata | Kolkata | | Asia/Kolkata | Mumbai | | Asia/Kolkata | New Delhi | | Asia/Krasnoyarsk | Krasnoyarsk | | Asia/Kuala_Lumpur | Kuala Lumpur | | Asia/Kuwait | Kuwait | | Asia/Magadan | Magadan | | Asia/Muscat | Abu Dhabi | | Asia/Muscat | Muscat | | Asia/Novosibirsk | Novosibirsk | | Asia/Rangoon | Rangoon | | Asia/Riyadh | Riyadh | | Asia/Seoul | Seoul | | Asia/Shanghai | Beijing | | Asia/Singapore | Singapore | | Asia/Srednekolymsk | Srednekolymsk | | Asia/Taipei | Taipei | | Asia/Tashkent | Tashkent | | Asia/Tbilisi | Tbilisi | | Asia/Tehran | Tehran | | Asia/Tokyo | Osaka | | Asia/Tokyo | Sapporo | | Asia/Tokyo | Tokyo | | Asia/Ulaanbaatar | Ulaanbaatar | | Asia/Urumqi | Urumqi | | Asia/Vladivostok | Vladivostok | | Asia/Yakutsk | Yakutsk | | Asia/Yekaterinburg | Ekaterinburg | | Asia/Yerevan | Yerevan | | Atlantic/Azores | Azores | | Atlantic/Cape_Verde | Cape Verde Is. | | Atlantic/South_Georgia | Mid-Atlantic | | Australia/Adelaide | Adelaide | | Australia/Brisbane | Brisbane | | Australia/Darwin | Darwin | | Australia/Hobart | Hobart | | Australia/Melbourne | Canberra | | Australia/Melbourne | Melbourne | | Australia/Perth | Perth | | Australia/Sydney | Sydney | | Etc/GMT+12 | International Date Line West | | Etc/UTC | UTC | | Europe/Amsterdam | Amsterdam | | Europe/Athens | Athens | | Europe/Belgrade | Belgrade | | Europe/Berlin | Berlin | | Europe/Bratislava | Bratislava | | Europe/Brussels | Brussels | | Europe/Bucharest | Bucharest | | Europe/Budapest | Budapest | | Europe/Copenhagen | Copenhagen | | Europe/Dublin | Dublin | | Europe/Helsinki | Helsinki | | Europe/Istanbul | Istanbul | | Europe/Kaliningrad | Kaliningrad | | Europe/Kiev | Kyiv | | Europe/Lisbon | Lisbon | | Europe/Ljubljana | Ljubljana | | Europe/London | Edinburgh | | Europe/London | London | | Europe/Madrid | Madrid | | Europe/Minsk | Minsk | | Europe/Moscow | Moscow | | Europe/Moscow | St. Petersburg | | Europe/Paris | Paris | | Europe/Prague | Prague | | Europe/Riga | Riga | | Europe/Rome | Rome | | Europe/Samara | Samara | | Europe/Sarajevo | Sarajevo | | Europe/Skopje | Skopje | | Europe/Sofia | Sofia | | Europe/Stockholm | Stockholm | | Europe/Tallinn | Tallinn | | Europe/Vienna | Vienna | | Europe/Vilnius | Vilnius | | Europe/Volgograd | Volgograd | | Europe/Warsaw | Warsaw | | Europe/Zagreb | Zagreb | | Europe/Zurich | Bern | | Europe/Zurich | Zurich | | Pacific/Apia | Samoa | | Pacific/Auckland | Auckland | | Pacific/Auckland | Wellington | | Pacific/Chatham | Chatham Is. | | Pacific/Fakaofo | Tokelau Is. | | Pacific/Fiji | Fiji | | Pacific/Guadalcanal | Solomon Is. | | Pacific/Guam | Guam | | Pacific/Honolulu | Hawaii | | Pacific/Majuro | Marshall Is. | | Pacific/Midway | Midway Island | | Pacific/Noumea | New Caledonia | | Pacific/Pago_Pago | American Samoa | | Pacific/Port_Moresby | Port Moresby | | Pacific/Tongatapu | Nuku'alofa | ## URL A URL is a string that conforms to the [RFC 3986 syntax](https://tools.ietf.org/html/rfc3986). URLs are fully-qualified URIs that [provide a means of locating the resource](https://tools.ietf.org/html/rfc3986#section-1.1.3), and will never have only a subset of the URL, such as just a hostname or path. A number of URL validation libraries are available; any that conform to the spec should be able to correctly validate a URL field. ## Developer Agreement Your access to and use of the PagerDuty Developer Services is governed by the [PagerDuty Developer Agreement](/developer/pagerduty-developer-agreement). --- URL: https://docs.pagerduty.com/developer/verifying-webhook-signatures # Verifying Signatures Explains how to validate the HMAC-SHA256 X-PagerDuty-Signature header PagerDuty attaches to each v3 webhook payload delivery. PagerDuty's [v3 webhooks](/developer/webhooks-overview) are sent with a signature the destination server can use to verify that the event came from the PagerDuty platform and not a third party or malicious system. It is _strongly recommended_ that webhook consumers verify these signatures before processing each event. ## Obtaining the Secret When a webhook subscription is created, a strong unique secret is generated and provided in the response. This secret is used to sign webhook payloads sent as part of this subscription. The signature is then delivered along with each payload under the `X-PagerDuty-Signature` header. ## The Signature The `X-PagerDuty-Signature` header included with each webhook event delivery contains one or more signatures. Multiple signatures may be present to allow for a zero-downtime secret rotation. The current signature version is `v1` and is computed as an [HMAC](https://en.wikipedia.org/wiki/HMAC) of the payload body using a [SHA-256](https://en.wikipedia.org/wiki/SHA-2) hash function. This is performed for each signing secret and the results are concatenated using comma separation. An example signature is shown below: ``` X-PagerDuty-Signature: v1=f03de6f61df6e454f3620c4d6aca17ad072d3f8bbb2760eac3b2ad391b5e8073, v1=130dcacb53a94d983a37cf2acba98e805a1c37185309ba56fdcccbcf00d6dd8b ``` (Note that the actual header value is sent as a single string without any new lines.) ## Verifying the Signature A pseudo-algorithm to verify the signature of a webhook delivery is described below. **Step 1**: *Extract the signature(s) from the request* * Extract the signature string from the `X-PagerDuty-Signature` header on the request. * Split the signatures which are separated by the `,` character. * Select only signatures which are version `v1` and remove the `v1=` prefix. **Step 2**: *Compute the expected valid signature* Using the received JSON payload (entire request body): * Compute the SHA-256 HMAC using the shared secret as the key. * Take the [Base16](https://en.wikipedia.org/wiki/Hexadecimal) encoding of the result to obtain a value we can compare. **Step 3**: *Compare the signatures* Compare the expected signature obtained in Step 2 with the provided signatures from Step 1. If at least one of the signatures matches, the webhook should be considered a trusted and authentic request from PagerDuty that can be processed by the server. > Note: When comparing signatures, be sure to use a constant-time string comparison to protect against timing attacks. > Verifying PagerDuty webhook signatures requires the unaltered raw body of the request sent to you. > Ensure that any frameworks or middleware you are using have not manipulated or formatted the request body. > PagerDuty webhook payloads support unicode characters. If your implementation is converting the request body > from string to bytes [or vice-versa], ensure that you are using the proper UTF-8 character encoding. ## Examples of webhooks signing **Python** ```python import hmac import hashlib class PagerDutyVerifier: def __init__(self, key, version): self.key = key self.version = version def verify(self, payload, signatures): comparisons = [] byte_key = self.key.encode("ASCII") signature = hmac.new(byte_key, payload.encode(), hashlib.sha256).hexdigest() signatureWithVersion = self.version + "=" + signature signatureList = signatures.split(",") for _signature in signatureList: comparisons.append(hmac.compare_digest(signatureWithVersion, _signature)) return any(comparisons) pagerdutyVerifier = PagerDutyVerifier(key, version) pagerdutyVerifier.verify(payload, signatures) ``` **JavaScript** ```javascript const crypto = require('crypto') module.exports = class PagerDutyVerifier { constructor(key, version) { this.key = key this.version = version } verify(payload, signatures) { var signature = crypto .createHmac('sha256', key) .update(payload) .digest('hex') var signatureWithVersion = version + "=" + signature var signatureList = signatures.split(",") if (signatureList.indexOf(signatureWithVersion) > -1 ) { return true } else { return false } } } var PagerDutyVerifier = require('./pagerduty_verifier.js') var verifier = new PagerDutyVerifier(key, version) verifier.verify(payload, signatures) ``` **Go** Our go example can be found in our open-source [go-pagerduty client library](https://github.com/PagerDuty/go-pagerduty/blob/master/webhookv3/webhookv3.go) which also comes with a [sample webhook server](https://github.com/PagerDuty/go-pagerduty/blob/master/examples/webhooks/webhook_server.go) to test signature verification. ## Developer Agreement Your access to and use of the PagerDuty Developer Services is governed by the [PagerDuty Developer Agreement](/developer/pagerduty-developer-agreement). --- URL: https://docs.pagerduty.com/developer/versioning # Versioning Covers how token-based versioning and the Accept request header together determine which REST API version handles a given call. The version of the API that responds to a given request is based on the authentication token provided as part of the request, but can be overridden with a header. ## Token-based versioning By default, all new authentication tokens will be set to provide the latest version of the API. Existing authentication tokens will request the final released version of the API that was available at the time of their creation. ## Header-based versioning If you're writing code that's designed to work with multiple authentication tokens or with a specific version of the API, the best way to ensure you get the right version is with [PagerDuty's `Accept` header](http://www.iana.org/assignments/media-types/application/vnd.pagerduty+json): ```http Accept: application/vnd.pagerduty+json;version=2 ``` Any request made using this header will respond with the specified API version, regardless of the authentication token used. ### Samples Here's how you can set the `Accept` header in some popular HTTP libraries: **Ruby** ```ruby req = Net::HTTP::Get.new('https://api.pagerduty.com/users') api_version = '2' req.add_field('Accept', 'application/vnd.pagerduty+json;version=#{api_version}') ``` **JavaScript (Client-Side)** ```javascript var api_version = "2"; $.ajax({ url: "https://api.pagerduty.com/users", type: "GET", headers: {"Accept": "application/vnd.pagerduty+json;version=" + api_version} }); ``` **Python** ```python api_version = '2' requests.get('https://api.pagerduty.com/users', headers={'Accept': 'application/vnd.pagerduty+json;version=' + api_version}) ``` ## Developer Agreement Your access to and use of the PagerDuty Developer Services is governed by the [PagerDuty Developer Agreement](/developer/pagerduty-developer-agreement). --- URL: https://docs.pagerduty.com/developer/webhook-behavior # Behaviour Documents webhook delivery ports, response timeout windows, and the retry behavior PagerDuty uses for temporary failures. > ## Note > Webhook behavior described on this page may change in the future. If you encounter unexpected behavior, please check this page for documentation updates. ## Setting Up Webhooks [See our Knowledge Base article](/integrations/webhooks) for information on setting up webhooks on your account. This article contains technical documentation on our webhook delivery behavior. ## Ports and Connections Webhooks can be sent to any publicly accessible web server, on any port, with or without encryption. ### Webhook Ports If you specify `http://` in your Endpoint URL, we will initiate a standard HTTP connection on port 80. Likewise, entering `https://` means we will attempt to make a secure connection on port 443. To override the default port, add a colon (:) after the host address with the desired port number. **Example:** `https://app.acmemonitoring.com:8443/pagerduty.php` ## Error Handling and Retries ### Timeouts PagerDuty expects a 2xx response within 5 seconds for Generic Webhooks and within 16 seconds for webhooks generated from Custom Incident Actions. ### Temporary Errors and Retries PagerDuty will retry sending a webhook in these cases: * No response / timeout * 5XX (server error) response * 429 (rate limit error) response * Connection cannot be established (except for most TLS errors) * TLS certificate expired errors * DNS errors / host name cannot be resolved Webhooks will be periodically retried for up to 48 hours. While attempting to retry a failing webhook, subsequent webhooks for this extension or subscription and resource ID will be queued for delivery. After 48 hours, the delivery will be considered a failure and the webhook will be dropped. ### OAuth Authentication Retries For webhooks using OAuth client authentication, additional retry behavior applies: * **Invalid OAuth Client**: If the OAuth client is deleted or invalid, the delivery is treated as a temporary error and retried normally * **401 Unauthorized Response**: When a webhook receives a 401 response, PagerDuty automatically attempts to refresh the OAuth token and immediately retries the delivery * **Token Refresh Success**: If token refresh succeeds, the webhook is retried within the same delivery attempt * **Token Refresh Failure**: If token refresh fails (OAuth server unavailable, network issues), this is treated as a temporary error and follows normal retry timing * **Second 401 After Refresh**: If a webhook receives another 401 response after a successful token refresh, this is treated as a permanent error and the webhook is dropped without further retries ### Permanent Errors PagerDuty will drop a webhook *without* a retry in these non-transient cases: * 4XX response from the server (except for 429) * TLS errors when establishing a connection (except for expired certificates) * 401 response after successful OAuth token refresh (OAuth webhooks only) ## Temporary Disablement After 3 consecutive webhooks are dropped due to delivery failure, whether from permanent errors or temporary errors that exhausted their retries, the extension or subscription will be disabled for 24 hours and any other webhooks in its queue will be dropped. While an extension or subscription is disabled, no new webhooks will be enqueued for delivery. These webhooks will be dropped. ### Re-enable An Extension or Subscription When an extension is disabled, it will appear this way on a Service’s integrations tab (under Extensions) or on the Configuration > Extensions page in the PagerDuty web app and can be manually re-enabled there.  When a subscription is disabled, it will be tagged as "Needs Attention" on the webhooks dashboard. It can be easily re-enabled by clicking the "Enable" button on the subscription's settings page, or via the "Enable a webhook subscription" REST API endpoint.  ## Security PagerDuty supports multiple methods for securing your webhooks. ### Mutual TLS Authentication (Recommended) We send a client TLS certificate with webhooks on request. You can use this to verify that the webhook was sent from PagerDuty. If you specify an HTTPS endpoint, we will also verify your server certificate before sending webhooks to that endpoint. [Learn how to secure PagerDuty's webhooks using TLS](/developer/mutual-tls) ### OAuth Authentication PagerDuty supports OAuth 2.0 client credentials flow for webhook authentication. You can create OAuth clients and associate them with webhook subscriptions to automatically include OAuth bearer tokens in webhook requests. ### Webhook Signature Validation PagerDuty's [v3 webhooks](/developer/webhooks-overview) are sent with a signature the destination server can use to verify that the event came from the PagerDuty platform and not a third party or malicious system. It is _strongly recommended_ that webhook consumers verify these signatures before processing each event. [Learn how to verify a PagerDuty webhook signature](/developer/verifying-webhook-signatures) ### IP Safelists You can configure your network or server to only accept inbound connections from certain IP addresses. See our [Webhook IPs page](/developer/webhook-ips) for information on obtaining the list of IPs webhooks may come from. (Previously called IP whitelisting, [see why we changed the name here.](https://twitter.com/secnerdette/status/898314208097427457)) ### Basic Authentication If your web server uses basic authentication, you can add the username and password to the URL before the host address. Special characters such as @ in the username or password should be percent-encoded. We recommend sending these requests over `HTTPS` to protect credentials in the URL. **Examples:** `https://username:password@app.acmemonitoring.com` `https://username:long%20password@example.com` ## Ordering PagerDuty sends webhooks for a given extension and incident combination in the order that they were generated. ## At-Least-Once Delivery When a webhook endpoint is behaving as specified in this documentation, PagerDuty delivers webhooks at least once. This means that duplicate webhooks may be delivered to the target endpoint in certain circumstances. Customers wishing to de-duplicate webhooks may do so by using the `X-Webhook-Id` header provided with each webhook request. The value of this header is unique to the webhook but is repeated for each delivery attempt, so it may be used to ignore subsequent delivery attempts after an initial success. ## Batching PagerDuty does not currently send batches that contain more than one webhook. V1 and V2 webhook payloads contain a `messages` array, however, each event should only contain a single webhook event. [V3 webhook payloads](/developer/webhooks-overview) will only ever contain a single webhook event by design. ## Processing Webhooks We recommend these best practices when processing webhooks: * Return a `202 Accepted` once you receive a payload and then process the batch of webhooks. Asynchronous processing will help prevent the connection from timing out. * Catch and handle errors when processing a webhook. This will isolate problems with a specific webhook and allow you to continue processing the rest of the batch. ## Size Limit Webhook size is affected by a number of factors, including the size of the incoming event, the number of responders on an incident, the number of log entries for an incident, etc. PagerDuty guarantees delivery and ordering of webhooks up to 55 KB (56320 bytes) in size. In the very rare case that a generated webhook is larger than 55 KB, PagerDuty will attempt to omit event details in the webhook to decrease its size. The fields affected by this omission are present on the first `log_entry` in the `channel` object: `details`, `cef_details.details`, and `body`. The `body` field is only present on events received by email, and the `cef_details.details` field is only present on [PD-CEF](/developer/api/pd-cef) events. When event details are omitted, this field is replaced with a message noting the omission. In addition, `channel` fields `details_omitted`, `cef_details.details_omitted`, and `body_omitted` will be updated, as appropriate, from `false` to `true` to indicate which fields have been changed. In the extremely rare case that omitting event details does not bring the webhook under 55 KB, but the webhook is still less than 256 KB, it will be delivered on a best-effort basis. This means that the webhook may not be delivered, or it may be delivered out of order. All webhooks with a final size greater than 256 KB are always dropped. ## Developer Agreement Your access to and use of the PagerDuty Developer Services is governed by the [PagerDuty Developer Agreement](/developer/pagerduty-developer-agreement). --- URL: https://docs.pagerduty.com/developer/webhook-ips # Webhook IPs Lists the IP addresses PagerDuty sends webhook notifications and workflow actions from in each of its service regions today. This page lists the IP addresses that PagerDuty uses to send webhooks in each of our service regions. The full list of IP addresses that our webhook notifications and workflow actions (for paid accounts) may come from is: ## US Service Region download: [plain](/ip-safelists/webhooks-us-service-region) | [json](/ip-safelists/webhooks-us-service-region-json) 44.242.69.192 52.89.71.166 54.213.187.133 35.86.21.47 52.88.94.18 44.238.89.29 54.241.68.46 54.176.72.216 54.177.81.67 13.56.49.27 34.210.57.30 34.210.242.134 52.34.208.156 ## EU Service Region download: [plain](/ip-safelists/webhooks-eu-service-region) | [json](/ip-safelists/webhooks-eu-service-region-json) 18.192.91.93 18.158.120.237 18.194.177.30 18.158.199.216 3.126.25.87 18.197.187.16 54.76.3.62 54.170.2.90 52.213.188.110 54.195.179.238 34.250.91.200 54.76.225.71 ## Developer Agreement Your access to and use of the PagerDuty Developer Services is governed by the [PagerDuty Developer Agreement](/developer/pagerduty-developer-agreement). --- URL: https://docs.pagerduty.com/developer/webhook-tls-certificates # Public Certificates Provides the client and issuer certificates that PagerDuty rotates yearly for webhook mutual TLS certificate verification. PagerDuty Webhooks provide client certificates when requested by a server (Mutual TLS). It is our recommendation that customers configure their servers to trust the root certificate listed below. Customers choosing to rely on the PagerDuty client certificate are responsible for rotating to the new certificates at the appropriate time in order to avoid interrupted connectivity. PagerDuty webhook client certificates are rotated yearly. The current certificates are provided below. ## Client Certificates Certificate | Common Name | Start Date | End Date | Download ---------|----------|---------|---------|--------- US region certificate | webhooks.pagerduty.com | December 16th, 2025 | November 2026 | [link](/certificates/2026_webhooks_pagerduty_com.pem) EU region certificate | webhooks.eu.pagerduty.com | December 16th, 2025 | November 2026 | [link](/certificates/2026_webhooks_eu_pagerduty_com.pem) ## Issuer Certificates Certificate Type | Common Name | Valid Until | Download ---------|----------|---------|--------- Intermediate Certificate | DigiCert Global G2 TLS RSA SHA256 2020 CA1 | March 29th, 2031 | [link](https://cacerts.digicert.com/DigiCertGlobalG2TLSRSASHA2562020CA1-1.crt.pem) Root Certificate | DigiCert Global Root G2 | January 15th, 2038 | [link](https://cacerts.digicert.com/DigiCertGlobalRootG2.crt.pem) ## Developer Agreement Your access to and use of the PagerDuty Developer Services is governed by the [PagerDuty Developer Agreement](/developer/pagerduty-developer-agreement). --- URL: https://docs.pagerduty.com/developer/webhooks-overview # Webhooks Overview Introduces v3 webhook subscriptions, covering event type selection, delivery filtering, and the HTTP delivery method setup. Our latest version of Webhooks is V3. V3 webhooks provide the foundation for the future of PagerDuty webhooks. When compared with previous versions, they provide additional event types to signal changes to incident priorities and incident responders. They also provide additional filtering capabilities. To get started with v3 webhooks, create a _webhook subscription_ using the [Webhook Subscriptions API](/developer/api/reference/rest/webhooks/create-webhook-subscription). > ## Migrate to V3 Webhook Subscriptions > > If you are currently using [V1/V2 webhook extensions](/integrations/webhooks) and need to migrate them to V3 webhook subscriptions, please follow our [migration guide](/integrations/webhooks#migration-guide) or use our [migration script](https://github.com/PagerDuty/public-support-scripts/tree/master/migrate_webhooks_to_v3) (provided as is). > > An end-of-life date for V2 webhooks has not been set. However, end-of-support for V2 webhooks began on October 31, 2022. This means existing integrations based on V2 webhooks will continue to work, however PagerDuty cannot accept any new feature requests or implement bug fixes. > > V1 webhook extensions became unsupported on November 13, 2021 and lost functionality on October 31, 2022. Please see [Webhook V1 Alternatives](/integrations/webhooks) for a list of affected integrations and alternative solutions. ## Webhook Subscriptions V3 webhooks are configured by creating a _webhook subscription_ which contains three main components: - The set of _[outbound event types](#event-types)_ that are of interest - A _filter_ or scope of the events to be delivered - The _delivery method_ that should be used to send the matching events as a [webhook](#webhook-payload) **Sample Create Webhook Subscription Request** ```json { "webhook_subscription": { "delivery_method": { "type": "http_delivery_method", "url": "https://example.com/receive_a_pagerduty_webhook", "custom_headers": [ { "name": "your-header-name", "value": "your-header-value" } ] }, "description": "Sends PagerDuty v3 webhook events somewhere interesting.", "events": [ "incident.acknowledged", "incident.annotated", "incident.delegated", "incident.escalated", "incident.priority_updated", "incident.reassigned", "incident.reopened", "incident.resolved", "incident.responder.added", "incident.responder.replied", "incident.status_update_published", "incident.triggered", "incident.unacknowledged" ], "filter": { "id": "P393ZNQ", "type": "service_reference" }, "type": "webhook_subscription" } } ``` ### Custom Headers The `custom_headers` of a webhook subscription define any optional headers that will be passed along with the payload to the destination URL. The header values are redacted in GET requests, but are not redacted on the webhook when delivered to the webhook's endpoint. All header names must be unique within a webhook subscription. ### Events The `events` of a webhook subscription define which [event types](#event-types) will produce webhooks for the subscription. A subset of all event types may be provided if the destination is only interested in a limited set of events. ### Filter The `filter` of a webhook subscription determines which events will match and produce a webhook. There are currently three types of filters that can be applied to v3 webhooks: `service_reference`, `team_reference` and `account_reference`. In the case of incident events, the different filter types will only produce webhooks for the incidents that are associated with the filter object. For example: a webhook subscription with a service filter would produce webhooks for all incidents belonging to the specified service. ### More Details Please see the full [Webhook Subscriptions API Reference](/developer/api/reference/rest/webhooks/create-webhook-subscription) for more details. ## Webhook Payload V3 webhook payloads are based around the concept of [outbound events](#event-types). V3 webhooks provide a mechanism to deliver these events to your server or application. Each webhook payload contains a single event object. This event object contains high-level information common to all outbound events. The inner `event.data` payload differs based on the `event.event_type` and contains detailed information about the change that occurred. | Field Name | Type | Description | | --------------------- | ---------------------------------------------------------------- | ---------------------------------------------------------------------------------------------------------------------------------------------------------------------------------------------------------- | | `event` | Object | The event that triggered the webhook. | | `event.id` | String | The unique id of the event. | | `event.event_type` | String | The type of the event. This usually provides a description of what happened (e.g. `incident.priority_updated`). | | `event.resource_type` | String | The root resource type (leftmost part of the `event_type`) this event is about (currently `incident`, `service` or `scribe`). It can be different from the more specific `data.type` in the event payload. | | `event.occurred_at` | DateTime | An ISO 8601 datetime indicating when the event occurred. | | `event.agent` | a [Resource Reference](/developer/resource-references) or `null` | Indicates who or what initiated the event. A `null` value might indicate an event triggered via automation rather than a specific person. | | `event.client` | Object or `null` | Information about where the event was triggered. | | `event.data` | Object | Data specific to the `event_type` that occurred. | An example webhook payload for an `incident.priority_updated` event is shown below. ```json { "event": { "id": "5ac64822-4adc-4fda-ade0-410becf0de4f", "event_type": "incident.priority_updated", "resource_type": "incident", "occurred_at": "2020-10-02T18:45:22.169Z", "agent": { "html_url": "https://acme.pagerduty.com/users/PLH1HKV", "id": "PLH1HKV", "self": "https://api.pagerduty.com/users/PLH1HKV", "summary": "Tenex Engineer", "type": "user_reference" }, "client": { "name": "PagerDuty" }, "data": { "id": "PGR0VU2", "type": "incident", "self": "https://api.pagerduty.com/incidents/PGR0VU2", "html_url": "https://acme.pagerduty.com/incidents/PGR0VU2", "number": 2, "status": "triggered", "incident_key": "d3640fbd41094207a1c11e58e46b1662", "created_at": "2020-04-09T15:16:27Z", "reopened_at": "2020-10-02T18:45:22Z", "title": "A little bump in the road", "service": { "html_url": "https://acme.pagerduty.com/services/PF9KMXH", "id": "PF9KMXH", "self": "https://api.pagerduty.com/services/PF9KMXH", "summary": "API Service", "type": "service_reference" }, "assignees": [ { "html_url": "https://acme.pagerduty.com/users/PTUXL6G", "id": "PTUXL6G", "self": "https://api.pagerduty.com/users/PTUXL6G", "summary": "User 123", "type": "user_reference" } ], "escalation_policy": { "html_url": "https://acme.pagerduty.com/escalation_policies/PUS0KTE", "id": "PUS0KTE", "self": "https://api.pagerduty.com/escalation_policies/PUS0KTE", "summary": "Default", "type": "escalation_policy_reference" }, "teams": [ { "html_url": "https://acme.pagerduty.com/teams/PFCVPS0", "id": "PFCVPS0", "self": "https://api.pagerduty.com/teams/PFCVPS0", "summary": "Engineering", "type": "team_reference" } ], "priority": { "html_url": "https://acme.pagerduty.com/account/incident_priorities", "id": "PSO75BM", "self": "https://api.pagerduty.com/priorities/PSO75BM", "summary": "P1", "type": "priority_reference" }, "urgency": "high", "conference_bridge": { "conference_number": "+1 1234123412,,987654321#", "conference_url": "https://example.com" }, "resolve_reason": null } } } ``` An example webhook payload for a `service.updated` event is shown below. ```json { "event": { "id": "01BRB6ZP4M6T8ZG4X6BP63ZB9O", "event_type": "service.updated", "resource_type": "service", "occurred_at": "2021-03-02T13:35:11.682Z", "agent": null, "client": null, "data": { "html_url": "https://acme.pagerduty.com/services/PF9KMXH", "id": "PF9KMXH", "self": "https://api.pagerduty.com/services/PF9KMXH", "summary": "testing service updates", "alert_creation": "create_alerts_and_incidents", "teams": [ { "html_url": "https://acme.pagerduty.com/teams/PFCVPS0", "id": "PFCVPS0", "self": "https://api.pagerduty.com/teams/PFCVPS0", "summary": "Engineering", "type": "team_reference" } ], "type": "service" } } } ``` ## Event Types Outbound events are created when PagerDuty resources change in interesting ways. Each outbound event is usually associated with some other PagerDuty resource. For example, the `incident.priority_updated` event is generated whenever the priority of an incident is changed. The following event types are available to v3 webhooks. Additional event types may be added to this list over time. | Event Type | `data.type` | Description | Scoped OAuth requires | | ------------------------------------- | ---------------------------- | --------------------------------------------------------------------------------------------------------------------------- | ------------------------- | | incident.acknowledged | `incident` | Sent when an incident is acknowledged. | `incidents.read` | | incident.annotated | `incident_note` | Sent when a note is added to an incident. | `incidents.read` | | incident.conference_bridge.updated | `incident_conference_bridge` | Sent when an incident's conference bridge number and/or conference bridge url is updated. | `incidents.read` | | incident.custom_field_values.updated | `incident_field_values` | Sent when an incident's custom fields values are updated. | `incidents.read` | | incident.delegated | `incident` | Sent when an incident has been reassigned to another escalation policy. | `incidents.read` | | incident.escalated | `incident` | Sent when an incident has been escalated to another user in the same escalation level. | `incidents.read` | | incident.incident_type.changed | `incident` | Sent when an incident has changed it’s incident type. | `incidents.read` | | incident.priority_updated | `incident` | Sent when the priority of an incident has changed. | `incidents.read` | | incident.reassigned | `incident` | Sent when an incident has been reassigned to another user. | `incidents.read` | | incident.reopened | `incident` | Sent when an incident is reopened. | `incidents.read` | | incident.resolved | `incident` | Sent when an incident is resolved. | `incidents.read` | | incident.responder.added | `incident_responder` | Sent when a responder has been added to an incident. | `incidents.read` | | incident.responder.replied | `incident_responder` | Sent when a responder replies to a request. | `incidents.read` | | incident.role.assigned | `incident_role_assignment` | Sent when an incident role is assigned or unassigned. | `incidents.read` | | incident.service_updated | `incident` | Sent when the service of an incident has changed. | `incidents.read` | | incident.status_update_published | `incident_status_update` | Sent when a status update is added to an incident. | `incidents.read` | | incident.task.completed | `incident_task` | Sent when an incident task is completed. | `incidents.read` | | incident.task.created | `incident_task` | Sent when an incident task is created. | `incidents.read` | | incident.task.updated | `incident_task` | Sent when an incident task is updated. | `incidents.read` | | incident.triggered | `incident` | Sent when an incident is newly created/triggered. | `incidents.read` | | incident.unacknowledged | `incident` | Sent when an incident is unacknowledged. | `incidents.read` | | incident.action_invocation.created | `incident_action_invocation` | Sent when an incident action invocation is created. | `incidents.read` | | incident.action_invocation.terminated | `incident_action_invocation` | Sent when an incident action invocation is terminated. | `incidents.read` | | incident.action_invocation.updated | `incident_action_invocation` | Sent when an incident action invocation is updated. | `incidents.read` | | incident.workflow.started | `incident_workflow_instance` | Sent when an incident workflow starts. | `incident_workflows.read` | | incident.workflow.completed | `incident_workflow_instance` | Sent when an incident workflow completes. | `incident_workflows.read` | | scribe.summary.created | `scribe_summary` | Sent when Scribe Agent generates (or fails to generate) a meeting summary. Available only for `account_reference` webhooks. | `pd_advance.write` | | service.created | `service` | Sent when a service is created. | `services.read` | | service.custom_field_values.updated | `service_field_values` | Sent when an service's custom fields values are updated. | `services.read` | | service.deleted | `service` | Sent when a service is deleted. | `services.read` | | service.updated | `service` | Sent when a service is updated. | `services.read` | ## Event Data Types Depending on the `event.event_type`, of the webhook payload, the `event.data` field will contain one of the objects described in this section. ### incident ```json { "id": "PGR0VU2", "type": "incident", "self": "https://api.pagerduty.com/incidents/PGR0VU2", "html_url": "https://acme.pagerduty.com/incidents/PGR0VU2", "number": 2, "status": "triggered", "incident_key": "d3640fbd41094207a1c11e58e46b1662", "created_at": "2020-04-09T15:16:27Z", "reopened_at": "2020-10-02T18:45:22Z", "title": "A little bump in the road", "incident_type": { "name": "major" }, "service": { "html_url": "https://acme.pagerduty.com/services/PF9KMXH", "id": "PF9KMXH", "self": "https://api.pagerduty.com/services/PF9KMXH", "summary": "API Service", "type": "service_reference" }, "assignees": [ { "html_url": "https://acme.pagerduty.com/users/PTUXL6G", "id": "PTUXL6G", "self": "https://api.pagerduty.com/users/PTUXL6G", "summary": "User 123", "type": "user_reference" } ], "escalation_policy": { "html_url": "https://acme.pagerduty.com/escalation_policies/PUS0KTE", "id": "PUS0KTE", "self": "https://api.pagerduty.com/escalation_policies/PUS0KTE", "summary": "Default", "type": "escalation_policy_reference" }, "teams": [ { "html_url": "https://acme.pagerduty.com/teams/PFCVPS0", "id": "PFCVPS0", "self": "https://api.pagerduty.com/teams/PFCVPS0", "summary": "Engineering", "type": "team_reference" } ], "priority": { "html_url": "https://acme.pagerduty.com/account/incident_priorities", "id": "PSO75BM", "self": "https://api.pagerduty.com/priorities/PSO75BM", "summary": "P1", "type": "priority_reference" }, "urgency": "high", "conference_bridge": { "conference_number": "+1 1234123412,,987654321#", "conference_url": "https://example.com" }, "resolve_reason": null } ``` ### incident_conference_bridge ```json { "incident": { "html_url": "https://acme.pagerduty.com/incidents/PGR0VU2", "id": "PGR0VU2", "self": "https://api.pagerduty.com/incidents/PGR0VU2", "summary": "Major incident - customer shopping cart screen", "type": "incident_reference" }, "conference_numbers": [ { "label": "", "number": "+1-555-555-5555" } ], "conference_url": "https://example.com", "type": "incident_conference_bridge" } ``` ### incident_field_values ```json { "incident": { "html_url": "https://acme.pagerduty.com/incidents/PBAZLIU", "id": "PBAZLIU", "self": "https://api.pagerduty.com/incidents/PBAZLIU", "summary": null, "type": "incident_reference" }, "custom_fields": [ { "data_type": "string", "field_type": "single_value", "id": "PICFVXX", "name": "environment", "namespace": "incidents", "type": "field_value", "value": "production" }, { "data_type": "string", "field_type": "single_value", "id": "PF3UUI7", "name": "region", "namespace": "incidents", "type": "field_value", "value": "US" } ], "changed_custom_fields": [ { "data_type": "string", "field_type": "single_value", "id": "PICFVXX", "name": "environment", "namespace": "incidents", "type": "field_value", "value": "staging" } ], "type": "incident_field_values" } ``` ### incident_note ```json { "incident": { "html_url": "https://acme.pagerduty.com/incidents/PGR0VU2", "id": "PGR0VU2", "self": "https://api.pagerduty.com/incidents/PGR0VU2", "summary": "A little bump in the road", "type": "incident_reference" }, "id": "P2LA89X", "content": "I sure am glad we are using PagerDuty!", "trimmed": false, "type": "incident_note" } ``` ### incident_role_assignment ```json { "type": "incident_role_assignment", "incident_role_assignments": [ { "assignee": { "html_url": "https://acme.pagerduty.com/users/P75B6QD", "id": "P75B6QD", "self": "https://api.pagerduty.com/users/P75B6QD", "summary": "User 1810194", "type": "user_reference" }, "id": "af64b84c-137e-40c6-875c-5dd30a2afaaa", "incident": { "html_url": "https://acme.pagerduty.com/incidents/PBAZLIU", "id": "PBAZLIU", "self": "https://api.pagerduty.com/incidents/PBAZLIU", "summary": null, "type": "incident_reference" }, "old_assignee": null, "role": { "id": "P8PQO4R", "summary": "Role Display Name", "type": "role_reference" }, "status": "active", "type": "role_assignment_reference" } ] } ``` ### incident_status_update ```json { "incident": { "html_url": "https://acme.pagerduty.com/incidents/PGR0VU2", "id": "PGR0VU2", "self": "https://api.pagerduty.com/incidents/PGR0VU2", "summary": "A little bump in the road", "type": "incident_reference" }, "id": "P2LA89X", "message": "A fix for this incident is being developed", "trimmed": false, "type": "incident_status_update" } ``` ### incident_responder ```json { "incident": { "html_url": "https://acme.pagerduty.com/incidents/PGR0VU2", "id": "PGR0VU2", "self": "https://api.pagerduty.com/incidents/PGR0VU2", "summary": "A little bump in the road", "type": "incident_reference" }, "user": { "html_url": "https://acme.pagerduty.com/users/PVMGSML", "id": "PVMGSML", "self": "https://api.pagerduty.com/users/PVMGSML", "summary": "Maeve", "type": "user_reference" }, "escalation_policy": { "html_url": "https://acme.pagerduty.com/escalation_policies/PJFWPEP", "id": "PJFWPEP", "self": "https://api.pagerduty.com/escalation_policies/PJFWPEP", "summary": "The Policy", "type": "escalation_policy_reference" }, "message": "Please help me make the tests pass", "state": "pending", "type": "incident_responder" } ``` ### incident_task ```json { "name": "A thing that needs to be done", "description": "A description of the task", "id": "PGR0VU2", "summary": "A thing that needs to be done", "type": "incident_task", "status": "todo", "assignees": [ { "html_url": "https://acme.pagerduty.com/users/PIV35G6", "id": "PIV35G6", "self": "https://api.pagerduty.com/users/PIV35G6", "summary": "User 661768438", "type": "user_reference" } ], "incident": { "html_url": "https://acme.pagerduty.com/incidents/Q0SDD3HB6SGFTI", "id": "Q0SDD3HB6SGFTI", "self": "https://api.pagerduty.com/incidents/Q0SDD3HB6SGFTI", "summary": null, "type": "incident_reference" } } ``` ### incident_workflow_instance ```json { "id": "P3SNKQS", "type": "incident_workflow_instance", "summary": "A Workflow Instance Name", "incident_workflow": { "html_url": "https://acme.pagerduty.com/incident-workflows/workflows/PSFEVL7", "id": "PSFEVL7", "self": "https://api.pagerduty.com/incident_workflows/PSFEVL7", "summary": "A Workflow Name", "type": "incident_workflow_reference" }, "workflow_trigger": { "html_url": null, "id": "4ad696eb-bb48-422a-8bd0-6efad6befa29", "self": "https://api.pagerduty.com/incident_workflows/triggers/4ad696eb-bb48-422a-8bd0-6efad6befa29", "summary": "Trigger Name", "type": "workflow_trigger_reference" }, "incident": { "html_url": "https://acme.pagerduty.com/incidents/PBAZLIU", "id": "PBAZLIU", "self": "https://api.pagerduty.com/incidents/PBAZLIU", "summary": "A little bump in the road", "type": "incident_reference" }, "service": { "html_url": "https://acme.pagerduty.com/services/PF9KMXH", "id": "PF9KMXH", "self": "https://api.pagerduty.com/services/PF9KMXH", "summary": "A service", "type": "service_reference" } } ``` ### service ```json { "html_url": "https://acme.pagerduty.com/services/PF9KMXH", "id": "PF9KMXH", "self": "https://api.pagerduty.com/services/PF9KMXH", "summary": "testing service updates", "alert_creation": "create_alerts_and_incidents", "teams": [ { "html_url": "https://acme.pagerduty.com/teams/PFCVPS0", "id": "PFCVPS0", "self": "https://api.pagerduty.com/teams/PFCVPS0", "summary": "Engineering", "type": "team_reference" } ], "type": "service" } ``` ### service_field_values ```json { "service": { "html_url": "https://acme.pd-staging.com/services/PY0TW31", "id": "PY0TW31", "self": "https://api.pd-staging.com/services/PY0TW31", "summary": null, "type": "service_reference" }, "custom_fields": [ { "data_type": "string", "field_type": "multi_value", "id": "P0CU101", "name": "string_multi_example_1", "type": "field_value", "value": ["1", "2"] }, { "data_type": "string", "field_type": "single_value", "id": "P7DNIMB", "name": "example_field", "type": "field_value", "value": "Some new value" } ], "changed_custom_fields": [ { "data_type": "string", "field_type": "single_value", "id": "P7DNIMB", "name": "example_field", "type": "field_value", "value": "Some old value" } ], "type": "service_field_values" } ``` ### incident_action_invocation ```json { "id": "01CELD6T9C2JS745I7CAK0LRRF", "self": "https://api.pagerduty.com/automation/invocations/01CELD6T9C2JS745I7CAK0LRRF", "html_url": "https://acme.pagerduty.com/rundeck-actions/actions/01CDYN0IRV4VG991K5FR73YNTW/invocations/01CELD6T9C2JS745I7CAK0LRRF/report", "incident": { "html_url": "https://acme.pagerduty.com/incidents/PBAZLIU", "id": "PBAZLIU", "self": "https://api.pagerduty.com/incidents/PBAZLIU", "summary": "An Incident", "type": "incident_reference" }, "action": { "html_url": "https://acme.pagerduty.com/rundeck-actions/actions/01CDYN0IRV4VG991K5FR73YNTW", "id": "01CDYN0IRV4VG991K5FR73YNTW", "self": "https://api.pagerduty.com/automation/actions/01CDYN0IRV4VG991K5FR73YNTW", "summary": "A Helpful Action", "type": "action_reference" }, "state": "created", "type": "incident_action_invocation" } ``` ### scribe_summary The sample payload below demonstrates the schema when a summary is successfully generated. On a summary-generation failure, Scribe Agent still emits a `scribe_summary` event, but with a different event `data` shape: `meeting_summary`/`key_points`/`next_steps`/`is_truncated` all set to `null`, and an `error` string instead. ```json { "type": "scribe_summary", "scribe_id": "60d4739b-4d24-436a-b514-dcbf2f4d90db", "incident": { "id": "PBAZLIU", "type": "incident_reference", "self": "https://api.pagerduty.com/incidents/PBAZLIU", "html_url": "https://acme.pagerduty.com/incidents/PBAZLIU", "summary": null }, "meeting": { "id": "meeting-123", "type": "zoom" }, "meeting_summary": "The team discussed the ongoing incident and agreed on next steps.", "key_points": "Root cause identified. Fix is being deployed.", "next_steps": "Monitor error rates for the next hour.", "is_truncated": false, "meeting_participants": [ { "name": "Software Engineer", "email": "sw.engineer@example.com" } ], "error": null } ``` ## Early Access Events In addition to the events detailed on this page, we may occasionally have Early Access events. These are subject to change at any moment, without notice. ## Deprecated Versions ### V1 Webhooks Reached End Of Life - V1 reached End-Of-Support (EOS) in November 2021.
- V1 reached End-Of-Life (EOL) in October 2022.
### V2 Webhooks Reached End Of Support - V2 reached End-Of-Support (EOS) in October 2022.
- Please see the note at the top of this document for up-to-date V2 End-Of-Life information. > ## What is EOS & EOL? > > EOS means PagerDuty will not support any additional bug fixes or entertain new feature requests. > > EOL means PagerDuty will end the functionality and it won't be available for anyone to use. ## Developer Agreement Your access to and use of the PagerDuty Developer Services is governed by the [PagerDuty Developer Agreement](/developer/pagerduty-developer-agreement). --- URL: https://docs.pagerduty.com/developer/webhooks-v1-overview # Overview - V1 Webhooks Describes the deprecated V1 webhook payload structure, which was sent only for incident status and assignee field changes. > ## Migrate to V3 Webhook Subscriptions > If you are currently using V1/V2 webhook extensions and need to migrate them to [V3 webhook](/developer/webhooks-overview) subscriptions, please follow our migration guide. > > V1 webhook extensions became unsupported on November 13, 2021 and will lose functionality in October, 2022. Webhooks let you receive HTTP callbacks when interesting events happen within your PagerDuty account. Details surrounding the interesting event will be sent via HTTP POST to a URL that you specify. PagerDuty currently supports incident-based webhooks. After adding a webhook URL to a PagerDuty service, the triggering of new incidents on that service will cause outgoing webhook messages to be sent to that URL. In addition, certain interesting changes to an incident's state will cause other types of incident webhook messages to be sent. Generally, any change to the `status` or `assignees` of an incident will cause an outgoing message to be sent. ## Webhook Payload Webhook recipients receive a payload containing a single `messages` array that may contain multiple `message` elements if webhook firing actions occurred in quick succession. Each `message` in the array consists of four fields: Field Name | Type | Description ------------ | -------- | ------------ `id` | UUID | Uniquely identifies this outgoing webhook message; can be used for idempotency when processing the messages. `type` | String | The webhook message type (see below). `created_on` | DateTime | The date/time when the incident changed state. `data` | Object | The incident details at the time of the state change. ## Webhook Incident Details For incident webhooks, the `data` field contains a representation of the incident associated with the action that caused this webhook message. The fields below can be expected to be found in the incident data. Refer to the [webhook examples](#examples) to see what the data looks like in practice. Field Name | Type | Description -------------------------- | -------- | ----------- `id` | String | The incident's id, which can be used to find it in the REST API. `incident_number` | Integer | The number of the incident. This is unique across the account. `created_on` | DateTime | The date/time the incident was first triggered. `status` | String | The current status of the incident. `html_url` | URL | `service` | Object | A representation of the PagerDuty service that the incident belongs to. See the webhook examples for what the `service` object looks like. `assigned_to_user` | Object | _Deprecated_. Use `assigned_to` instead, as the incident can have multiple assignees. `assigned_to` | Array | A list of users assigned to the incident at the time of the webhook action. Each entry in the array indicates when the user was assigned. `trigger_summary_data` | Object | Contains details about the event that triggered the incident. `trigger_details_html_url` | URL | `last_status_change_on` | DateTime | The time at which the status of the incident last changed. `last_status_change_by` | Object | A representation of the PagerDuty user that is responsible for the incident's last status change. `number_of_escalations` | Integer | Number of times the incident has been escalated. `urgency` | String | The incident's urgency. ## Webhook Types A webhook's `type` field indicates what action caused it to be sent. Type | Description ------------------------ | ------------ `incident.trigger` | Sent when an incident is newly created/triggered. `incident.acknowledge` | Sent when an incident is acknowledged by a user. `incident.unacknowledge` | Sent when an incident is unacknowledged due to its acknowledgement timing out. `incident.resolve` | Sent when an incident has been resolved. `incident.assign` | Sent when an incident has been assigned to another user. Often occurs in concert with an `acknowledge`. `incident.escalate` | Sent when an incident has been escalated to another user in the same escalation chain. `incident.delegate` | Sent when an incident has been reassigned to another escalation policy. ## Examples ## incident.trigger ```json { "messages": [ { "type": "incident.trigger", "data": { "incident": { "id": "PRORDTY", "incident_number": 2126, "created_on": "2016-02-22T21:02:55Z", "status": "triggered", "pending_actions": [ { "type": "escalate", "at": "2016-02-22T13:07:55-08:00" }, { "type": "resolve", "at": "2016-02-22T17:02:55-08:00" } ], "html_url": "https://webdemo.pagerduty.com/incidents/PRORDTY", "incident_key": "17a02d0d370d4add8e53132199614121", "service": { "id": "PDS1SN6", "name": "Production XDB Cluster", "html_url": "https://webdemo.pagerduty.com/services/PDS1SN6", "deleted_at": null, "description": "Primary production datastore." }, "escalation_policy": { "id": "P5ARF12", "name": "Database Team", "deleted_at": null }, "assigned_to_user": { "id": "P553OPV", "name": "Laura Haley", "email": "laura.haley@example.com", "html_url": "https://webdemo.pagerduty.com/users/P553OPV" }, "trigger_summary_data": { "subject": "CPU Load High on xdb_production_echo" }, "trigger_details_html_url": "https://webdemo.pagerduty.com/incidents/PRORDTY/log_entries/Q2AIXW2ZIMCI4P", "trigger_type": "web_trigger", "last_status_change_on": "2016-02-22T21:02:55Z", "last_status_change_by": null, "number_of_escalations": 0, "assigned_to": [ { "at": "2016-02-22T21:02:55Z", "object": { "id": "P553OPV", "name": "Laura Haley", "email": "laura.haley@example.com", "html_url": "https://webdemo.pagerduty.com/users/P553OPV", "type": "user" } } ], "urgency": "high" } }, "id": "a52d3f80-d9a7-11e5-8db3-22000ad5aec9", "created_on": "2016-02-22T21:02:55Z" } ] } ``` ## incident.acknowledge ```json { "messages": [ { "type": "incident.acknowledge", "data": { "incident": { "id": "PRORDTY", "incident_number": 2126, "created_on": "2016-02-22T21:02:55Z", "status": "acknowledged", "pending_actions": [ { "type": "unacknowledge", "at": "2016-02-22T13:23:44-08:00" }, { "type": "resolve", "at": "2016-02-22T17:02:55-08:00" } ], "html_url": "https://webdemo.pagerduty.com/incidents/PRORDTY", "incident_key": "17a02d0d370d4add8e53132199614121", "service": { "id": "PDS1SN6", "name": "Production XDB Cluster", "html_url": "https://webdemo.pagerduty.com/services/PDS1SN6", "deleted_at": null, "description": "Primary production datastore." }, "escalation_policy": { "id": "P5ARF12", "name": "Database Team", "deleted_at": null }, "assigned_to_user": { "id": "PFBSJ2Z", "name": "Wiley Jacobson", "email": "wiley.jacobson@example.com", "html_url": "https://webdemo.pagerduty.com/users/PFBSJ2Z" }, "trigger_summary_data": { "subject": "CPU Load High on xdb_production_echo" }, "trigger_details_html_url": "https://webdemo.pagerduty.com/incidents/PRORDTY/log_entries/Q2AIXW2ZIMCI4P", "trigger_type": "web_trigger", "last_status_change_on": "2016-02-22T21:13:44Z", "last_status_change_by": { "id": "PFBSJ2Z", "name": "Wiley Jacobson", "email": "wiley.jacobson@example.com", "html_url": "https://webdemo.pagerduty.com/users/PFBSJ2Z" }, "number_of_escalations": 0, "assigned_to": [ { "at": "2016-02-22T21:03:21Z", "object": { "id": "PFBSJ2Z", "name": "Wiley Jacobson", "email": "wiley.jacobson@example.com", "html_url": "https://webdemo.pagerduty.com/users/PFBSJ2Z", "type": "user" } }, { "at": "2016-02-22T21:13:21Z", "object": { "id": "P553OPV", "name": "Laura Haley", "email": "laura.haley@example.com", "html_url": "https://webdemo.pagerduty.com/users/P553OPV", "type": "user" } } ], "acknowledgers": [ { "at": "2016-02-22T21:13:44Z", "object": { "id": "PFBSJ2Z", "name": "Wiley Jacobson", "email": "wiley.jacobson@example.com", "html_url": "https://webdemo.pagerduty.com/users/PFBSJ2Z", "type": "user" } } ], "urgency": "high" } }, "id": "286890b0-d9a9-11e5-bbf4-22000ae21df7", "created_on": "2016-02-22T21:13:44Z" } ] } ``` ## incident.unacknowledge ```json { "messages": [ { "type": "incident.unacknowledge", "data": { "incident": { "id": "PRORDTY", "incident_number": 2126, "created_on": "2016-02-22T21:02:55Z", "status": "triggered", "pending_actions": [ { "type": "resolve", "at": "2016-02-22T17:02:55-08:00" } ], "html_url": "https://webdemo.pagerduty.com/incidents/PRORDTY", "incident_key": "17a02d0d370d4add8e53132199614121", "service": { "id": "PDS1SN6", "name": "Production XDB Cluster", "html_url": "https://webdemo.pagerduty.com/services/PDS1SN6", "deleted_at": null, "description": "Primary production datastore." }, "escalation_policy": { "id": "P5ARF12", "name": "Database Team", "deleted_at": null }, "assigned_to_user": { "id": "PFBSJ2Z", "name": "Wiley Jacobson", "email": "wiley.jacobson@example.com", "html_url": "https://webdemo.pagerduty.com/users/PFBSJ2Z" }, "trigger_summary_data": { "subject": "CPU Load High on xdb_production_echo" }, "trigger_details_html_url": "https://webdemo.pagerduty.com/incidents/PRORDTY/log_entries/Q2AIXW2ZIMCI4P", "trigger_type": "web_trigger", "last_status_change_on": "2016-02-22T21:13:21Z", "last_status_change_by": null, "number_of_escalations": 0, "assigned_to": [ { "at": "2016-02-22T21:03:21Z", "object": { "id": "PFBSJ2Z", "name": "Wiley Jacobson", "email": "wiley.jacobson@example.com", "html_url": "https://webdemo.pagerduty.com/users/PFBSJ2Z", "type": "user" } }, { "at": "2016-02-22T21:13:21Z", "object": { "id": "P553OPV", "name": "Laura Haley", "email": "laura.haley@example.com", "html_url": "https://webdemo.pagerduty.com/users/P553OPV", "type": "user" } } ], "urgency": "high" } }, "id": "1acf45c0-d9a9-11e5-9ad4-22000a1798ef", "created_on": "2016-02-22T21:13:21Z" } ] } ``` ## incident.resolve ```json { "messages": [ { "type": "incident.resolve", "data": { "incident": { "id": "PRORDTY", "incident_number": 2126, "created_on": "2016-02-22T21:02:55Z", "status": "resolved", "pending_actions": [], "html_url": "https://webdemo.pagerduty.com/incidents/PRORDTY", "incident_key": "17a02d0d370d4add8e53132199614121", "service": { "id": "PDS1SN6", "name": "Production XDB Cluster", "html_url": "https://webdemo.pagerduty.com/services/PDS1SN6", "deleted_at": null, "description": "Primary production datastore." }, "escalation_policy": { "id": "P55N6KH", "name": "Database Executive", "deleted_at": null }, "assigned_to_user": null, "trigger_summary_data": { "subject": "CPU Load High on xdb_production_echo" }, "trigger_details_html_url": "https://webdemo.pagerduty.com/incidents/PRORDTY/log_entries/Q2AIXW2ZIMCI4P", "trigger_type": "web_trigger", "last_status_change_on": "2016-02-22T21:38:30Z", "last_status_change_by": { "id": "PFBSJ2Z", "name": "Wiley Jacobson", "email": "wiley.jacobson@example.com", "html_url": "https://webdemo.pagerduty.com/users/PFBSJ2Z" }, "number_of_escalations": 4, "resolved_by_user": { "id": "PFBSJ2Z", "name": "Wiley Jacobson", "email": "wiley.jacobson@example.com", "html_url": "https://webdemo.pagerduty.com/users/PFBSJ2Z" }, "assigned_to": [], "urgency": "high" } }, "id": "9dd14c90-d9ac-11e5-9ad4-22000a1798ef", "created_on": "2016-02-22T21:38:30Z" } ] } ``` ## incident.assign ```json { "messages": [ { "type": "incident.assign", "data": { "incident": { "id": "PRORDTY", "incident_number": 2126, "created_on": "2016-02-22T21:02:55Z", "status": "acknowledged", "pending_actions": [ { "type": "unacknowledge", "at": "2016-02-22T21:13:21Z" }, { "type": "resolve", "at": "2016-02-23T01:02:55Z" } ], "html_url": "https://webdemo.pagerduty.com/incidents/PRORDTY", "incident_key": "17a02d0d370d4add8e53132199614121", "service": { "id": "PDS1SN6", "name": "Production XDB Cluster", "html_url": "https://webdemo.pagerduty.com/services/PDS1SN6", "deleted_at": null, "description": "Primary production datastore." }, "escalation_policy": { "id": "P5ARF12", "name": "Database Team", "deleted_at": null }, "assigned_to_user": { "id": "PFBSJ2Z", "name": "Wiley Jacobson", "email": "wiley.jacobson@example.com", "html_url": "https://webdemo.pagerduty.com/users/PFBSJ2Z" }, "trigger_summary_data": { "subject": "CPU Load High on xdb_production_echo" }, "trigger_details_html_url": "https://webdemo.pagerduty.com/incidents/PRORDTY/log_entries/Q2AIXW2ZIMCI4P", "trigger_type": "web_trigger", "last_status_change_on": "2016-02-22T21:03:21Z", "last_status_change_by": { "id": "PFBSJ2Z", "name": "Wiley Jacobson", "email": "wiley.jacobson@example.com", "html_url": "https://webdemo.pagerduty.com/users/PFBSJ2Z" }, "number_of_escalations": 0, "assigned_to": [ { "at": "2016-02-22T21:02:55Z", "object": { "id": "P553OPV", "name": "Laura Haley", "email": "laura.haley@example.com", "html_url": "https://webdemo.pagerduty.com/users/P553OPV", "type": "user" } }, { "at": "2016-02-22T21:03:21Z", "object": { "id": "PFBSJ2Z", "name": "Wiley Jacobson", "email": "wiley.jacobson@example.com", "html_url": "https://webdemo.pagerduty.com/users/PFBSJ2Z", "type": "user" } } ], "acknowledgers": [ { "at": "2016-02-22T21:03:21Z", "object": { "id": "PFBSJ2Z", "name": "Wiley Jacobson", "email": "wiley.jacobson@example.com", "html_url": "https://webdemo.pagerduty.com/users/PFBSJ2Z", "type": "user" } } ], "urgency": "high" } }, "id": "b4dbd5e0-d9a7-11e5-9ad4-22000a1798ef", "created_on": "2016-02-22T21:03:21Z" } ] } ``` ## incident.escalate ```json { "messages": [ { "type": "incident.escalate", "data": { "incident": { "id": "PRORDTY", "incident_number": 2126, "created_on": "2016-02-22T21:02:55Z", "status": "triggered", "pending_actions": [ { "type": "resolve", "at": "2016-02-22T17:02:55-08:00" } ], "html_url": "https://webdemo.pagerduty.com/incidents/PRORDTY", "incident_key": "17a02d0d370d4add8e53132199614121", "service": { "id": "PDS1SN6", "name": "Production XDB Cluster", "html_url": "https://webdemo.pagerduty.com/services/PDS1SN6", "deleted_at": null, "description": "Primary production datastore." }, "escalation_policy": { "id": "P5ARF12", "name": "Database Team", "deleted_at": null }, "assigned_to_user": { "id": "PGLPTJ3", "name": "Nina Gulgowski", "email": "nina.gulgowski@example.com", "html_url": "https://webdemo.pagerduty.com/users/PGLPTJ3" }, "trigger_summary_data": { "subject": "CPU Load High on xdb_production_echo" }, "trigger_details_html_url": "https://webdemo.pagerduty.com/incidents/PRORDTY/log_entries/Q2AIXW2ZIMCI4P", "trigger_type": "web_trigger", "last_status_change_on": "2016-02-22T21:28:45Z", "last_status_change_by": null, "number_of_escalations": 1, "assigned_to": [ { "at": "2016-02-22T21:28:45Z", "object": { "id": "PGLPTJ3", "name": "Nina Gulgowski", "email": "nina.gulgowski@example.com", "html_url": "https://webdemo.pagerduty.com/users/PGLPTJ3", "type": "user" } } ], "urgency": "high" } }, "id": "41163e80-d9ab-11e5-bbf4-22000ae21df7", "created_on": "2016-02-22T21:28:45Z" } ] } ``` ## incident.delegate ```json { "messages": [ { "type": "incident.delegate", "data": { "incident": { "id": "PRORDTY", "incident_number": 2126, "created_on": "2016-02-22T21:02:55Z", "status": "triggered", "pending_actions": [ { "type": "resolve", "at": "2016-02-23T01:37:49Z" } ], "html_url": "https://webdemo.pagerduty.com/incidents/PRORDTY", "incident_key": "17a02d0d370d4add8e53132199614121", "service": { "id": "PDS1SN6", "name": "Production XDB Cluster", "html_url": "https://webdemo.pagerduty.com/services/PDS1SN6", "deleted_at": null, "description": "Primary production datastore." }, "escalation_policy": { "id": "P55N6KH", "name": "Default", "deleted_at": null }, "assigned_to_user": { "id": "PFBSJ2Z", "name": "Wiley Jacobson", "email": "wiley.jacobson@example.com", "html_url": "https://webdemo.pagerduty.com/users/PFBSJ2Z" }, "trigger_summary_data": { "subject": "CPU Load High on xdb_production_echo" }, "trigger_details_html_url": "https://webdemo.pagerduty.com/incidents/PRORDTY/log_entries/Q2AIXW2ZIMCI4P", "trigger_type": "web_trigger", "last_status_change_on": "2016-02-22T21:37:49Z", "last_status_change_by": null, "number_of_escalations": 4, "assigned_to": [ { "at": "2016-02-22T21:37:49Z", "object": { "id": "PFBSJ2Z", "name": "Wiley Jacobson", "email": "wiley.jacobson@example.com", "html_url": "https://webdemo.pagerduty.com/users/PFBSJ2Z", "type": "user" } } ], "urgency": "high" } }, "id": "85973630-d9ac-11e5-bbf4-22000ae21df7", "created_on": "2016-02-22T21:37:49Z" } ] } ``` ## Latest Version Please see [V3 Webhooks](/developer/webhooks-overview) ## Developer Agreement Your access to and use of the PagerDuty Developer Services is governed by the [PagerDuty Developer Agreement](/developer/pagerduty-developer-agreement). --- URL: https://docs.pagerduty.com/developer/webhooks-v2-overview # Overview - V2 Webhooks Describes the deprecated V2 webhook payload structure, including its id, event type, incident, webhook, and message fields. > ## Migrate to V3 Webhook Subscriptions > If you are currently using [V1/V2 webhook extensions](/integrations/webhooks) and need to migrate them to V3 webhook subscriptions, please follow our [migration guide](/integrations/webhooks#migration-guide) or use our [migration script](https://github.com/PagerDuty/public-support-scripts/tree/master/migrate_webhooks_to_v3) (provided as is). > > An end-of-life date for V2 webhooks has not been set. However, end-of-support for V2 webhooks began on October 31, 2022. This means existing integrations based on V2 webhooks will continue to work, however PagerDuty cannot accept any new feature requests or implement bug fixes. > > V1 webhook extensions became unsupported on November 13, 2021 and lost functionality on October 31, 2022. Please see [Webhook V1 Alternatives](/integrations/webhooks) for a list of affected integrations and alternative solutions. Webhooks let you receive HTTP callbacks when interesting events happen within your PagerDuty account. Details surrounding the interesting event will be sent via HTTP POST to a URL that you specify. PagerDuty currently supports incident-based webhooks. After adding a webhook URL to a PagerDuty service, the triggering of new incidents on that service will cause outgoing webhook messages to be sent to that URL. In addition, certain interesting changes to an incident's state will cause other types of incident webhook messages to be sent. Generally, any change to the `status` or `assignees` of an incident will cause an outgoing message to be sent. ## Webhook Payload Webhook recipients receive a payload containing a single `messages` array that may contain multiple `message` elements if webhook firing actions occurred in quick succession. Each `message` in the array consists of four fields: Field Name | Type | Description ------------- | -------- | ------------ `id` | UUID | Uniquely identifies this outgoing webhook message; can be used for idempotency when processing the messages. `event` | String | The webhook event type (see below). `created_on` | DateTime | The date/time when the incident changed state. `incident` | Object | The incident details at the time of the state change. `webhook` | Object | The webhook configuration which resulted in this message. `log_entries` | Array | Log entries (see below) that correspond to the action this Webhook is reporting. There will be only one `log_entry` type object in the array for `incident.trigger`, `incident.acknowledge` and `incident.resolve` type webhooks. For `incident.escalate` webhooks where there were more than one target, there will be one entry in this array for each escalation target. ## Incident Details For incident webhooks, the `incident` field contains a representation of the incident associated with the action that caused this webhook message. The fields below can be expected to be found in the incident data. Refer to the webhook examples below to see what the data looks like in practice. Field Name | Type | Description ------------------------------ | ------------------- | ------------- `id` | String | The incident's id, which can be used to find it in the REST API. `alerts` | Array | A list of alert keys associated with this incident (called `dedup_key` in the Events API format). More than one alert may be associated if grouping is enabled on a service. Use these keys to correlate an event sent to PagerDuty with a webhook event. See [Time-Based Alert Grouping](/ai-automation/aiops/noise-reduction/alert-grouping/time-based-alert-grouping) or [Intelligent Alert Grouping](/ai-automation/aiops/noise-reduction/alert-grouping/intelligent-alert-grouping) for more info on grouping. `incident_number` | Integer | The number of the incident. This is unique across the account. `title` | String | A succinct description of the nature, symptoms, cause, or effect of the incident. ~~`description`~~ (deprecated) | String | This field is deprecated. Please use `title` instead. The contents will be identical. For incidents manually created in PagerDuty, the description is available in the first log entry in `channel.details`. `created_at` | DateTime | The date/time the incident was first triggered. `status` | String | The current status of the incident. One of `triggered`, `acknowledged`, or `resolved` `incident_key` | String | The incident's de-duplication key. `html_url` | URL | `pending_actions` | Array | The list of `pending_actions` on the incident. A `pending_action` object contains a type of action which can be `escalate`, `unacknowledge`, `resolve` or `urgency_change`. A `pending_action` object contains `at`, the time at which the action will take place. An `urgency_change` `pending_action` will contain `to`, the urgency that the incident will change to. `service` | Object | A representation of the PagerDuty service that the incident belongs to. See the webhook examples below for what the `service` object looks like. `assignments` | Array | A list of users assigned to the incident at the time of the webhook action. Each entry in the array indicates when the user was assigned. `acknowledgements` | Array | List of all acknowledgements for this incident. `last_status_change_at` | DateTime | The time at which the status of the incident last changed. `last_status_change_by` | Object | The user or service which is responsible for the incident's last status change. If the incident is in the acknowledged or resolved status, this will be the user that took the first acknowledged or resolved action. If the incident was automatically resolved (say through the Events API), or if the incident is in the triggered state, this will be the incident's service. `first_trigger_log_entry` | Object | The first trigger log entry for the incident. `escalation_policy` | Object | The escalation policy that the incident is currently following. `teams` | Array | The teams involved in the incident's lifecycle. `priority` | Object | The priority of the incident. `urgency` | String | The incident's urgency (`high` or `low`). `resolve_reason` | Nullable
String | The reason the incident was resolved. Currently the only valid values are `null` and `"merged"` with plans to introduce additional reasons in the future. `alert_counts` | Object | A summary of the number of alerts by status. `metadata` | Object | The metadata saved on the service. ## Log Entries PagerDuty keeps a log of all the events that happen to an incident. These are exposed as log entries. Log entries give you more insight into how your team or organization is handling your incidents. Log entry data includes details about the event(s) that affected the incident throughout its lifecycle, such as: - the data contained in events sent by the integration - which users were notified and when - how they were notified - which user(s) acknowledged or resolved the incident - any automatic actions that occurred to the incident - other manual user actions, such as a reassignment or a note The payload contains the log entry for the action(s) that triggered the webhook to be sent. The fields below can be expected to be found in each log entry object. Refer to the webhook examples below to see what the data looks like in practice. Field Name | Type | Description --------------- | -------- | ------------ `created_at` | DateTime | Time at which the log entry was created. `channel` | Object | The channel field represents the means by which the action was carried out.
For example, in `incident.trigger` webhooks, this will represent the original event data sent to PagerDuty that triggered the incident. `agent` | Object | The agent (user, service or integration) that created or modified the log entry. `note` | String | Optional field containing a note, if one was included with the log entry. `contexts` | Array | Contexts to be included with the trigger such as links to graphs or images. `incident` | Object | Reference to the incident. `service` | Object | Reference to the service associated with the incident. `teams` | Array | References to teams associated with the service. `event_details` | Object | Additional details about the event. ## Webhook Types A webhook's `event` field indicates what action caused it to be sent. Type | Description ------------------------ | ------------ `incident.trigger` | Sent when an incident is newly created/triggered. `incident.acknowledge` | Sent when an incident is acknowledged by a user. `incident.unacknowledge` | Sent when an incident is unacknowledged due to its acknowledgement timing out. `incident.resolve` | Sent when an incident has been resolved. `incident.assign` | Sent when an incident has been assigned to another user. Often occurs in concert with an `acknowledge`. `incident.escalate` | Sent when an incident has been escalated to another user in the same escalation chain. `incident.delegate` | Sent when an incident has been reassigned to another escalation policy. `incident.annotate` | Sent when a note is created on an incident. More webhook types may be added in the future. ## Examples ## incident.trigger ```json { "messages": [ { "event": "incident.trigger", "log_entries": [ { "id": "R2XGXEI3W0FHMSDXHDIBQGBQ5E", "type": "trigger_log_entry", "summary": "Triggered through the website", "self": "https://api.pagerduty.com/log_entries/R2XGXEI3W0FHMSDXHDIBQGBQ5E", "html_url": "https://webdemo.pagerduty.com/incidents/PRORDTY/log_entries/R2XGXEI3W0FHMSDXHDIBQGBQ5E", "created_at": "2017-09-26T15:14:36Z", "agent": { "id": "P553OPV", "type": "user_reference", "summary": "Laura Haley", "self": "https://api.pagerduty.com/users/P553OPV", "html_url": "https://webdemo.pagerduty.com/users/P553OPV" }, "channel": { "type": "web_trigger", "summary": "My new incident", "subject": "My new incident", "details": "Oh my gosh", "details_omitted": false }, "service": { "id": "PN49J75", "type": "service_reference", "summary": "Production XDB Cluster", "self": "https://api.pagerduty.com/services/PN49J75", "html_url": "https://webdemo.pagerduty.com/services/PN49J75" }, "incident": { "id": "PRORDTY", "type": "incident_reference", "summary": "[#33] My new incident", "self": "https://api.pagerduty.com/incidents/PRORDTY", "html_url": "https://webdemo.pagerduty.com/incidents/PRORDTY" }, "teams": [ { "id": "P4SI59S", "type": "team_reference", "summary": "Engineering", "self": "https://api.pagerduty.com/teams/P4SI59S", "html_url": "https://webdemo.pagerduty.com/teams/P4SI59S" } ], "contexts": [], "event_details": { "description": "My new incident" } } ], "webhook": { "endpoint_url": "https://requestb.in/18ao6fs1", "name": "V2 wabhook", "description": null, "webhook_object": { "id": "PN49J75", "type": "service_reference", "summary": "Production XDB Cluster", "self": "https://api.pagerduty.com/services/PN49J75", "html_url": "https://webdemo.pagerduty.com/services/PN49J75" }, "config": {}, "outbound_integration": { "id": "PJFWPEP", "type": "outbound_integration_reference", "summary": "Generic V2 Webhook", "self": "https://api.pagerduty.com/outbound_integrations/PJFWPEP", "html_url": null }, "accounts_addon": null, "id": "PKT9NNX", "type": "webhook", "summary": "V2 wabhook", "self": "https://api.pagerduty.com/webhooks/PKT9NNX", "html_url": null }, "incident": { "incident_number": 33, "title": "My new incident", "description": "My new incident", "created_at": "2017-09-26T15:14:36Z", "status": "triggered", "pending_actions": [ { "type": "escalate", "at": "2017-09-26T15:44:36Z" }, { "type": "resolve", "at": "2017-09-26T19:14:36Z" } ], "incident_key": null, "service": { "id": "PN49J75", "name": "Production XDB Cluster", "description": "This service was created during onboarding on July 5, 2017.", "auto_resolve_timeout": 14400, "acknowledgement_timeout": 1800, "created_at": "2017-07-05T17:33:09Z", "status": "critical", "last_incident_timestamp": "2017-09-26T15:14:36Z", "teams": [ { "id": "P4SI59S", "type": "team_reference", "summary": "Engineering", "self": "https://api.pagerduty.com/teams/P4SI59S", "html_url": "https://webdemo.pagerduty.com/teams/P4SI59S" } ], "incident_urgency_rule": { "type": "constant", "urgency": "high" }, "scheduled_actions": [], "support_hours": null, "escalation_policy": { "id": "PINYWEF", "type": "escalation_policy_reference", "summary": "Default", "self": "https://api.pagerduty.com/escalation_policies/PINYWEF", "html_url": "https://webdemo.pagerduty.com/escalation_policies/PINYWEF" }, "addons": [], "privilege": null, "alert_creation": "create_alerts_and_incidents", "integrations": [ { "id": "PUAYF96", "type": "generic_events_api_inbound_integration_reference", "summary": "API", "self": "https://api.pagerduty.com/services/PN49J75/integrations/PUAYF96", "html_url": "https://webdemo.pagerduty.com/services/PN49J75/integrations/PUAYF96" }, { "id": "P90GZUH", "type": "generic_email_inbound_integration_reference", "summary": "Email", "self": "https://api.pagerduty.com/services/PN49J75/integrations/P90GZUH", "html_url": "https://webdemo.pagerduty.com/services/PN49J75/integrations/P90GZUH" } ], "metadata": {}, "type": "service", "summary": "Production XDB Cluster", "self": "https://api.pagerduty.com/services/PN49J75", "html_url": "https://webdemo.pagerduty.com/services/PN49J75" }, "assignments": [ { "at": "2017-09-26T15:14:36Z", "assignee": { "id": "P553OPV", "type": "user_reference", "summary": "Laura Haley", "self": "https://api.pagerduty.com/users/P553OPV", "html_url": "https://webdemo.pagerduty.com/users/P553OPV" } } ], "acknowledgements": [], "last_status_change_at": "2017-09-26T15:14:36Z", "last_status_change_by": { "id": "PN49J75", "type": "service_reference", "summary": "Production XDB Cluster", "self": "https://api.pagerduty.com/services/PN49J75", "html_url": "https://webdemo.pagerduty.com/services/PN49J75" }, "first_trigger_log_entry": { "id": "R2XGXEI3W0FHMSDXHDIBQGBQ5E", "type": "trigger_log_entry_reference", "summary": "Triggered through the website", "self": "https://api.pagerduty.com/log_entries/R2XGXEI3W0FHMSDXHDIBQGBQ5E", "html_url": "https://webdemo.pagerduty.com/incidents/PRORDTY/log_entries/R2XGXEI3W0FHMSDXHDIBQGBQ5E" }, "escalation_policy": { "id": "PINYWEF", "type": "escalation_policy_reference", "summary": "Default", "self": "https://api.pagerduty.com/escalation_policies/PINYWEF", "html_url": "https://webdemo.pagerduty.com/escalation_policies/PINYWEF" }, "privilege": null, "teams": [ { "id": "P4SI59S", "type": "team_reference", "summary": "Engineering", "self": "https://api.pagerduty.com/teams/P4SI59S", "html_url": "https://webdemo.pagerduty.com/teams/P4SI59S" } ], "alert_counts": { "all": 0, "triggered": 0, "resolved": 0 }, "impacted_services": [ { "id": "PN49J75", "type": "service_reference", "summary": "Production XDB Cluster", "self": "https://api.pagerduty.com/services/PN49J75", "html_url": "https://webdemo.pagerduty.com/services/PN49J75" } ], "is_mergeable": true, "basic_alert_grouping": null, "alert_grouping": null, "metadata": {}, "external_references": [], "importance": null, "incidents_responders": [], "responder_requests": [], "subscriber_requests": [], "urgency": "high", "id": "PRORDTY", "type": "incident", "summary": "[#33] My new incident", "self": "https://api.pagerduty.com/incidents/PRORDTY", "html_url": "https://webdemo.pagerduty.com/incidents/PRORDTY", "alerts": [ { "alert_key": "c24117fc42e44b44b4d6876190583378" } ] }, "id": "69a7ced0-a2cd-11e7-a799-22000a15839c", "created_on": "2017-09-26T15:14:36Z" } ] } ``` ## incident.acknowledge ```json { "messages": [ { "event": "incident.acknowledge", "log_entries": [ { "id": "RRPP3746OFFZZ742NSP1G67AWC", "type": "acknowledge_log_entry", "summary": "Acknowledged by Laura Haley", "self": "https://api.pagerduty.com/log_entries/RRPP3746OFFZZ742NSP1G67AWC", "html_url": null, "created_at": "2017-09-26T15:15:17Z", "agent": { "id": "P553OPV", "type": "user_reference", "summary": "Laura Haley", "self": "https://api.pagerduty.com/users/P553OPV", "html_url": "https://webdemo.pagerduty.com/users/P553OPV" }, "channel": { "type": "website" }, "service": { "id": "PN49J75", "type": "service_reference", "summary": "Production XDB Cluster", "self": "https://api.pagerduty.com/services/PN49J75", "html_url": "https://webdemo.pagerduty.com/services/PN49J75" }, "incident": { "id": "PRORDTY", "type": "incident_reference", "summary": "[#33] My new incident", "self": "https://api.pagerduty.com/incidents/PRORDTY", "html_url": "https://webdemo.pagerduty.com/incidents/PRORDTY" }, "teams": [ { "id": "P4SI59S", "type": "team_reference", "summary": "Engineering", "self": "https://api.pagerduty.com/teams/P4SI59S", "html_url": "https://webdemo.pagerduty.com/teams/P4SI59S" } ], "contexts": [], "acknowledgement_timeout": 1800, "event_details": {} } ], "webhook": { "endpoint_url": "https://requestb.in/18ao6fs1", "name": "V2 wabhook", "description": null, "webhook_object": { "id": "PN49J75", "type": "service_reference", "summary": "Production XDB Cluster", "self": "https://api.pagerduty.com/services/PN49J75", "html_url": "https://webdemo.pagerduty.com/services/PN49J75" }, "config": {}, "outbound_integration": { "id": "PJFWPEP", "type": "outbound_integration_reference", "summary": "Generic V2 Webhook", "self": "https://api.pagerduty.com/outbound_integrations/PJFWPEP", "html_url": null }, "accounts_addon": null, "id": "PKT9NNX", "type": "webhook", "summary": "V2 wabhook", "self": "https://api.pagerduty.com/webhooks/PKT9NNX", "html_url": null }, "incident": { "incident_number": 33, "title": "My new incident", "description": "My new incident", "created_at": "2017-09-26T15:14:36Z", "status": "acknowledged", "pending_actions": [ { "type": "unacknowledge", "at": "2017-09-26T15:45:17Z" }, { "type": "resolve", "at": "2017-09-26T19:14:36Z" } ], "incident_key": null, "service": { "id": "PN49J75", "name": "Production XDB Cluster", "description": "This service was created during onboarding on July 5, 2017.", "auto_resolve_timeout": 14400, "acknowledgement_timeout": 1800, "created_at": "2017-07-05T17:33:09Z", "status": "warning", "last_incident_timestamp": "2017-09-26T15:14:36Z", "teams": [ { "id": "P4SI59S", "type": "team_reference", "summary": "Engineering", "self": "https://api.pagerduty.com/teams/P4SI59S", "html_url": "https://webdemo.pagerduty.com/teams/P4SI59S" } ], "incident_urgency_rule": { "type": "constant", "urgency": "high" }, "scheduled_actions": [], "support_hours": null, "escalation_policy": { "id": "PINYWEF", "type": "escalation_policy_reference", "summary": "Default", "self": "https://api.pagerduty.com/escalation_policies/PINYWEF", "html_url": "https://webdemo.pagerduty.com/escalation_policies/PINYWEF" }, "addons": [], "privilege": null, "alert_creation": "create_alerts_and_incidents", "integrations": [ { "id": "PUAYF96", "type": "generic_events_api_inbound_integration_reference", "summary": "API", "self": "https://api.pagerduty.com/services/PN49J75/integrations/PUAYF96", "html_url": "https://webdemo.pagerduty.com/services/PN49J75/integrations/PUAYF96" }, { "id": "P90GZUH", "type": "generic_email_inbound_integration_reference", "summary": "Email", "self": "https://api.pagerduty.com/services/PN49J75/integrations/P90GZUH", "html_url": "https://webdemo.pagerduty.com/services/PN49J75/integrations/P90GZUH" } ], "metadata": {}, "type": "service", "summary": "Production XDB Cluster", "self": "https://api.pagerduty.com/services/PN49J75", "html_url": "https://webdemo.pagerduty.com/services/PN49J75" }, "assignments": [ { "at": "2017-09-26T15:14:36Z", "assignee": { "id": "P553OPV", "type": "user_reference", "summary": "Laura Haley", "self": "https://api.pagerduty.com/users/P553OPV", "html_url": "https://webdemo.pagerduty.com/users/P553OPV" } } ], "acknowledgements": [ { "at": "2017-09-26T15:15:17Z", "acknowledger": { "id": "P553OPV", "type": "user_reference", "summary": "Laura Haley", "self": "https://api.pagerduty.com/users/P553OPV", "html_url": "https://webdemo.pagerduty.com/users/P553OPV" } } ], "last_status_change_at": "2017-09-26T15:15:17Z", "last_status_change_by": { "id": "P553OPV", "type": "user_reference", "summary": "Laura Haley", "self": "https://api.pagerduty.com/users/P553OPV", "html_url": "https://webdemo.pagerduty.com/users/P553OPV" }, "first_trigger_log_entry": { "id": "R2XGXEI3W0FHMSDXHDIBQGBQ5E", "type": "trigger_log_entry_reference", "summary": "Triggered through the website", "self": "https://api.pagerduty.com/log_entries/R2XGXEI3W0FHMSDXHDIBQGBQ5E", "html_url": "https://webdemo.pagerduty.com/incidents/PRORDTY/log_entries/R2XGXEI3W0FHMSDXHDIBQGBQ5E" }, "escalation_policy": { "id": "PINYWEF", "type": "escalation_policy_reference", "summary": "Default", "self": "https://api.pagerduty.com/escalation_policies/PINYWEF", "html_url": "https://webdemo.pagerduty.com/escalation_policies/PINYWEF" }, "privilege": null, "teams": [ { "id": "P4SI59S", "type": "team_reference", "summary": "Engineering", "self": "https://api.pagerduty.com/teams/P4SI59S", "html_url": "https://webdemo.pagerduty.com/teams/P4SI59S" } ], "alert_counts": { "all": 0, "triggered": 0, "resolved": 0 }, "impacted_services": [ { "id": "PN49J75", "type": "service_reference", "summary": "Production XDB Cluster", "self": "https://api.pagerduty.com/services/PN49J75", "html_url": "https://webdemo.pagerduty.com/services/PN49J75" } ], "is_mergeable": true, "basic_alert_grouping": null, "alert_grouping": null, "metadata": {}, "external_references": [ { "id": "PLF5V5G", "type": "incident_external_reference", "summary": "Slack", "self": null, "html_url": null, "external_id": "1506438878.000302", "external_url": "http://webdemo.slack.com/archives/C6975FLAZ/p1506438878.000302", "sync": false, "webhook": { "id": "PRXV5AH", "type": "webhook_reference", "summary": "Slack M2M", "self": "https://api.pagerduty.com/webhooks/PRXV5AH", "html_url": null } } ], "importance": null, "incidents_responders": [], "responder_requests": [], "subscriber_requests": [], "urgency": "high", "id": "PRORDTY", "type": "incident", "summary": "[#33] My new incident", "self": "https://api.pagerduty.com/incidents/PRORDTY", "html_url": "https://webdemo.pagerduty.com/incidents/PRORDTY", "alerts": [ { "alert_key": "c24117fc42e44b44b4d6876190583378" }, { "alert_key": "2d6ee0a6b58040f7996a4047ae5edcd7" } ] }, "id": "82a33960-a2cd-11e7-8f69-22000affca53", "created_on": "2017-09-26T15:15:17Z" } ] } ``` ## incident.resolve ```json { "messages": [ { "event": "incident.resolve", "log_entries": [ { "id": "RNAJ8DLJGWHBXXYX1CC5G50C9O", "type": "resolve_log_entry", "summary": "Resolved by Laura Haley", "self": "https://api.pagerduty.com/log_entries/RNAJ8DLJGWHBXXYX1CC5G50C9O", "html_url": null, "created_at": "2017-09-26T15:18:09+00:00", "agent": { "id": "P553OPV", "type": "user_reference", "summary": "Laura Haley", "self": "https://api.pagerduty.com/users/P553OPV", "html_url": "https://webdemo.pagerduty.com/users/P553OPV" }, "channel": { "type": "website" }, "service": { "id": "PN49J75", "type": "service_reference", "summary": "Production XDB Cluster", "self": "https://api.pagerduty.com/services/PN49J75", "html_url": "https://webdemo.pagerduty.com/services/PN49J75" }, "incident": { "id": "PRORDTY", "type": "incident_reference", "summary": "[#33] My new incident", "self": "https://api.pagerduty.com/incidents/PRORDTY", "html_url": "https://webdemo.pagerduty.com/incidents/PRORDTY" }, "teams": [ { "id": "P4SI59S", "type": "team_reference", "summary": "Engineering", "self": "https://api.pagerduty.com/teams/P4SI59S", "html_url": "https://webdemo.pagerduty.com/teams/P4SI59S" } ], "contexts": [], "event_details": {} } ], "webhook": { "endpoint_url": "https://requestb.in/18ao6fs1", "name": "V2 wabhook", "description": null, "webhook_object": { "id": "PN49J75", "type": "service_reference", "summary": "Production XDB Cluster", "self": "https://api.pagerduty.com/services/PN49J75", "html_url": "https://webdemo.pagerduty.com/services/PN49J75" }, "config": {}, "outbound_integration": { "id": "PJFWPEP", "type": "outbound_integration_reference", "summary": "Generic V2 Webhook", "self": "https://api.pagerduty.com/outbound_integrations/PJFWPEP", "html_url": null }, "accounts_addon": null, "id": "PKT9NNX", "type": "webhook", "summary": "V2 wabhook", "self": "https://api.pagerduty.com/webhooks/PKT9NNX", "html_url": null }, "incident": { "incident_number": 33, "title": "My new incident", "description": "My new incident", "created_at": "2017-09-26T15:14:36Z", "status": "resolved", "pending_actions": [], "incident_key": null, "service": { "id": "PN49J75", "name": "Production XDB Cluster", "description": "This service was created during onboarding on July 5, 2017.", "auto_resolve_timeout": 14400, "acknowledgement_timeout": 1800, "created_at": "2017-07-05T17:33:09Z", "status": "active", "last_incident_timestamp": "2017-09-26T15:14:36Z", "teams": [ { "id": "P4SI59S", "type": "team_reference", "summary": "Engineering", "self": "https://api.pagerduty.com/teams/P4SI59S", "html_url": "https://webdemo.pagerduty.com/teams/P4SI59S" } ], "incident_urgency_rule": { "type": "constant", "urgency": "high" }, "scheduled_actions": [], "support_hours": null, "escalation_policy": { "id": "PINYWEF", "type": "escalation_policy_reference", "summary": "Default", "self": "https://api.pagerduty.com/escalation_policies/PINYWEF", "html_url": "https://webdemo.pagerduty.com/escalation_policies/PINYWEF" }, "addons": [], "privilege": null, "alert_creation": "create_alerts_and_incidents", "integrations": [ { "id": "PUAYF96", "type": "generic_events_api_inbound_integration_reference", "summary": "API", "self": "https://api.pagerduty.com/services/PN49J75/integrations/PUAYF96", "html_url": "https://webdemo.pagerduty.com/services/PN49J75/integrations/PUAYF96" }, { "id": "P90GZUH", "type": "generic_email_inbound_integration_reference", "summary": "Email", "self": "https://api.pagerduty.com/services/PN49J75/integrations/P90GZUH", "html_url": "https://webdemo.pagerduty.com/services/PN49J75/integrations/P90GZUH" } ], "metadata": {}, "type": "service", "summary": "Production XDB Cluster", "self": "https://api.pagerduty.com/services/PN49J75", "html_url": "https://webdemo.pagerduty.com/services/PN49J75" }, "assignments": [ { "at": "2017-09-26T15:16:05Z", "assignee": { "id": "PFBSJ2Z", "type": "user_reference", "summary": "Wiley Jacobson", "self": "https://api.pagerduty.com/users/PFBSJ2Z", "html_url": "https://webdemo.pagerduty.com/users/PFBSJ2Z" } } ], "acknowledgements": [], "last_status_change_at": "2017-09-26T15:18:09Z", "last_status_change_by": { "id": "P553OPV", "type": "user_reference", "summary": "Laura Haley", "self": "https://api.pagerduty.com/users/P553OPV", "html_url": "https://webdemo.pagerduty.com/users/P553OPV" }, "first_trigger_log_entry": { "id": "R2XGXEI3W0FHMSDXHDIBQGBQ5E", "type": "trigger_log_entry_reference", "summary": "Triggered through the website", "self": "https://api.pagerduty.com/log_entries/R2XGXEI3W0FHMSDXHDIBQGBQ5E", "html_url": "https://webdemo.pagerduty.com/incidents/PRORDTY/log_entries/R2XGXEI3W0FHMSDXHDIBQGBQ5E" }, "escalation_policy": { "id": "PINYWEF", "type": "escalation_policy_reference", "summary": "Default", "self": "https://api.pagerduty.com/escalation_policies/PINYWEF", "html_url": "https://webdemo.pagerduty.com/escalation_policies/PINYWEF" }, "privilege": null, "teams": [ { "id": "P4SI59S", "type": "team_reference", "summary": "Engineering", "self": "https://api.pagerduty.com/teams/P4SI59S", "html_url": "https://webdemo.pagerduty.com/teams/P4SI59S" } ], "alert_counts": { "all": 0, "triggered": 0, "resolved": 0 }, "impacted_services": [ { "id": "PN49J75", "type": "service_reference", "summary": "Production XDB Cluster", "self": "https://api.pagerduty.com/services/PN49J75", "html_url": "https://webdemo.pagerduty.com/services/PN49J75" } ], "is_mergeable": true, "basic_alert_grouping": null, "alert_grouping": null, "metadata": {}, "external_references": [ { "id": "PLF5V5G", "type": "incident_external_reference", "summary": "Slack", "self": null, "html_url": null, "external_id": "1506438878.000302", "external_url": "http://webdemo.slack.com/archives/C6975FLAZ/p1506438878.000302", "sync": false, "webhook": { "id": "PRXV5AH", "type": "webhook_reference", "summary": "Slack M2M", "self": "https://api.pagerduty.com/webhooks/PRXV5AH", "html_url": null } } ], "importance": null, "resolve_reason": null, "incidents_responders": [], "responder_requests": [], "subscriber_requests": [], "urgency": "high", "id": "PRORDTY", "type": "incident", "summary": "[#33] My new incident", "self": "https://api.pagerduty.com/incidents/PRORDTY", "html_url": "https://webdemo.pagerduty.com/incidents/PRORDTY", "alerts": [ { "alert_key": "c24117fc42e44b44b4d6876190583378" }, { "alert_key": "2d6ee0a6b58040f7996a4047ae5edcd7" } ] }, "id": "e82195c0-a2cd-11e7-8f69-22000affca53", "created_on": "2017-09-26T15:18:09Z" } ] } ``` ## incident.assign ```json { "messages": [ { "event": "incident.assign", "log_entries": [ { "id": "R6XNGC35VF6U1TUSVIE2DWXD4Z", "type": "assign_log_entry", "summary": "Assigned to Wiley Jacobson by Laura Haley", "self": "https://api.pagerduty.com/log_entries/R6XNGC35VF6U1TUSVIE2DWXD4Z", "html_url": null, "created_at": "2017-09-26T15:16:05Z", "agent": { "id": "P553OPV", "type": "user_reference", "summary": "Laura Haley", "self": "https://api.pagerduty.com/users/P553OPV", "html_url": "https://webdemo.pagerduty.com/users/P553OPV" }, "channel": { "type": "website" }, "service": { "id": "PN49J75", "type": "service_reference", "summary": "Production XDB Cluster", "self": "https://api.pagerduty.com/services/PN49J75", "html_url": "https://webdemo.pagerduty.com/services/PN49J75" }, "incident": { "id": "PRORDTY", "type": "incident_reference", "summary": "[#33] My new incident", "self": "https://api.pagerduty.com/incidents/PRORDTY", "html_url": "https://webdemo.pagerduty.com/incidents/PRORDTY" }, "teams": [ { "id": "P4SI59S", "type": "team_reference", "summary": "Engineering", "self": "https://api.pagerduty.com/teams/P4SI59S", "html_url": "https://webdemo.pagerduty.com/teams/P4SI59S" } ], "contexts": [], "assignees": [ { "id": "PFBSJ2Z", "type": "user_reference", "summary": "Wiley Jacobson", "self": "https://api.pagerduty.com/users/PFBSJ2Z", "html_url": "https://webdemo.pagerduty.com/users/PFBSJ2Z" } ] } ], "webhook": { "endpoint_url": "https://requestb.in/18ao6fs1", "name": "V2 wabhook", "description": null, "webhook_object": { "id": "PN49J75", "type": "service_reference", "summary": "Production XDB Cluster", "self": "https://api.pagerduty.com/services/PN49J75", "html_url": "https://webdemo.pagerduty.com/services/PN49J75" }, "config": {}, "outbound_integration": { "id": "PJFWPEP", "type": "outbound_integration_reference", "summary": "Generic V2 Webhook", "self": "https://api.pagerduty.com/outbound_integrations/PJFWPEP", "html_url": null }, "accounts_addon": null, "id": "PKT9NNX", "type": "webhook", "summary": "V2 wabhook", "self": "https://api.pagerduty.com/webhooks/PKT9NNX", "html_url": null }, "incident": { "incident_number": 33, "title": "My new incident", "description": "My new incident", "created_at": "2017-09-26T15:14:36Z", "status": "triggered", "pending_actions": [ { "type": "resolve", "at": "2017-09-26T19:14:36Z" } ], "incident_key": null, "service": { "id": "PN49J75", "name": "Production XDB Cluster", "description": "This service was created during onboarding on July 5, 2017.", "auto_resolve_timeout": 14400, "acknowledgement_timeout": 1800, "created_at": "2017-07-05T17:33:09Z", "status": "critical", "last_incident_timestamp": "2017-09-26T15:14:36Z", "teams": [ { "id": "P4SI59S", "type": "team_reference", "summary": "Engineering", "self": "https://api.pagerduty.com/teams/P4SI59S", "html_url": "https://webdemo.pagerduty.com/teams/P4SI59S" } ], "incident_urgency_rule": { "type": "constant", "urgency": "high" }, "scheduled_actions": [], "support_hours": null, "escalation_policy": { "id": "PINYWEF", "type": "escalation_policy_reference", "summary": "Default", "self": "https://api.pagerduty.com/escalation_policies/PINYWEF", "html_url": "https://webdemo.pagerduty.com/escalation_policies/PINYWEF" }, "addons": [], "privilege": null, "alert_creation": "create_alerts_and_incidents", "integrations": [ { "id": "PUAYF96", "type": "generic_events_api_inbound_integration_reference", "summary": "API", "self": "https://api.pagerduty.com/services/PN49J75/integrations/PUAYF96", "html_url": "https://webdemo.pagerduty.com/services/PN49J75/integrations/PUAYF96" }, { "id": "P90GZUH", "type": "generic_email_inbound_integration_reference", "summary": "Email", "self": "https://api.pagerduty.com/services/PN49J75/integrations/P90GZUH", "html_url": "https://webdemo.pagerduty.com/services/PN49J75/integrations/P90GZUH" } ], "metadata": {}, "type": "service", "summary": "Production XDB Cluster", "self": "https://api.pagerduty.com/services/PN49J75", "html_url": "https://webdemo.pagerduty.com/services/PN49J75" }, "assignments": [ { "at": "2017-09-26T15:16:05Z", "assignee": { "id": "PFBSJ2Z", "type": "user_reference", "summary": "Wiley Jacobson", "self": "https://api.pagerduty.com/users/PFBSJ2Z", "html_url": "https://webdemo.pagerduty.com/users/PFBSJ2Z" } } ], "acknowledgements": [], "last_status_change_at": "2017-09-26T15:16:05Z", "last_status_change_by": { "id": "PN49J75", "type": "service_reference", "summary": "Production XDB Cluster", "self": "https://api.pagerduty.com/services/PN49J75", "html_url": "https://webdemo.pagerduty.com/services/PN49J75" }, "first_trigger_log_entry": { "id": "R2XGXEI3W0FHMSDXHDIBQGBQ5E", "type": "trigger_log_entry_reference", "summary": "Triggered through the website", "self": "https://api.pagerduty.com/log_entries/R2XGXEI3W0FHMSDXHDIBQGBQ5E", "html_url": "https://webdemo.pagerduty.com/incidents/PRORDTY/log_entries/R2XGXEI3W0FHMSDXHDIBQGBQ5E" }, "escalation_policy": { "id": "PINYWEF", "type": "escalation_policy_reference", "summary": "Default", "self": "https://api.pagerduty.com/escalation_policies/PINYWEF", "html_url": "https://webdemo.pagerduty.com/escalation_policies/PINYWEF" }, "privilege": null, "teams": [ { "id": "P4SI59S", "type": "team_reference", "summary": "Engineering", "self": "https://api.pagerduty.com/teams/P4SI59S", "html_url": "https://webdemo.pagerduty.com/teams/P4SI59S" } ], "alert_counts": { "all": 0, "triggered": 0, "resolved": 0 }, "impacted_services": [ { "id": "PN49J75", "type": "service_reference", "summary": "Production XDB Cluster", "self": "https://api.pagerduty.com/services/PN49J75", "html_url": "https://webdemo.pagerduty.com/services/PN49J75" } ], "is_mergeable": true, "basic_alert_grouping": null, "alert_grouping": null, "metadata": {}, "external_references": [ { "id": "PLF5V5G", "type": "incident_external_reference", "summary": "Slack", "self": null, "html_url": null, "external_id": "1506438878.000302", "external_url": "http://webdemo.slack.com/archives/C6975FLAZ/p1506438878.000302", "sync": false, "webhook": { "id": "PRXV5AH", "type": "webhook_reference", "summary": "Slack M2M", "self": "https://api.pagerduty.com/webhooks/PRXV5AH", "html_url": null } } ], "importance": null, "incidents_responders": [], "responder_requests": [], "subscriber_requests": [], "urgency": "high", "id": "PRORDTY", "type": "incident", "summary": "[#33] My new incident", "self": "https://api.pagerduty.com/incidents/PRORDTY", "html_url": "https://webdemo.pagerduty.com/incidents/PRORDTY", "alerts": [ { "alert_key": "c24117fc42e44b44b4d6876190583378" }, { "alert_key": "2d6ee0a6b58040f7996a4047ae5edcd7" } ] }, "id": "9e7850d0-a2cd-11e7-8f69-22000affca53", "created_on": "2017-09-26T15:16:05Z" } ] } ``` ## Latest Version Please see [V3 Webhooks](/developer/webhooks-overview) ## Developer Agreement Your access to and use of the PagerDuty Developer Services is governed by the [PagerDuty Developer Agreement](/developer/pagerduty-developer-agreement). --- URL: https://docs.pagerduty.com/developer/wrapped-entities # Wrapped Entities Explains why every REST API request and response body wraps its resource data under a singular or plural root key field name. All resources represented in the REST API are *wrapped* with a root key in API requests and responses. This root key is either the *singular* name of the resource and has an [object](/developer/types#object) value, or it's the *pluralized* name of a collection of resources and has an [array](/developer/types#array). When submitting a request body to a [create](/developer/endpoints#post-resources-create) or an [update](/developer/endpoints#put-resourcesid-update-single) endpoint, the data you're providing about the resource needs to be wrapped in this same manner. Responses to any type of [endpoint](/developer/endpoints) will reflect it as well. ## Developer Agreement Your access to and use of the PagerDuty Developer Services is governed by the [PagerDuty Developer Agreement](/developer/pagerduty-developer-agreement). --- URL: https://docs.pagerduty.com/feature-tutorials # Introduction to Feature Tutorials Front page of the tutorials section PagerDuty has a huge library of resources available for you to learn more about our products to help you improve your incident response and service reliability. Here you can find collections of resources focused on performance and improvement goals, gathered from our various resources. So whether you prefer to learn by reading, watching, or coding, we've got you covered. ## Reduce Mean Time to Resolve (MTTR) Mean Time to Resolve, or MTTR, can be a useful measure for tracking your team's improvement in incident response. Learn more about [MTTR](https://www.pagerduty.com/resources/devops/learn/what-is-mttr/) - [Incident Workflows](/ai-automation/automation/incident-workflows) - [Event Orchestration](/feature-tutorials/event-orchestration) - [Incident Priority](/feature-tutorials/incident-priority) - Coming soon: - Probable Origin — ML-suggested likely root cause on an incident - Related Incidents / Past Incidents — surfaces similar prior incidents for faster triage - Outlier Incident — flags incidents that deviate from a service's normal pattern - Operations Console — centralized live view for triaging across many incidents at once - Incident Workflows — automated, repeatable response sequences triggered on incident creation Already have MTTR under control and want to go deeper? Check out [this podcast episode](https://www.pageittothelimit.com/mttr-and-beyond-rich-lafferty/). ## Prevent Burnout & Alert Fatigue Alert Fatigue can hit any team or any responder. The volume of alerts that many teams receive makes it hard to continue to make decisions about what is happening, whether an alert is meaningful or not. Manage your alerts better by allowing PagerDuty to help. Learn more about [Alert Fatigue](https://www.pagerduty.com/resources/digital-operations/learn/alert-fatigue/). - [Basics of Alert Grouping](/feature-tutorials/alert-grouping) - [Content-Based Alert Grouping](/ai-automation/aiops/noise-reduction/alert-grouping/content-based-alert-grouping) - [Intelligent Alert Grouping](/ai-automation/aiops/noise-reduction/alert-grouping/intelligent-alert-grouping) - [Global Alert Grouping](/ai-automation/aiops/noise-reduction/alert-grouping/global-alert-grouping) - Coming Soon: - Auto-Pause Incident Notifications — suppresses alerts likely to self-resolve - Round Robin Scheduling — distributes on-call load evenly across a team - Shift-Based Schedules — modern scheduling model (as distinct from legacy Schedule Basics) - Dynamic Notifications — adjusts notification urgency based on alert payload Alert fatigue has origins in neuroscience. Learn more on our [podcast](https://www.pageittothelimit.com/alert-fatigue-with-boaz-barzel/). ## Improve System Reliability: Complex systems are complex. Knowing what is going on in your ecosystem is important when trying to keep your systems reliable and provide good user experience. - Keep track of which services have been changed using [Change Events](/feature-tutorials/change-events) - Proactively manage alerts during planned work with [Maintenance Windows](/feature-tutorials/maintenance-windows) - Use [Incident Priority](/feature-tutorials/incident-priority) to communicate the importance of particular incidents - Coming Soon - Service Standards — tracks whether services meet configuration best practices - Operational Reviews — scheduled, data-driven reviews of incident impact over time - Service Performance Insights — analytics on a service's incident trends ## Streamline Incident Communication: Keeping all stakeholders informed during an incident can be challenging - you have more information to give to internal stakeholders than you do to customers or other external stakeholders. Automating your incident communications helps keep everyone up to date on the status of a live incident. - General information about Stakeholder Communications in our [knowledge base](/incident-management/communicate/communicate-with-stakeholders): Managing subscribers on an incident, sending status updates, status update notifcations methods. - Internal Stakeholder Updates via Slack using [Incident Workflows](/ai-automation/automation/incident-workflows) - [Status Pages](/feature-tutorials/status-pages) provide a one-stop shop for folks who need to know more about the status of your services, whether internal or external - Coming Soon - Status Update Templates — pre-built templates for consistent stakeholder updates - Conference Bridge — auto-attach a call bridge to incidents - Slack / Microsoft Teams ChatOps — manage incidents without leaving chat ## Automate Manual Tasks: Automation is your friend in managing realtime work, avoiding waking human responders after hours, and for increasing speed and reliability in everyday tasks for your team. - [Runbook Automation](/ai-automation/runbook-automation) and Rundeck Open Source is a platform for managing and running automation tools - add your existing scripts and tools and provide users with a secure, auditable platform for automated tasks. - [Automation Actions](/feature-tutorials/automation-actions) brings Runbook Automation into your PagerDuty platform, powering autoremediation solutions for your teams. - Coming Soon - Custom Incident Actions — one-off webhook-triggered buttons on an incident - Webhooks — general-purpose outbound event notifications - Incident Workflows Not sure what we mean by automation or autoremediation? Check out our [Ops Guide](/ops-guides/auto-remediation). ## Gain Visibility into Infrastructure: Your users only know the "front door" of your services and applications, but your architecture has plenty of hidden complexity. Make sure all stakeholders can be informed, even if they aren't familiar with the services. - [Service Graph and Service Dependencies](/feature-tutorials/service-graph) allows your team to document the relationships and dependencies among your services, illuminating which downstream services are potentially impacted by an ongoing incident. - [Status Pages](/incident-management/communicate/status-pages-overview) give you a centralized location to publish incident updates to your interal and external stakeholders. - [Business Service Subscriptions](/incident-management/services/business-services/subscription) are an easy way for stakeholders to stay aware of user-facing services impacted by incidents in the backend layers of your ecosystem. - Coming Soon - Analytics Dashboard / Insights suite (Incident Activity, Responder, Team, Escalation Policy, Business Impact Insights) - Visibility Console - Audit Trail Reporting - Incident Activity Insights - Service Performance Insights - Business Impact Insights - Audit Trail Reporting - Event Analytics Maintaining good service ownership hygeine will make finding responders much easier during an incident, but it can be complex to figure out who should own what services. For more on Full Service Ownership, check out our [Ops Guide](/ops-guides/service-ownership) ## Team and On-Call Management Don't just cover the basics; help your team have a better on-call experience. Set better team norms and expectations, manage team health, and make better use of PagerDuty's essential features. - Coming SoonEscalation Policies (deferred per your earlier note, but the natural home for it) - Shift-Based Schedules / Round Robin Scheduling - Teams, Advanced Permissions, User Roles - Responder Insights — analytics on individual responder load and activity - Team Insights — analytics on team-level incident load and performance - Escalation Policy Insights — analytics on how well escalation policies are performing - On-Call Readiness Reports — surfaces gaps in on-call coverage before they become a problem - User Onboarding Report — tracks new user activation and setup completion - Operational Maturity — benchmarks account configuration against best practices ## AI and Assistive Agents PagerDuty AI's agent lineup — Scribe Agent, Shift Agent, Insights Agent, and Paige, PagerDuty's SRE Agent — are functional agents built into the platform, each doing one job, with Paige orchestrating across them. Together with the PagerDuty MCP Server, they go beyond a standard features list. - Coming Soon - Scribe Agent - Shift Agent - Insights Agent - Paige - PagerDuty MCP Server --- URL: https://docs.pagerduty.com/feature-tutorials/aiops # Feature Tutorial: PagerDuty AIOps PagerDuty AIOps compresses alert noise using machine learning grouping, surfaces likely root causes, and automates response with Event Orchestration. When alerts come in by the dozens or hundreds during an outage, the hardest part isn't detecting that something's wrong — it's cutting through the noise to find out what actually matters and where to look first. PagerDuty AIOps compresses that noise, provides situational awareness, and automates the repetitive parts of incident response. It uses machine learning to intelligently group related alerts into a single incident, surfaces probable origin points and related past incidents so responders know where to focus, and lets teams build automation — from enrichment to routing to self-healing actions — using Event Orchestration. AIOps is the current evolution of PagerDuty's Legacy Event Intelligence add-on, and includes everything in Event Intelligence plus Global Event Orchestration. Customers have reported significant reductions in alert noise and faster mean time to resolution as a result. Because AIOps is priced by event consumption rather than by user, only events sent to AIOps-enabled services or Event Orchestrations count toward an account's event volume tier — non-AIOps services and Orchestrations don't get access to the advanced noise-reduction and root-cause features. ## Learn More **Read more about what PagerDuty AIOps provides** * [Introducing PagerDuty AIOps](https://www.pagerduty.com/blog/product/introducing-pagerduty-aiops/) - the original announcement covering noise reduction, triage, and automation. * [Built to Withstand the Next Outage: How PagerDuty AIOps Keeps You Ahead](https://www.pagerduty.com/blog/aiops/built-to-withstand-the-next-outage-how-pagerduty-aiops-keeps-you-ahead/) - covers the Operations Console, Global Alert Grouping, and Global Event Orchestration. **Watch the product demos and webinars** * [PagerDuty AIOps – Everything you need to know in 2 minutes](https://www.youtube.com/watch?v=dOUDk7r3vSU) * [PagerDuty AIOps Noise Reduction Demo in 3 Minutes](https://www.youtube.com/watch?v=gR7yjNoZaEI) — covers alert grouping and Auto-Pause Incident Notifications. * [5-Minute Demo: PagerDuty AIOps Automation and Orchestration](https://www.youtube.com/watch?v=9cajmJ_WVM0) — covers Global Event Orchestration and its impact on MTTR. * [PagerDuty AIOps Visibility Console Demo in One Minute](https://www.youtube.com/watch?v=XDKJ3ULX6rM) **Check out the training modules on PDU** * [AIOps Knowledge Series](https://university.pagerduty.com/path/aiops-knowledge-series) — covers how AIOps leverages Event Orchestration to reduce noise, surface insights, and improve responsiveness. * [(AIOps) Event Orchestration](https://university.pagerduty.com/aiops-event-orchestration) — covers Global vs. Service Orchestrations and building automated rules. * [(AIOps) Managing Your Event Volume](https://university.pagerduty.com/managing-your-event-volume) — covers accepted events and consumption-based pricing. **Watch the click-through tutorial** * coming soon **Find the product documentation in our Knowledge Base** * [PagerDuty AIOps](/aiops/aiops) * [PagerDuty AIOps Quickstart Guide](/aiops/pagerduty-aiops-quickstart-guide) * [Event Orchestration](/aiops/event-orchestration) **Using the API?** Alert grouping and event automation are managed via the [Alert Grouping Settings API](/developer/api/reference#rest/tag/alert-grouping-settings) and the [Event Orchestrations API](/developer/api/reference#rest/tag/event-orchestrations): * [List alert grouping settings](/developer/api/reference/rest/alert-grouping-settings/list-alert-grouping-settings) * [Get an Alert Grouping Setting](/developer/api/reference/rest/alert-grouping-settings/get-alert-grouping-setting) **Managing PagerDuty with Terraform?** * [pagerduty_event_orchestration](https://registry.terraform.io/providers/PagerDuty/pagerduty/latest/docs/resources/event_orchestration) — create the top-level Event Orchestration * [pagerduty_event_orchestration_global](https://registry.terraform.io/providers/PagerDuty/pagerduty/latest/docs/resources/event_orchestration_global) — configure Global Orchestration rules * [pagerduty_event_orchestration_service](https://registry.terraform.io/providers/PagerDuty/pagerduty/latest/docs/resources/event_orchestration_service) — configure per-service Orchestration rules * [pagerduty_alert_grouping_setting](https://registry.terraform.io/providers/PagerDuty/pagerduty/latest/docs/resources/alert_grouping_setting) — configure intelligent, content-based, or time-based alert grouping Find the full documentation for the PagerDuty Terraform Provider in the [Terraform Registry](https://registry.terraform.io/providers/PagerDuty/pagerduty/latest/docs) --- URL: https://docs.pagerduty.com/feature-tutorials/alert-grouping # Feature Tutorial: Alert Grouping Consolidates related alerts into one incident per service using intelligent, content-based, unified, or time-based grouping methods. A single underlying problem can easily fan out into dozens of separate alerts — one per host, one per check, one per downstream dependency — and responders end up triaging the flood instead of the actual issue. Alert Grouping consolidates related alerts into a single incident on a service, cutting notification noise and giving responders one place to see everything relevant to what's actually happening. PagerDuty offers several grouping methods depending on how predictable an account's alert data is: Intelligent Alert Grouping uses machine learning to group alerts based on textual similarity and past grouping behavior; Content-Based Alert Grouping groups alerts that share an exact match on chosen fields; Unified Alert Grouping combines both for extra precision; and Time-Based Alert Grouping simply groups everything that arrives within a set time window. By default, Alert Grouping scopes to a single technical service. Global Alert Grouping expands that scope, letting a group span multiple services — useful when one underlying problem is known to ripple across several services at once. Alert Grouping is included with the PagerDuty AIOps add-on (and, for some grouping methods, with Legacy Event Intelligence). Customers have reported noise reduction as high as 98% after tuning their grouping settings. ## Learn More **Read more about what Alert Grouping provides** * [How to Reduce Noise, Resolve Faster, and Automate More Often with PagerDuty](https://www.pagerduty.com/blog/aiops/how-to-reduce-noise-resolve-faster-and-automate-more-often-with-pagerduty/) - covers the tradeoffs between time-based grouping and training Intelligent Alert Grouping. * [Cut Through the Chaos With PagerDuty Event Intelligence](https://www.pagerduty.com/blog/news-announcements/suppress-noise-event-intelligence/) - the original introduction of Intelligent Alert Grouping and the noise problem it addresses. **Watch the product demos and webinars** * [PagerDuty AIOps Noise Reduction Demo in 3 Minutes](https://www.youtube.com/watch?v=gR7yjNoZaEI) — covers alert grouping and Auto-Pause Incident Notifications. **Check out the training modules on PDU** * [AIOps Knowledge Series](https://university.pagerduty.com/path/aiops-knowledge-series) — includes coverage of Alert Grouping as part of AIOps's noise reduction feature set. * PDU also offers a job aid comparing the different Alert Grouping options available in PagerDuty — useful as a quick-reference alongside this page. **Watch the click-through tutorial** * Coming soon **Find the product documentation in our Knowledge Base** * [Alert Grouping](/ai-and-automation/aiops/alert-grouping) * [Global Alert Grouping](/ai-and-automation/aiops/global-alert-grouping) * [Intelligent Alert Grouping](/ai-and-automation/aiops/intelligent-alert-grouping) * [Content-Based Alert Grouping](/ai-and-automation/aiops/content-based-alert-grouping) * [Unified Alert Grouping](/ai-and-automation/aiops/unified-alert-grouping) * [Time-Based Alert Grouping](/ai-and-automation/aiops/time-based-alert-grouping) * [Noise Reduction](/ai-and-automation/aiops/noise-reduction) **Using the API?** Alert grouping is managed via the [Alert Grouping Settings API](/developer/api/reference#rest/tag/alert-grouping-settings): * [List alert grouping settings](/developer/api/reference/rest/alert-grouping-settings/list-alert-grouping-settings) * [Get an Alert Grouping Setting](/developer/api/reference/rest/alert-grouping-settings/get-alert-grouping-setting) * [Alert Grouping Parameters](https://developer.pagerduty.com/api-reference/2ffca99cb89d1-alert-grouping-parameters) **Managing PagerDuty with Terraform?** * [pagerduty_alert_grouping_setting](https://registry.terraform.io/providers/PagerDuty/pagerduty/latest/docs/resources/alert_grouping_setting) — configure intelligent, content-based, unified, or time-based alert grouping on a service --- URL: https://docs.pagerduty.com/feature-tutorials/automation-actions # Feature Tutorial: Automation Actions Runs pre-built diagnostic and remediation jobs on an incident through a secured Runner, without escalating to a specialist for known fixes. When an incident needs a known diagnostic or fix, the fastest path is usually to escalate to whoever knows the runbook — which means waking someone up for something that's already been solved before, more than once. Automation Actions gives responders push-button access to a library of diagnostic and remediation jobs directly from an incident, without needing to escalate to a specialist. An Action invokes a job staged in Runbook Automation (or a script run by a Runbook Automation Self-Hosted Runner), and can be triggered manually from the PagerDuty web app, mobile app, or Slack — or automatically as part of an Event Orchestration rule, with no human in the loop at all. Because Actions connect to production infrastructure through a Runner deployed within a firewall or VPC, responders get safely delegated automation rather than direct access to sensitive systems. Results — logs, diagnostics output, remediation status — flow back into the incident's Automation Actions Log, so the team has a record of what ran and what it found without leaving PagerDuty. Automation Actions is available to accounts with Runbook Automation (SaaS or Self-Hosted), and requires a PD Automation Actions user license. ## Learn More **Read more about what Automation Actions provides** * [Extending Automation Actions Across the PagerDuty Platform](https://www.pagerduty.com/blog/automation/summit-automation-actions-updates/) - covers Automation Actions in Incident Response and in Slack, and how it lets first-line responders triage without escalating. **Watch the product demos and webinars** * [PagerDuty Rundeck Integration Demo](https://www.youtube.com/watch?v=rR450shsjMc) — covers triggering automated jobs from a PagerDuty incident to shorten resolution and reduce escalations. **Check out the training modules on PDU** * [End-to-End Event-Driven Automation](https://university.pagerduty.com/event-driven-automation) — includes the "Speed Up Incident Resolution with Automation Actions" module on applying Automation Actions to reduce manual intervention and improve resolution times. **Watch the click-through tutorial** * need one recorded for this **Find the product documentation in our Knowledge Base** * [PagerDuty Automation Actions](/incident-management/automation/automation-actions) * [Automated Diagnostics](https://docs.rundeck.com/docs/learning/solutions/automated-diagnostics/solution-overview.html) — a prebuilt library of automation jobs designed to be invoked using Automation Actions * [PagerDuty Automation Trial](/incident-management/automation/pagerduty-automation-trial) **Using the API?** Automation Actions are managed via the [Automation Actions API](/developer/api/reference#rest/tag/automation-actions): * [List Automation Actions](/developer/api/reference/rest/automation-actions/get-all-automation-actions) * [Create an Automation Action](/developer/api/reference/rest/automation-actions/create-automation-action) * [Create an Automation Action runner](/developer/api/reference/rest/automation-actions/create-automation-actions-runner) **Managing PagerDuty with Terraform?** * [pagerduty_automation_actions_action](https://registry.terraform.io/providers/PagerDuty/pagerduty/latest/docs/resources/automation_actions_action) — define a script or Runbook Automation job as an Action * [pagerduty_automation_actions_runner](https://registry.terraform.io/providers/PagerDuty/pagerduty/latest/docs/resources/automation_actions_runner) — configure the Runner that executes Actions **Other Resources** * [Automating the Response Process](/ops-guides/auto-remediation) - PagerDuty's Ops Guide on using automation for incident remediation, including how to identify good candidates for automated remediation and self-healing. --- URL: https://docs.pagerduty.com/feature-tutorials/change-events # Feature Tutorial: Change Events Captures change data from code repos, CI/CD pipelines, and infrastructure-as-code tools so responders can see what changed before an incident. The first thing most responders ask when investigating an incident is "What changed?". In fast-moving, complex environments, it can be challenging to know the answer to that question. Change Events, or Recent Changes, allows PagerDuty to capture information about important changes from across your infrastructure. Making changes in production environments can be risky; it has been estimated that a majority of production incidents are due to some change that was made in the environment. Rather than stop making changes (and therefore improvements!) to your systems, track them in PagerDuty using the Recent Changes feature. Change Events are small updates, in javascript, sent automatically from your tools when a change is made. Capture changes from your code repositories, CI/CD pipelines, and infrasctrure as code tools. ## Learn More **Read more about what Change Events provide** * [We Built an SRE Agent With Memory](https://www.pagerduty.com/blog/ai/we-built-an-sre-agent-with-memory-and-itstransforming-incident-response/) - Change Events provide context for triage. **Watch the product demos and webinars** * Introduction video: [Change Management – Change Events Integrations](https://www.youtube.com/watch?v=jl-hRwF09P0) * Webinar: [Optimizing Response Time with Change Event Data](https://www.pagerduty.com/resources/aiops/webinar/) — Covers how recent changes are a major factor in incident creation and how change event data helps improve MTTR. * [How Change Events show up in the PagerDuty Mobile App](https://www.youtube.com/watch?app=desktop&v=8teLrJgEnQ4) * [Change Management – Change Events Integrations](https://www.youtube.com/watch?v=jl-hRwF09P0) - Capturing Change Events from your code repo and CI/CD pipelines. **Check out the training modules on PDU** * [Event Intelligence 101](https://www.pagerduty.com/resources/aiops/pdu-training/event-intelligence-101/) — Covers noise reduction methods and how to use Change Events + Probable Origin for root-cause analysis. * [Change Events](https://university.pagerduty.com/change-events). **Watch the click-through tutorial** coming soon **Find the product documentation in our Knowledge Base** * [Recent Changes](/ai-automation/aiops/recent-changes) * [List Related Change Events for an Incident](/workflow-actions/pagerduty-incident-management/list-related-change-events-for-an-incident) **Using the API?** Change Events will be sent to via the [Events API](/developer/events-api-v2-overview): * [Sending a Change Event](/developer/send-change-event) **Other Resources** * Read more about Root Cause vs Contributing Factors at [ReliabilityWeb](https://reliabilityweb.com/articles/entry/Cause_vs._Contributing_Factor). * or at [Tulip.co](https://tulip.co/blog/what-is-the-difference-between-a-causal-factor-a-root-cause/) --- URL: https://docs.pagerduty.com/feature-tutorials/event-orchestration # Feature Tutorial: Event Orchestration Defines rules that enrich, route, suppress, or trigger automated actions on inbound events globally or per service before they become incidents. Every event that reaches PagerDuty needs to end up in the right place, with the right context, and sometimes with an automated fix already underway — but hand-managing that logic across dozens of monitoring tools and services quickly turns into an unmanageable pile of one-off rules. Event Orchestration is PagerDuty's decision engine for processing inbound events. It lets teams define rules that enrich, route, suppress, or take automated action on events before they ever become an incident — either globally across every service, or scoped to a single service's own Orchestration. Global Orchestrations apply actions and routing logic across services, so ITOps, SRE, and NOC teams can normalize event data and standardize automation account-wide before it ever reaches a specific service. Service Orchestrations then apply their own rules to events that have been routed to them, giving individual teams fine-grained control over their own event processing. Event Orchestration replaced the older Global and Service Event Rules (rulesets), which reached end-of-life on January 31, 2025; accounts still on the old rulesets can migrate automatically using Push-Button Rule Migration. ## Learn More **Read more about what Event Orchestration provides** * [Reduce MTTR and Take Automation to a New Level with PagerDuty Global Event Orchestration](https://www.pagerduty.com/blog/product/global-event-orchestration-generally-available/) **Watch the product demos and webinars** * [5-Minute Demo: PagerDuty AIOps Automation and Orchestration](https://www.youtube.com/watch?v=9cajmJ_WVM0) **Check out the training modules on PDU** * [(AIOps) Event Orchestration](https://university.pagerduty.com/aiops-event-orchestration) * [AIOps Knowledge Series](https://university.pagerduty.com/path/aiops-knowledge-series) For a broader context on how Event Orchestration fits into noise reduction and automation. **Watch the click-through tutorial** * Coming Soon **Find the product documentation in our Knowledge Base** * [Event Orchestration](/ai-and-automation/aiops/event-orchestration) * [Migrate to Event Orchestration](/ai-and-automation/aiops/migrate-to-event-orchestration) * [Examples of Event Orchestration](/ai-and-automation/aiops/event-orchestration-examples) **Using the API?** Orchestrations are managed via the [Event Orchestrations API](/developer/api/reference#rest/tag/event-orchestrations): * [List Event Orchestrations](/developer/api/reference/rest/event-orchestrations/list-event-orchestrations) **Managing PagerDuty with Terraform?** * [pagerduty_event_orchestration](https://registry.terraform.io/providers/PagerDuty/pagerduty/latest/docs/resources/event_orchestration) * [pagerduty_event_orchestration_global](https://registry.terraform.io/providers/PagerDuty/pagerduty/latest/docs/resources/event_orchestration_global) * [pagerduty_event_orchestration_service](https://registry.terraform.io/providers/PagerDuty/pagerduty/latest/docs/resources/event_orchestration_service) * [pagerduty_event_orchestration_router](https://registry.terraform.io/providers/PagerDuty/pagerduty/latest/docs/resources/event_orchestration_router) Find the full documentation for the PagerDuty Terraform Provider in the [Terraform Registry](https://registry.terraform.io/providers/PagerDuty/pagerduty/latest/docs) --- URL: https://docs.pagerduty.com/feature-tutorials/incident-priority # Feature Tutorial: Incident Priority Assigns a P1-P5 severity label to an incident, separate from urgency, so teams can triage consistently and build reporting around impact. When several incidents fire at once, responders need a fast, consistent way to know which one to tackle first. Without a shared classification scheme, "how bad is this" becomes a fresh judgment call every time, which slows triage and produces inconsistent responses across teams. Incident Priority is a label — P1 through P5, most to least severe — that gets assigned to an incident to indicate its relative importance and impact. It's a separate property from Urgency, which only controls how a responder is notified (high or low); priority and urgency don't influence each other. Priority can be set manually when editing an incident, assigned automatically through Event Orchestration or automation rules based on conditions like the triggering service or alert content, or adjusted mid-incident if its impact grows or shrinks. It's available on Standard and Enterprise plans. Because priority is tracked as its own field, teams can build dashboards, reporting, and SLAs around "how important was this incident" independent of how or whether someone got paged for it. ## Learn More **Read more about what Incident Priority provides** On our blog: [Determining Incident Priority](https://www.pagerduty.com/blog/incident-management-response/determining-incident-priority/) [Using the Incident Priority Matrix](https://www.pagerduty.com/resources/digital-operations/learn/incident-priority-matrix/) **Watch the product demos** **Check out the training modules on PDU** [Incident Management: Systems & Definitions](https://university.pagerduty.com/incident-management-systems-and-definitions/943144) includes Incident Priorities. **Watch the click-through tutorial** [Click through tutorial of using Incident Priorities on YouTube](https://youtu.be/DU5RB64ydXw) **Find the product documentation in our Knowledge Base** [Incident Priority](/incident-management/incidents/incident-priority) **Using the API?** Incident Priorities are included in the [REST API](/developer/api/reference#rest/tag/priorities) List priorities, and set or read the `priority` field on incidents **Managing PagerDuty with Terraform?** Terraform data source: `pagerduty_priority`. Note: priorities are read as reference data, not created through Terraform. Find the full documentation for the PagerDuty Terraform Provider in the [Terraform Registry](https://registry.terraform.io/providers/PagerDuty/pagerduty/latest/docs) --- URL: https://docs.pagerduty.com/feature-tutorials/maintenance-windows # Feature Tutorial: Maintenance Windows Temporarily suspends a service's ability to trigger new incidents during planned work, without auto-resolving incidents already open. When a service goes down for planned work — a deploy, an upgrade, infrastructure maintenance — its monitoring keeps working exactly as designed, which means it keeps firing alerts. Without a way to signal "this downtime is expected," every planned maintenance window turns into a flood of false-positive incidents that eat into responders' attention and erode trust in alerts generally. Maintenance Windows let you temporarily suspend a service's ability to trigger new incidents for a defined start and end time. While a service is in a maintenance window, its integrations are effectively switched off and no new incidents are created. Note that existing open incidents are not automatically resolved when a window begins — they stay open and continue notifying as usual unless resolved manually — and while a service is under maintenance, incidents on it can't be resolved through the Events API. You can create, edit, and review maintenance windows from the Service Directory, which has a dedicated Maintenance Windows tab showing current, upcoming, and past windows, or from the PagerDuty mobile app. Maintenance windows are also fully scriptable through the REST API and Terraform, which is useful for wiring maintenance directly into a deploy pipeline so windows open and close automatically around a release. ## Learn More **Read more about what Maintenance Windows provides** * [Turn on Maintenance. Go Exploring. Break Stuff.](https://www.pagerduty.com/blog/incident-management-response/turn-on-maintenance-go-exploring-break-stuff/) * For our mobile app users: [Introducing Maintenance Windows in PagerDuty Mobile App](https://www.pagerduty.com/blog/devops/new-mobile-maintenance-windows/). **Watch the click-through tutorial** [Click through demo of Maintenance Windows on YouTube](https://youtu.be/W91O8YOgklo) **Find the product documentation in our Knowledge Base** [Maintenance Windows](/incident-management/services/maintenance-windows) **Using the API?** The [endpoint](/developer/api/reference#rest) is: [maintenance_windows](/developer/api/reference#rest/tag/maintenance-windows) **Managing PagerDuty with Terraform?** Terraform resource: `pagerduty_maintenance_window`. Find the full documentation for the PagerDuty Terraform Provider in the [Terraform Registry](https://registry.terraform.io/providers/PagerDuty/pagerduty/latest/docs) --- URL: https://docs.pagerduty.com/feature-tutorials/on-call-readiness-reports # Feature Tutorial: On-Call Readiness Reports Checks whether responders' notification rules meet a chosen readiness profile, and can email people who fall short with fix-it instructions. An escalation policy only works if the people on it can actually be reached — and it's easy for a responder's notification rules to quietly fall out of date, with nobody finding out until a page gets missed at 3am. On-Call Readiness Reports give managers and admins a team-filtered view of whether responders have their notification rules configured well enough to reliably receive a page. Each report is built around a readiness profile — from "Must include phone" up to "Never miss a page," which checks for every contact method plus delays between notification rules — and can optionally email the responders who fall short, with instructions on how to fix their setup. Because responders with well-configured notification rules are less likely to miss a notification, tightening on-call readiness directly helps bring down mean time to acknowledge (MTTA), not just team morale around on-call. On-Call Readiness Reports are available on the Business, Digital Operations (legacy), and Enterprise for Incident Management pricing plans. ## Learn More **Read more about what On-Call Readiness Reports provide** * [What's New: Change Impact Mapping, Visibility, and On-Call Improvements](https://www.pagerduty.com/blog/product-launch-november-2020-change-impact-mapping-visibility/) - the general-availability announcement, including Responder Readiness Templates as a mobile-app extension of the reports. * [New Ops Guide: Best Practices for On-Call Teams](https://www.pagerduty.com/blog/new-ops-guide-on-call-best-practices/) - covers how teams use the reports to set and enforce their own on-call notification standards. **Check out the training modules on PDU** * [Analytics - Improving Performance](https://university.pagerduty.com/analytics-improving-performance) — On-Call Readiness Reports' standalone PDU module has been consolidated into this course, alongside the Operational Maturity Report and User Onboarding Report. **Watch the click-through tutorial** * [On our YouTube Channel](https://youtu.be/_6wvfkLOj4c) **Find the product documentation in our Knowledge Base** * [On-Call Readiness Reports](/analytics/on-call-readiness-reports) * [Notification Rules](/people/notification-rules) **Other Resources** * [PagerDuty Best Practices for On-Call Teams](/ops-guides/going-on-call) - PagerDuty's Ops Guide on introducing on-call to teams new to it, which walks through using On-Call Readiness Reports to set team-wide notification standards. --- URL: https://docs.pagerduty.com/feature-tutorials/post-incident-reviews-jeli # Feature Tutorial: Post-Incident Reviews (Jeli) Imports an incident's PagerDuty timeline and Slack conversation into Jeli's Narrative Builder to document takeaways and track action items. An incident isn't really over when it's resolved — the harder question is what it revealed, and whether the team will be in a better position next time or just relieved this one is done. Jeli Post-Incident Reviews turn incidents into learning opportunities. Jeli automatically imports an incident's PagerDuty timeline and Slack conversation into its Narrative Builder, so investigators can build a blame-aware story of what happened without reconstructing it from scratch. From there, teams can document takeaways, assign action items, and compare patterns across past reviews to spot recurring weak points before they cause another incident. No matter how small an incident seems, a review can surface useful signal — and when reviews are compared or aggregated across an organization, they tend to reveal patterns no single incident would show on its own. Jeli is part of PagerDuty's Incident Management plans (availability and review limits vary by plan). Note that Jeli's UI is scheduled to reach end-of-life on December 22, 2026, with post-incident review capabilities moving natively into the PagerDuty web app; the current Jeli-based experience is what's covered here. ## Learn More **Read more about what Post-Incident Reviews provide** * [Jeli Post-Incident Reviews](https://www.pagerduty.com/platform/jeli/) **Watch the product demos and webinars** * [Cross-Incident Insights](https://www.youtube.com/watch?v=Er457AwI2tQ) **Check out the training modules on PDU** * [Intro to Jeli: Incident Analysis](https://university.pagerduty.com/intro-to-jeli-for-post-incident-reviews/2097444) **Watch the click-through tutorial** * Coming Soon **Find the product documentation in our Knowledge Base** * [Jeli Post-Incident Reviews](/incident-management/after-incident/jeli-post-incident-reviews) * [Get Started with Jeli Post-Incident Reviews](/incident-management/after-incident/get-started-with-jeli-post-incident-reviews) * [Narrative Builder](/incident-management/after-incident/jeli-post-incident-reviews/post-incident-review-report/narrative-builder) **Using the API?** Jeli has its own separate API (distinct from PagerDuty's main REST API) for managing Post-Incident Review and incident data outside the web app: * [Jeli API](/incident-management/after-incident/jeli-settings-and-integrations/jeli-api) **Other Resources** * [Howie: The Post-Incident Guide](/ops-guides/howie-guide) - PagerDuty's detailed, step-by-step guide to running an incident investigation, referenced directly from the Jeli Post-Incident Reviews documentation. * [Postmortems](/ops-guides/postmortem-best-practices) - PagerDuty's companion guide on writing effective, blameless postmortems. --- URL: https://docs.pagerduty.com/feature-tutorials/service-graph # Feature Tutorial: Service Graph and Service Dependencies Maps dependency relationships between services and the resources they consume, so stakeholders can see how one incident affects the whole system. Modern technical architectures are complex, with lots of layers and interdependencies. Because of this complexity, it can be hard for teams to fully understand the impact of an incident on a single service. Service Graph gives your teams a holistic view of your ecosystem without you having to draw it on the whiteboard. Connect services to other resources they consume, and the resources that consume them. Build out the full system diagram using dependency relationships so all of your stakeholders can see how one service impacts the entire product. Business Services place semantic meaning to your ecosystem. Your users don't need to know which backend isn't behaving correctly; they only know which "front door" application they can't access. By creating Business Services and assigning them in the Service Graph, everyone in your organization can quickly see the impact of an incident, no matter how much they know about the architecture of the services. ## Learn More **Read more about what Service Graph provides** * In our [blog](https://www.pagerduty.com/blog/product/introducing-dynamic-service-graph/) **Watch the product demos** * [Technical Service Dependencies and Suggested Service Dependencies](https://www.youtube.com/watch?v=9iFEuwcNovM) * [Suggested Technical Service Dependencies - Impact Tab](https://www.youtube.com/watch?v=vFADPAvn1Y0) **Check out the training modules on PDU** * [Business Services](https://university.pagerduty.com/business-services) * [Service Graph](https://university.pagerduty.com/service-graph) **Watch the click-through tutorial** * [Click through tutorial of Service Graph on YouTube](https://youtu.be/M_g_V90aDlI) * [Click through tutorial of Business Services on YouTube](https://youtu.be/xldcZ6gS8TQ) **Find the product documentation in our Knowledge Base** * [Service Dependencies](/incident-management/services/service-dependencies) * [Service Graph](/incident-management/services/service-graph) **Using the API?** The [endpoints](/developer/api/reference/rest/tags/create-entity-type-by-id-change-tags) are: * [Business Services](/developer/api/reference/rest/business-services/list-business-services) * [Service Dependencies](/developer/api/reference/rest/service-dependencies/create-service-dependency) **Managing PagerDuty with Terraform?** Find the latest PagerDuty Terraform Provider docs [here](https://registry.terraform.io/providers/PagerDuty/pagerduty/latest/docs). The resources are: * pagerduty_business_service * pagerduty_service_dependency Find the full documentation for the PagerDuty Terraform Provider in the [Terraform Registry](https://registry.terraform.io/providers/PagerDuty/pagerduty/latest/docs) **Service Ownership** Interested in how PagerDuty thinks about services and service ownership? Check out our [Service Ownership Ops Guide](/ops-guides/service-ownership). --- URL: https://docs.pagerduty.com/feature-tutorials/status-pages # Feature Tutorial: Status Pages Centralizes incident updates across Internal, External, and Private Status Pages, each scoped to a different audience of stakeholders. Status Pages provide a single source of truth for not only your internal teams, but also your external users and customers during an incident. PagerDuty's Status Pages are a centralized location for your responders to post updates on the current conditions of a live incident. Our Status Pages are split into three functions by audience type: * **Internal Status Pages** are for your internal users only, helpful for providing more in-depth and proprietary information for your stakeholders. * **External Status Pages** allow you to update your users and customers during an incident. * A **Private Status Page** provides updates to authorized users only, ensuring that private data stays private while also keeping key stakeholders informed. These pages can be used for communicating with a mix of internal and external users. Update your status pages directly from PagerDuty using pre-programmed templates, so your message is always correct. Easy updates mean your responders and liasons aren't spending time searching for where to publish and who to inform. Need some best practices for incident communications? Check out [Kat's talk from DevOps Barcelona](https://www.youtube.com/watch?v=-XnyrcRhVQ0) for tips. Your users expect regular updates during incidents. Make it easy to do! ## Learn More **Read more about what Status Pages provide** * [In our product pages](https://www.pagerduty.com/platform/business-ops/status-pages/) * [In our knowledge base](/incident-management/communicate/status-pages-overview) **Watch the product webinars** * [Private Status Pages - The Proactive Communication Your Teams Need](https://www.pagerduty.com/resources/incident-management-response/webinar/private-status-pages-the-proactive-communication/) * [PagerDuty Status Pages: The Single Source of Truth You and Your Customers Need](https://www.pagerduty.com/resources/announcements/webinar/pagerduty-status-pages-the-single-source-of-truth/) * [External Status Pages on the HowTo Happy Hour with Jacky](https://www.youtube.com/watch?v=JKpnvvxqFOo) * [Create Status Update Templates](https://www.youtube.com/watch?v=OggD_u-NiDc) **Check out the training modules on PDU** * [External Status Pages](https://university.pagerduty.com/external-status-pages) * [Stakeholder Communications](https://university.pagerduty.com/stakeholder-communications) **Watch the click-through tutorial** * [Internal Status Pages](https://youtu.be/yl8A_zcbMCI) * [External Status Pages](https://youtu.be/sthXDc2XWVM) * [Status Update Templates](https://youtu.be/CplWKsc37TY) **Find the product documentation in our Knowledge Base** * [Status Pages Overview](/incident-management/communicate/status-pages-overview) * [Internal Status Pages](/incident-management/communicate/internal-status-page) * [External Status Pages](/incident-management/communicate/external-status-page) * [Private Status Page](/incident-management/communicate/external-status-page/private-status-page) **Using the API?** Status Pages have several [endpoints](/developer/api/reference/rest/tags/create-entity-type-by-id-change-tags). Here are some common ones: * [Create a Status Page Post](/developer/api/reference/rest/status-pages/create-status-page-post) * [Update a Status Page Post](/developer/api/reference/rest/status-pages/update-status-page-post) * [Update or Create a Post Postmortem](/developer/api/reference/rest/status-pages/create-or-update-status-page-postmortem) --- URL: https://docs.pagerduty.com/get-started # Getting Started with PagerDuty Welcome to PagerDuty. Use the sidebar to explore setup guides, trial account onboarding, and release notes. - [Overview](https://docs.pagerduty.com/get-started/introduction) — What PagerDuty is, what it requires, and where to learn the fundamentals. - [Setup](https://docs.pagerduty.com/get-started/trial-account-onboarding) — Get a trial account running, log in, and connect your first tools. - [Mobile](https://docs.pagerduty.com/get-started/mobile-app) — Install and configure the PagerDuty app on iOS and Android. - [What's New](https://docs.pagerduty.com/get-started/release-notes) — Platform and mobile release notes. --- URL: https://docs.pagerduty.com/get-started/best-practice-ops-guides # Best Practice Ops Guides A pointer to PagerDuty's library of Ops Guides covering incident response, on-call management, and other operational practices. PagerDuty's Best Practice Ops Guides offer in-depth, practical guidance on incident response, on-call management, and other operational best practices. Visit the [Ops Guides](/ops-guides) library to explore all available guides. --- URL: https://docs.pagerduty.com/get-started/integrating-itsm-tools # Integrate PagerDuty With ITSM Tools Integrate PagerDuty's incident response capabilities with your ITSM tools IT service management (ITSM) tools typically excel at ticketing-related workflows and are used to create and track all customer and service-desk-reported incidents. This being said, ITSM tools don’t usually have effective response capabilities, particularly for critical-impact incidents requiring urgent response. In cases where ITSM systems are used with monitoring tools, it often creates a “swivel-chair” workflow: when a user working with a monitoring tool determines that an incident is occurring, they switch applications and manually create a ticket in the ITSM system. This workflow is cumbersome, error-prone, and provides no direct linkage between operational data and ITSM tickets. Because of this, PagerDuty’s extensive incident response capabilities are commonly used to augment an ITSM tool deployment and improve this workflow. In this configuration, certain incidents in the ITSM tool are sent to PagerDuty, at which point you can use PagerDuty’s [coordinated response](/incident-management/incidents/add-responders) and [stakeholder communication](/incident-management/communicate/communicate-with-stakeholders) features. ## Benefits > **Availability:** Some of the features listed below are only available with our [PagerDuty AIOps](/ai-automation/aiops/overview) add-on, or with [Legacy Event Intelligence](/ai-automation/aiops/legacy-event-intelligence). If you would like to sign up for a trial of PagerDuty AIOps features, please read [PagerDuty AIOps Trials](/ai-automation/aiops/overview#pagerduty-aiops-trials). When you use an integration, you can link PagerDuty incidents and ITSM tickets, and updates to the PagerDuty incident will reflect in the ITSM ticket. This is beneficial in many ways: - **Incident response orchestration**: Any incident that requires attention will be automatically assigned to and notify the appropriate responder according to [scheduled on-call rotations](/incident-management/schedules/schedule-basics). PagerDuty also has [response mobilization](/incident-management/incidents/add-responders), [stakeholder communication](/incident-management/communicate/communicate-with-stakeholders), and other response orchestration capabilities, all of which you can leverage directly from the PagerDuty incident. - **Data linkage**: For review and reporting purposes, the ITSM ticket is linked to the PagerDuty incident, which in turn is linked to the underlying monitoring tool alerts. This linkage makes post-incident analysis, including [postmortems](/incident-management/after-incident/post-incident-reviews), much more efficient. - **Auto-resolution**: If the monitoring tool detects that the underlying issue has recovered, the corresponding PagerDuty incident will receive this update, resolve itself, and then reflect that resolution to the ITSM ticket. - **Streamlined creation**: The right tickets are created in the ITSM system, rather than too many (if monitoring tool alerts are fed directly in) or too few (if manual ticket creation is the norm). PagerDuty offers multiple features to manage event processing and incident creation: - [Deduplicate](/incident-management/incidents/event-management#deduplicate-alerts) multiple events from your monitoring tool into a single incident. - Define [Event Orchestration](/ai-automation/aiops/event-orchestration) rules to route events and apply specific actions such as suppressing alerts or setting a priority automatically. - Reduce noise with various [alert grouping](/ai-automation/aiops/pagerduty-aiops-quickstart-guide#noise-reduction-20-minutes) options. ## Requirements > **Pricing Plans:** - **Ticketing integrations**: Jira Cloud and Jira Server are available on PD Reliability Platform plans. They're also available on the following pricing plans: Professional, Team (legacy), Business, Digital Operations (legacy) and Enterprise for Incident Management. > - **Advanced ITSM integrations**: ServiceNow is available on PD Reliability Platform plans. It's also available on the following pricing plans: Business, Digital Operations (legacy) and Enterprise for Incident Management. > > Please [contact our Sales Team](https://www.pagerduty.com/contact-sales/) if you would like to upgrade to a plan featuring the above integrations. ## Configure PagerDuty Before you can integrate your system, ensure you’ve done the following within your PagerDuty account: - Create a [schedule](/incident-management/schedules/schedule-basics#create-a-schedule) to ensure the right people are notified at the right moment. - Create an [escalation policy](/incident-management/schedules/escalation-policies#create-an-escalation-policy) that uses your desired schedule(s) or users. - Create a [service](/incident-management/services/services-and-integrations#create-a-service). This is where the integration will send events to create incidents. - Depending on the tool you use, you may have the option to create a service during the integration configuration instead. For example, if you are using ServiceNow, you can also [provision](/integrations/servicenow-integration-guide#33-provision-a-pagerduty-service) configuration items or assignment groups as PagerDuty services using the integration. ## Configure Your Integration Many of the ITSM tool integrations synchronize bidirectionally with PagerDuty, updating the originating ITSM ticket with information on escalations, re-assignments, priority changes, state changes, and notes. PagerDuty integrates with a number of ITSM tools, including: - [ServiceNow](/integrations/servicenow-integration-guide) - [Jira Cloud](/integrations/jira-cloud) - [Jira Server](/integrations/jira-server) You can find additional guides in our [Integrations Library](/integrations). Follow the relevant integration guide to connect your tool to PagerDuty. Once the monitoring tool is integrated, events will be sent to PagerDuty where you can route them to services and create an incident, apply event rules, filter out if appropriate, and much more. --- URL: https://docs.pagerduty.com/get-started/introduction # Introduction Overview of the PagerDuty platform and where to get help ## What is PagerDuty? Through its SaaS-based platform, PagerDuty empowers developers, DevOps, ITOps, and business leaders to prevent and resolve incidents and deliver an exceptional customer experience. When revenue and brand reputation depend on customer satisfaction, PagerDuty equips your organization with the insight to proactively manage events across your IT environments. PagerDuty delivers the right data to the right people in real time. The platform supports this through hundreds of native integrations, on-call scheduling, escalation policies, AIOps, business-wide response orchestration, and analytics. **Video: PagerDuty Introduction** [PagerDuty Introduction](https://www.youtube.com/watch?v=jI17a6Gqti0) ## Get Help **Contact Technical Support** }> [Contact our Technical Support team for help.](https://www.pagerduty.com/support/) **PagerDuty MCP Server** }> [Read the PagerDuty MCP Server documentation](/ai-automation/advance/pagerduty-mcp-server) for setup steps and more information. **PagerDuty University** }> [Take up on-demand eLearning courses](https://university.pagerduty.com/), sign up for live webinar trainings, or get certified. **PagerDuty Commons** }> [Connect with our PagerDuty user community](https://community.pagerduty.com/) and find innovative ways to amplify PagerDuty's capabilities. **Status Page** }> [Subscribe to PagerDuty's status page](https://status.pagerduty.com/posts/dashboard) for the most up-to-date information about incidents and affected product areas, and get notified about disruptions. **What's New** }> [Check out what's new with PagerDuty](https://www.pagerduty.com/whats-new/) and keep up to date with all of the latest features and capabilities. **PagerDuty YouTube Channel** }> [The official PagerDuty YouTube channel](https://www.youtube.com/@Pagerduty) for incident management insights, technical tutorials, product updates, and best practices. **API Reference** }> [Learn how to use PagerDuty APIs](/developer/api/reference) to manage incidents, account settings, and more. **Integrations Library** }> [Discover integrations](/integrations) that connect PagerDuty with your favorite tools — to automate incident response, streamline communication, and resolve issues faster. **Twitter/X** }> [Follow @pagerduty](https://x.com/pagerduty) and discover how PagerDuty can help you do your job better. --- URL: https://docs.pagerduty.com/get-started/log-in-to-pagerduty # Log In to PagerDuty Sign in to PagerDuty using email and password or single sign-on, including first-time SSO login from an identity provider's email. You can log in to PagerDuty in two ways. Depending on your account configuration, one option may not be available: - [Log In With Email and Password](#log-in-with-email-and-password) - [Log In With SSO](#log-in-with-sso) ## Log In With Email and Password 1. In a [supported web browser](/get-started/system-requirements#web-app), navigate to [identity.pagerduty.com](https://identity.pagerduty.com) or open the PagerDuty mobile app and click **Sign In**. 2. If prompted, click **Continue** in the confirmation modal. 3. Enter the email address associated with your PagerDuty account and click **Next**. 4. Enter your password and click **Sign In**. - If your email address connects to more than one PagerDuty account, the web app or mobile app displays a list of accounts. Select the account you want to log in to. > **Rate Limiting:** If you attempt to log in multiple times within a short period, you may encounter an error message. PagerDuty enforces rate limits on login attempts to protect accounts. Wait a few minutes before attempting to log in again. ## Log In With SSO > **SSO Troubleshooting:** If you do not see **Sign In with Single Sign-On** after entering your email, or if you cannot log in to your account, contact your Account Owner to [troubleshoot](/account-admin/sso#faq) and verify your SSO configuration. ### Log In Via Welcome Email When your administrator configures SSO, you receive an email from your identity provider notifying you that you can access your account via SSO. Log in for the first time by clicking the link in the welcome email. The following example shows an Okta welcome email. Your email details vary based on your identity provider: 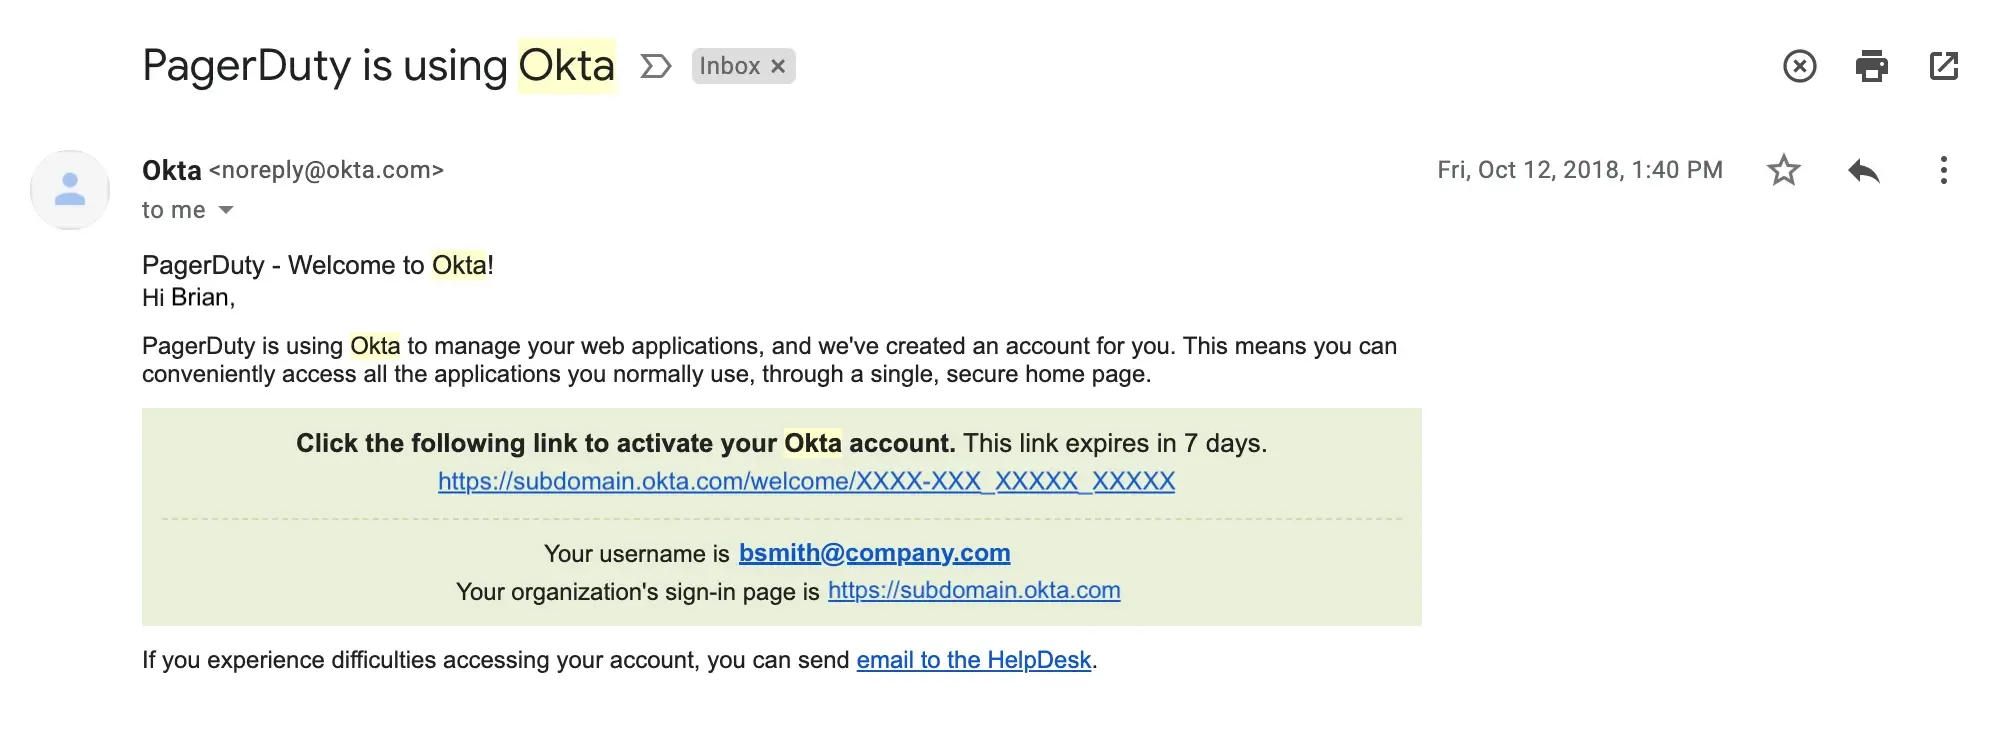 *Okta Welcome Email* ### Log In Via the Web or Mobile App 1. In a [supported web browser](/get-started/system-requirements#web-app), navigate to your PagerDuty account login URL (for example, `https://subdomain.pagerduty.com` or `https://identity.pagerduty.com`) or open the PagerDuty mobile app and click **Sign In**. 2. If prompted, click **Continue** in the confirmation modal. 3. Enter the email address associated with your PagerDuty account and click **Next**. 4. Click **Sign In with Single Sign-On**. 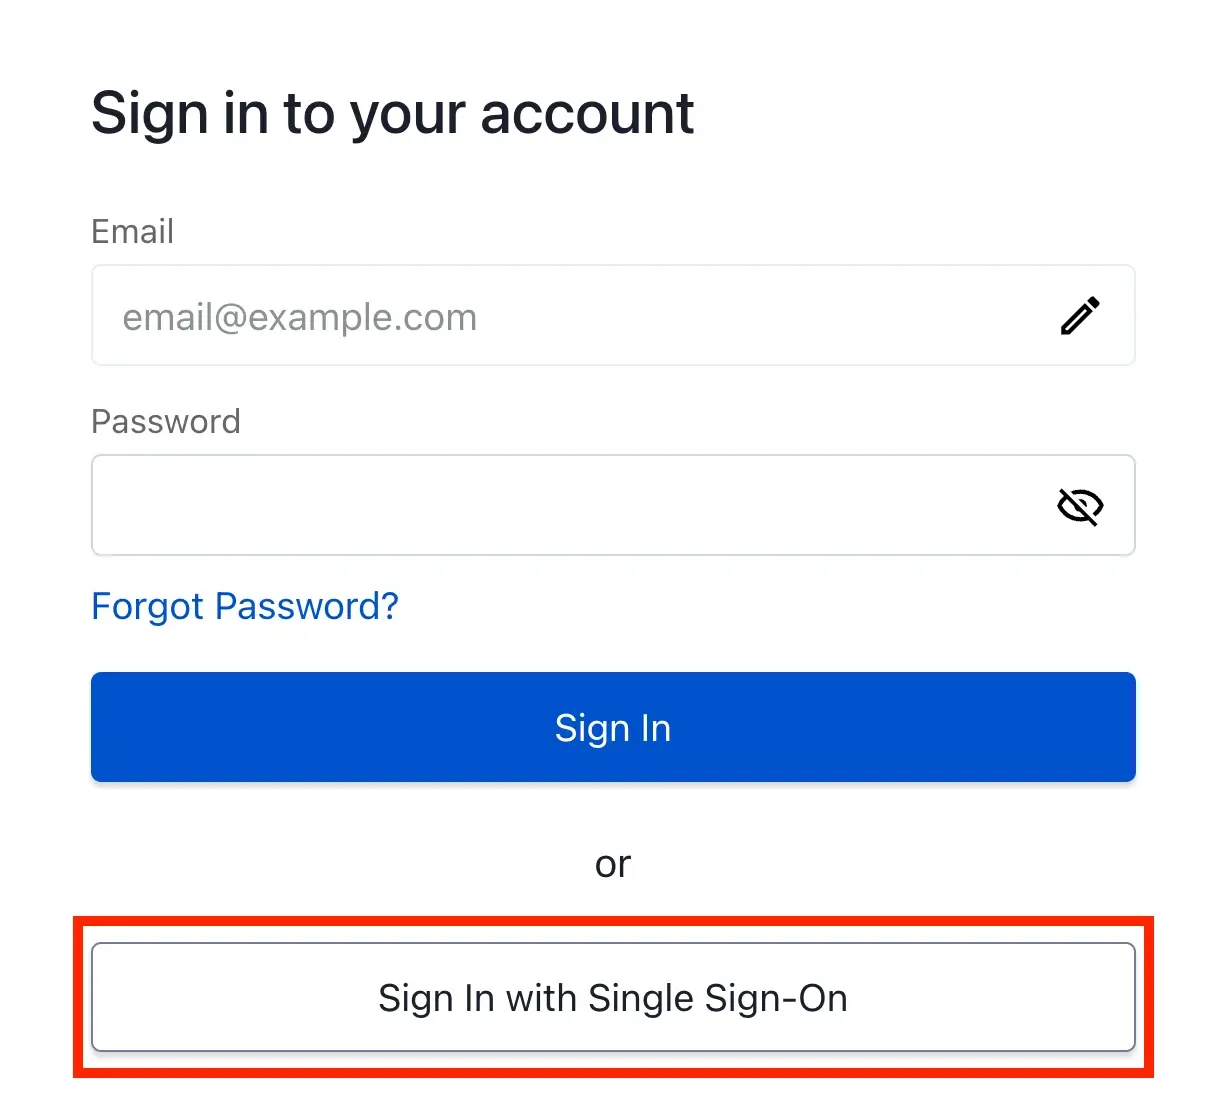 *Sign In with Single Sign-On* 5. If prompted, enter your account details: | Field | Value | | :---------------------------------------- | :-------------------------------------- | | **[Subdomain](/account-admin/account-subdomains)** | Enter your PagerDuty account subdomain. | | **[Service Region](/get-started/service-regions)** | Select **United States** or **Europe**. | 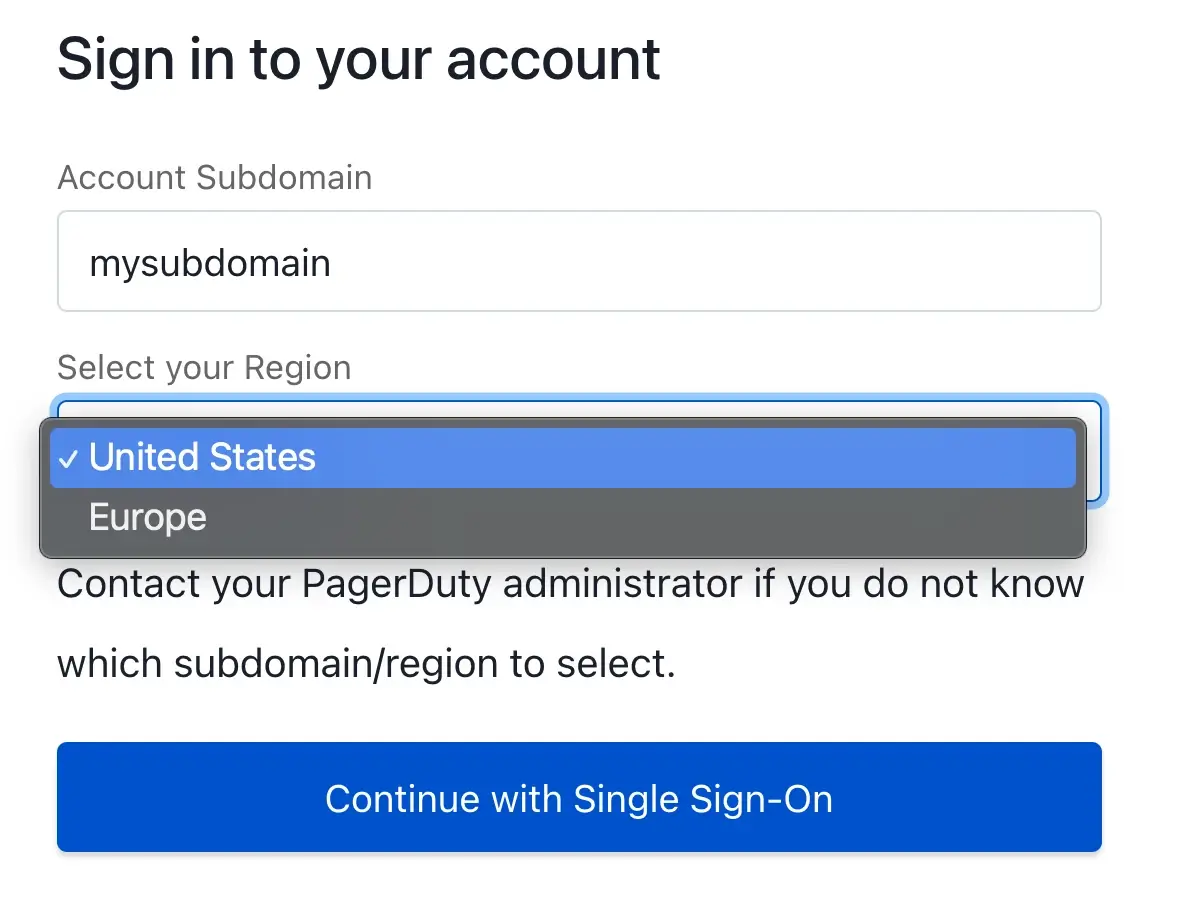 *Enter Your Subdomain and Select Your Service Region* 6. Click **Continue with Single Sign-On**. 7. If you are already logged in to your SSO provider on your device, the system automatically logs you in to your PagerDuty account. If you are not already logged in to your SSO provider, the web app redirects you to your SSO provider login page, where you log in to access PagerDuty. > **Safari Content Blockers:** On iOS devices, content blockers in Safari can sometimes prevent the SSO login button from rendering on the login screen. To administer this setting, navigate to your device's **Settings** → **Safari** → **Extensions**. ### Log In Via Identity Provider > **Identity Provider:** Most SSO configurations allow you to log in using your identity provider. The UI varies depending on the service you use. The steps are similar to the following section, but refer to your identity provider documentation for further assistance. 1. Log in to your identity provider (for example, Okta) and search for **PagerDuty** in your connected apps. 2. Click **PagerDuty** to automatically log in to your PagerDuty account.  *Log in to PagerDuty Using Okta* ## FAQ **Do I need to select my service region?** If you log in with an email and password, you do not need to specify whether your account is based in the Europe or United States service region. The login system works globally and logs you in to the appropriate account depending on the credentials you enter. If you use the same email and password combination for accounts in both regions, the system displays a list of accounts that indicates the region for each account. **I use Single Sign-On. Why do I not see the option to enter my email and password, too?** Your PagerDuty administrator configured the account to allow login only via single sign-on. Contact your PagerDuty administrator if you want to use an email and password to log in to PagerDuty. **I have multiple accounts with the same email. Why do I not see a list of accounts?** You see a list of accounts when they use the exact same email and password combination. If you use different passwords but the same email address for different accounts, the mobile app or web app does not present a list of accounts. **Can I use a password manager to log in?** Yes. Testing confirms that several password managers successfully handle your login credentials, even if you have multiple PagerDuty accounts. If you use a unique password for each PagerDuty account, the mobile app or web app successfully logs you in to the appropriate account. **If I have multiple PagerDuty accounts, should I use the same password for each?** No. PagerDuty does not recommend using the same password across multiple accounts for security reasons, though certain configurations can require it. **What are the differences if I log in via SSO at subdomain.pagerduty.com vs. identity.pagerduty.com?** The flowcharts in the following section show the experience based on where you start: - [Log In With the Account-Specific Subdomain](#log-in-with-the-account-specific-subdomain) - [Log In From identity.pagerduty.com](#log-in-from-identitypagerdutycom) ### Log In With the Account-Specific Subdomain The SSO login path beginning at an account-specific URL (for example, `subdomain.pagerduty.com` or `subdomain.eu.pagerduty.com`) is streamlined. You see **Sign in With SSO** on the first screen. You follow this path when logging in:  *SSO Login Flow From the Account-Specific Login Page* ### Log In From identity.pagerduty.com `identity.pagerduty.com` is a general login page that allows you to authenticate with PagerDuty and log in to your account. When starting from this login URL, note the following details: - If you log in via `identity.pagerduty.com`, the web app or mobile app can display options to log in with SSO and an email and password. This indicates your email address connects to multiple accounts where at least one account uses SSO and another uses an email and password. - For security, if you log in to an SSO account using this method, you must specify the subdomain you want to log in to.  *SSO Login Flow From identity.pagerduty.com* **How do I log in to the mobile app on Android 14?** If you use Android 14, install PagerDuty version 7.39 or higher to log in. You can download the latest version of the PagerDuty mobile app on [Google Play](https://play.google.com/store/apps/details?id=com.pagerduty.android\&hl=en_US\&gl=US). --- URL: https://docs.pagerduty.com/get-started/mdm-setup-browsers # MDM Setup and Supported Web Browsers Configure Mobile Device Management so the PagerDuty mobile app opens in a specific supported browser on iOS or Android devices. Our mobile app uses Safari as the default browser for iOS and Chrome as the default browser for Android. Using Mobile Device Management (MDM) setup allows users to choose which browser they would like to log in with. We use the standard [AppConfig](https://developer.apple.com/library/archive/samplecode/sc2279/Introduction/Intro.html) for iOS and [ManagedConfigurations](https://developer.android.com/work/managed-configurations) for Android. You can configure your MDM so that your device uses a different browser. In your MDM, you will need to add a `loginBrowserScheme` key with a **Scheme** value listed below: ## Supported Browsers ### iOS | Browser | Scheme | | :--------------------------------------------------------------------------------------------------- | :--------------------- | | [MaaS360 Browser](https://apps.apple.com/us/app/maas360-browser/id591773034) | `maas360browsers` | | [Web - Workspace One ](https://apps.apple.com/us/app/web-workspace-one/id525891468) | `awbfs` | | [Microsoft Edge: Web Browser](https://apps.apple.com/us/app/microsoft-edge-web-browser/id1288723196) | `microsoft-edge-https` | | [MobileIron Web@Work](https://apps.apple.com/ca/app/mobileiron-web-work/id596170970) | `mibrowsersf` | | [Google Chrome](https://apps.apple.com/us/app/google-chrome/id535886823) | `googlechromes` | ### Android | Browser | Scheme | | :-------------------------------------------------------------------------------------------------------------------------- | :--------------------- | | [MaaS360 Browser](https://play.google.com/store/apps/details?id=com.fiberlink.maas360.android.securebrowser&hl=en_CA&gl=US) | `maas360browsers` | | [Web - Workspace ONE](https://play.google.com/store/apps/details?id=com.airwatch.browser&hl=en_CA&gl=US) | `awbfs` | | [Microsoft Edge](https://play.google.com/store/apps/details?id=com.microsoft.emmx&hl=en_CA&gl=US) | `microsoft-edge-https` | ## XML for EMM Services Per the [AppConfig.org](https://www.appconfig.org/assets/images/appconfig-media/appconfig-content/uploads/2017/01/ManagedAppConfig.pdf) guidelines, below is the XML code to use for your Enterprise Mobility Management (EMM) service. We recommend copying and pasting this code into a text editor and saving it as an XML file. ### iOS ```xml
 ](https://apps.apple.com/us/app/pagerduty/id594039512) [
 ](https://play.google.com/store/apps/details?id=com.pagerduty.android&hl=en_US&pcampaignid=MKT-Other-global-all-co-prtnr-py-PartBadge-Mar2515-1)
> **Supported Operating Systems and Configuration:** The PagerDuty mobile app is supported on devices running iOS 17 and higher, or Android 12 and higher. You do not have access to the latest features if your device does not meet minimum requirements.
>
> **Rooted devices are not supported:**
>
> PagerDuty strengthens security by discontinuing support for the PagerDuty mobile app on rooted and jailbroken devices. Additionally, PagerDuty does not support emulators and tampered versions of the app. This update ensures the integrity of services and aligns with FedRAMP compliance.
> **Minimum OS Requirement Change:** To keep the mobile app secure and up to date, PagerDuty is introducing new minimum operating system requirements. Starting November 16, 2026, new versions of the mobile app require iOS 18 or higher, or Android 13 or higher. Upgrade your device before this date to continue receiving mobile app updates.
## Log In to the Mobile App
You log in to the mobile app by entering the email address associated with your PagerDuty user account. The app then guides you through the rest of the login process and presents you with the most relevant options. Read [Log In to PagerDuty](/get-started/log-in-to-pagerduty) for more information.
### Log In to Multiple PagerDuty Accounts in the Mobile App
1. After you log in to one PagerDuty account, you can add other accounts to the app by navigating to **More** → **User Icon**.
2. Tap **Plus Icon ()** at the top-right (iOS) or bottom-right (Android). If prompted, select the **Environment** you want to open the account in.
3. [Log in to the additional account](/get-started/log-in-to-pagerduty#log-in-via-the-web-or-mobile-app). After you log in, you can see it in the list of accounts at **More** → **User Icon**.
> **PagerDuty for Intune:** PagerDuty for Intune users cannot log in to multiple PagerDuty accounts in the mobile app.
#### Switch PagerDuty Accounts in the Mobile App
1. After you log in to multiple PagerDuty accounts in the mobile app, you can find each account by navigating to **More** → **User Icon**.
2. To switch to another account, navigate to **More** → **User Icon** and tap the desired account.
#### Remove a PagerDuty Account in the Mobile App
##### Remove a PagerDuty Account (iOS)
To remove an account from the iOS mobile app:
1. Navigate to **More** → **User Icon**.
2. Tap **Edit**, then tap **Minus Circle Icon ()** next to the account you want to remove.
3. Tap **Delete**, then **Remove** to confirm your selection.
##### Remove a PagerDuty Account (Android)
To remove an account from the Android mobile app:
1. Navigate to **More** → **User Icon**.
2. Tap **Ellipsis Icon ()** to the right of the account you want to remove, and select **Remove this Account**.
3. Tap **Remove** to confirm your selection.
## Mobile App Walkthrough
Menu options are located at the bottom of the screen:
- **Home**
- **Incidents**
- **My Shifts**
- **Services**
- **More**
- **Escalation Policies**
- **Resolved Incidents**
- **Schedules**
- **Status Dashboard**
- **Teams**
- **Users**
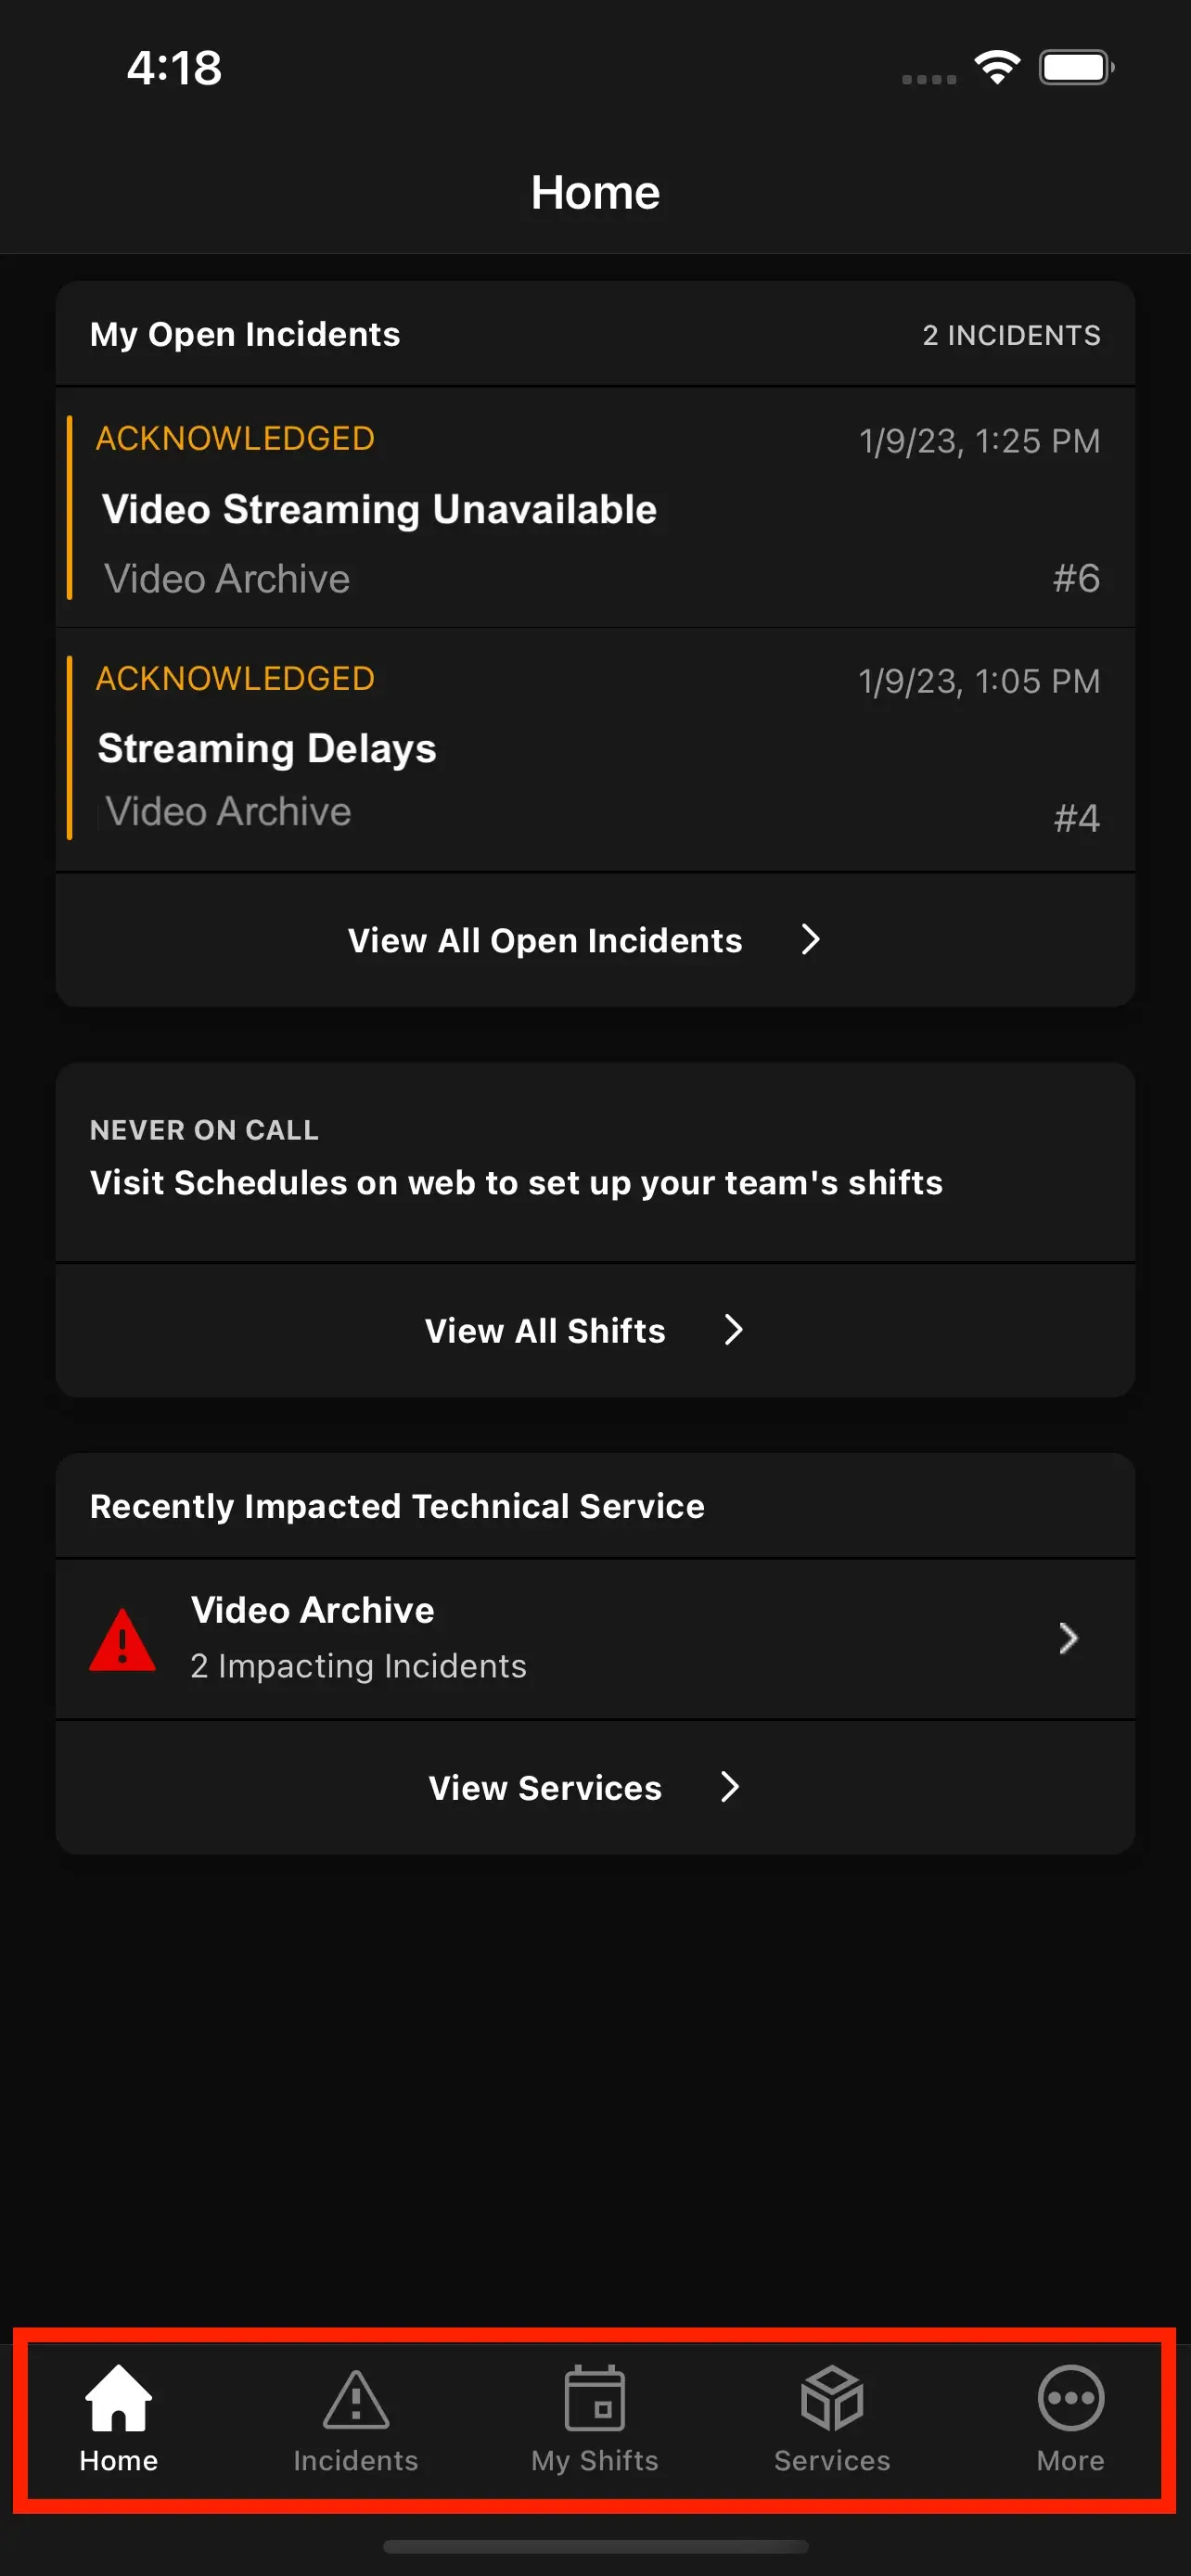
*Mobile app overview*
The app remembers which tab you were on when you navigate away. For example, if you were on the **Incidents** tab viewing an incident **Timeline** and then you switched to the **Services** tab, when you return to the **Incidents** tab you still view that incident's **Timeline**.
### Home Screen
The mobile Home screen highlights top open incidents, and displays on-call shifts and service information, which broadens awareness and streamlines navigation to other important, non-incident information. Read [Mobile Home Screen](/get-started/mobile-app/mobile-home-screen) for more information.
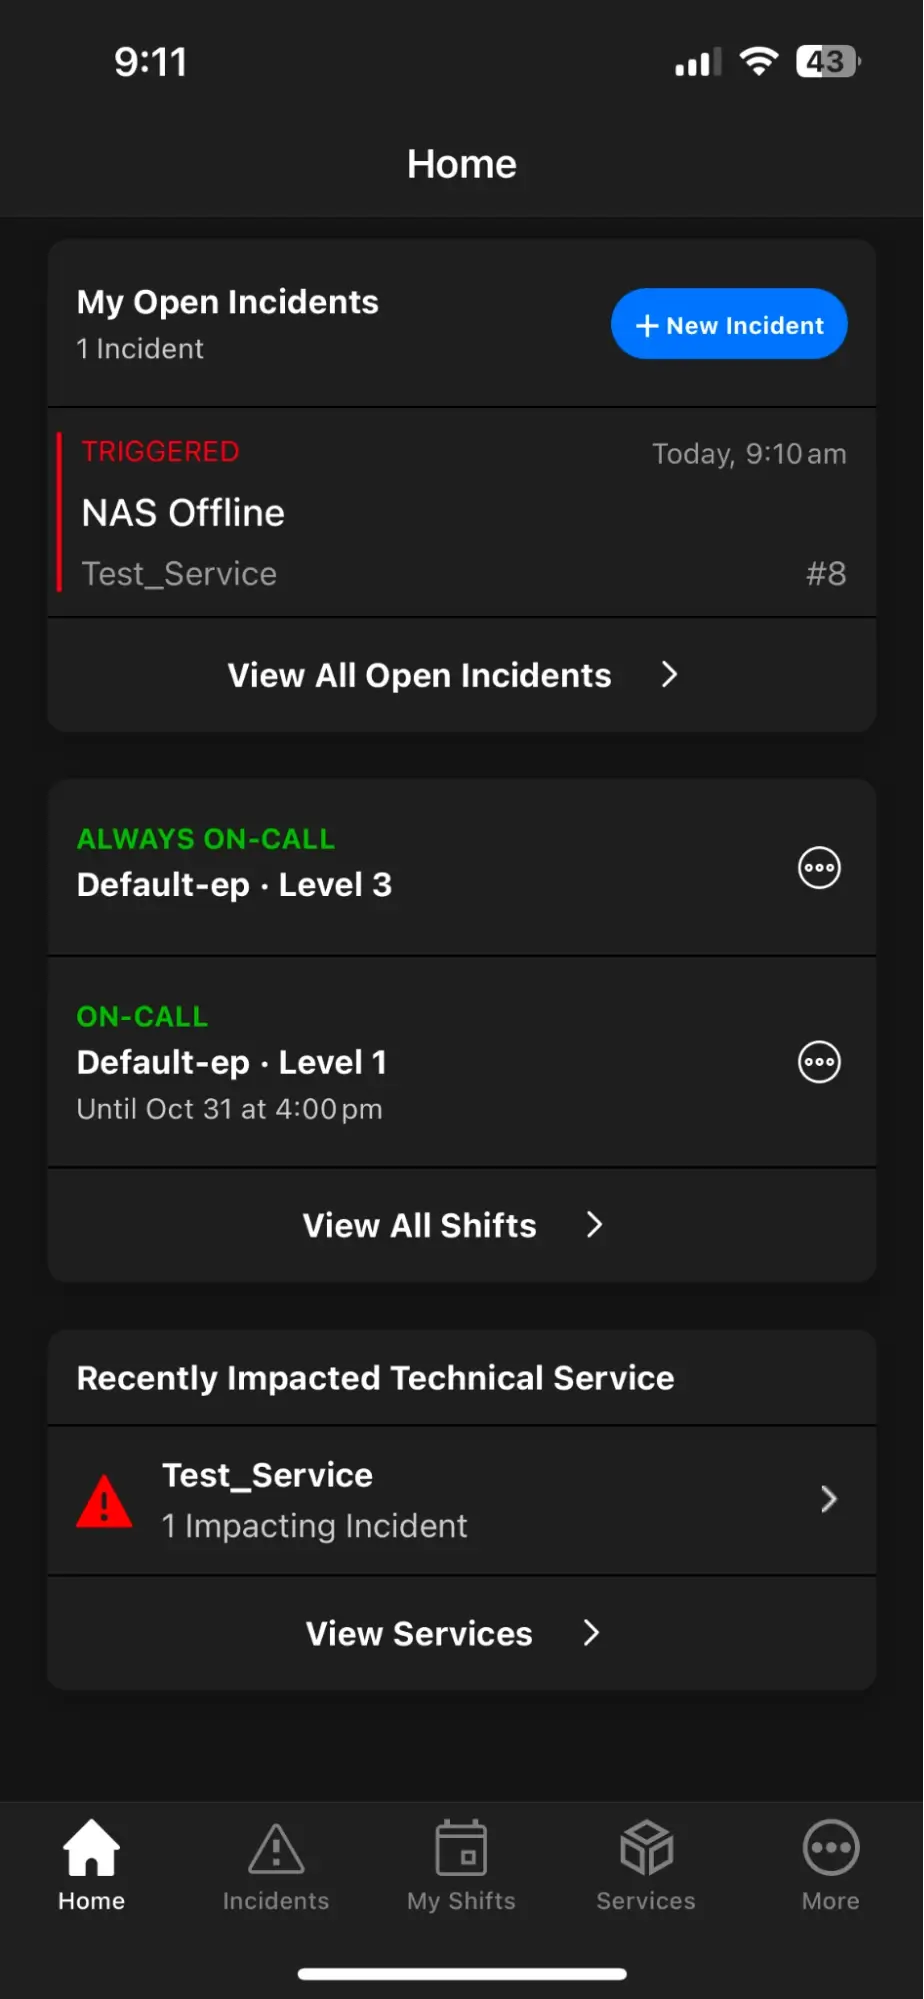
*Mobile app home screen*
### Open Incidents Screen
To view open incidents, select **Incidents** from the bottom navigation.
The **Mine** tab shows all triggered and acknowledged incidents assigned to you. The **All** tab shows all triggered and acknowledged incidents in the account. If you have a Responder role or higher, you also see the **My Teams** tab, which shows all incidents assigned to your teams.
This screen remembers your tab selection (such as **Mine**, **My Teams**, or **All**), so you can access relevant incidents faster when navigating here from other screens.
#### Sort Incidents
You can sort open incidents by tapping **Sort By \[x]** and selecting **Urgency**, **Priority**, or **Recent**.
If you sort by urgency, high-urgency incidents display at the top of the queue and low-urgency incidents display at the bottom, regardless of their status (such as triggered or acknowledged).
### Trigger or Declare an Incident
To trigger an incident in the mobile app:
#### iOS
1. Navigate to **Incidents** at the bottom of the screen, tap **Ellipsis Icon ()** in the top-right, and select **New Incident**.
*Incident actions*
2. Complete the following fields on the screen:
| Field | Value |
| :--------------------------- | :--------------------------------------------------------------------------------------------------------------------------------------------------- |
| **Name** | A meaningful name for the incident. |
| **Description** _(optional)_ | A meaningful description of the incident. |
| **Incident Type** | Select an incident type. |
| **Service** | Select the affected service. |
| **Assign to** _(optional)_ | You can select an escalation policy or user other than the default escalation policy of the service. This overrides who the incident is assigned to. |
| **Priority** _(optional)_ | Add an [incident priority](/incident-management/incidents/incident-priority), if needed. |
3. Tap **Create** in the upper-right to trigger the incident.
#### Android
1. Navigate to **Incidents** at the bottom of the screen, tap **Vertical Ellipsis Icon ()** in the top-right, and select **New Incident**.
*Open incidents*
2. Complete the following fields on the screen:
| Field | Value |
| :--------------------------- | :--------------------------------------------------------------------------------------------------------------------------------------------------- |
| **Title** | A meaningful name for the incident. |
| **Incident Type** | Select an incident type. |
| **Impacted Service** | Select the affected service. |
| **Description** _(optional)_ | A meaningful description of the incident. |
| **Assign to** _(optional)_ | You can select an escalation policy or user other than the default escalation policy of the service. This overrides who the incident is assigned to. |
| **Priority** _(optional)_ | Add an [incident priority](/incident-management/incidents/incident-priority), if needed. |
3. Tap **Create Incident**.
### Respond to Incidents in the Mobile App
Tap **Incidents** in the bottom navigation to see a list of all open incidents.
*Incidents button*
#### Acknowledge an Incident
If a triggered incident is assigned to you, the banner at the top turns red. Your incidents are under the **Mine** tab on the **Open Incidents** screen. There are three ways to acknowledge an incident:
- Swipe left on the incident and tap **Ack**.
- Tap the incident and tap the **Ack** button at the bottom of the incident details page.
- Acknowledge directly from a push notification by long pressing and tapping **Ack** (iOS). PagerDuty push notifications provide the incident number, service, and incident description.
After you acknowledge the incident, the banner turns yellow.
#### Snooze an Incident
There are two ways to snooze an incident in the mobile app:
- After you acknowledge an incident in the incident details page, the **Ack** button becomes a **Snooze** button.
- You can also [snooze](/incident-management/incidents/edit-incidents#snooze-an-incident) an incident by swiping left on an acknowledged incident.
#### Resolve an Incident
##### Resolve an Incident (iOS)
There are two ways to resolve an incident:
- Tap an incident to enter the details screen and tap **Resolve** at the bottom of the screen.
- On the Open Incidents page, swipe left on an incident and tap **Resolve**.
##### Resolve an Incident (Android)
There are two ways to resolve an incident:
- Tap an incident to enter the details screen and tap **Resolve** at the bottom of the screen.
- On the Open Incidents page, swipe right on an incident.
#### Incident Details and Other Actions
Tap an incident to enter the incident details screen. The incident details screen contains incident information, a timeline, and a status updates section.
##### Triage Tab
Tap the **Triage** tab to view the details of the incident and execute different PagerDuty actions:
- **Automation Actions**: [Run an Automation Action](/ai-automation/automation/automation-actions#run-an-action-in-the-mobile-app).
- **Run a Workflow**: [Run an incident workflow](/ai-automation/automation/incident-workflows#manually-run-a-workflow-via-web-or-mobile-app).
- **Add Priority**: [Add a priority level to the incident](/incident-management/incidents/incident-priority#prioritize-an-incident).
- **Custom Incident Actions**: If your account has any [custom incident actions](/integrations/custom-incident-actions) configured, you see those specific actions as buttons.
- **Add Note**: [Add a note to the incident](/incident-management/incidents/edit-incidents#add-a-note-to-an-incident).
- **Status Update**: [Post a status update](/incident-management/communicate/communicate-with-stakeholders#status-updates).
- **Edit Title**: [Edit the incident’s title](/incident-management/incidents/edit-incidents#edit-incident-title).
- **Change Service**: [Reassign the incident's service](/incident-management/incidents/edit-incidents#reassign-an-incidents-service).
- **Change to \[Urgency Level]**: [Change the urgency level](/incident-management/incidents/edit-incidents#edit-incident-urgency) from high to low or vice versa.
- **Add Responder**: [Add responder(s) to the incident](/incident-management/incidents/add-responders#add-responders-to-an-incident).
- **Reassign**: [Reassign](/incident-management/incidents/reassign-incidents#reassign-an-incident) the incident to a different escalation policy or user.
- **Escalate**: Escalate the incident to a different user on the escalation policy.
##### Overview Tab
Tap the **Overview** tab to view the following incident details:
- **Impacted Service**: The service impacted by this incident. Tap the service name to see the details for the service.
- **Responders**: Responders currently responding to the incident. You can take the following actions:
- **View Responder Details**: Tap a responder’s name to view more details.
- **Escalate**: Escalate the incident to the next responder on the escalation policy.
- **Add Responder**: Add more responders to the incident.
- **Reassign**: Reassign the incident to a different escalation policy or user.
- **Conference Bridge**: If your account has a conference bridge configured, you see options to join the bridge and the meeting link.
- **Latest Status Update**: Status updates for the incident.
- **\[#] Subscribers**: Users who are subscribed to the incident. To send a status update to subscribers, tap **Post Status Update**, enter your status update, and tap **Paper Plane Icon ()** in the upper right.
- **Timeline**: An abridged incident timeline with the latest updates. Tap **View Timeline** to see the entire incident timeline.
- **Triggered Alerts**: Alerts for the incident.
- **Past Incidents**: Past incidents related to the current incident.
##### All Actions Button
The **All Actions** button provides quick and easy access to the actions available in the [Triage](#triage-tab) tab and the following incident actions:
- **Snooze**: [Snooze](/incident-management/incidents/edit-incidents#snooze-an-incident) the incident.
- **Unacknowledge**: [Unacknowledge](/incident-management/incidents/overview#unacknowledge-an-incident) the incident if you previously acknowledged it.
- **Subscribe**: [Subscribe](/incident-management/services/business-services/subscription#subscribe-to-incidents) to the incident.
#### Custom Fields
The Custom Fields feature allows you to enrich PagerDuty incidents with critical and helpful metadata throughout the incident lifecycle. Read [Custom Fields on Incidents](/incident-management/incidents/custom-fields-on-incidents#view-custom-fields-in-the-mobile-app) for more information.
#### Related Incidents
> **Availability:** The Related Incidents feature is currently available with the [PagerDuty AIOps](/ai-automation/aiops/overview) add-on. If you want to sign up for a trial of this and other PagerDuty AIOps features, read [PagerDuty AIOps Trials](/ai-automation/aiops/overview#pagerduty-aiops-trials).
On the incident details screen, you can select the blue **Related Incidents** button to review suggested incidents that are impacting other responders and PagerDuty services.
You can select an incident under the Related Incidents list, which opens the corresponding incident details screen. Tap **Left Chevron Icon ()** to return to the original incident.
*Related incidents*
#### Resolved Incidents Screen
Navigate to **More** → **Resolved Incidents** to view a list of all resolved incidents. Tap an incident to view its details. Select the **My Teams** tab to see incidents related to your teams, or select the **All** tab for all incidents across the entire account.
### Service Directory Screen
Select **Services** in the bottom navigation to view the Service Directory. The Service Directory is a searchable, high-level view of all PagerDuty services in your organization and their corresponding owners.
To search the Service Directory screen, tap **Search Icon ()** in the upper right and search by service name.
To filter services, select the **My Teams** tab for services related to your teams, or the **All** tab for all services account-wide.
Tap a service to view its details:
- **Incidents**: Open incidents occurring on the service.
- **On Call Now**: Responders who are currently on call on the service’s escalation policy.
- **Team**: The team associated with the service.
- **Description**: The description for the service.
- **Escalation Policy**: The escalation policy associated with the service.
- **Dependencies**: Services that have [dependencies](/incident-management/services/service-profile#service-dependencies-tab) on the current service in the **Uses** and **Used By** directions.
- **Change Events**: Recent [change events](/ai-automation/aiops/recent-changes) related to the service.
### Users Screen
Navigate to **More** → **Users** to view a list of users and their login email addresses. Select a user to show their contact methods and escalation policies where they are on call.
To search for a user, tap **Search Icon ()** in the top right and search for their name or email address. You can email, call, or SMS a user from your device by tapping a user's email address or phone number.
On Android, tap **Vertical Ellipsis Icon ()** to **Add to Contacts** or **Edit Schedule Color**.
*Contact screen*
### Schedules Screen
Navigate to **More** → **Schedules** to view a list of schedules in your account. Tap a schedule to view its details. On the details screen, you see a calendar and a list of upcoming on-call shifts. Move forward and backward in the schedule using **Right Chevron Icon ()** and **Left Chevron Icon ()**, and tap a date to view who is on call for that day. Tap **Calendar Icon ()** in the top-right to return to the current date.
To search schedules, tap **Search Icon ()** in the upper-right and search by schedule name.
To filter schedules, you can select the **My Teams** tab for schedules related to your teams, or the **All** tab for all schedules account-wide.
#### Schedule Overrides
##### Schedule Overrides (iOS)
1. To schedule an override, navigate to **More** → **Schedules** and select your desired schedule.
2. In the list of shifts, tap the **shift** you want to override.
3. By default, the app sets you as the user overriding the shift. If you want another user to override the shift, tap your **name** and select another user from the list.
- **Note**: You can enter a search term on the user list screen to limit results.
4. _Optional_: If needed, tap **Starts** or **Ends** to adjust the duration of the override. You can also tap **Duration** to select a predetermined override length:
- **one hour**
- **six hours**
- **12 hours**
- **24 hours**
- **Until the rotation ends**
5. Tap **Override** in the top-right. Tap **Override** again in the confirmation modal.
##### Schedule Overrides (Android)
1. To schedule an override, navigate to **More** → **Schedules** and select your desired schedule.
2. In the list of shifts, tap the **shift** you want to override.
3. By default, the app sets you as the user overriding the shift. If you want another user to override the shift, tap your **name**, select another user from the list, and tap **Done** in the top-right.
- **Note**: You can tap **Search Icon ()** and enter a search term on the **Select User** screen to limit results.
4. _Optional_: If needed, tap the start date, end date, start time, or end time to adjust the duration of the override. You can also tap the **Override Length** to select a predetermined override duration:
- **one hour**
- **six hours**
- **12 hours**
- **24 hours**
- **Until the rotation ends**
5. Tap **Override** in the top-right. Tap **Override** again in the confirmation modal.
### Escalation Policies Screen
Navigate to **More** → **Escalation Policies** to view the escalation policies for your account. Selecting an escalation policy shows who is on call at each level. Select a user to see their contact info and schedule details.
### My On-Call Shifts Screen
Tap **My Shifts** in the bottom navigation to view My On-Call Shifts. My On-Call Shifts displays escalation policies that you are on call for and your upcoming shifts for the next month.
To view more details about the escalation policy, tap your shift and tap **Go to Escalation Policy**.
### Status Dashboard Screen
Navigate to **More** → **Status Dashboard** to view the incident status of all business services in your account. If your account has custom dashboards configured, you can switch dashboard views by tapping **Chevron Circle Down Icon ()** in the top-right and selecting your preferred dashboard.
To view more details about a business service, tap its **name**. On the details screen, you can view supporting services. To view more details about a supporting service, tap its **name**.
To subscribe to a business service, tap the name of the business service and tap **RSS Icon ()** in the top right.
### Settings Screen
Navigate to **More** → **Settings Icon ()** in the top right to view the Settings screen. Here you can select a custom push notification sound and sounds for high- and low-urgency notifications.
For more information on notification configuration options, see [Mobile App Settings](/get-started/mobile-app-settings).
*Settings*
## Mobile App Permissions
New downloads of the mobile app ask for permission to access your contacts the first time you log in. Existing app users can access this on the mobile app's **Settings** screen under **Automatic Contact Card Management**.
We request access to your contacts so that the app can import the [PagerDuty vCard](/incident-management/notifications/notification-phone-numbers#pagerduty-vcard), which lets you know that a phone or SMS notification is from PagerDuty. The vCard is automatically kept up to date whenever a number is added to or removed from the vCard.
- We do not send messages, calls, or notifications to any contact within your contacts list.
- We do not use this permission for marketing, data gathering, or research purposes.
If you deny this permission, the app still functions as intended. However, you can miss calls if a PagerDuty phone number is blocked or marked as spam by your provider. For iOS users, installing the vCard allows you to enable an override for Do Not Disturb and ensures silencing unknown numbers does not affect calls from PagerDuty. You can also manually download the vCard from our Knowledge Base; however, you must periodically check to see if it has been updated, and if so, you must download it again.
*Access contacts screen*
## Advanced Mobile Security
Add an additional layer of mobile app security by setting up Advanced Mobile Security on your PagerDuty account.
Enabling this feature requires you to set a passcode (such as a PIN) after logging in to the mobile app. This passcode is stored locally on the device and you must enter it to access the app every time you close it or leave it in the background. On iOS, you can choose to use phone biometric features like Face ID. Administrators can also set a timeout which additionally requires the passcode when the timeout has elapsed, even if you have not minimized or closed the app.
> **Requirements:** The App Lock feature is available to customers on the following pricing plans: Business, Digital Operations (legacy), and Enterprise for Incident Management.
>
> **Note**: You configure Advanced Mobile Security in the web app as opposed to the mobile app.
To set up App Lock:
1. In the PagerDuty web app, navigate to **User Icon** → **Account Settings** → **Mobile Security Settings**.
2. Complete the fields on the screen:
| Field | Value |
| :-------------------------- | :--------------------------------------------------------------------------------------------------------------------------- |
| **Mobile App Lock Setting** | Select **On** from the dropdown menu. |
| **App Lock Timeout** | Enter a value in minutes to determine how long it takes before the app locks itself and requires you to enter your passcode. |
3. Click **Save**.
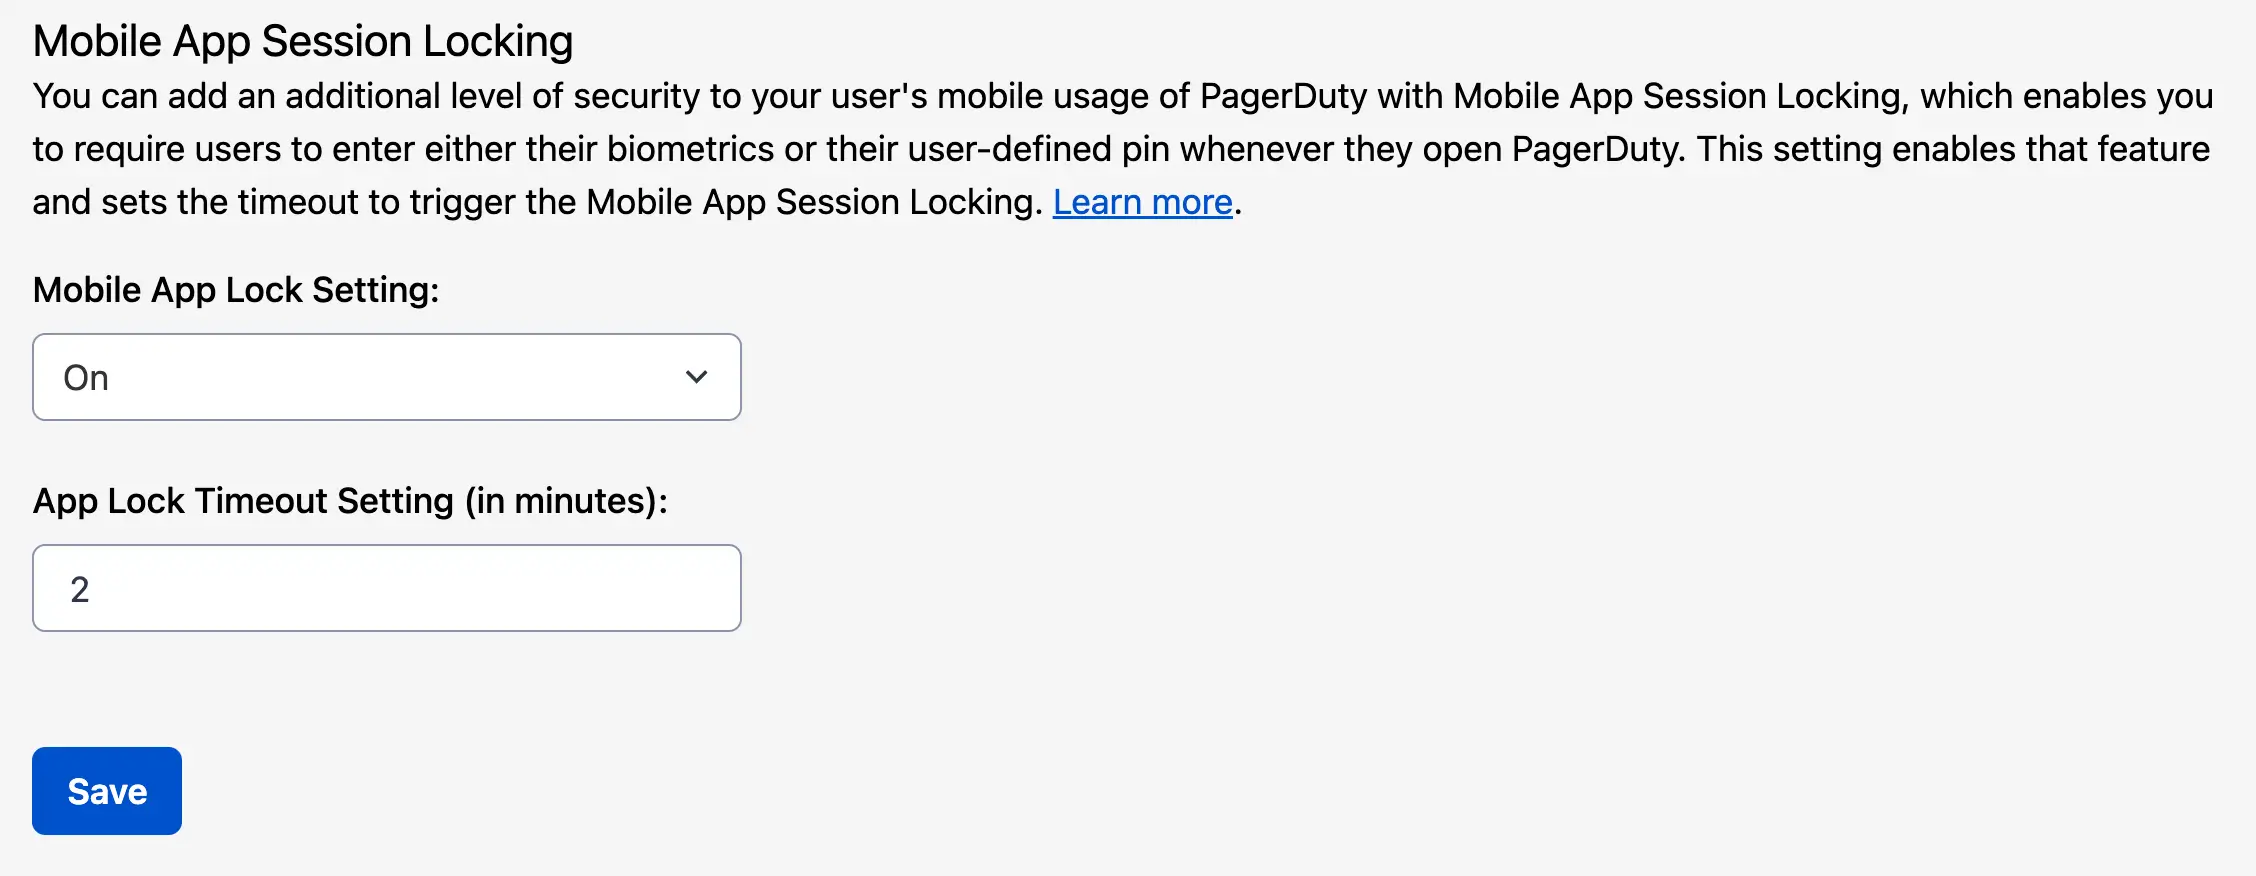
*Mobile app session locking screen*
After the setting is enabled, the app prompts you to enter a new passcode when you log into your PagerDuty mobile app.
*Mobile app lock screen*
> **Reset Passcode:** If you forget your passcode or want to change it, you can click **Forgot passcode?**, which logs you out of the entire app to set up a new one.
## FAQ
**When logging in, do I need to select my service region?**
You do not need to specify your [Service Region](/get-started/service-regions) (such as US or EU) when logging in. The login system works globally and logs you in to the appropriate account depending on the credentials you enter. If you use the same email and password combination for accounts in both the EU and US regions, you see a list of accounts, which indicates each account's service region.
**I use Single Sign-On to log in. Why do I not see the option to enter my email and password, too?**
Your PagerDuty administrator has configured the account to only allow login via single sign-on. Contact your PagerDuty administration to use an email and password to sign in to PagerDuty.
**I have multiple accounts with the same email. Why do I not see a list of accounts to log in to?**
You see a list of accounts that use the exact same email and password combination. If you use different passwords but the same email address for different accounts, the app does not present a list of accounts.
**Can I use a password manager to log in?**
Yes, the PagerDuty mobile app is compatible with industry-standard password managers, even if you have multiple PagerDuty accounts. If you use a unique password for each PagerDuty account, the app logs you in to the appropriate account.
**If I have multiple PagerDuty accounts, should I use the same password for each?**
No, using the same password across multiple accounts reduces security.
---
URL: https://docs.pagerduty.com/get-started/mobile-app-settings
# Mobile App Settings
Configure notifications and other mobile app options.
Within the mobile app, you can configure how notifications alert you as well as other app behavior settings.
Notification settings and certain features will depend on your device's operating system. Please refer to the section for your device's operating system for more information.
- [Configure Android Devices](#configure-android-devices)
- [Configure iOS Devices](#configure-ios-devices)
> **Beta Versions Not Supported:** PagerDuty mobile apps do not support beta versions of iOS or Android. Wait until the official OS release before updating, as beta builds can impact core functionality such as authentication and notifications.
## Configure Android Devices
### Notification Settings (Android)
The PagerDuty app must have app notifications enabled in order to access the notification settings. You can enable these in the app via the following steps:
1. Navigate to **More** → .
2. Tap **System Notification Settings** and ensure **Allow notifications** is enabled.
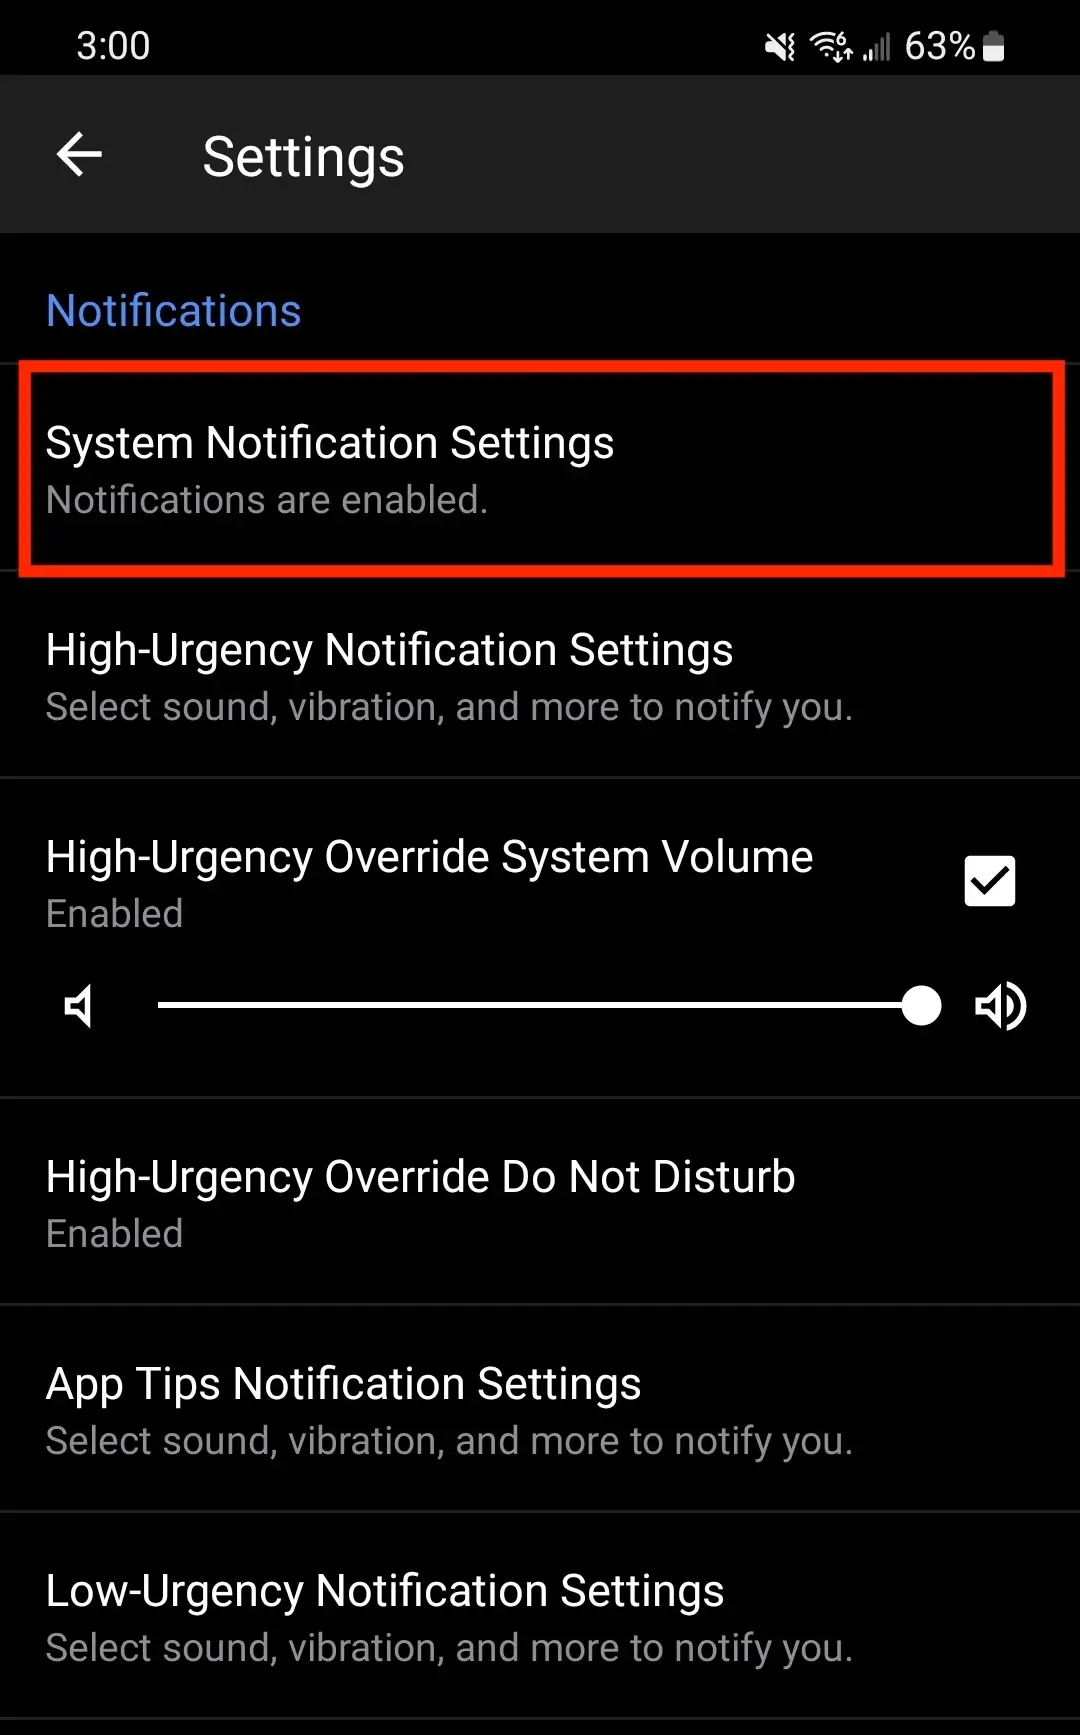
#### High-Urgency Notifications
Tap **High-Urgency Notification Settings** and ensure **Allow notifications** is enabled. Ensure the sound within the High-Urgency Notification Settings is set to **None**. Setting a sound will play two notification sounds and a warning message will be displayed.
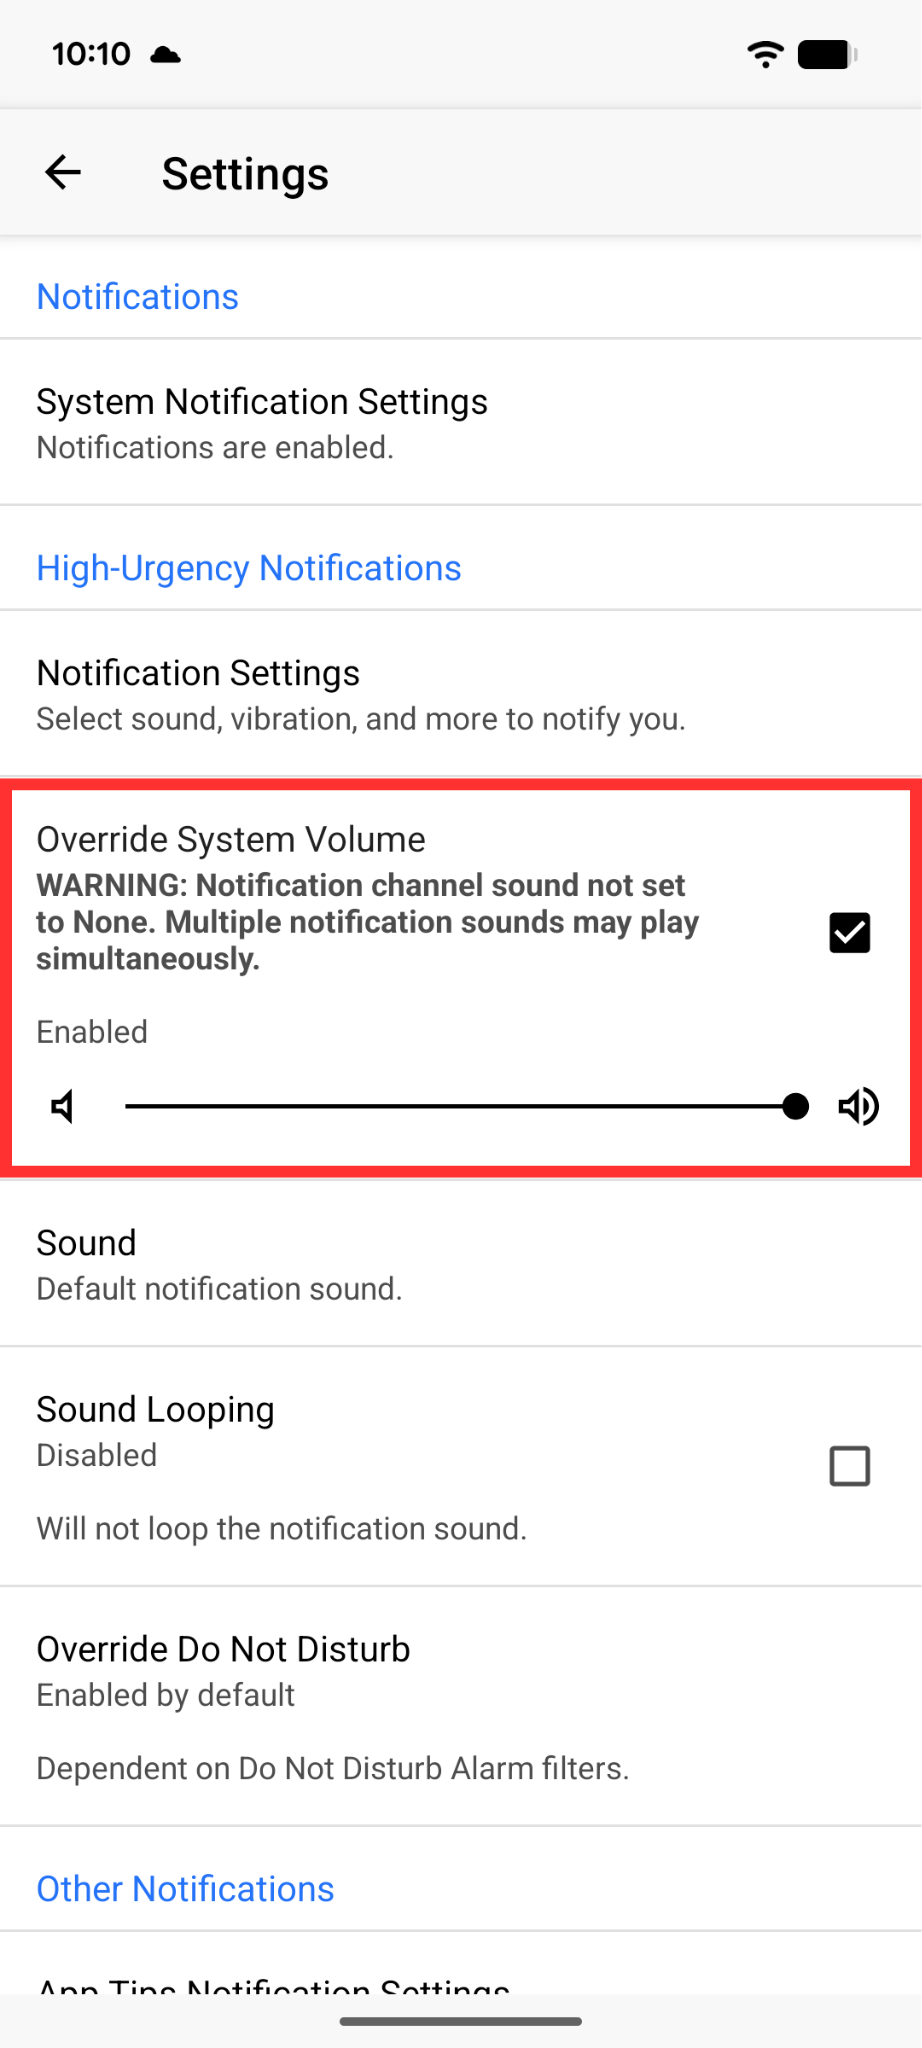
*Override system volume*
#### High-Urgency Override System Volume
> **Override System Volume Limitations:** PagerDuty cannot override the volume for phone call and SMS notifications.
>
> OnePlus devices running on OS 10 and higher do not fully support Override System Volume. These devices may not always override the system volume when the phone is on silent or vibrate mode.
If your phone _does not_ have Do Not Disturb enabled, and your volume slider is set to 0, PagerDuty push notifications will be silent. To change this, tap the **High-Urgency Override System Volume** checkbox to enable and set your desired volume level.
#### High-Urgency Override Do Not Disturb
> **Android Modes:** If you are using Android's Modes feature to enable Do Not Disturb, you must edit the Mode's settings to allow notifications from PagerDuty. Each Mode has its own **Allowed during Do not disturb** list.
Android's Do Not Disturb mode mutes all calls, notifications and other alerts. In order to receive high-urgency push notifications when Do Not Disturb is enabled, you can follow the steps below:
1. Navigate to your device's **Settings** → **Notifications** → **Do not disturb**.
2. Under **Allowed during Do not disturb** select **App notifications**.
3. Tap **Add apps** and then select the PagerDuty app.
4. Tap **Done** to confirm your selection.
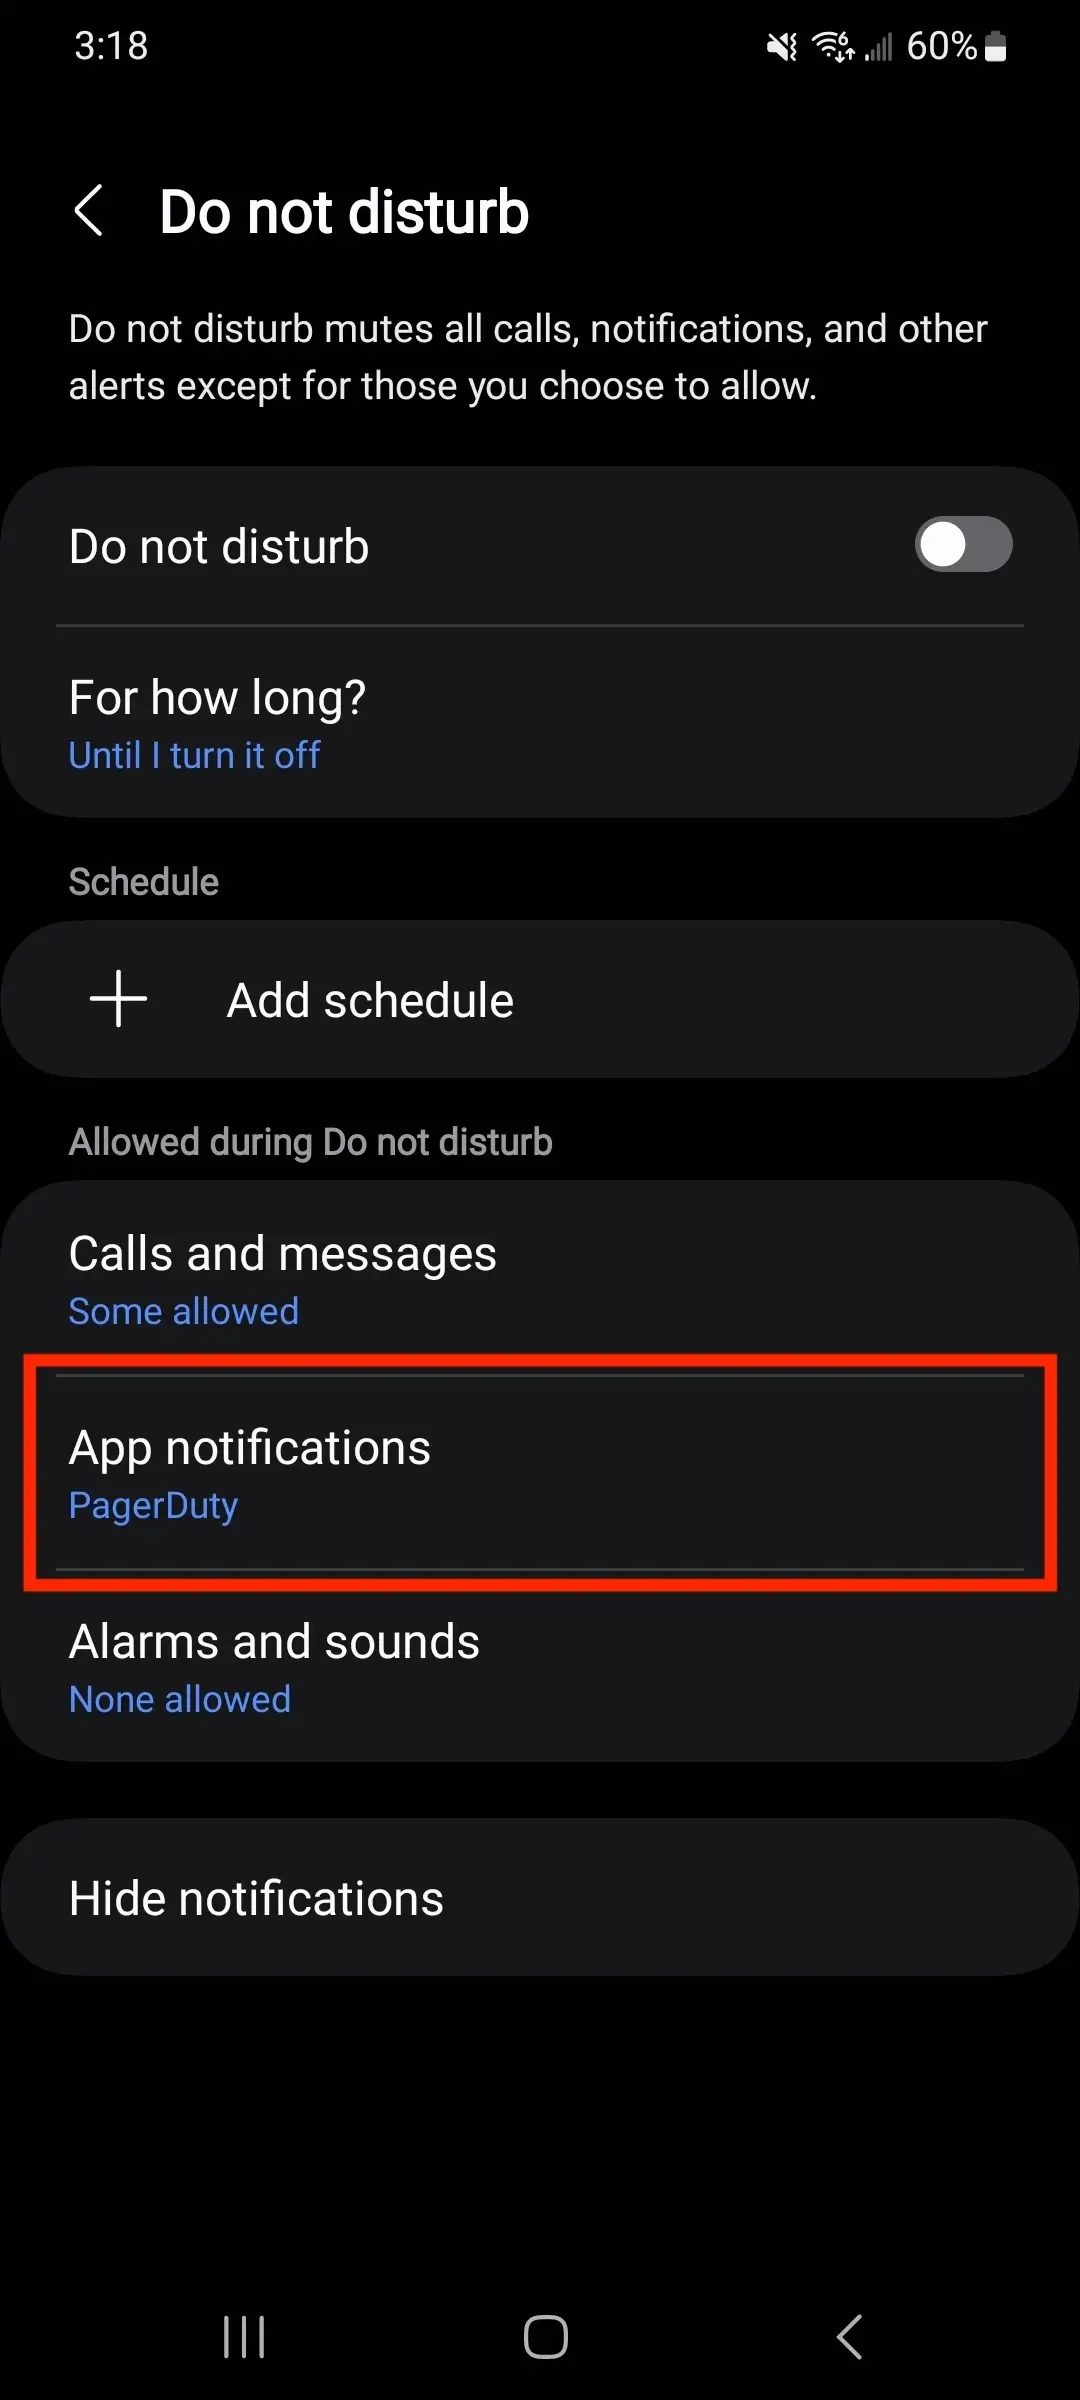
You can confirm this was successfully enabled in the PagerDuty app by navigating to **More** → . If the steps above were completed, **High-Urgency Override Do Not Disturb** will show as **Enabled**.
To have phone call and SMS notifications override Do Not Disturb, open the PagerDuty app and navigate to **More** → . Tap the **Override DND for Starred Contacts** checkbox to enable it. This will automatically add the **PagerDuty Outgoing Numbers** contact to your **Favorites** list and update your device's Do Not Disturb settings to allow calls and messages from contacts on your Favorites list.
#### App Tip Notifications (Android)
App Tip Notifications are delivered locally through the mobile app, and will occasionally notify you about new features and PagerDuty tips. Disabling this feature will _not_ affect [incident-related notifications](/incident-management/notifications/notification-content-and-behavior) or other PagerDuty communications, (e.g., [status updates](/incident-management/communicate/communicate-with-stakeholders#status-updates), [on-call handoff notifications](/account-admin/user-profile/notification-rules#on-call-handoff-notifications), [responder requests](/incident-management/incidents/add-responders#responder-notifications), etc.). Since these are local notifications, the setting selection will not be preserved if you uninstall and re-install the PagerDuty mobile app.
Navigate to **More** → → **App Tip Notification Settings**. Slide the toggle **Show notifications** to the **on** or **off** position.
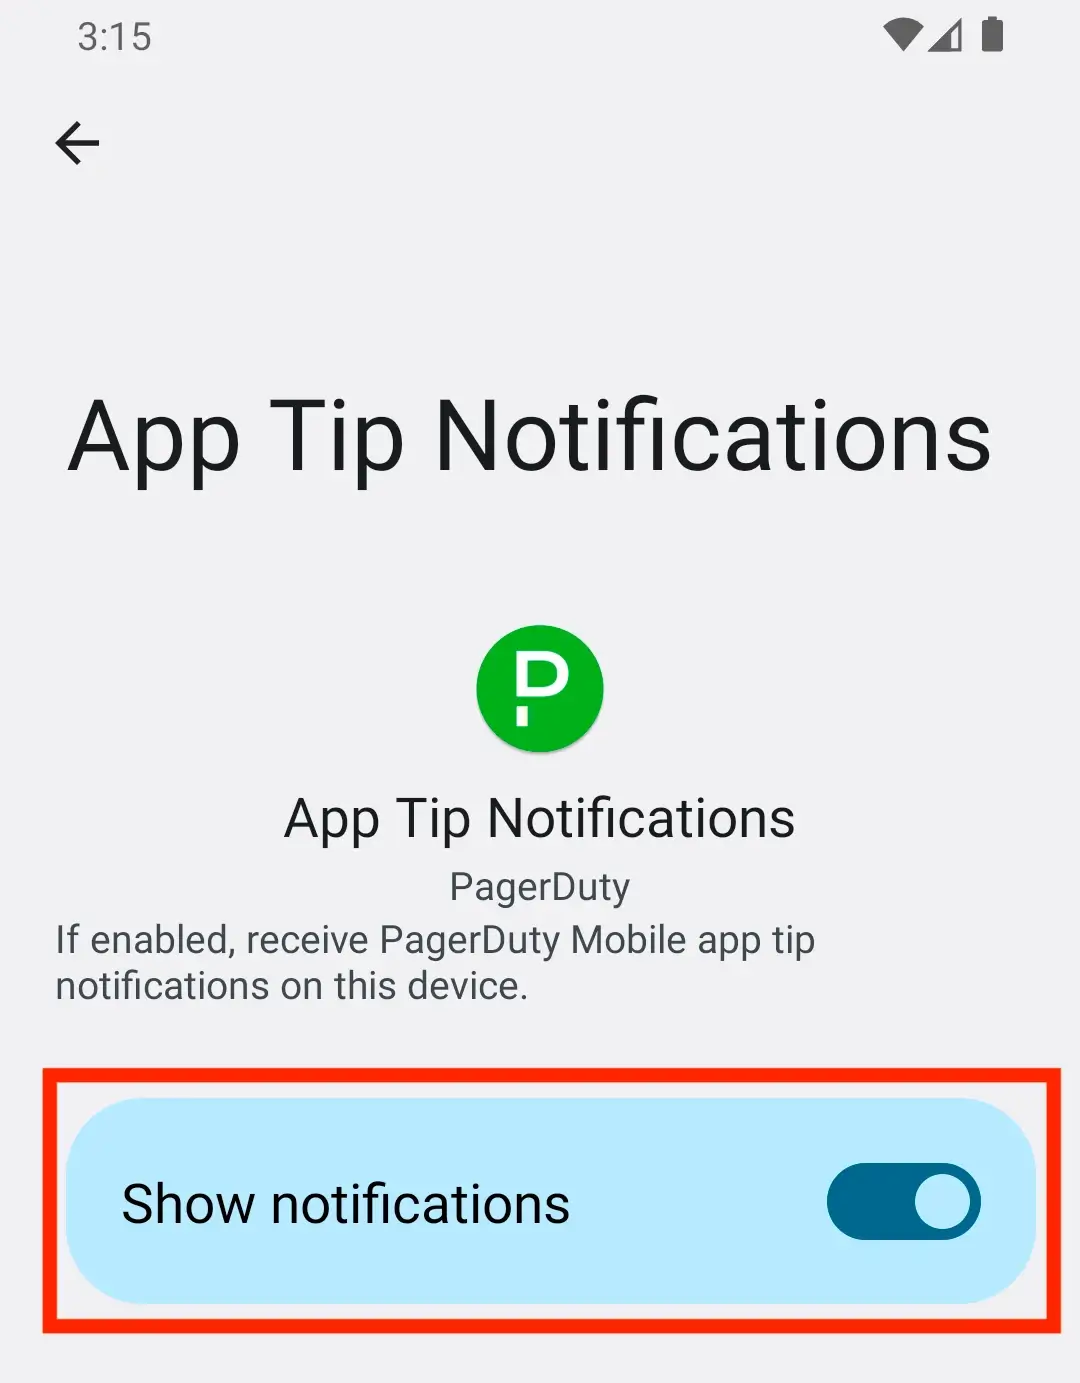
*App Tip Notifications toggle*
If you are using an Android device, you can configure the sound and alert settings for these notifications using the options below.
#### Low-Urgency Notifications
Low-urgency notifications are silent by default in order to distinguish them from high-urgency notifications. To enable sound for these notifications, tap **Low-Urgency Notification Settings** and ensure **Allow notifications** is enabled. Choose a **sound** and other alert settings.
> **MIUI and EMUI (Huawei and Xiaomi devices):** For these particular forks of Android, you may not be able to set sounds from the respective High and Low Urgency Notification Settings. Instead, you may need to perform the following:
>
> 1. Navigate to **System Notification Settings**.
> 2. Make sure High and Low Urgency Notifications are **enabled**.
> 3. From here, tap either **High or Low Urgency** to choose your sound.
#### On-Call Boosters (Android)
On-Call Boosters provide push notifications about changes to your on-call schedules. You will immediately receive a push notification when:
- You are added to a schedule
- You are removed from a schedule
- Changes are made to your on-call shifts within the next eight weeks (e.g., overrides, reordering)
> **Notification Exceptions:** Please note that notifications will not be sent if the change was made by the user themselves or if the change was made through the REST API.
This feature is enabled by default for all mobile users. To disable On-Call Boosters, navigate to **More** → → **On-Call Boosters**. Slide the toggle **Show notifications** to the off position.
Android users can configure the sound and alert settings for these notifications.
#### All Other Notifications
If you have configured push notifications for [status updates](/incident-management/communicate/communicate-with-stakeholders#status-updates) and/or [on-call handoff notifications](/account-admin/user-profile/notification-rules#on-call-handoff-notifications), you can configure the sound and other alert settings for these notifications by tapping **All Other Notification Settings**.
#### Clear Notifications
If you would like to automatically clear your push notifications when the app is launched, tap the checkbox next to **Clear Notifications** to enable this option.
### App Behavior Settings
#### Swipe Actions
You may change the swipe actions for responding to PagerDuty incidents. By default, the **Right Swipe** will **Resolve** an incident, and the **Left Swipe** will **Acknowledge** an incident.
To change either swipe action:
1. Tap **Change** to the right.
2. Select from the available incident actions:
- **Resolve**
- **Acknowledge; Snooze**
- **Acknowledge; Resolve**
- **None**
### Other Settings
#### Back Button Never Exits App
To ensure the back button doesn’t exit the app (e.g., during a critical incident), tap the **Back Button Never Exits App** checkbox to enable.
#### App Screenshots
If you would like to be able to take screenshots within the app, tap the **App Screenshots** checkbox to enable. If you would like to ensure your incidents and other information have maximum security, you may want to leave this setting disabled.
## Configure iOS Devices
### Notification Settings (iOS)
#### High-Urgency and Low-Urgency Settings
To enable and adjust the sound options for push notifications:
1. Navigate to **More** → .
- If required, toggle **Push Notifications** on.
2. Tap **High-Urgency** and assign a **ringtone** (Recommended).
3. Tap **Low-Urgency** and assign a **ringtone** _(Optional)_.
> **Other Notifications:** If you have configured push notifications for [status updates](/incident-management/communicate/communicate-with-stakeholders#status-updates) and/or [on-call handoff notifications](/account-admin/user-profile/notification-rules#on-call-handoff-notifications), these notifications will use your device's **Default Alerts** (**Settings** → **Sounds & Haptics** → **Default Alerts**) configuration.
>
> When you are [added as a Responder](/incident-management/incidents/add-responders) to an incident, the iOS mobile app will always use the **PagerDuty Alert** ringtone for push notifications.
#### Critical Alerts for High-Urgency
Critical Alerts for iOS allow high-urgency push notifications to bypass an iPhone’s [Focus](#focus-mode) and silent mode settings. You can enable this setting in the mobile app by navigating to **More** → . Ensure that you have **Push Notifications** enabled, tap **Critical Alerts for High-Urgency** and then tap **Allow**.
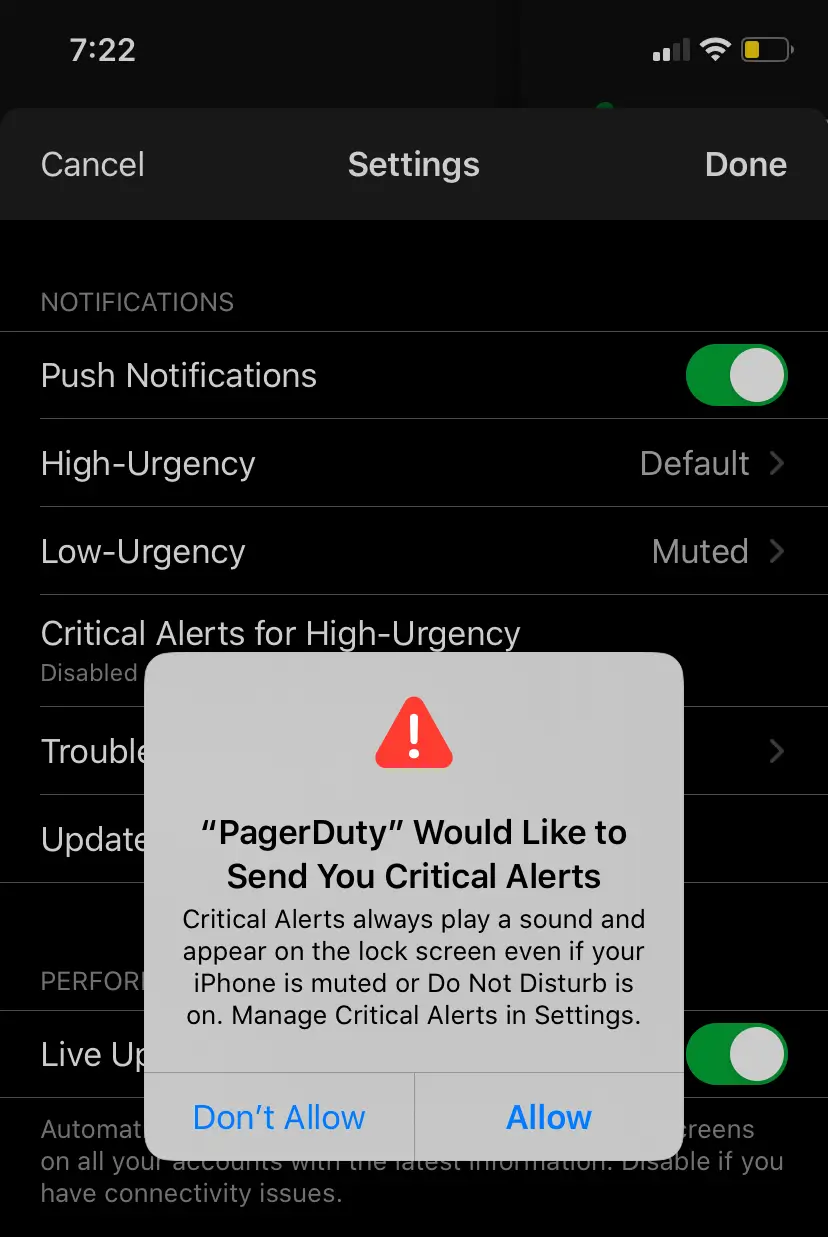
Alternatively, you can enable Critical Alerts by navigating to your device's **Settings** → **PagerDuty** → **Notifications** and then toggle **Critical Alerts**.
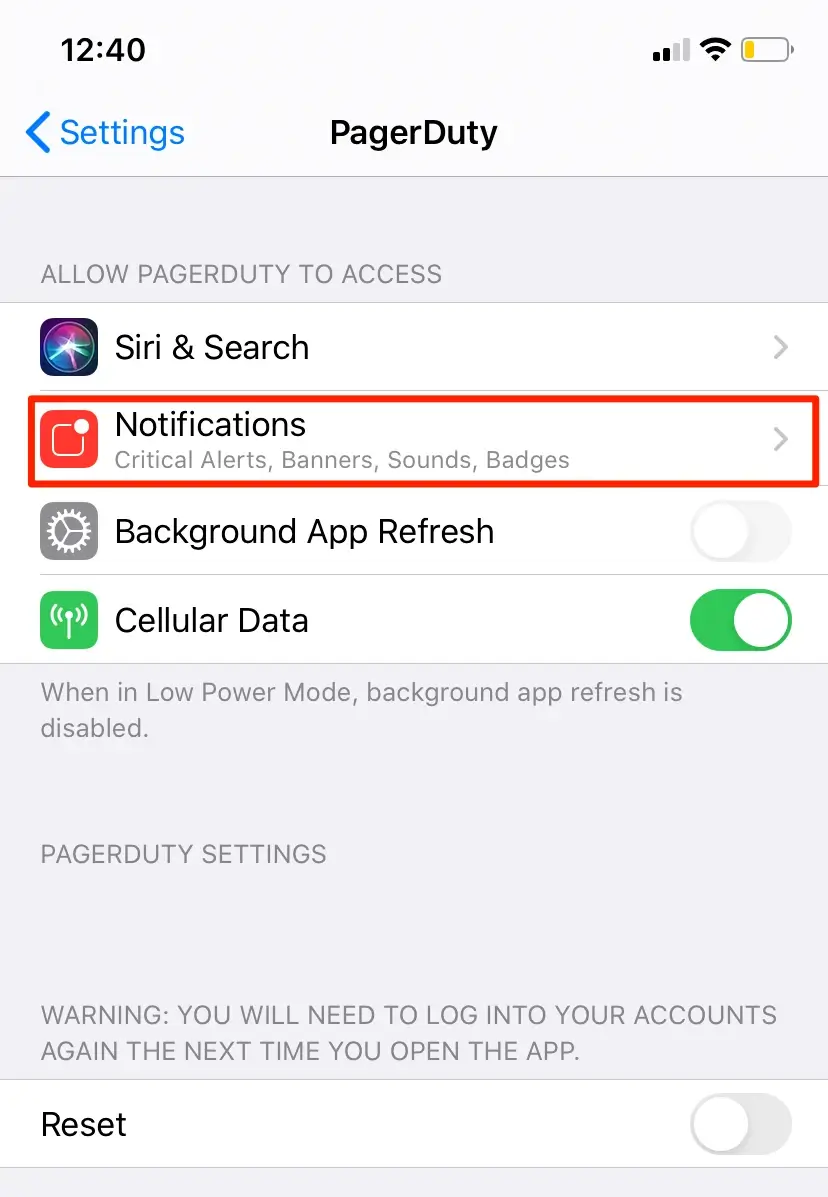
*iOS: Notifications Settings*
> **Warning:** Due to iOS features beyond our control, Critical Alerts can cause some calls made through third-party communication apps to drop when they’re sent during an ongoing call.
#### On-Call Boosters (iOS)
On-Call Boosters provide push notifications about changes to your on-call schedules. You will immediately receive a push notification when:
- You are added to a schedule
- You are removed from a schedule
- Changes are made to your on-call shifts within the next eight weeks (e.g., overrides, reordering)
> **Notification Exceptions:** Please note that notifications will not be sent if the change was made by the user themselves or if the change was made through the REST API.
This feature is enabled by default for all mobile users. To disable On-Call Boosters, navigate to **More** → . Slide the toggle for **On-Call Boosters** off and tap **Done**.
For iOS devices, these notifications will use your device's **Default Alerts** (**Settings** → **Sounds & Haptics** → **Default Alerts**) configuration.
#### App Tip Notifications (iOS)
App Tip Notifications are delivered locally through the mobile app, and will occasionally notify you about new features and PagerDuty tips. Disabling this feature will _not_ affect [incident-related notifications](/incident-management/notifications/notification-content-and-behavior) or other PagerDuty communications, (e.g., [status updates](/incident-management/communicate/communicate-with-stakeholders#status-updates), [on-call handoff notifications](/account-admin/user-profile/notification-rules#on-call-handoff-notifications), [responder requests](/incident-management/incidents/add-responders#responder-notifications), etc.). Since these are local notifications, the setting selection will not be preserved if you uninstall and re-install the PagerDuty mobile app.
Navigate to **More** → . Slide the toggle for **App Tip Notification Settings** on or off and tap **Done**.
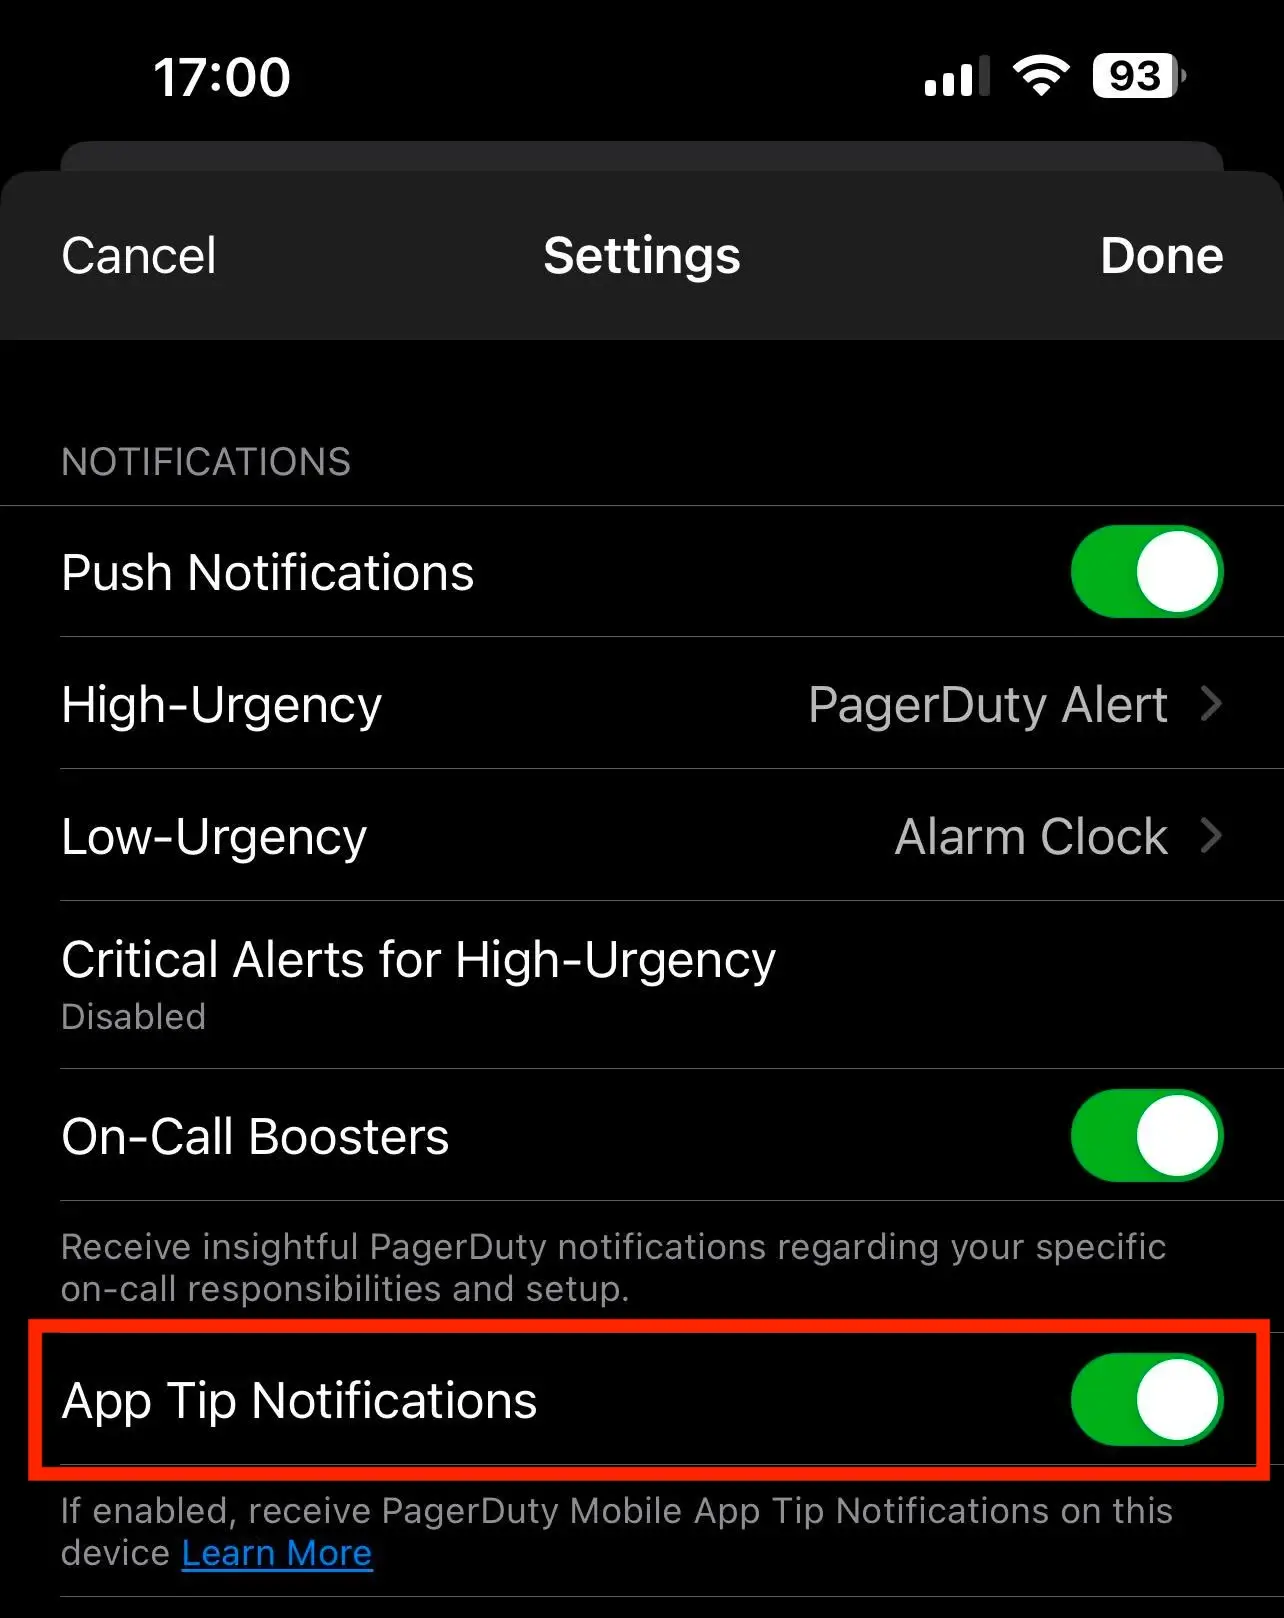
*App Tip Notifications toggle*
For iOS devices, these notifications will use your device's **Default Alerts** (**Settings** → **Sounds & Haptics** → **Default Alerts**) configuration.
### Focus Mode
The **Focus Mode** feature allows users to have granular control over which apps and contacts get to notify them at the given Focus setting (including Do Not Disturb). You can learn more about the Focus feature [here](https://support.apple.com/en-us/HT212608).
In order to bypass all Focus modes, you can complete the following:
- Enable [Critical Alerts](#critical-alerts-for-high-urgency) for push notifications.
- Activate [Emergency Bypass](#override-silent-mode-and-focus-for-phone-notifications) for the **PagerDuty Outgoing Numbers** contact for phone notifications.
You can also override a [specific Focus](#override-a-specific-focus).
#### Override Silent Mode and Focus for Phone Notifications
When you receive a phone notification from PagerDuty, you may want your phone to audibly ring, even while it is on silent or when any Focus mode is enabled.
1. If you haven't done so already, download PagerDuty's [vCard](/incident-management/notifications/notification-phone-numbers#pagerduty-vcard) to add **PagerDuty Outgoing Numbers** to your contacts.
2. Navigate to your phone's Contacts app and select **PagerDuty Outgoing Numbers**.
3. Tap **Edit**, scroll down and select the row **Ringtone**.
4. Activate **Emergency Bypass** and tap **Done**.
5. Tap **Done** again.
#### Override a Specific Focus
You can allow PagerDuty notifications to override a specific Focus (e.g., Do Not Disturb) via the steps below.
To allow push notifications:
1. Navigate to your device's **Settings** → **Focus** and select the desired Focus.
2. Tap **Apps** → **Allow Notifications From**.
3. Tap and select PagerDuty.
4. Tap **Done** to save your selection.
To allow phone notifications:
1. Within the PagerDuty Mobile App, navigate to **More** → .
2. If you already had the app installed, select **Update PagerDuty Contact Card**.
- If this is your first time logging into the app, you'll be prompted to grant PagerDuty the **Manage Contacts** permission. You can read about how we use this permission [here](/get-started/mobile-app#mobile-app-permissions).
3. Navigate to your device's **Settings** → **Focus** and select the desired Focus.
4. Tap **People** → **Allow Notifications From**.
5. Tap and select the PagerDuty contact, **PagerDuty Outgoing Numbers**.
6. Tap **Done** to save your selection.
### Notification Summary
The Notification Summary feature allows non-critical notifications to be received at a specific time of the day to avoid taking away users’ attention during focus time. A few points to take note of with this feature:
- Notification Summary is optional and disabled by default.
- If desired, the PagerDuty app will need to be part of the list of chosen apps for the Summary located in **Settings** → **Notifications** → **Scheduled Summary**.
- Critical Alerts can still be received instantly.
New PagerDuty app users will receive a prompt upon installing to either allow notifications or include them in a scheduled summary.
*Allow notifications prompt*
### Notification Preferences
You can quickly update your [notification rules](/account-admin/user-profile/notification-rules) for high urgency incidents. We offer three pre-configured options to choose from:
- **Never Miss a Page**: Immediately sends a Push notification, followed by an email after one minute, SMS after two minutes, and a call after three minutes.
- **Always Text First**: Immediately sends a SMS, followed by an email after one minute and a call and push notification after two minutes.
- **Always Call First**: Immediately calls, followed by a SMS after one minute and an email and push notification after two minutes.
You can also click **Advanced Notification Rules** to set your own preferences.
### Appearance
You can adjust various aspects of how the mobile app appears. Navigate to **More** → and tap **App Appearance**.
To change the in-app color scheme, tap **Theme** and select from the following options:
- **System**
- **Light**
- **Dark**
To change the app icon, tap **Icon** and make a selection:
- **Green (default)**
- **Blue**
- **Cream**
- **Pink**
- **Sky**
- **Yellow**
## Shared Settings
### Troubleshoot Notifications
To receive a test push notification, navigate to **More** → and tap **Troubleshooting** (Android) or **Troubleshoot Notifications** (iOS). If the notification is successful, you will receive a push notification based on your settings. If an issue occurs, a prompt will advise you on what settings may need to be adjusted to ensure you receive notifications.
_Optionally_, tap **Run Tests** to run troubleshooting tests again.
### Support Resources
If you need further assistance, we provide easy access to additional resources in the app's Settings:
- **Community Support**: Visit [PagerDuty Commons](https://community.pagerduty.com/), our community site.
- **Email Support**: Tap **Email Support** to email our Support Team directly.
- **PagerDuty System Status**: Check PagerDuty's [PagerDuty Status Page](https://status.pagerduty.com/) and sign up for notifications.
### Contact Card Settings
The [PagerDuty vCard](/incident-management/notifications/notification-phone-numbers#pagerduty-vcard) is a file containing the numbers that PagerDuty notifications can come from. These numbers are saved to the **PagerDuty Outgoing Numbers** contact. The vCard updates automatically by default in the mobile app, and there is nothing that needs to be configured. Tap **Automatic Contact Card Management** to manually update the vCard; if prompted, tap **Continue** to give the PagerDuty app permission to access your contacts.
### Live Updating
Live Updating automatically updates the incidents list and incident details screen on your mobile app with the latest information. Tap the **Live Updating** checkbox (Android) or toggle (iOS) to enable or disable this option. We recommend disabling this option if you are experiencing connectivity issues.
---
URL: https://docs.pagerduty.com/get-started/mobile-app/mobile-home-screen
# Mobile Home Screen
An overview of the mobile app's Home screen sections, including open incidents, on-call shifts, and the status dashboard widget.
The mobile Home screen highlights top open incidents, and displays on-call shift and service information, which broadens awareness and streamlines navigation to other important, non-incident information.
You can navigate to the Home screen in the mobile app by tapping **Home** in the app's navigation bar:
- [Status Dashboard Widget](#status-dashboard-widget)
- [My Open Incidents](#my-open-incidents)
- [On-Call Shifts](#on-call-shifts)
- [Analytics on Mobile](#analytics-on-mobile)
- [Recently Impacted Technical Service](#recently-impacted-technical-service)
## Status Dashboard Widget
The Home screen displays a condensed view of the [Mobile Status Dashboard](/get-started/mobile-status-dashboard), and gives you an overview of your account's incident-impacted business services. Please read [Home Screen Status Dashboard](/get-started/mobile-status-dashboard/home-screen-status-dashboard) for more information.
## My Open Incidents
The **My Open Incidents** section displays incidents that are assigned to you, indicates the total number in the top-left, and provides an overview of your three most-recent, open incidents. Tap an incident’s row to navigate to its [details page](/get-started/mobile-app#incident-details-and-other-actions), where you can find more information about the incident, and acknowledge or resolve it.
Tap **New Incident** to [trigger an incident](/get-started/mobile-app#trigger-or-declare-an-incident).
If you have more than three incidents, tap **Show More** to expand the list. The expanded list will display up to 10 incidents, and you can tap **View All Open Incidents** to view all open incidents on the [Open Incidents](/get-started/mobile-app#open-incidents-screen) screen.
**Note**: The [Open Incidents](/get-started/mobile-app#open-incidents-screen) screen will remember which tab filter you most recently selected (**Mine**, **My Teams** or **All**), which reduces the number of taps needed to display relevant incidents.
## On-Call Shifts
This section details up to three of your current on-call shifts. Tap to the right of a shift to view more options, for example: **Go To Schedule**, **Go To Escalation Policy**, **Create an Override…**, **Go To My On-Call Shifts**.
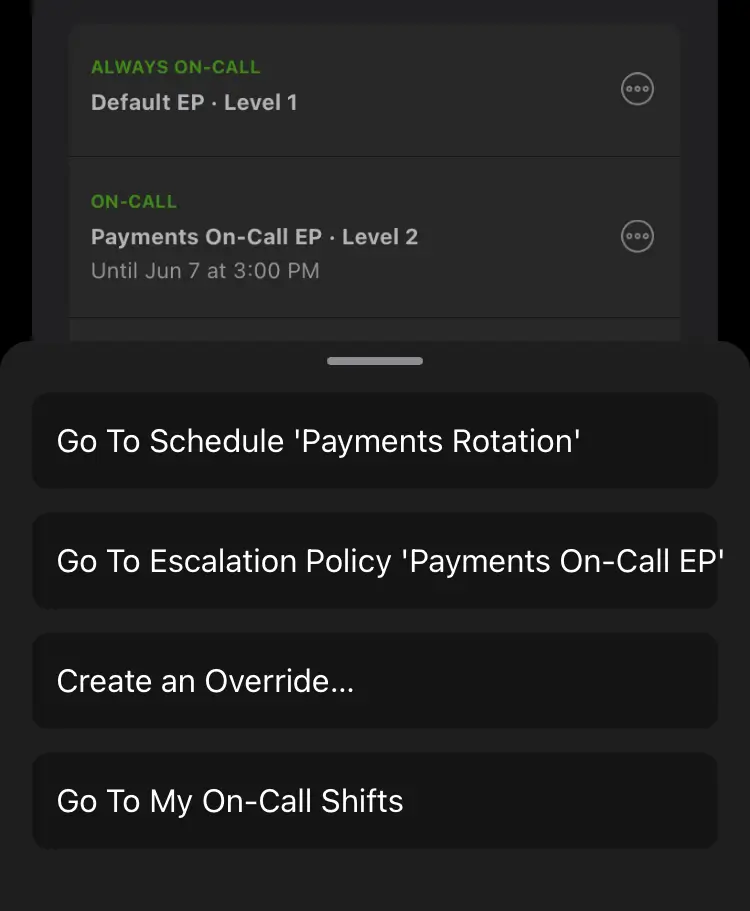
*On-call shifts*
Tap **View All Shifts** to go to the [My On-Call Shifts](/get-started/mobile-app#my-on-call-shifts-screen) screen for a detailed overview of all your on-call responsibilities.
## Analytics On Mobile
> **Availability:** Analytics on Mobile is available on PD Reliability Platform plans. It's also available on the following pricing plans: Professional, Business, Digital Operations (legacy) and Enterprise for Incident Management.
> Please contact our [Sales team](https://www.pagerduty.com/contact-us/#contact-sales) to upgrade to a plan with this feature.
You can see an analytics overview on the Home Screen for the [Teams](/account-admin/teams) you are a part of. If your account does not have Teams, you'll see analytics for your entire organization.
The Analytics section displays information from the previous month for the following metrics:
- **High Urgency Incidents**
- **MTTA** (Mean time to acknowledge)
- **MTTR** (Mean time to resolve)
Change trends are compared to metrics from the 30 days prior to the displayed date range.
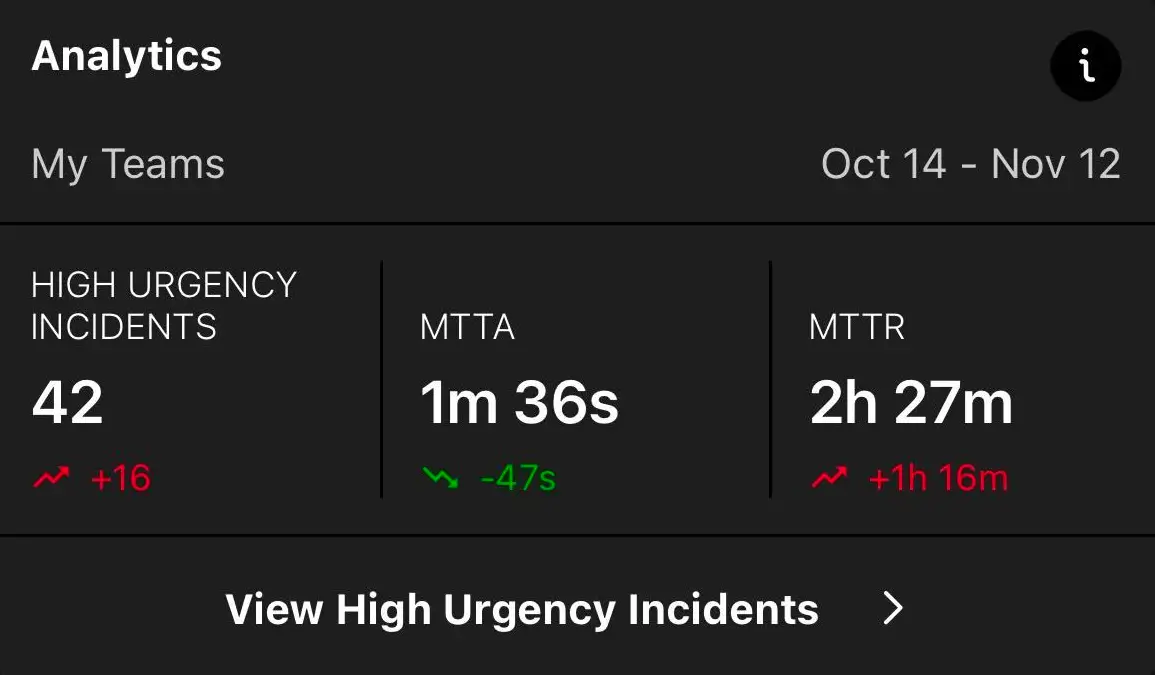
*Analytics on the Mobile Home Screen*
## Recently Impacted Technical Service
This section displays the most recently impacted technical service associated with your [Teams](/account-admin/teams). If your account does not have the Teams feature, it will display the most recently impacted technical service in your PagerDuty account.
For an overview of all services in your PagerDuty account, tap **View Services** to go to the [Service Directory](/incident-management/services/service-directory).
## Customize Your Home Screen
> **Multiple Accounts:** If you have more than one PagerDuty account, you can save different customizations for each account.
> **Device Information:** Instructions and screenshots below are for the following devices. Depending on your device and operating system, information may vary slightly:
>
> - **iOS**: iPhone 16 Pro, iOS 18.1
> - **Android**: Pixel 9 Pro, Android 15.0
**iOS**
1. Tap **Home** → **Edit**.
2. Tap next to a card to add it to your Home Screen. Tap to remove a card from your Home Screen.
1. **Note**: You must have at least one card on your Home Screen.
3. _Optional_: Tap and drag to reorder the cards.
4. Tap **Save**.

**Android**
1. Tap **Home** → .
2. Tap next to a card to add it to your Home Screen. Tap to remove a card from your Home Screen.
1. **Note**: You must have at least one card on your Home Screen.
3. _Optional_: Tap and drag to reorder the cards.
4. Tap **Save**.

---
URL: https://docs.pagerduty.com/get-started/mobile-app/mobile-widgets
# Mobile Widgets
Add an on-call status widget to your device's home screen or lock screen to view upcoming on-call shifts without opening the app.
The PagerDuty on-call widget allows [PagerDuty Mobile App](/get-started/mobile-app) users to quickly view their on-call status and any upcoming shifts from their device's home screen without needing to open the app.
> **Availability:** Mobile widgets are available to users on all pricing plans.
## Add the On-Call Widget
The on-call widget will prioritize **Always On-Call** shifts. Larger widgets will show on-call shifts with a defined end time lower in the list of shifts.
> **Device Information:** Instructions and screenshots below are for the following devices. Depending on your device and operating system, information may vary slightly:
>
> - **iOS**: iPhone 16 Pro, iOS 18.1
> - **Android**: Pixel 9 Pro, Android 15.0
### iOS Home Screen
1. Long-press your device's home screen, tap **Edit** in the top left, and select **Add Widget**.
2. Search and select **PagerDuty** from the list of widgets.
3. Tap **Add Widget**.
4. _Optionally_ resize and/or drag the widget to a new location. For users with multiple escalation policies, we recommend using the larger widget, since it offers more display space.
5. Tap **Done**.
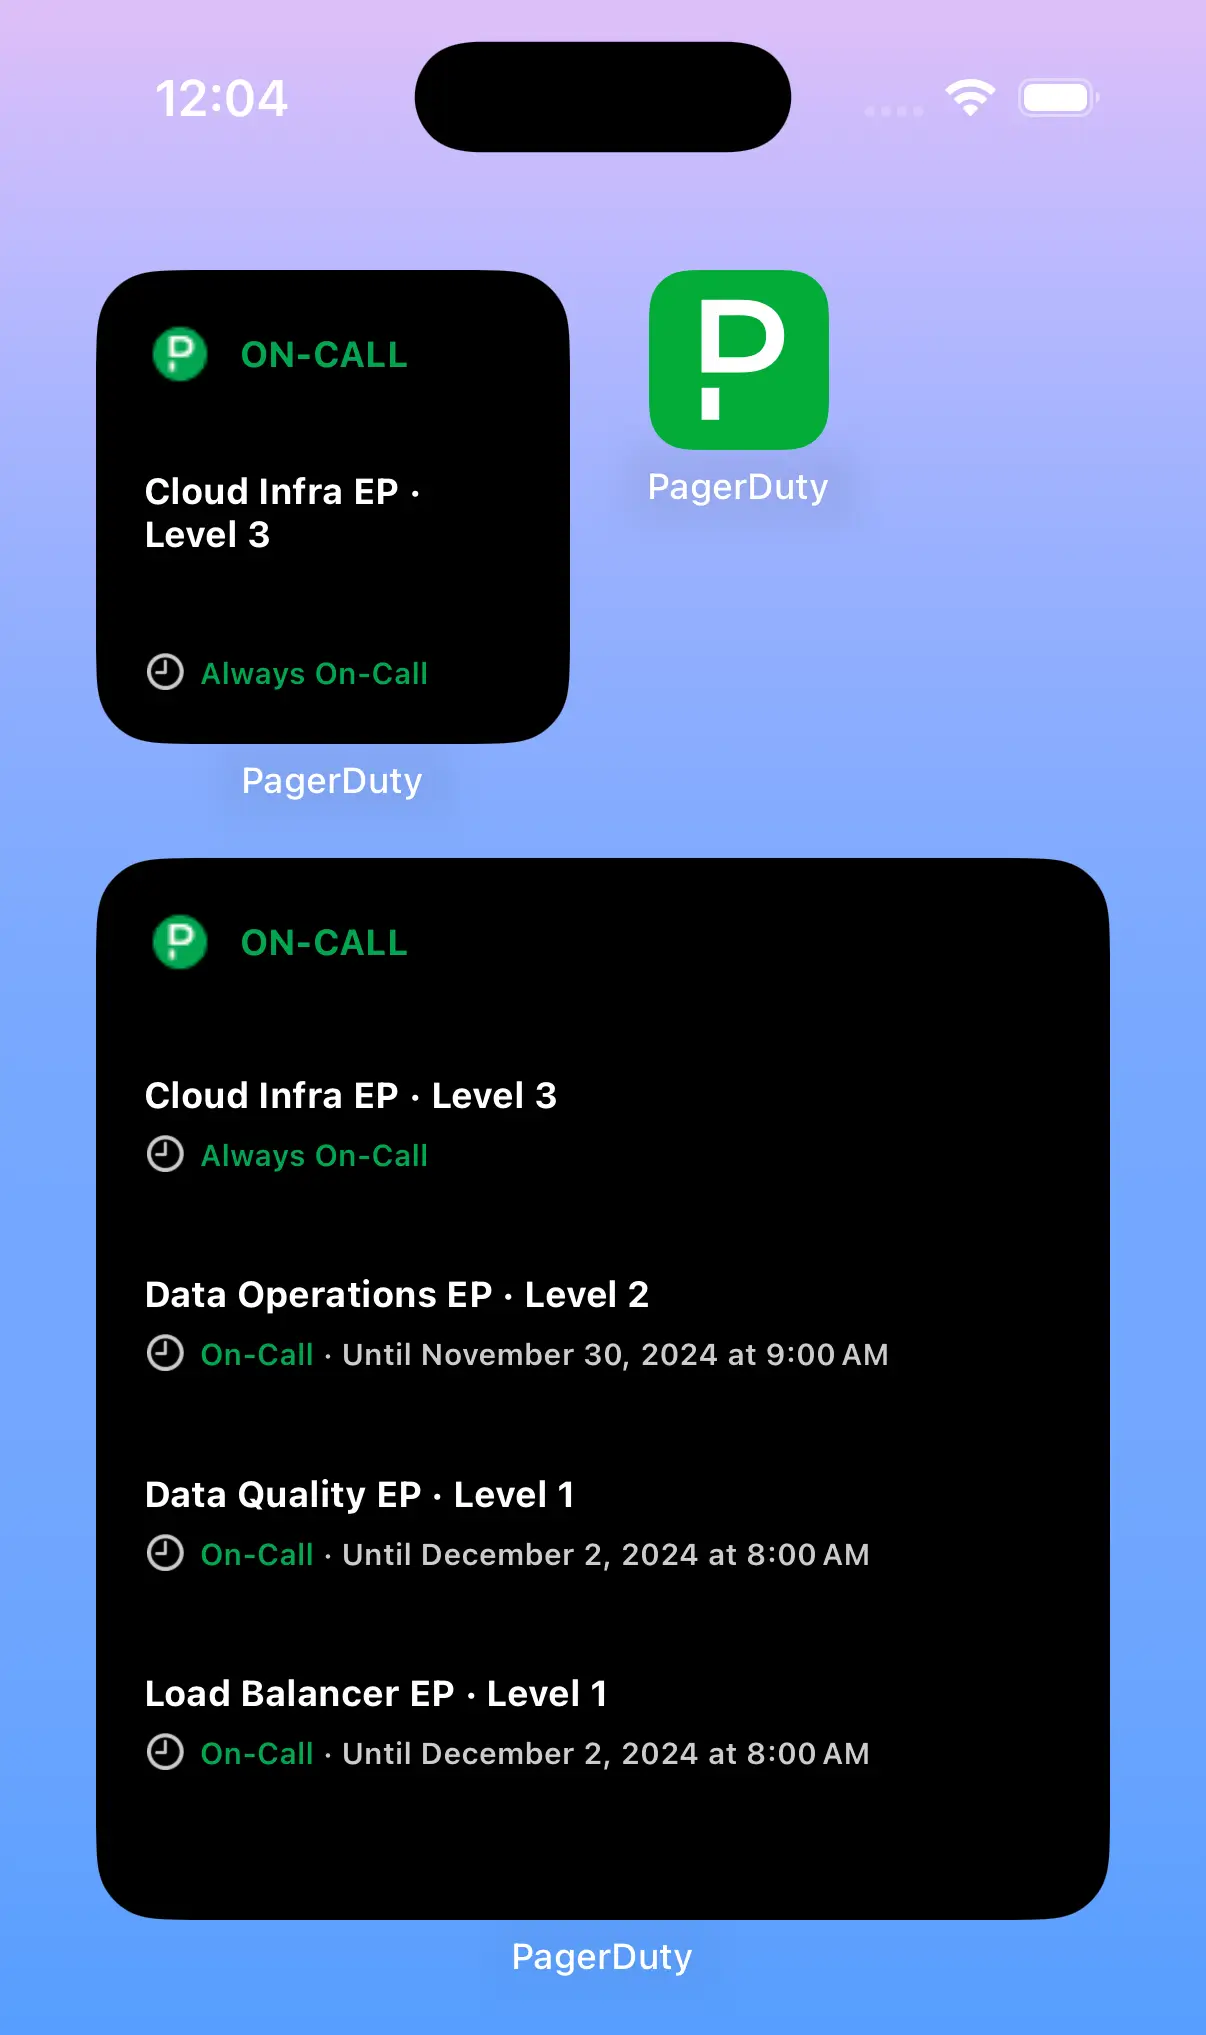
*Add the iOS on-call widget*
### iOS Lock Screen
An on-call widget is also available for your lock screen.
1. Touch and hold the Lock Screen until the Customize button appears.
2. Tap **Customize**.
3. Tap **Lock Screen**, then tap ** Add Widgets**.
4. Tap **PagerDuty** from the list of widgets, and tap or drag the **PagerDuty** widget onto your Lock Screen.
5. Tap **Done**.
*On-call widget on the iOS lock screen*
### Android Home Screen
1. Long-press your device's home screen and select **Widgets**.
2. Search and select **PagerDuty** from the list of widgets, and tap **Add**.
1. **Note**: If you do not see **PagerDuty** in the list of widgets, please make sure you are [logged in to the mobile app](/get-started/log-in-to-pagerduty#log-in-via-the-web-or-mobile-app).
3. _Optionally_ resize the widget vertically and horizontally to view more or fewer escalation policies.
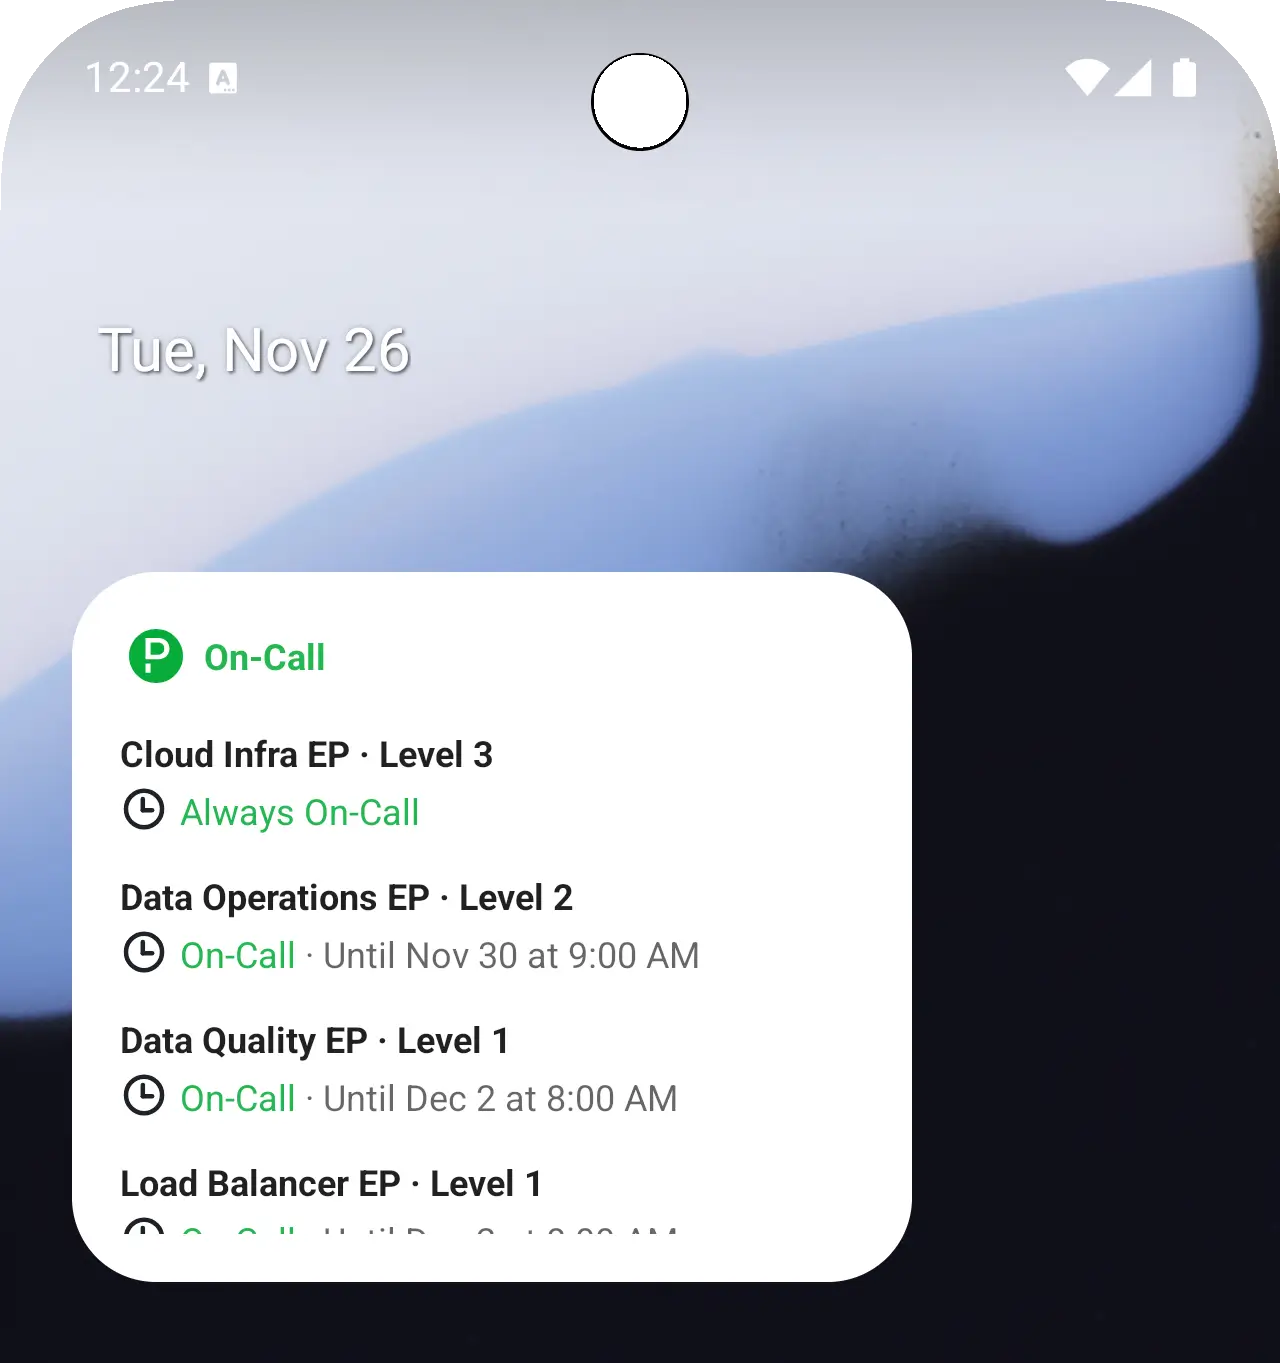
*Add the Android on-call widget to the home screen*
## Interact with the On-Call Widget
Tap the widget to navigate to the mobile app's [My On-Call Shifts](/get-started/mobile-app#my-on-call-shifts-screen) screen.
> **Switch Subdomains:** To see on-call shifts from a different subdomain, you will need to switch accounts in your PagerDuty Mobile App. Please read [Switch PagerDuty Accounts in the Mobile App](/get-started/mobile-app#switch-pagerduty-accounts-in-the-mobile-app) for more information.
## Reposition the On-Call Widget
To reposition the widget, long-press it and drag-and-drop it to a new location on your device's home screen. You may also see an option to resize the widget.
## Delete the On-Call Widget
To remove the widget, long-press the widget and select the option to remove it.
---
URL: https://docs.pagerduty.com/get-started/mobile-release-notes
# Mobile Release Notes
Recent PagerDuty mobile app release notes for iOS and Android, listed by version number, release date, and platform-specific changes.
## 8.10 — 14 Apr 2025
**Android**
- We've introduced a new search filter to quickly find and run incident workflows.
- We are introducing the new minimum OS requirements to ensure the app continues to be innovative and secure. Starting April 14, 2025, the future versions of the app will require Android 12 or higher. Please ensure your device is upgraded to continue receiving mobile app updates.
**iOS**
- We've introduced a new search filter to quickly find and run incident workflows.
- We have deprecated support for iOS 16.0. Please ensure your device is upgraded to continue receiving mobile app updates.
## 8.02 — 24 Feb 2025
**Android**
- You can now view and edit Incident Types from the Incident Details Screen. Incident types allows organizations to define how specific incidents behave in order to align them with their bespoke operational processes—whether it’s a Major Incident or a Security Incident, or a custom type.
**iOS**
- You can now view and edit Incident Types from the Incident Details Screen. Incident types allows organizations to define how specific incidents behave in order to align them with their bespoke operational processes—whether it’s a Major Incident or a Security Incident, or a custom type.
### Intune (8.02)
**Android**
Introducing PagerDuty for Intune, a secure version of the PagerDuty mobile app designed for organizations using Microsoft Intune for mobile application management.
Key Features:
- Intune App Protection – Enforce security policies without requiring full device management.
- Incident Management on the go – Manage alerts, acknowledge incidents, and collaborate in real time.
- Automation: Take action faster with Automation Actions and Incident workflow
**iOS**
Introducing PagerDuty for Intune, a secure version of the PagerDuty mobile app designed for organizations using Microsoft Intune for mobile application management.
Key Features:
- Intune App Protection – Enforce security policies without requiring full device management.
- Incident Management on the go – Manage alerts, acknowledge incidents, and collaborate in real time.
- Automation: Take action faster with Automation Actions and Incident workflow
## 8.01 — 17 Feb 2025
**Android**
- You can now view and edit Incident Types from the Incident Details Screen. Incident types allows organizations to define how specific incidents behave in order to align them with their bespoke operational processes—whether it’s a Major Incident or a Security Incident, or a custom type.
**iOS**
- You can now view and edit Incident Types from the Incident Details Screen. Incident types allows organizations to define how specific incidents behave in order to align them with their bespoke operational processes—whether it’s a Major Incident or a Security Incident, or a custom type.
### Intune (8.01)
**Android**
Introducing PagerDuty for Intune, a secure version of the PagerDuty mobile app designed for organizations using Microsoft Intune for mobile application management.
Key Features:
- Intune App Protection – Enforce security policies without requiring full device management.
- Incident Management on the go – Manage alerts, acknowledge incidents, and collaborate in real time.
- Automation: Take action faster with Automation Actions and Incident workflow
**iOS**
Introducing PagerDuty for Intune, a secure version of the PagerDuty mobile app designed for organizations using Microsoft Intune for mobile application management.
Key Features:
- Intune App Protection – Enforce security policies without requiring full device management.
- Incident Management on the go – Manage alerts, acknowledge incidents, and collaborate in real time.
- Automation: Take action faster with Automation Actions and Incident workflow
## 8.00 — 6 Feb 2025
**Android**
- You can now view and edit Incident Types from the Incident Details Screen. Incident types allows organizations to define how specific incidents behave in order to align them with their bespoke operational processes—whether it’s a Major Incident or a Security Incident, or a custom type.
**iOS**
- You can now view and edit Incident Types from the Incident Details Screen. Incident types allows organizations to define how specific incidents behave in order to align them with their bespoke operational processes—whether it’s a Major Incident or a Security Incident, or a custom type.
### Intune (8.00)
**Android**
Introducing PagerDuty for Intune, a secure version of the PagerDuty mobile app designed for organizations using Microsoft Intune for mobile application management.
Key Features:
- Intune App Protection – Enforce security policies without requiring full device management.
- Incident Management on the go – Manage alerts, acknowledge incidents, and collaborate in real time.
- Automation: Take action faster with Automation Actions and Incident workflow
**iOS**
Introducing PagerDuty for Intune, a secure version of the PagerDuty mobile app designed for organizations using Microsoft Intune for mobile application management.
Key Features:
- Intune App Protection – Enforce security policies without requiring full device management.
- Incident Management on the go – Manage alerts, acknowledge incidents, and collaborate in real time.
- Automation: Take action faster with Automation Actions and Incident workflow
## 7.99 — 22 Jan 2025
**Android**
- We've got some really cool things going on behind the scenes. Stay tuned!
**iOS**
- We've got some really cool things going on behind the scenes. Stay tuned!
## 7.98 — 16 Dec 2024
**Android**
- We've got some really cool things going on behind the scenes. Stay tuned!
**iOS**
- We've got some really cool things going on behind the scenes. Stay tuned!
## 7.97 — 09 Dec 2024
**Android**
- We've got some really cool things going on behind the scenes. Stay tuned!
**iOS**
- Bug Fix: Resolved an issue on the timeline screen where information would occasionally overlap
## 7.96 — 27 Nov 2024
**Android**
- Bug Fix: Addressed an issue where in some cases the home tab in the nav bar was missing after a fresh install
- Update: The PagerDuty Community link under Settings → Community Support now directs to our new website ([https://community.pagerduty.com/](https://community.pagerduty.com/))
**iOS**
- Bug Fix: Resolved an issue where the stakeholder update push notification failed to redirect to the correct screen for users logged into multiple accounts
- Update: The PagerDuty Community link under Settings → Community Support now directs to our new website ([https://community.pagerduty.com/](https://community.pagerduty.com/))
## 7.95 — 20 Nov 2024
**Android**
- Bug Fix: Addressed an issue where in some cases the home tab in the nav bar was missing after a fresh install
- Update: The PagerDuty Community link under Settings → Community Support now directs to our new website ([https://community.pagerduty.com/](https://community.pagerduty.com/))
**iOS**
- Bug Fix: Resolved an issue where the stakeholder update push notification failed to redirect to the correct screen for users logged into multiple accounts
- Update: The PagerDuty Community link under Settings → Community Support now directs to our new website ([https://community.pagerduty.com/](https://community.pagerduty.com/))
## 7.94 — 5 Nov 2024
**Android**
- Bug Fix: Addressed an issue where in some cases the home tab in the nav bar was missing after a fresh install
Update: The PagerDuty Community link under Settings → Community Support now directs to our new website ([https://community.pagerduty.com/](https://community.pagerduty.com/))
**iOS**
- Update: The PagerDuty Community link under Settings → Community Support now directs to our new website ([https://community.pagerduty.com/](https://community.pagerduty.com/))
## 7.93 — 29 Oct 2024
**Android**
- Bug Fix: Addressed an issue where in some cases the app consumed more battery than usual during background activities.
**iOS**
- Bug Fix: Addressed an issue where an unresponsive button would occasionally appear in incident actions.
## 7.92 — 22 Oct 2024
**Android**
- Bug Fix: Addressed an issue where in some cases the app consumed more battery than usual during background activities.
**iOS**
- Bug Fix: Addressed an issue where an unresponsive button would occasionally appear in incident actions.
## 7.91 — 15 Oct 2024
**Android**
- Bug Fix: Addressed an issue where in some cases the app consumed more battery than usual during background activities.
**iOS**
- We've got some really cool things going on behind the scenes. Stay tuned!
## 7.90 — 08 Oct 2024
**Android**
- We've got some really cool things going on behind the scenes. Stay tuned!
**iOS**
- We've got some really cool things going on behind the scenes. Stay tuned!
## 7.89 — 01 Oct 2024
**Android**
- Critical Bug Fix: Fixed an issue with Live Call Routing (LCR) where users couldn't listen to recordings from Incident details
**iOS**
- We've got some really cool things going on behind the scenes. Stay tuned!
## 7.88 — 24 Sep 2024
**Android**
- Critical Bug Fix: Fixed an issue with Live Call Routing (LCR) where users couldn't listen to recordings from Incident details
**iOS**
- We've got some really cool things going on behind the scenes. Stay tuned!
## 7.87 — 17 Sep 2024
**Android**
- Critical Bug Fix: Fixed an issue with Live Call Routing (LCR) where users couldn't listen to recordings from Incident details
**iOS**
- We've got some really cool things going on behind the scenes. Stay tuned!
## 7.86 — 10 Sep 2024
**Android**
- Critical Bug Fix: Fixed an issue with Live Call Routing (LCR) where users couldn't listen to recordings from Incident details
**iOS**
- We've got some really cool things going on behind the scenes. Stay tuned!
## 7.85 — 3 Sep 2024
**Android**
- We've got some really cool things going on behind the scenes. Stay tuned!
**iOS**
- We've got some really cool things going on behind the scenes. Stay tuned!
## 7.84 — 27 Aug 2024
**Android**
- You can now view the Slack channel linked to the incident. Just tap the Slack icon on the incident details carousel or overview tab
- Check out our new "Feature Spotlight" screen to stay updated with all the exciting new and existing updates. Simply go to the Home Screen and tap the gift box icon at the top
- You can now set your notification volume directly from the Mobile App. Go to Settings → Enable High-Urgency Override System Volume and adjust the volume.
**iOS**
- You can now view the Slack channel linked to the incident. Just tap the Slack icon on the incident details carousel or overview tab
- Check out our new "Feature Spotlight" screen to stay updated with all the exciting new and existing updates. Simply go to the Home Screen and tap the gift box icon at the top
- We are introducing the new minimum OS requirements to ensure the app continues to be innovative and secure. Our app now requires iOS 16.0 or higher. Please ensure your device is upgraded to continue receiving mobile app updates.
## 7.83 — 20 Aug 2024
**Android**
- You can now view the Slack channel linked to the incident. Just tap the Slack icon on the incident details carousel or overview tab
- Check out our new "Feature Spotlight" screen to stay updated with all the exciting new and existing updates. Simply go to the Home Screen and tap the gift box icon at the top
- You can now set your notification volume directly from the Mobile App. Go to Settings → Enable High-Urgency Override System Volume and adjust the volume.
**iOS**
- You can now view the Slack channel linked to the incident. Just tap the Slack icon on the incident details carousel or overview tab
- Check out our new "Feature Spotlight" screen to stay updated with all the exciting new and existing updates. Simply go to the Home Screen and tap the gift box icon at the top
- We are introducing the new minimum OS requirements to ensure the app continues to be innovative and secure. Our app now requires iOS 16.0 or higher. Please ensure your device is upgraded to continue receiving mobile app updates.
## 7.82 — 13 Aug 2024
**Android**
- You can now view the Slack channel linked to the incident. Just tap the Slack icon on the incident details carousel or overview tab
- Check out our new "Feature Spotlight" screen to stay updated with all the exciting new and existing updates. Simply go to the Home Screen and tap the gift box icon at the top
- You can now set your notification volume directly from the Mobile App. Go to Settings → Enable High-Urgency Override System Volume and adjust the volume.
**iOS**
- You can now view the Slack channel linked to the incident. Just tap the Slack icon on the incident details carousel or overview tab
- Check out our new "Feature Spotlight" screen to stay updated with all the exciting new and existing updates. Simply go to the Home Screen and tap the gift box icon at the top
- We are introducing the new minimum OS requirements to ensure the app continues to be innovative and secure. Our app now requires iOS 16.0 or higher. Please ensure your device is upgraded to continue receiving mobile app updates.
- To improve security, Mobile app login from rooted or jailbroken devices is now blocked
## 7.81 — 6 Aug 2024
**Android**
- You can now view the Slack channel linked to the incident. Just tap the Slack icon on the incident details carousel or overview tab
- Check out our new "Feature Spotlight" screen to stay updated with all the exciting new and existing updates. Simply go to the Home Screen and tap the gift box icon at the top
- You can now set your notification volume directly from the Mobile App. Go to Settings → Enable High-Urgency Override System Volume and adjust the volume.
**iOS**
- You can now view the Slack channel linked to the incident. Just tap the Slack icon on the incident details carousel or overview tab
- Check out our new "Feature Spotlight" screen to stay updated with all the exciting new and existing updates. Simply go to the Home Screen and tap the gift box icon at the top
- We are introducing the new minimum OS requirements to ensure the app continues to be innovative and secure. Our app now requires iOS 16.0 or higher. Please ensure your device is upgraded to continue receiving mobile app updates.
- To improve security, Mobile app login from rooted or jailbroken devices is now blocked
## 7.80 — 30 Jul 2024
**Android**
- Check out our new "Feature Spotlight" screen to stay updated with all the exciting new and existing updates. Simply go to the Home Screen and tap the gift box icon at the top
- You can now set your notification volume directly from the Mobile App. Go to Settings → Enable High-Urgency Override System Volume and adjust the volume.
- New minimum OS req: Our app now requires Android 11 or higher for future updates
**iOS**
- Check out our new "Feature Spotlight" screen to stay updated with all the exciting new and existing updates. Simply go to the Home Screen and tap the gift box icon at the top
- We are introducing the new minimum OS requirements to ensure the app continues to be innovative and secure. Our app now requires iOS 16.0 or higher. Please ensure your device is upgraded to continue receiving mobile app updates.
- To improve security, Mobile app login from rooted or jailbroken devices is now blocked
## 7.79 — 23 Jul 2024
**Android**
- Check out our new "Feature Spotlight" screen to stay updated with all the exciting new and existing updates. Simply go to the Home Screen and tap the gift box icon at the top
- You can now set your notification volume directly from the Mobile App. Go to Settings → Enable High-Urgency Override System Volume and adjust the volume.
- New minimum OS req: Our app now requires Android 11 or higher for future updates
**iOS**
- Check out our new "Feature Spotlight" screen to stay updated with all the exciting new and existing updates. Simply go to the Home Screen and tap the gift box icon at the top
- We are introducing the new minimum OS requirements to ensure the app continues to be innovative and secure. Our app now requires iOS 16.0 or higher. Please ensure your device is upgraded to continue receiving mobile app updates.
- To improve security, Mobile app login from rooted or jailbroken devices is now blocked
## 7.78 — 16 Jul 2024
**Android**
- Check out our new "Feature Spotlight" screen to stay updated with all the exciting new and existing updates. Simply go to the Home Screen and tap the gift box icon at the top
- You can now set your notification volume directly from the Mobile App. Go to Settings → Enable High-Urgency Override System Volume and adjust the volume.
- New minimum OS req: Our app now requires Android 11 or higher for future updates
**iOS**
- Check out our new "Feature Spotlight" screen to stay updated with all the exciting new and existing updates. Simply go to the Home Screen and tap the gift box icon at the top
- We are introducing the new minimum OS requirements to ensure the app continues to be innovative and secure. Our app now requires iOS 16.0 or higher. Please ensure your device is upgraded to continue receiving mobile app updates.
- To improve security, Mobile app login from rooted or jailbroken devices is now blocked
## 7.77 — 9 Jul 2024
**Android**
- You can now set your notification volume directly from the Mobile App. Go to Settings → Enable High-Urgency Override System Volume and adjust the volume.
- New minimum OS req: Our app now requires Android 11 or higher for future updates
- To improve security, Mobile app login from rooted or jailbroken devices is now blocked
**iOS**
- We are introducing the new minimum OS requirements to ensure the app continues to be innovative and secure. Our app now requires iOS 16.0 or higher. Please ensure your device is upgraded to continue receiving mobile app updates.
- To improve security, Mobile app login from rooted or jailbroken devices is now blocked
## 7.76 — 2 Jul 2024
**Android**
- You can now set your notification volume directly from the Mobile App. Go to Settings → Enable High-Urgency Override System Volume and adjust the volume.
- New minimum OS req: Starting June 18, 2024, our app will require Android 11 or higher for future updates
- To improve security, Mobile app login from rooted or jailbroken devices is now blocked
**iOS**
- We are introducing the new minimum OS requirements to ensure the app continues to be innovative and secure. Starting June 18, 2024, the future versions of the app will require iOS 16.0 or higher. Please ensure your device is upgraded to continue receiving mobile app updates.
- To improve security, Mobile app login from rooted or jailbroken devices is now blocked
## 7.75 — 27 Jun 2024
**Android**
- You can now set your notification volume directly from the Mobile App. Go to Settings → Enable High-Urgency Override System Volume and adjust the volume.
- New minimum OS req: Starting June 18, 2024, our app will require Android 11 or higher for future updates
- To improve security, Mobile app login from rooted or jailbroken devices is now blocked
**iOS**
- We are introducing the new minimum OS requirements to ensure the app continues to be innovative and secure. Starting June 18, 2024, the future versions of the app will require iOS 16.0 or higher. Please ensure your device is upgraded to continue receiving mobile app updates.
- To improve security, Mobile app login from rooted or jailbroken devices is now blocked
## 7.74 — 20 Jun 2024
**Android**
- Introducing Widgets! The On Call widget can be added to your phone’s Home screen for easy access to existing & upcoming On-Call shifts info, without even having to open the App
- Introducing Home screen Customization: Add, remove & rearrange cards on your App Home screen
- New minimum OS req: Starting June 18, 2024, our app will require Android 11 or higher for future updates
- To improve security, Mobile app login from rooted or jailbroken devices is now blocked
**iOS**
- Introducing Widgets! Our new On Call widget can be added to your phone’s Home or Lock screen for easy access to your existing and upcoming On-Call shifts information, without even having to open the App
- Introducing Home screen Customization: Add, remove & rearrange cards on your App Home screen
- We are introducing the new minimum OS requirements to ensure the app continues to be innovative and secure. Starting June 18, 2024, the future versions of the app will require iOS 16.0 or higher. Please ensure your device is upgraded to continue receiving mobile app updates.
- To improve security, Mobile app login from rooted or jailbroken devices is now blocked
## 7.73 — 13 Jun 2024
**Android**
- Introducing Widgets! The On Call widget can be added to your phone’s Home screen for easy access to existing & upcoming On-Call shifts info, without even having to open the App
- Introducing Home screen Customization: Add, remove & rearrange cards on your App Home screen
- New minimum OS req: Starting June 18, 2024, our app will require Android 11 or higher for future updates
- To improve security, Mobile app login from rooted or jailbroken devices is now blocked
**iOS**
- Introducing Widgets! Our new On Call widget can be added to your phone’s Home or Lock screen for easy access to your existing and upcoming On-Call shifts information, without even having to open the App
- Introducing Home screen Customization: Add, remove & rearrange cards on your App Home screen
- We are introducing the new minimum OS requirements to ensure the app continues to be innovative and secure. Starting June 18, 2024, the future versions of the app will require iOS 16.0 or higher. Please ensure your device is upgraded to continue receiving mobile app updates.
- To improve security, Mobile app login from rooted or jailbroken devices is now blocked
## 7.72 — 6 Jun 2024
**Android**
- Introducing Widgets! The On Call widget can be added to your phone’s Home screen for easy access to existing & upcoming On-Call shifts info, without even having to open the App
- Introducing Home screen Customization: Add, remove & rearrange cards on your App Home screen
- New minimum OS req: Starting June 18, 2024, our app will require Android 11 or higher for future updates
- To improve security, Mobile app login from rooted or jailbroken devices is now blocked
**iOS**
- Introducing Widgets! Our new On Call widget can be added to your phone’s Home or Lock screen for easy access to your existing and upcoming On-Call shifts information, without even having to open the App
- Introducing Home screen Customization: Add, remove & rearrange cards on your App Home screen
- We are introducing the new minimum OS requirements to ensure the app continues to be innovative and secure. Starting June 18, 2024, the future versions of the app will require iOS 16.0 or higher. Please ensure your device is upgraded to continue receiving mobile app updates.
- To improve security, Mobile app login from rooted or jailbroken devices is now blocked
## 7.71 — 26 May 2024
**Android**
- Introducing Widgets! The On Call widget can be added to your phone’s Home screen for easy access to existing & upcoming On-Call shifts info, without even having to open the App
- Introducing Home screen Customization: Add, remove & rearrange cards on your App Home screen
- New minimum OS req: Starting June 18, 2024, our app will require Android 11 or higher for future updates
- To improve security, Mobile app login from rooted or jailbroken devices is now blocked
**iOS**
- Introducing Widgets! Our new On Call widget can be added to your phone’s Home or Lock screen for easy access to your existing and upcoming On-Call shifts information, without even having to open the App
- Introducing Home screen Customization: Add, remove & rearrange cards on your App Home screen
- We are introducing the new minimum OS requirements to ensure the app continues to be innovative and secure. Starting June 18, 2024, the future versions of the app will require iOS 16.0 or higher. Please ensure your device is upgraded to continue receiving mobile app updates.
- To improve security, Mobile app login from rooted or jailbroken devices is now blocked
## 7.70 — 17 May 2024
**Android**
- Introducing Widgets! The On Call widget can be added to your phone’s Home screen for easy access to existing & upcoming On-Call shifts info, without even having to open the App
- Introducing Home screen Customization: Add, remove & rearrange cards on your App Home screen
- New minimum OS req: Starting June 18, 2024, our app will require Android 11 or higher for future updates
- To improve security, Mobile app login from rooted or jailbroken devices is now blocked
**iOS**
- Introducing Widgets! Our new On Call widget can be added to your phone’s Home or Lock screen for easy access to your existing and upcoming On-Call shifts information, without even having to open the App
- Introducing Home screen Customization: Add, remove & rearrange cards on your App Home screen
- We are introducing the new minimum OS requirements to ensure the app continues to be innovative and secure. Starting June 18, 2024, the future versions of the app will require iOS 16.0 or higher. Please ensure your device is upgraded to continue receiving mobile app updates.
- To improve security, Mobile app login from rooted or jailbroken devices is now blocked
## 7.69 — 09 May 2024
**Android**
- Introducing Widgets! The On Call widget can be added to your phone’s Home screen for easy access to existing & upcoming On-Call shifts info, without even having to open the App
- Introducing Home screen Customization: Add, remove & rearrange cards on your App Home screen
- New minimum OS req: Starting June 18, 2024, our app will require Android 11 or higher for future updates
- To improve security, Mobile app login from rooted or jailbroken devices is now blocked
**iOS**
- Introducing Widgets! Our new On Call widget can be added to your phone’s Home or Lock screen for easy access to your existing and upcoming On-Call shifts information, without even having to open the App
- Introducing Home screen Customization: Add, remove & rearrange cards on your App Home screen
- We are introducing the new minimum OS requirements to ensure the app continues to be innovative and secure. Starting June 18, 2024, the future versions of the app will require iOS 16.0 or higher. Please ensure your device is upgraded to continue receiving mobile app updates.
- To improve security, Mobile app login from rooted or jailbroken devices is now blocked
## 7.68 — 02 May 2024
**Android**
- Introducing Widgets! Our new On Call widget can be added to your phone’s Home screen for easy access to your existing and upcoming On-Call shifts information, without even having to open the App
- We are introducing the new minimum OS requirements. Starting June 18, 2024, our app will require Android 11 or higher for future updates. Upgrade your device to keep receiving app updates
- To improve security, Mobile app login from rooted or jailbroken devices is now blocked
**iOS**
- Introducing Widgets! Our new On Call widget can be added to your phone’s Home or Lock screen for easy access to your existing and upcoming On-Call shifts information, without even having to open the App
- We are introducing the new minimum OS requirements to ensure the app continues to be innovative and secure. Starting June 18, 2024, the future versions of the app will require iOS 16.0 or higher. Please ensure your device is upgraded to continue receiving mobile app updates.
- To improve security, Mobile app login from rooted or jailbroken devices is now blocked
## 7.66 — 18 Apr 2024
**Android**
- To improve security, Mobile app login from rooted or jailbroken devices is now blocked.
**iOS**
- To improve security, Mobile app login from rooted or jailbroken devices is now blocked.
## 7.64 — 4 Apr 2024
**Android**
- We've got some really cool things going on behind the scenes. Stay tuned!
**iOS**
- We've got some really cool things going on behind the scenes. Stay tuned!.
## 7.63 — 28 Mar 2024
**Android**
- We've got some really cool things going on behind the scenes. Stay tuned!
**iOS**
- We've got some really cool things going on behind the scenes. Stay tuned!.
## 7.62 — 21 Mar 2024
**Android**
- We've got some really cool things going on behind the scenes. Stay tuned!
**iOS**
- We've got some really cool things going on behind the scenes. Stay tuned!.
## 7.61 — 11 Mar 2024
**Android**
- We've got some really cool things going on behind the scenes. Stay tuned!
**iOS**
- We've got some really cool things going on behind the scenes. Stay tuned!.
## 7.60 — 7 Mar 2024
**Android**
- We've got some really cool things going on behind the scenes. Stay tuned!
**iOS**
- We've got some really cool things going on behind the scenes. Stay tuned!.
## 7.58 — 22 Feb 2024
**Android**
- Introducing the Analytics Card on App Home Screen! Monitor your team's MTTA and MTTR, plus the count and details of High Urgency Incidents from the previous month until yesterday. It highlights the specific date range covered and compares trends with data from 30 days before the selected period.
- App Tip Notifications will occasionally notify you about new features and PagerDuty tips. To disable them Navigate to More (Settings) and toggle App Tip Notifications.
**iOS**
- Introducing the Analytics Card on App Home Screen! Monitor your team's MTTA and MTTR, plus the count and details of High Urgency Incidents from the previous month until yesterday. It highlights the specific date range covered and compares trends with data from 30 days before the selected period.
- Bug fix for app crash when users access 'PagerDuty System Status' on the Settings screen
- Bug fix for an intermittent app crash when users are on the Landscape Mode
- App Tip Notifications will occasionally notify you about new features and PagerDuty tips. To disable them Navigate to More (Settings) and toggle App Tip Notifications.
## 7.57 — 16 Feb 2024
**Android**
- Introducing the Analytics Card on App Home Screen! Monitor your team's MTTA and MTTR, plus the count and details of High Urgency Incidents from the previous month until yesterday. It highlights the specific date range covered and compares trends with data from 30 days before the selected period.
- App Tip Notifications will occasionally notify you about new features and PagerDuty tips. To disable them Navigate to More (Settings) and toggle App Tip Notifications.
**iOS**
- Introducing the Analytics Card on App Home Screen! Monitor your team's MTTA and MTTR, plus the count and details of High Urgency Incidents from the previous month until yesterday. It highlights the specific date range covered and compares trends with data from 30 days before the selected period.
- Bug fix for app crash when users access 'PagerDuty System Status' on the Settings screen
- Bug fix for an intermittent app crash when users are on the Landscape Mode
- App Tip Notifications will occasionally notify you about new features and PagerDuty tips. To disable them Navigate to More (Settings) and toggle App Tip Notifications.
## 7.55.1 — 1 Feb 2024
**Android**
- Introducing the Analytics Card on App Home Screen! Monitor your team's MTTA and MTTR, plus the count and details of High Urgency Incidents from the previous month until yesterday. It highlights the specific date range covered and compares trends with data from 30 days before the selected period.
- Bug fix for app crash when users access 'PagerDuty System Status' on the Settings screen
- App Tip Notifications will occasionally notify you about new features and PagerDuty tips. To disable them Navigate to More (Settings) and toggle App Tip Notifications.
**iOS**
- Introducing the Analytics Card on App Home Screen! Monitor your team's MTTA and MTTR, plus the count and details of High Urgency Incidents from the previous month until yesterday. It highlights the specific date range covered and compares trends with data from 30 days before the selected period.
- Bug fix for app crash when users access 'PagerDuty System Status' on the Settings screen
- App Tip Notifications will occasionally notify you about new features and PagerDuty tips. To disable them Navigate to More (Settings) and toggle App Tip Notifications.
## 7.54.1 — 24 Jan 2024
**Android**
- Introducing the Analytics Card on App Home Screen! Monitor your team's MTTA and MTTR, plus the count and details of High Urgency Incidents from the previous month until yesterday. It highlights the specific date range covered and compares trends with data from 30 days before the selected period.
- App Tip Notifications will occasionally notify you about new features and PagerDuty tips. To disable them Navigate to More (Settings) and toggle App Tip Notifications.
**iOS**
- Introducing the Analytics Card on App Home Screen! Monitor your team's MTTA and MTTR, plus the count and details of High Urgency Incidents from the previous month until yesterday. It highlights the specific date range covered and compares trends with data from 30 days before the selected period.
- App Tip Notifications will occasionally notify you about new features and PagerDuty tips. To disable them Navigate to More (Settings) and toggle App Tip Notifications.
## 7.54 — 23 Jan 2024
**Android**
- Introducing the Analytics Card on App Home Screen! Monitor your team's MTTA and MTTR, plus the count and details of High Urgency Incidents from the previous month until yesterday. It highlights the specific date range covered and compares trends with data from 30 days before the selected period.
- App Tip Notifications will occasionally notify you about new features and PagerDuty tips. To disable them Navigate to More (Settings) and toggle App Tip Notifications.
**iOS**
- Introducing the Analytics Card on App Home Screen! Monitor your team's MTTA and MTTR, plus the count and details of High Urgency Incidents from the previous month until yesterday. It highlights the specific date range covered and compares trends with data from 30 days before the selected period.
- App Tip Notifications will occasionally notify you about new features and PagerDuty tips. To disable them Navigate to More (Settings) and toggle App Tip Notifications.
## 7.53.1 — 18 Jan 2024
**Android**
- Introducing the Analytics Card on App Home Screen! Monitor your team's MTTA and MTTR, plus the count and details of High Urgency Incidents from the previous month until yesterday. It highlights the specific date range covered and compares trends with data from 30 days before the selected period.
- Bug fix for app crash when users access 'PagerDuty System Status' in the Settings screen.
**iOS**
- Introducing the Analytics Card on App Home Screen! Monitor your team's MTTA and MTTR, plus the count and details of High Urgency Incidents from the previous month until yesterday. It highlights the specific date range covered and compares trends with data from 30 days before the selected period.
- App Tip Notifications will occasionally notify you about new features and PagerDuty tips. You can disable them from the App Settings. Navigate to More (Settings) and toggle App Tip Notifications.
## 7.53 — 16 Jan 2024
**Android**
- Introducing the Analytics Card on App Home Screen! Monitor your team's MTTA and MTTR, plus the count and details of High Urgency Incidents from the previous month until yesterday. It highlights the specific date range covered and compares trends with data from 30 days before the selected period.
- Bug fix for app crash when users access 'PagerDuty System Status' in the Settings screen.
**iOS**
- Introducing the Analytics Card on App Home Screen! Monitor your team's MTTA and MTTR, plus the count and details of High Urgency Incidents from the previous month until yesterday. It highlights the specific date range covered and compares trends with data from 30 days before the selected period.
## 7.52 — 8 Jan 2024
**Android**
- Introducing the Analytics Card on App Home Screen! Monitor your team's MTTA and MTTR, plus the count and details of High Urgency Incidents from the previous month until yesterday. It highlights the specific date range covered and compares trends with data from 30 days before the selected period.
- Bug fix for app crash when users access 'PagerDuty System Status' in the Settings screen.
**iOS**
- Introducing the Analytics Card on App Home Screen! Monitor your team's MTTA and MTTR, plus the count and details of High Urgency Incidents from the previous month until yesterday. It highlights the specific date range covered and compares trends with data from 30 days before the selected period.
## 7.51 — 4 Jan 2024
**Android**
- We've addressed a bug causing the app to crash when attempting to access 'PagerDuty System Status' in the Settings screen
- We've resolved a bug that led to app crashes in certain scenarios when users attempted to log out of their accounts
- You can now trigger a New Incident from the Home Screen
**iOS**
- We've addressed a bug causing the app to crash when attempting to access 'PagerDuty System Status' in the Settings screen
- We've resolved a bug that led to app crashes in certain scenarios when users attempted to log out of their accounts
- You can now trigger a New Incident from the Home Screen
---
URL: https://docs.pagerduty.com/get-started/mobile-release-notes/mobile-release-notes-archive
# Mobile Release Notes (Archive)
An archive of older PagerDuty mobile app release notes for iOS and Android versions no longer listed on the current page.
## 7.50 — 21 Dec 2023
**Android**
- Triggering an incident is now much easier with the 'New Incident' button on the Home Screen
- Resolved critical Android 14 login issue.
- Fixed country code picker bug when adding a contact on the profile page.
**iOS**
- We've got some really cool things going on behind the scenes. Stay tuned!
## 7.49 — 14 Dec 2023
**Android**
- We've addressed a bug causing the app to crash when attempting to access 'PagerDuty System Status' in the Settings screen
- We've resolved a bug that led to app crashes in certain scenarios when users attempted to log out of their accounts.
- You can now trigger a New Incident from the Home Screen
**iOS**
- We've addressed a bug causing the app to crash when attempting to access 'PagerDuty System Status' in the Settings screen
- We've resolved a bug that led to app crashes in certain scenarios when users attempted to log out of their accounts.
- You can now trigger a New Incident from the Home Screen
##
## 7.48 — 07 Dec 2023
**Android**
- Triggering an incident is now much easier with the 'New Incident' button on the Home Screen
- Resolved critical Android 14 login issue.
- Fixed country code picker bug when adding a contact on the profile page.
**iOS**
- We've got some really cool things going on behind the scenes. Stay tuned!
## 7.47 — 30 Nov 2023
**Android**
- Stay informed on disruptions effortlessly with our latest mobile app update! Introducing the new Status Dashboard Card, on your Mobile Home Screen. Easily monitor your top three affected Business Services, sorted by priority. Simply choose your preferred dashboards from the Status Dashboard Screen, accessible in the 'More' Tab.
Other Updates:
- Resolved critical Android 14 login issue
- Fixed country code picker bug when adding a contact on the profile page
**iOS**
- Stay informed on disruptions effortlessly with our latest mobile app update! Introducing the new Status Dashboard Card, on your Mobile Home Screen. Easily monitor your top three affected Business Services, sorted by priority. Simply choose your preferred dashboards from the Status Dashboard Screen, accessible in the 'More' Tab.
## 7.46 — 20 Nov 2023
**Android**
- Stay informed on disruptions effortlessly with our latest mobile app update! Introducing the new Status Dashboard Card, on your Mobile Home Screen. Easily monitor your top three affected Business Services, sorted by priority. Simply choose your preferred dashboards from the Status Dashboard Screen, accessible in the 'More' Tab.
**Attention Android 14 Users**: In this release, we've addressed a critical login issue specifically affecting devices on Android 14.
**iOS**
- Stay informed on disruptions effortlessly with our latest mobile app update! Introducing the new Status Dashboard Card, on your Mobile Home Screen. Easily monitor your top three affected Business Services, sorted by priority. Simply choose your preferred dashboards from the Status Dashboard Screen, accessible in the 'More' Tab.
## 7.45 — 14 Nov 2023
**Android**
- Stay informed on disruptions effortlessly with our latest mobile app update! Introducing the new Status Dashboard Card, on your Mobile Home Screen. Easily monitor your top three affected Business Services, sorted by priority. Simply choose your preferred dashboards from the Status Dashboard Screen, accessible in the 'More' Tab.
**Attention Android 14 Users**: In this release, we've addressed a critical login issue specifically affecting devices on Android 14.
**iOS**
- Stay informed on disruptions effortlessly with our latest mobile app update! Introducing the new Status Dashboard Card, on your Mobile Home Screen. Easily monitor your top three affected Business Services, sorted by priority. Simply choose your preferred dashboards from the Status Dashboard Screen, accessible in the 'More' Tab.
## 7.43 — 30 Oct 2023
**Android**
- Stay informed on disruptions effortlessly with our latest mobile app update! Introducing the new Status Dashboard Card, on your Mobile Home Screen. Easily monitor your top three affected Business Services, sorted by priority. Simply choose your preferred dashboards from the Status Dashboard Screen, accessible in the 'More' Tab.
**Attention Android 14 Users**: In this release, we've addressed a critical login issue specifically affecting devices on Android 14.
**iOS**
- Stay informed on disruptions effortlessly with our latest mobile app update! Introducing the new Status Dashboard Card, on your Mobile Home Screen. Easily monitor your top three affected Business Services, sorted by priority. Simply choose your preferred dashboards from the Status Dashboard Screen, accessible in the 'More' Tab.
## 7.42 — 23 Oct 2023
**Android** → **Attention Android 14 Users**: In this release, we've addressed a critical login issue specifically affecting devices on Android 14. We understand how crucial it is for you to have a seamless experience, and this update ensures that the PagerDuty Mobile app continues to work flawlessly.
Other Updates:
- You can update your High Urgency Notification Rules: Choose Preset options or customize with 'Advanced Rules'. To access this, navigate to Profile → Update Notification Preference
**iOS**
- We've got some really cool things going on behind the scenes. Stay tuned!
## 7.41 — 16 Oct 2023
**Android** → **Attention Android 14 Users**: In this release, we've addressed a critical login issue specifically affecting devices on Android 14. We understand how crucial it is for you to have a seamless experience, and this update ensures that the PagerDuty Mobile app continues to work flawlessly.
Other Updates:
- Behind the scenes Android 13 compatibility updates.
- Added Notification Permission prompts during onboarding for Android 13 users.
**iOS**
- You can now update your High Urgency Notification Preferences from Pre-configured and Recommended options or tailor your own notification rules using 'Advanced Notification Rules'. To access this feature, simply navigate to Settings → Notification Preference
## 7.40 — 9 Oct 2023
**Android** → **Attention Android 14 Users**: In this release, we've addressed a critical login issue specifically affecting devices on Android 14. We understand how crucial it is for you to have a seamless experience, and this update ensures that the PagerDuty Mobile app continues to work flawlessly.
Other Updates:
- Behind the scenes Android 13 compatibility updates.
- Added Notification Permission prompts during onboarding for Android 13 users.
**iOS**
- You can now update your High Urgency Notification Preferences from Pre-configured and Recommended options or tailor your own notification rules using 'Advanced Notification Rules'. To access this feature, simply navigate to Settings → Notification Preference
## 7.39 — 2 Oct 2023
**Android**
- We've got some really cool things going on behind the scenes. Stay tuned!
**iOS**
- You can now update your High Urgency Notification Preferences from Pre-configured and Recommended options or tailor your own notification rules using 'Advanced Notification Rules'. To access this feature, simply navigate to Settings → Notification Preference
## 7.38 — 25 Sept 2023
**Android**
- We've got some really cool things going on behind the scenes. Stay tuned!
**iOS**
- We've got some really cool things going on behind the scenes. Stay tuned!
## 7.37 — 18 Sept 2023
**Android**
- Addressed an intermittent crash occurring on the Home screen.
- Bug fix for crashes on the Profile Screen in certain use cases.
**iOS**
- We've got some really cool things going on behind the scenes. Stay tuned!
## 7.36 — 11 Sept 2023
**Android**
- Addressed an intermittent crash occurring on the Home screen.
- Bug fix for crashes on the Profile Screen in certain use cases.
**iOS**
- We've got some really cool things going on behind the scenes. Stay tuned!
## 7.35 — 5 Sept 2023
**Android**
- Addressed an intermittent crash occurring on the Home screen.
- Bug fix for crashes on the Profile Screen in certain use cases.
**iOS**
- We've got some really cool things going on behind the scenes. Stay tuned!
## 7.34 — 28 Aug 2023
**Android**
- Fixed a bug where the Incident Workflows list occasionally failed to load.
- Implemented a major behind-the-scenes refactor to increase app performance and stability.
**iOS**
- Incase you log out of the app, your previous Mobile Notification Preferences will still be retained.
- Fixed the bug where the 'High Urgency' audio tone is set back to default after you log out.
- Fixed an issue where some users with multiple accounts were shown a blank screen after being logged out due to session timeout.
## 7.33 — 22 Aug 2023
**Android**
- Fixed a bug where the Incident Workflows list occasionally failed to load.
- Implemented a major behind-the-scenes refactor to increase app performance and stability.
**iOS**
- Incase you log out of the app, your previous Mobile Notification Preferences will still be retained.
- Fixed the bug where the 'High Urgency' audio tone is set back to default after you log out.
- Fixed an issue where some users with multiple accounts were shown a blank screen after being logged out due to session timeout.
## 7.32 — 14 Aug 2023
**Android**
- Fixed a bug where the Incident Workflows list occasionally failed to load.
- Implemented a major behind-the-scenes refactor to increase app performance and stability.
**iOS**
- Incase you log out of the app, your previous Mobile Notification Preferences will still be retained.
- Fixed the bug where the 'High Urgency' audio tone is set back to default after you log out.
- Fixed an issue where some users with multiple accounts were shown a blank screen after being logged out due to session timeout.
## 7.30.1 — 01 Aug 2023
**Android**
- Implemented a major behind-the-scenes refactor to increase app performance and stability.
**iOS**
- In case you log out of the app, your previous Mobile Notification Preferences will still be retained.
- Fixed the bug where the 'High Urgency' audio tone is set back to default after you log out.
- Fixed an issue where some users with multiple accounts were shown a blank screen after being logged out due to session timeout.
## 7.30 — 31 Jul 2023
**Android**
- Implemented a major behind-the-scenes refactor to increase app performance and stability.
**iOS**
- Bug Fixes around rare use cases where users were unintentionally being logged out of the app.
## 7.29 — 24 Jul 2023
**Android**
- Minor UI fixes on Schedules Screen for certain Account types.
**iOS**
- Bug Fixes around rare use cases where users were unintentionally being logged out of the app.
## 7.28 — 17 Jul 2023
**Android**
- Introducing Modernized navigation. Switch screens seamlessly, bypassing the hidden hamburger menu. Your navigation history is now preserved even while you simultaneously navigate multiple screens.
- You can now view Custom Fields on the Incident details screen. Custom Fields allows you to pull in important incident data from any system of record and put it at the fingertips of responders so they have the information needed to resolve incidents faster.
**iOS**
- You can now view Custom Fields on the Incident details screen. Custom Fields allows you to pull in important incident data from any system of record and put it at the fingertips of responders so they have the information needed to resolve incidents faster.
## 7.27 — 11 Jul 2023
**Android**
- Introducing Modernized navigation. Switch screens seamlessly, bypassing the hidden hamburger menu. Your navigation history is now preserved even while you simultaneously navigate multiple screens.
- You can now view Custom Fields on the Incident details screen. Custom Fields allows you to pull in important incident data from any system of record and put it at the fingertips of responders so they have the information needed to resolve incidents faster
**iOS**
- You can now view Custom Fields on the Incident details screen. Custom Fields allows you to pull in important incident data from any system of record and put it at the fingertips of responders so they have the information needed to resolve incidents faster.
## 7.26 — 26 Jun 2023
**Android**
- Introducing Modernized navigation. Switch screens seamlessly, bypassing the hidden hamburger menu. Your navigation history is now preserved even while you simultaneously navigate multiple screens
- You can now view Custom Fields on the Incident details screen. Custom Fields allows you to pull in important incident data from any system of record and put it at the fingertips of responders so they have the information needed to resolve incidents faster
**iOS**
- You can now view Custom Fields on the Incident details screen. Custom Fields allows you to pull in important incident data from any system of record and put it at the fingertips of responders so they have the information needed to resolve incidents faster.
## 7.25 — 20 Jun 2023
**Android**
- Introducing Modernized navigation. Switch screens seamlessly, bypassing the hidden hamburger menu. Your navigation history is now preserved even while you simultaneously navigate multiple screens
- You can now view Custom Fields on the Incident details screen. Custom Fields allows you to pull in important incident data from any system of record and put it at the fingertips of responders so they have the information needed to resolve incidents faster
**iOS**
- You can now view Custom Fields on the Incident details screen. Custom Fields allows you to pull in important incident data from any system of record and put it at the fingertips of responders so they have the information needed to resolve incidents faster.
## 7.24 — 12 Jun 2023
**Android**
- Bug fix for intermittent crash during the multi-selection of incidents
**iOS**
- We have revamped our error messaging to provide clearer and more user-friendly error messages
## 7.23 — 5 Jun 2023
**Android**
- We have introduced the new minimum OS requirements to ensure the app continues to be innovative and secure. As a result, the current and future versions of the app will require Android 10.0 or higher. Please ensure your device is upgraded to continue receiving mobile app updates.
**iOS**
- We have revamped our error messaging to provide clearer and more user-friendly error messages
## 7.22 — 29 May 2023
**Android**
- We have introduced the new minimum OS requirements to ensure the app continues to be innovative and secure. As a result, the current and future versions of the app will require Android 10.0 or higher. Please ensure your device is upgraded to continue receiving mobile app updates.
**iOS**
- We have revamped our error messaging to provide clearer and more user-friendly error messages
## 7.21 — 23 May 2023
**Android**
- We have introduced the new minimum OS requirements to ensure the app continues to be innovative and secure. As a result, the current and future versions of the app will require Android 10.0 or higher. Please ensure your device is upgraded to continue receiving mobile app updates.
- Bug fix for app crashes
**iOS**
- We have introduced the new minimum OS requirements to ensure the app continues to be innovative and secure. As a result, the current and future versions of the app will require iOS 15.0 or higher. Please ensure your device is upgraded to continue receiving mobile app updates.
## 7.20 — 15 May 2023
**Android**
- Bug fix for app crashes
- We have introduced the new minimum OS requirements to ensure the app continues to be innovative and secure. As a result, this will be the last version to support Android 9. The future versions of the app will require Android 10.0 or higher. Please ensure your device is upgraded to continue receiving mobile app updates.
**iOS**
- We have introduced the new minimum OS requirements to ensure the app continues to be innovative and secure. As a result, the current and future versions of the app will require iOS 15.0 or higher. Please ensure your device is upgraded to continue receiving mobile app updates.
## 7.19 — 8 May 2023
**iOS**
- We have introduced the new minimum OS requirements to ensure the app continues to be innovative and secure. As a result, the current and future versions of the app will require iOS 15.0 or higher. Please ensure your device is upgraded to continue receiving mobile app updates.
## 7.18 — 24 Apr 2023
**Android**
- We have fixed the bug where sometimes tapping on a notification would lead to a blank page
- We are introducing the new minimum OS requirements to ensure the app continues to be innovative and secure. Starting May 1, 2023, the future versions of the app will require Android 10.0 or higher. Please ensure your device is upgraded to continue receiving mobile app updates.
**iOS**
- Introducing Modernized navigation on Mobile: With Modernized Navigation, you can switch between screens easily without the need to tap the hidden Hamburger Menu and relaunch the screens. This upgrade means you can move from one screen to another quickly and without any extra steps. Additionally, your history will be preserved even while you simultaneously navigate multiple screens.
- We are introducing the new minimum OS requirements to ensure the app continues to be innovative and secure. Starting May 1, 2023, the future versions of the app will require iOS 15.0 or higher. Please ensure your device is upgraded to continue receiving mobile app updates.
## 7.17 — 17 Apr 2023
**Android**
- We have fixed the bug where sometimes tapping on a notification would lead to a blank page
- We are introducing the new minimum OS requirements to ensure the app continues to be innovative and secure. Starting May 1, 2023, the future versions of the app will require Android 10.0 or higher. Please ensure your device is upgraded to continue receiving mobile app updates.
**iOS**
- Introducing Modernized navigation on Mobile: With Modernized Navigation, you can switch between screens easily without the need to tap the hidden Hamburger Menu and relaunch the screens. This upgrade means you can move from one screen to another quickly and without any extra steps. Additionally, your history will be preserved even while you simultaneously navigate multiple screens.
- We are introducing the new minimum OS requirements to ensure the app continues to be innovative and secure. Starting May 1, 2023, the future versions of the app will require iOS 15.0 or higher. Please ensure your device is upgraded to continue receiving mobile app updates.
## 7.16 — 10 Apr 2023
**Android**
- We have fixed the bug where sometimes tapping on a notification would lead to a blank page
- We are introducing the new minimum OS requirements to ensure the app continues to be innovative and secure. Starting May 1, 2023, the future versions of the app will require Android 10.0 or higher. Please ensure your device is upgraded to continue receiving mobile app updates.
**iOS**
- Introducing Modernized navigation on Mobile: With Modernized Navigation, you can switch between screens easily without the need to tap the hidden Hamburger Menu and relaunch the screens. This upgrade means you can move from one screen to another quickly and without any extra steps. Additionally, your history will be preserved even while you simultaneously navigate multiple screens.
- We are introducing the new minimum OS requirements to ensure the mobile app continues to be innovative and secure and improve the user experience. Starting May 1, 2023, the future versions of the PagerDuty mobile app will require iOS 15.0 or higher. Please ensure your device is upgraded to continue receiving mobile app updates.
## 7.15 — 3 Apr 2023
**Android**
- We've got some really cool things going on behind the scenes. Stay tuned!
**iOS**
- Introducing Modernized navigation on Mobile: With Modernized Navigation, you can switch between screens easily without the need to tap the hidden Hamburger Menu and relaunch the screens. This upgrade means you can move from one screen to another quickly and without any extra steps. Additionally, your history will be preserved even while you simultaneously navigate multiple screens.
## 7.14 — 20 Mar 2023
**Android**
- We've got some really cool things going on behind the scenes. Stay tuned!
**iOS**
- Triggering an incident is now much easier with the 'New Incident' button on the Home Screen
- Requested responders can now ack/resolve/snooze incidents during a coordinated response
## 7.13 — 14 Mar 2023
**Android**
- We've got some really cool things going on behind the scenes. Stay tuned!
**iOS**
- Triggering an incident is now much easier with the 'New Incident' button on the Home Screen
- Requested responders can now ack/resolve/snooze incidents during a coordinated response
- Fixed the bug where hyperlinks in the incident's overview status update could not be tapped
## 7.12 — 6 Mar 2023
**Android**
- We've got some really cool things going on behind the scenes. Stay tuned!
**iOS**
- Triggering an incident is now much easier with the 'New Incident' button on the Home Screen
- Requested responders can now ack/resolve/snooze incidents during a coordinated response
- Fixed the bug where hyperlinks in the incident's overview status update could not be tapped
## 7.11 — 27 Feb 2023
**Android**
- We've got some really cool things going on behind the scenes. Stay tuned!
**iOS**
- Triggering an incident is now much easier with the 'New Incident' button on the Home Screen
- Fixed a bug where on-call shifts could show up twice on the Home Screen
- Fixed a crash that some users may have experienced on the Service Details screen
## 7.10 — 21 Feb 2023
**Android**
- Optimized overall App performance
- We've got some really cool things going on behind the scenes. Stay tuned!
**iOS**
- Triggering an incident is now much easier with the 'New Incident' button on the Home Screen
- Fixed a bug where on-call shifts could show up twice on the Home Screen
- Fixed a crash that some users may have experienced on the Service Details screen
## 7.09 — 13 Feb 2023
**Android**
- Optimized overall App performance
- We've got some really cool things going on behind the scenes. Stay tuned!
**iOS**
- Bug fix for intermittent app crash when schedules dates are updated
- We've got some really cool things going on behind the scenes. Stay tuned!
## 7.08 — 6 Feb 2023
**Android**
- Introducing the Mobile Home Screen. The new Home screen highlights top open incidents, and displays on-call shift and service information, which broadens awareness and streamlines navigation to other important, non-incident information.
- Optimized overall App performance
**iOS**
- Introducing the Mobile Home Screen. The new Home screen highlights top open incidents, and displays on-call shift and service information, which broadens awareness and streamlines navigation to other important, non-incident information.
## 7.07 — 30 Jan 2023
**Android**
- Introducing the Mobile Home Screen. The new Home screen highlights top open incidents, and displays on-call shift and service information, which broadens awareness and streamlines navigation to other important, non-incident information.
- Bug fix for the intermittent App crash when the Incident detail section is tapped
**iOS**
- Introducing the Mobile Home Screen. The new Home screen highlights top open incidents, and displays on-call shift and service information, which broadens awareness and streamlines navigation to other important, non-incident information.
- Optimized overall App performance
## 7.06 — 25 Jan 2023
**Android**
- Introducing the Mobile Home Screen. The new Home screen highlights top open incidents, and displays on-call shift and service information, which broadens awareness and streamlines navigation to other important, non-incident information.
- Optimized overall App performance
**iOS**
- Introducing the Mobile Home Screen. The new Home screen highlights top open incidents, and displays on-call shift and service information, which broadens awareness and streamlines navigation to other important, non-incident information.
- Bug fix for the issue where tapping "Show more" on the incident page didn't display the data
- Bug fix for broken links when the URL contains spaces
## 7.05 — 16 Jan 2023
**Android**
- Introducing the Mobile Home Screen. The new Home screen highlights top open incidents, and displays on-call shift and service information, which broadens awareness and streamlines navigation to other important, non-incident information.
- Bug fix for when the App hangs after app lock is enabled or when the user switches themes
**iOS**
- Introducing the Mobile Home Screen. The new Home screen highlights top open incidents, and displays on-call shift and service information, which broadens awareness and streamlines navigation to other important, non-incident information.
- Bug fix for the App crash on iPad, when the share icon is tapped
- Bug fix for broken links when the URL contains spaces
Thanks for all the great feedback! Email [support@pagerduty.com](mailto:support@pagerduty.com) with any comments.
## 7.04 — 9 Jan 2023
**Android**
- We're like chefs in a kitchen cooking up features behind-the-scenes.
**iOS**
- We're like chefs in a kitchen cooking up features behind-the-scenes.
Thanks for all the great feedback! Email [support@pagerduty.com](mailto:support@pagerduty.com) with any comments.
## 7.03 — 3 Jan 2023
**Android**
- We're like chefs in a kitchen cooking up features behind-the-scenes.
**iOS**
- We're like chefs in a kitchen cooking up features behind-the-scenes.
Thanks for all the great feedback! Email [support@pagerduty.com](mailto:support@pagerduty.com) with any comments.
## 7.02 — 19 Dec 2022
**Android**
- We increased the font size on a few screens for better readability
- We made performance improvements to help get your incident data faster
**iOS**
- We increased the font size on a few screens for better readability
- We made performance improvements to help get your incident data faster
Thanks for all the great feedback! Email [support@pagerduty.com](mailto:support@pagerduty.com) with any comments.
## 7.01 — 12 Dec 2022
**Android**
- We're like chefs in a kitchen cooking up features behind-the-scenes.
**iOS**
- We're like chefs in a kitchen cooking up features behind-the-scenes.
Thanks for all the great feedback! Email [support@pagerduty.com](mailto:support@pagerduty.com) with any comments.
## 7.00 — 5 Dec 2022
**Android**
- Updated snackbar colors for better contrast in light & dark mode
- Updated default secondary sort on the Open Incidents screen
**iOS**
- Updated default secondary sort on the Open Incidents screen
- Fixed a bug in the service details screen correcting the behavior of the loading indicators
Thanks for all the great feedback! We're always looking for ways to improve the app. Email [support@pagerduty.com](mailto:support@pagerduty.com) with any comments.
## 6.99 — 28 Nov 2022
**Android**
- We're like chefs in a kitchen cooking up features behind the scenes.
**iOS**
- We're like chefs in a kitchen cooking up features behind the scenes.
Thanks for all the great feedback! We're always looking for ways to improve the app. Email [support@pagerduty.com](mailto:support@pagerduty.com) with any comments.
## 6.98 — 21 Nov 2022
**Android**
- We're like chefs in a kitchen cooking up features behind the scenes.
**iOS**
- We're like chefs in a kitchen cooking up features behind the scenes.
Thanks for all the great feedback! We're always looking for ways to improve the app. Email [support@pagerduty.com](mailto:support@pagerduty.com) with any comments.
## 6.97 — 14 Nov 2022
**Android**
- We're like chefs in a kitchen cooking up features behind the scenes.
**iOS**
- We're like chefs in a kitchen cooking up features behind the scenes.
Thanks for all the great feedback! We're always looking for ways to improve the app. Email [support@pagerduty.com](mailto:support@pagerduty.com) with any comments.
## 6.96 — 7 Nov 2022
**Android**
- We're like chefs in a kitchen cooking up features behind the scenes.
**iOS**
- We're like chefs in a kitchen cooking up features behind the scenes.
Thanks for all the great feedback! We're always looking for ways to improve the app. Email [support@pagerduty.com](mailto:support@pagerduty.com) with any comments.
## 6.95 — 31 Oct 2022
**Android**
- We've got some really cool things going on behind the scenes. Stay tuned!
**iOS**
- We've got some really cool things going on behind the scenes. Stay tuned!
Thanks for all the great feedback! We're always looking for ways to improve the app. Email [support@pagerduty.com](mailto:support@pagerduty.com) with any comments.
## 6.94 — 24 Oct 2022
**Android**
- The Open Incidents screen will now remember your previously viewed tab so you can access them faster, reducing the number of navigation taps.
**iOS**
- The Open Incidents screen will now remember your previously viewed tab so you can access them faster, reducing the number of navigation taps.
Thanks for all the great feedback! We're always looking for ways to improve the app. Email [support@pagerduty.com](mailto:support@pagerduty.com) with any comments.
## 6.93 — 17 Oct 2022
**Android**
- We've got some really cool things going on behind the scenes. Stay tuned!
**iOS**
- We've got some really cool things going on behind the scenes. Stay tuned!
Thanks for all the great feedback! We're always looking for ways to improve the app. Email [support@pagerduty.com](mailto:support@pagerduty.com) with any comments.
## 6.92 — 10 Oct 2022
**Android**
- We've got some really cool things going on behind the scenes. Stay tuned!
**iOS**
- We've got some really cool things going on behind the scenes. Stay tuned!
Thanks for all the great feedback! We're always looking for ways to improve the app. Email [support@pagerduty.com](mailto:support@pagerduty.com) with any comments.
## 6.91 — 26 Sep 2022
**Android**
- We've got some really cool things going on behind the scenes. Stay tuned!
**iOS**
- We've got some really cool things going on behind the scenes. Stay tuned!
Thanks for all the great feedback! We're always looking for ways to improve the app. Email [support@pagerduty.com](mailto:support@pagerduty.com) with any comments.
## 6.90 — 19 Sep 2022
**Android**
- We've got some really cool things going on behind the scenes. Stay tuned!
**iOS**
- We've got some really cool things going on behind the scenes. Stay tuned!
Thanks for all the great feedback! We're always looking for ways to improve the app. Email [support@pagerduty.com](mailto:support@pagerduty.com) with any comments.
## 6.89 — 12 Sep 2022
**Android**
- We've got some really cool things going on behind the scenes. Stay tuned!
**iOS**
- We've got some really cool things going on behind the scenes. Stay tuned!
Thanks for all the great feedback! We're always looking for ways to improve the app. Email [support@pagerduty.com](mailto:support@pagerduty.com) with any comments.
## 6.88 — 5 Sep 2022
**Android**
- We've got some really cool things going on behind the scenes. Stay tuned!
**iOS**
- We've got some really cool things going on behind the scenes. Stay tuned!
Thanks for all the great feedback! We're always looking for ways to improve the app. Email [support@pagerduty.com](mailto:support@pagerduty.com) with any comments.
## 6.87 — 29 Aug 2022
**Android**
- We've got some really cool things going on behind the scenes. Stay tuned!
**iOS**
- We've got some really cool things going on behind the scenes. Stay tuned!
Thanks for all the great feedback! We're always looking for ways to improve the app. Email [support@pagerduty.com](mailto:support@pagerduty.com) with any comments.
## 6.86 — 22 Aug 2022
**Android**
- Ever wish you could pause time? Us too! We haven't figured that one out yet, but we have brought you the convenience of Maintenance Windows. Now you can create, update, and delete Maintenance Windows on the go. We can't stop time, but we can disable services. It's so exciting you'll be wishing you could fast-forward time instead of pausing it.
**iOS**
- Ever wish you could pause time? Us too! We haven't figured that one out yet, but we have brought you the convenience of Maintenance Windows. Now you can create, update, and delete Maintenance Windows on the go. We can't stop time, but we can disable services. It's so exciting you'll be wishing you could fast-forward time instead of pausing it.
Thanks for all the great feedback! We're always looking for ways to improve the app. Email [support@pagerduty.com](mailto:support@pagerduty.com) with any comments.
## 6.85 — 15 Aug 2022
**Android**
- We've got some really cool things going on behind the scenes. Stay tuned!
**iOS**
- We've got some really cool things going on behind the scenes. Stay tuned!
Thanks for all the great feedback! We're always looking for ways to improve the app. Email [support@pagerduty.com](mailto:support@pagerduty.com) with any comments.
## 6.84 — 8 Aug 2022
**Android**
- We've got some really cool things going on behind the scenes. Stay tuned!
**iOS**
- We've got some really cool things going on behind the scenes. Stay tuned!
Thanks for all the great feedback! We're always looking for ways to improve the app. Email [support@pagerduty.com](mailto:support@pagerduty.com) with any comments.
## 6.83 — 1 Aug 2022
**Android**
- We've got some really cool things going on behind the scenes. Stay tuned!
**iOS**
- We've got some really cool things going on behind the scenes. Stay tuned!
Thanks for all the great feedback! We're always looking for ways to improve the app. Email [support@pagerduty.com](mailto:support@pagerduty.com) with any comments.
## 6.82 — 25 Jul 2022
**Android**
- We've got some really cool things going on behind the scenes. Stay tuned!
**iOS**
- We've got some really cool things going on behind the scenes. Stay tuned!
Thanks for all the great feedback! We're always looking for ways to improve the app. Email [support@pagerduty.com](mailto:support@pagerduty.com) with any comments.
## 6.81 — 18 Jul 2022
**Android**
- We've got some really cool things going on behind the scenes. Stay tuned!
**iOS**
- We've got some really cool things going on behind the scenes. Stay tuned!
Thanks for all the great feedback! We're always looking for ways to improve the app. Email [support@pagerduty.com](mailto:support@pagerduty.com) with any comments.
## 6.80 — 11 Jul 2022
**Android**
- We've got some really cool things going on behind the scenes. Stay tuned!
**iOS**
- We've got some really cool things going on behind the scenes. Stay tuned!
Thanks for all the great feedback! We're always looking for ways to improve the app. Email [support@pagerduty.com](mailto:support@pagerduty.com) with any comments.
## 6.79 — 27 Jun 2022
**Android**
- To ensure that PagerDuty continues to be innovative and secure, our mobile app now requires Android 9.0 or later. Please ensure your device is upgraded to continue receiving app updates.
- We're working behind the scenes on some great new features. Stay tuned!
**iOS**
- To ensure that PagerDuty continues to be innovative and secure, our mobile app now requires iOS 14.0 or later. Please ensure your device is upgraded to continue receiving app updates.
- We're working behind the scenes on some great new features. Stay tuned!
Thanks for all the great feedback! We're always looking for ways to improve the app. Email [support@pagerduty.com](mailto:support@pagerduty.com) with any comments.
## 6.78 — 20 Jun 2022
**Android**
- To ensure that PagerDuty continues to be innovative and secure, future versions of our mobile app will require Android 9.0 or later. Please ensure your device is upgraded to continue receiving app updates.
- We're working behind the scenes on some great new features. Stay tuned!
**iOS**
- To ensure that PagerDuty continues to be innovative and secure, future versions of our mobile app will require iOS 14.0 or later. Please ensure your device is upgraded to continue receiving app updates.
- We're working behind the scenes on some great new features. Stay tuned!
Thanks for all the great feedback! We're always looking for ways to improve the app. Email [support@pagerduty.com](mailto:support@pagerduty.com) with any comments.
## 6.77 — 13 Jun 2022
**Android**
- We're working behind the scenes on some great new features. Stay tuned!
**iOS**
- We're working behind the scenes on some great new features. Stay tuned!
Thanks for all the great feedback! We're always looking for ways to improve the app. Email [support@pagerduty.com](mailto:support@pagerduty.com) with any comments.
## 6.76 — 6 Jun 2022
**Android**
- We're working behind the scenes on some great new features. Stay tuned!
**iOS**
- We're working behind the scenes on some great new features. Stay tuned!
Thanks for all the great feedback! We're always looking for ways to improve the app. Email [support@pagerduty.com](mailto:support@pagerduty.com) with any comments.
## 6.75 — 30 May 2022
**Android**
- We're working behind the scenes on some great new features. Stay tuned!
**iOS**
- We're working behind the scenes on some great new features. Stay tuned!
Thanks for all the great feedback! We're always looking for ways to improve the app. Email [support@pagerduty.com](mailto:support@pagerduty.com) with any comments.
## 6.74 — 23 May 2022
**Android**
- We're working behind the scenes on some great new features. Stay tuned!
**iOS**
- We're working behind the scenes on some great new features. Stay tuned!
Thanks for all the great feedback! We're always looking for ways to improve the app. Email [support@pagerduty.com](mailto:support@pagerduty.com) with any comments.
## 6.73 — 16 May 2022
**Android**
- Manually writing these release notes can be tiresome. If only it could be automated... like our newest addition, Automation Actions!
- View and run Automation Actions right on an Incident!
- See a list of Initiated Automation Actions and their progress through the new Output Report screen!
**iOS**
- Manually writing these release notes can be tiresome. If only it could be automated... like our newest addition, Automation Actions!
- View and run Automation Actions right on an Incident!
- See a list of Initiated Automation Actions and their progress through the new Output Report screen!
Thanks for all the great feedback! We're always looking for ways to improve the app. Email [support@pagerduty.com](mailto:support@pagerduty.com) with any comments.
## 6.72 — 9 May 2022
**Android**
- We're working behind the scenes on some great new features. Stay tuned!
**iOS**
- We're working behind the scenes on some great new features. Stay tuned!
Thanks for all the great feedback! We're always looking for ways to improve the app. Email [support@pagerduty.com](mailto:support@pagerduty.com) with any comments.
## 6.71 — 2 May 2022
**Android**
- We're working behind the scenes on some great new features. Stay tuned!
**iOS**
- We're working behind the scenes on some great new features. Stay tuned!
Thanks for all the great feedback! We're always looking for ways to improve the app. Email [support@pagerduty.com](mailto:support@pagerduty.com) with any comments.
## 6.70 — 25 Apr 2022
**Android**
- We're working behind the scenes on some great new features. Stay tuned!
**iOS**
- We're working behind the scenes on some great new features. Stay tuned!
Thanks for all the great feedback! We're always looking for ways to improve the app. Email [support@pagerduty.com](mailto:support@pagerduty.com) with any comments.
## 6.69 — 18 Apr 2022
**Android**
- You can now remove Push Notification Contact Methods through the User Profile.
- We're working behind the scenes on some great new features. Stay tuned!
**iOS**
- Alert Alert! Resolving Alerts should now actually resolve the Alert.
- We're working behind the scenes on some great new features. Stay tuned!
Thanks for all the great feedback! We're always looking for ways to improve the app. Email [support@pagerduty.com](mailto:support@pagerduty.com) with any comments.
## 6.68 — 11 Apr 2022
**Android**
- We're working behind the scenes on some great new features. Stay tuned!
**iOS**
- We're working behind the scenes on some great new features. Stay tuned!
Thanks for all the great feedback! We're always looking for ways to improve the app. Email [support@pagerduty.com](mailto:support@pagerduty.com) with any comments.
## 6.67 — 4 Apr 2022
**Android**
- We're working behind the scenes on some great new features. Stay tuned!
**iOS**
- We're working behind the scenes on some great new features. Stay tuned!
Thanks for all the great feedback! We're always looking for ways to improve the app. Email [support@pagerduty.com](mailto:support@pagerduty.com) with any comments.
## 6.66 — 28 Mar 2022
**Android**
- We're working behind the scenes on some great new features. Stay tuned!
**iOS**
- Fixed a bug where Resolution Notes were being truncated to a single letter.
- We're working behind the scenes on some great new features. Stay tuned!
Thanks for all the great feedback! We're always looking for ways to improve the app. Email [support@pagerduty.com](mailto:support@pagerduty.com) with any comments.
## 6.65 — 21 Mar 2022
**Android**
- We're working behind the scenes on some great new features. Stay tuned!
**iOS**
- We're working behind the scenes on some great new features. Stay tuned!
Thanks for all the great feedback! We're always looking for ways to improve the app. Email [support@pagerduty.com](mailto:support@pagerduty.com) with any comments.
## 6.64 — 14 Mar 2022
**Android**
- We're working behind the scenes on some great new features. Stay tuned!
**iOS**
- We're working behind the scenes on some great new features. Stay tuned!
Thanks for all the great feedback! We're always looking for ways to improve the app. Email [support@pagerduty.com](mailto:support@pagerduty.com) with any comments.
## 6.63 — 7 Mar 2022
**Android**
- We're working behind the scenes on some great new features. Stay tuned!
**iOS**
- We fixed a bug where changing subscription settings took some users to the wrong screen.
- We're working behind the scenes on some great new features. Stay tuned!
Thanks for all the great feedback! We're always looking for ways to improve the app. Email [support@pagerduty.com](mailto:support@pagerduty.com) with any comments.
## 6.62 — 28 Feb 2022
**Android**
- We're working behind the scenes on some great new features. Stay tuned!
**iOS**
- We fixed a bug where the Accounts screen would sometimes be presented twice.
- We're working behind the scenes on some great new features. Stay tuned!
Thanks for all the great feedback! We're always looking for ways to improve the app. Email [support@pagerduty.com](mailto:support@pagerduty.com) with any comments.
## 6.61 — 22 Feb 2022
**Android**
- We removed some unnecessary spacing in our Resolved Incidents list screen.
- Fixed an issue that would sometimes prevent users from redirecting back to the App during Login.
- We're working behind the scenes on some great new features. Stay tuned!
**iOS**
- We added an empty state message to the Subscribers screen.
- We're working behind the scenes on some great new features. Stay tuned!
Thanks for all the great feedback! We're always looking for ways to improve the app. Email [support@pagerduty.com](mailto:support@pagerduty.com) with any comments.
## 6.60 — 14 Feb 2022
**Android**
- We can now sort incidents in the open incidents screen by most recent.
- We're working behind the scenes on some great new features. Stay tuned!
**iOS**
- Added a description to Automatic Contact Card Management in Settings.
- We're working behind the scenes on some great new features. Stay tuned!
Thanks for all the great feedback! We're always looking for ways to improve the app. Email [support@pagerduty.com](mailto:support@pagerduty.com) with any comments.
## 6.59 — 7 Feb 2022
**Android**
- You're gonna like a log, we've worked hard to fix an issue with our login flow. (Not as hard as I worked on this pun though)
- We're working behind the scenes on some great new features. Stay tuned!
**iOS**
- We're working behind the scenes on some great new features. Stay tuned!
Thanks for all the great feedback! We're always looking for ways to improve the app. Email [support@pagerduty.com](mailto:support@pagerduty.com) with any comments.
## 6.58 — 1 Feb 2022
**Android**
- Fixed a bug where resolution note templates did not auto-populate with a default message.
- Fixed a bug where incident labels would overlap on smaller screens. Shout out to our new intern, Tom!
**iOS**
- Fixed a bug where the incorrect duration would show for resolved incidents. Shout out to our new intern, Sparsh!
Thanks for all the great feedback! We're always looking for ways to improve the app. Email [support@pagerduty.com](mailto:support@pagerduty.com) with any comments.
## 6.57 — 25 Jan 2022
**Android**
- We're cooking up something special for you behind the scenes. Stay tuned!
**iOS**
- We're cooking up something special for you behind the scenes. Stay tuned!
Thanks for all the great feedback! We're always looking for ways to improve the app. Email [support@pagerduty.com](mailto:support@pagerduty.com) with any comments.
## 6.56 — 17 Jan 2022
**Android**
- We're cooking up something special for you behind the scenes. Stay tuned!
**iOS**
- We're cooking up something special for you behind the scenes. Stay tuned!
Thanks for all the great feedback! We're always looking for ways to improve the app. Email [support@pagerduty.com](mailto:support@pagerduty.com) with any comments.
## 6.55 — 7 Jan 2022
**Android**
- Fixed a bug where the Note and Status Update widgets were not showing properly.
**iOS**
- Calling and texting international numbers from the User Details screen now includes the "+" prefix.
- Fixed a bug where some widgets were not visible after responding to a coordinated response.
Thanks for all the great feedback! We're always looking for ways to improve the app. Email [support@pagerduty.com](mailto:support@pagerduty.com) with any comments.
## 6.53 — 6 Dec 2021
**Android**
- Fixed a minor crash on the Incident screen.
- Made improvements to actions on the Alert screen.
**iOS**
- Made improvements to actions on the Alert screen.
- We're cooking up something special for you behind the scenes. Stay tuned!
Thanks for all the great feedback! We're always looking for ways to improve the app. Email [support@pagerduty.com](mailto:support@pagerduty.com) with any comments.
## 6.52 — 30 Nov 2021
**Android**
- We're cooking up something special for you behind the scenes. Stay tuned!
**iOS**
- We're cooking up something special for you behind the scenes. Stay tuned!
Thanks for all the great feedback! We're always looking for ways to improve the app. Email [support@pagerduty.com](mailto:support@pagerduty.com) with any comments.
## 6.51 — 22 Nov 2021
**Android**
- We're cooking up something special for you behind the scenes. Stay tuned!
**iOS**
- We're cooking up something special for you behind the scenes. Stay tuned!
Thanks for all the great feedback! We're always looking for ways to improve the app. Email [support@pagerduty.com](mailto:support@pagerduty.com) with any comments.
## 6.50 — 16 Nov 2021
**Android**
- Added the ability to use existing custom notification rules.
- Fixed a bug where push notifications were sent even after removing the account.
**iOS**
- We're cooking up something special for you behind the scenes. Stay tuned!
Thanks for all the great feedback! We're always looking for ways to improve the app. Email [support@pagerduty.com](mailto:support@pagerduty.com) with any comments.
## 6.49 — 8 Nov 2021
**Android**
- Bug fixes and improvements
**iOS**
- Bug fixes and improvements
Thanks for all the great feedback! We're always looking for ways to improve the app. Email [support@pagerduty.com](mailto:support@pagerduty.com) with any comments.
## 6.48 — 1 Nov 2021
**Android**
- Fixed an issue for some of you who were being logged out.
- Fixed a couple broken menu items in Incident Details.
- We're working behind the scenes on some great new features. Stay tuned!
**iOS**
- Fixed an issue for some of you who were being logged out.
- We're working behind the scenes on some great new features. Stay tuned!
Thanks for all the great feedback! We're always looking for ways to improve the app. Email [support@pagerduty.com](mailto:support@pagerduty.com) with any comments.
## 6.47 — 25 Oct 2021
**Android**
- We're working behind the scenes on some great new features. Stay tuned!
**iOS**
- We're working behind the scenes on some great new features. Stay tuned!
Thanks for all the great feedback! We're always looking for ways to improve the app. Email [support@pagerduty.com](mailto:support@pagerduty.com) with any comments.
## 6.46 — 18 Oct 2021
**Android**
- We're working behind the scenes on some great new features. Stay tuned!
**iOS**
- A few bug fixes to keep the app running smoothly
- We're working behind the scenes on some great new features. Stay tuned!
Thanks for all the great feedback! We're always looking for ways to improve the app. Email [support@pagerduty.com](mailto:support@pagerduty.com) with any comments.
## 6.45 — 12 Oct 2021
**Android**
- Made improvements to the confirmation dialogue when scheduling an override. Thanks Amir!
**iOS**
- The Apple Watch app has been overhauled to support all models and complication styles, and the innards have been reworked to keep things more reliably up-to-date.
- Fixed a banner crash for iOS 12 users.
- Improved visual feedback when taking an incident action. Thanks Emily!
Thanks for all the great feedback! We're always looking for ways to improve the app. Email [support@pagerduty.com](mailto:support@pagerduty.com) with any comments.
## 6.44 — 27 Sep 2021
**Android**
- A few small bug fixes to keep things running smoothly!
- We're working behind the scenes on some great new features. Stay tuned!
**iOS**
- We're working behind the scenes on some great new features. Stay tuned!
Thanks for all the great feedback! We're always looking for ways to improve the app. Email [support@pagerduty.com](mailto:support@pagerduty.com) with any comments.
## 6.43 — 20 Sep 2021
**Android**
- We're like chefs cooking behind-the-scene features in the back. Stay tuned!
**iOS**
- We're like chefs cooking behind-the-scene features in the back. Stay tuned!
Thanks for all the great feedback! We're always looking for ways to improve the app. Email [support@pagerduty.com](mailto:support@pagerduty.com) with any comments.
## 6.42 — 13 Sep 2021
**Android**
- Brace yourself, Fall is coming! We've done some Fall cleaning that will aid us in delivering you a better app.
- This is the first release that no longer supports Android Lollipop (5.0 - 5.1.1).
**iOS**
- Brace yourself, Fall is coming! We've done some Fall cleaning that will aid us in delivering you a better app.
Thanks for all the great feedback! We're always looking for ways to improve the app. Email [support@pagerduty.com](mailto:support@pagerduty.com) with any comments.
## 6.41 — 7 Sep 2021
**Android**
- Restricted Access users get the Mine tab on Open Incidents, and can take actions on incidents (within the limitations of their permissions).
- Fixed the ordering and consistency of details on the Incident Details screen.
- This will be the last release that supports Android Lollipop (5.0 - 5.1.1). Make sure to upgrade your OS to continue receiving new features, and bug fixes!
**iOS**
- If you already have some custom notification rules setup, we'll let you skip the template step when logging in to a new device. Stay safe out there!
- We're busy refactoring this thing from the inside out for added reliability and speed.
Thanks for all the great feedback! We're always looking for ways to improve the app. Email [support@pagerduty.com](mailto:support@pagerduty.com) with any comments.
## 6.40 — 30 Aug 2021
**Android**
- We're doing some tune ups in the garage. Stay tuned!
**iOS**
- Adding/Editing a priority has a new look. Check it out!
- Fixed a bug for iPad users where tapping the Share button would crash the app.
Thanks for all the great feedback! We're always looking for ways to improve the app. Email [support@pagerduty.com](mailto:support@pagerduty.com) with any comments.
## 6.39 — 23 Aug 2021
**Android**
- We're backstage doing some behind-the-scenes work for new features!
**iOS**
- We're backstage doing some behind-the-scenes work for new features!
Thanks for all the great feedback! We're always looking for ways to improve the app. Email [support@pagerduty.com](mailto:support@pagerduty.com) with any comments.
## 6.38 — 17 Aug 2021
**Android**
- We're backstage doing some behind-the-scenes work for new features!
**iOS**
- You can now update the urgency of an incident
- We're backstage doing some behind-the-scenes work for new features!
Thanks for all the great feedback! We're always looking for ways to improve the app. Email [support@pagerduty.com](mailto:support@pagerduty.com) with any comments.
## 6.37 — 9 Aug 2021
**Android**
- Miscellaneous bugfixes
- We're backstage doing some behind-the-scenes work for new features!
**iOS**
- Miscellaneous bugfixes.
- We're backstage doing some behind-the-scenes work for new features!
Thanks for all the great feedback! We're always looking for ways to improve the app. Email [support@pagerduty.com](mailto:support@pagerduty.com) with any comments.
## 6.36 — 2 Aug 2021
**Android**
- Want to know the recent code changes related to your incident? We gotchu - look for our new Change Events functionality in Service & Incident Details!\*
- We're like chefs cooking behind-the-scene features in the back. Stay tuned!
\*for certain plans only
**iOS**
- Want to know the recent code changes related to your incident? We gotchu - look for our new Change Events functionality in Service & Incident Details!\*
- Fixed an issue with time formatting causing issues in My OnCall Shifts.
- We're like chefs cooking behind-the-scene features in the back. Stay tuned!
\*for certain plans only
Thanks for all the great feedback! We're always looking for ways to improve the app. Email [support@pagerduty.com](mailto:support@pagerduty.com) with any comments.
## 6.35 — 26 Jul 2021
**Android**
- We fixed a bug where your OnCall shift might not have been shown correctly if it started one day, ended the next, and was less than 24 hours long.
- Annnnd another pesky bug where an incorrect amount of team subscriptions was being shown on an Incident.
- We're like chefs cooking behind-the-scene features in the back. Stay tuned!
**iOS**
- We're like chefs cooking behind-the-scene features in the back. Stay tuned!
Thanks for all the great feedback! We're always looking for ways to improve the app. Email [support@pagerduty.com](mailto:support@pagerduty.com) with any comments.
## 6.34 — 20 Jul 2021
**Android**
- Don't forget to checkout -b the new Service Dependencies feature to keep track of, you guessed it, your service dependencies!
- We've got some bug fixes, and more behind-the-scenes features cooking in the back so get your git fork ready! Bone apple teeth!
**iOS**
- Don't forget to checkout -b the new Service Dependencies feature to keep track of, you guessed it, your service dependencies!
- We've got some bug fixes, and more behind-the-scenes features cooking in the back so get your git fork ready! Bone apple teeth!
Thanks for all the great feedback! We're always looking for ways to improve the app. Email [support@pagerduty.com](mailto:support@pagerduty.com) with any comments.
## 6.33 — 12 Jul 2021
**Android**
- We're like chefs cooking behind-the-scene features in the back. Stay tuned!
**iOS**
- We're like chefs cooking behind-the-scene features in the back. Stay tuned!
Thanks for all the great feedback! We're always looking for ways to improve the app. Email [support@pagerduty.com](mailto:support@pagerduty.com) with any comments.
## 6.32 — 5 Jul 2021
**Android**
- Ongoing work behind the scenes on new features.
**iOS**
- Ongoing work behind the scenes on new features.
- Miscellaneous bugfixes.
Thanks for all the great feedback! We're always looking for ways to improve the app. Email [support@pagerduty.com](mailto:support@pagerduty.com) with any comments.
## 6.31 — 28 Jun 2021
**Android**
- Ongoing work behind the scenes on new features.
- Fixed an issue where some users were shown the login screen when opening the app.
- A few bug fixes to make your life easier!
**iOS**
- Ongoing work behind the scenes on new features.
- A few bug fixes to make your life easier!
Thanks for all the great feedback! We're always looking for ways to improve the app. Email [support@pagerduty.com](mailto:support@pagerduty.com) with any comments.
## 6.29 — 11 Jun 2021
**Android**
- Introducing a new incident feature — Past Incidents! When history repeats itself, we can look to the past for solutions.
- More behind-the-scenes features cooking in the back!
**iOS**
- Introducing a new incident feature — Past Incidents! When history repeats itself, we can look to the past for solutions.
- More behind-the-scenes features cooking in the back!
Thanks for all the great feedback! We're always looking for ways to improve the app. Email [support@pagerduty.com](mailto:support@pagerduty.com) with any comments.
## 6.28 — 8 Jun 2021
**Android**
- Incident priority is now visible on the business service details screen when it's disrupted.
- Fixed a permission error for some users trying to add an impacted business service to an incident.
- Still working away on some big features.
**iOS**
- Added some visual indication that an operation is working on the incident details screen.
- Fixed a bug on the user details screen related to pulling to refresh.
- Fixed a bug on the business service details screen where it might look disrupted in the list but not in the details. (It was indeed disrupted.)
- Still working away on some big features.
Thanks for all the great feedback! We're always looking for ways to improve the app. Email [support@pagerduty.com](mailto:support@pagerduty.com) with any comments.
## 6.27 —31 May 2021
**Android**
- Updated Tips of the Day to be more user friendly!
- Still working away on some big features.
**iOS**
- Still working away on some big features.
Thanks for all the great feedback! We're always looking for ways to improve the app. Email [support@pagerduty.com](mailto:support@pagerduty.com) with any comments.
## 6.26 —24 May 2021
**Android**
- Fixed some of the text you see during setup to clarify that we're not going to call all your friends when there's an incident. (You can, though.) Thanks, Shalin!
- Still working away on some big features.
**iOS**
- Still working away on some big features.
Thanks for all the great feedback! We're always looking for ways to improve the app. Email [support@pagerduty.com](mailto:support@pagerduty.com) with any comments.
## 6.25 —17 May 2021
**Android**
- Fixed a lil' crash in the Incident Details screen.
- Still working away on some big features.
**iOS**
- Fixed the "Required abilities are unavailable" error.
- Fixed some colour problems in the Status Dashboard for our beloved iOS 12 users.
- Still working away on some big features.
Thanks for all the great feedback! We're always looking for ways to improve the app. Email [support@pagerduty.com](mailto:support@pagerduty.com) with any comments.
## 6.23 —3 May 2021
**Android**
- Fixed a UI issue if you were multi-selecting a LOT of incidents!
- More behind-the-scenes features cooking in the back!
**iOS**
- More behind-the-scenes features cooking in the back!
Thanks for all the great feedback! We're always looking for ways to improve the app. Email [support@pagerduty.com](mailto:support@pagerduty.com) with any comments.
## 6.22 —26 April 2021
**Android**
- More behind-the-scenes features cooking in the back!
**iOS**
- Fixed a bug where the incident card would cut off text
- More behind-the-scenes features cooking in the back!
Thanks for all the great feedback! We're always looking for ways to improve the app. Email [support@pagerduty.com](mailto:support@pagerduty.com) with any comments.
## 6.21 — 19 April 2021
**Android**
- It's April, the suns out, the bugs are out ... but the bugs are also outside of our app cause we've been working on various bug fixes and ongoing work behind the scenes on new features! Stay tuned!
**iOS**
- It's April, the suns out, the bugs are out ... but the bugs are also outside of our app cause we've been working on various bug fixes and ongoing work behind the scenes on new features! Stay tuned!
Thanks for all the great feedback! We're always looking for ways to improve the app. Email [support@pagerduty.com](mailto:support@pagerduty.com) with any comments.
## 6.20 — 13 April 2021
**Android**
- There’s been a delay with some features getting stuck on a massive cargo ship but we’ve gotten word they’re on their way. Stay tuned!
**iOS**
- There’s been a delay with some features getting stuck on a massive cargo ship but we’ve gotten word they’re on their way. Stay tuned!
Thanks for all the great feedback! We're always looking for ways to improve the app. Email [support@pagerduty.com](mailto:support@pagerduty.com) with any comments.
## 6.19 — 30 Mar 2021
**Android**
- Ongoing work behind the scenes on new features.
**iOS**
- Ongoing work behind the scenes on new features.
Thanks for all the great feedback! We're always looking for ways to improve the app. Email [support@pagerduty.com](mailto:support@pagerduty.com) with any comments.
## 6.18 — 22 Mar 2021
**Android**
- Ongoing work behind the scenes on new features.
**iOS**
- Various bug fixes in and around the app. Mostly in… we’re not allowed outside.
- Ongoing work behind the scenes on new features.
Thanks for all the great feedback! We're always looking for ways to improve the app. Email [support@pagerduty.com](mailto:support@pagerduty.com) with any comments.
## 6.17 — 15 Mar 2021
**Android**
- Ongoing work behind the scenes on new features.
**iOS**
- Ongoing work behind the scenes on new features.
Thanks for all the great feedback! We're always looking for ways to improve the app. Email [support@pagerduty.com](mailto:support@pagerduty.com) with any comments.
## 6.16 — 9 Mar 2021
**Android**
- Ongoing work behind the scenes on new features.
**iOS**
- Ongoing work behind the scenes on new features.
Thanks for all the great feedback! We're always looking for ways to improve the app. Email [support@pagerduty.com](mailto:support@pagerduty.com) with any comments.
## 6.15 — 2 Mar 2021
**Android**
- Ongoing work behind the scenes on new features.
**iOS**
- Ongoing work behind the scenes on new features.
Thanks for all the great feedback! We're always looking for ways to improve the app. Email [support@pagerduty.com](mailto:support@pagerduty.com) with any comments.
## 6.14 — 22 Feb 2021
**Android**
- Updated the list of country codes you’ll see when creating a new phone number/SMS contact method. Note: not all countries can be delivered to. Check your plan and be sure to test notifications before going on-call!
- Fixed some bugs on the Alerts screen, mostly removing things that don’t apply to Alerts.
**iOS**
- Fixed some bugs on the Alerts screen, mostly removing things that don’t apply to Alerts.
Thanks for all the great feedback! We’re always looking for ways to improve the app. Email [support@pagerduty.com](mailto:support@pagerduty.com) with any comments.
## 6.13 — 16 Feb 2021
**Android**
- We'll now log you out of the app if your authentication token is revoked.
- Working hard behind the scenes on new and upcoming features.
**iOS**
- Fixed some errors you might have seen when viewing incident details with funky permission setups
- Working hard behind the scenes on new and upcoming features.
Thanks for all the great feedback! We’re always looking for ways to improve the app. Email [support@pagerduty.com](mailto:support@pagerduty.com) with any comments.
## 6.12 — 8 Feb 2021
**Android**
- Custom Status Dashboards are now available! Quickly switch between all business services and your own specific dashboard.
- On-Call Boosters begin rolling out this week. Timely, actionable information will be delivered straight to your device, such as a change to your next on-call shift, or being added to or removed from a schedule. Tap the notification to take you straight there!
**iOS**
- Custom Status Dashboards are now available on mobile! Quickly switch between all business services and your own specific dashboard.
- On-Call Boosters will begin rolling out this week. Timely, actionable information will be delivered straight to your device, such as a change to your next on-call shift, or being added to or removed from a schedule. Tap the notification to take you straight there! More to be rolled out over the following months.
- In the Status Dashboard, Business Services with teams attached will say so, and you can tap through to the team details.
Thanks for all the great feedback! We’re always looking for ways to improve the app. Email [support@pagerduty.com](mailto:support@pagerduty.com) with any comments.
## 6.11 — 1 Feb 2021
**Android**
- Working hard behind the scenes on new upcoming features.
**iOS**
- Some UI tweaks so we can look our best for you!
- Working hard behind the scenes on new upcoming features.
Thanks for all the great feedback! We’re always looking for ways to improve the app. Email [support@pagerduty.com](mailto:support@pagerduty.com) with any comments.
## 6.10 — 25 Jan 2021
**Android**
- There was a bug where you could accidentally notify the same responder many times by tapping really fast. It’s fixed, but I still recommend slowing down and enjoying life. Great work, Aviva!
**iOS**
- Fixed a confusing message when you used the Acknowledge All/Resolve All function. Great work, Sunni!
- Fixed a crash when you’d choose Snooze from the More menu on an iPad.
Thanks for all the great feedback! We’re always looking for ways to improve the app. Email [support@pagerduty.com](mailto:support@pagerduty.com) with any comments.
## 6.09 — 18 Jan 2021
**Android**
- If tapping on an incident status update wasn't taking you anywhere, now it'll take you to the Status Dashboard
**iOS**
- If tapping on an incident status update wasn't taking you anywhere, now it'll take you to the Status Dashboard.
Thanks for all the great feedback! We’re always looking for ways to improve the app. Email [support@pagerduty.com](mailto:support@pagerduty.com) with any comments.
## 6.08 — 5 Jan 2021
**Android**
- More work going on behind the scenes for upcoming functionality!
**iOS**
- You can now setup your notification rules during onboarding! Be ready for On-Call with a tap of a button! (... maybe a few more taps).
- Login through custom browser through your enterprise's configuration
- Let it snow! Manual incident sync with an external system
Thanks for all the great feedback! We’re always looking for ways to improve the app. Email [support@pagerduty.com](mailto:support@pagerduty.com) with any comments.
## 6.07 — 22 Dec 2020
**Android**
- Login through custom browser through your enterprise's configuration
- Let it snow! Manual incident sync with an external system
Thanks for all the great feedback! We’re always looking for ways to improve the app. Email [support@pagerduty.com](mailto:support@pagerduty.com) with any comments.
## 6.06 — 14 Dec 2020
**Android**
- Bug fixes and UI improvements
\*. On-going work behind the scenes on new features
**iOS**
- Bug fixes and UI improvements
- On-going work behind the scenes on new features
Thanks for all the great feedback! We’re always looking for ways to improve the app. Email [support@pagerduty.com](mailto:support@pagerduty.com) with any comments.
## 6.05 — 1 Dec 2020
**Android**
- Bug fixes and UI improvements
- On-going work behind the scenes on new features
**iOS**
- Bug fixes and UI improvements
- On-going work behind the scenes on new features
Thanks for all the great feedback! We’re always looking for ways to improve the app. Email [support@pagerduty.com](mailto:support@pagerduty.com) with any comments.
## 6.04 — 17 Nov 2020
**Android**
- Replaced some older icons with new ones. The old ones didn’t want to go, so we convinced them to go trick-or-treating and locked the door after they left.
- Fixed the Service Directory to consume less data. Thumbs up for healthier choices.
**iOS**
- Fixed the Resolution Note screen to make the Resolve button available for iPhone SE users. So now you have all the great functionality of the PagerDuty app AND extra pocket space – truly no better time to be alive.
- Not one but TWO sets of construction going on in this app. I can’t get through a single conference call without a table saw firing up right when it’s my turn to talk. Stay tuned for new features!
Thanks for all the great feedback! We’re always looking for ways to improve the app. Email [support@pagerduty.com](mailto:support@pagerduty.com) with any comments.
## 6.03 — 2 Nov 2020
**Android**
- We’ve got a cute new look for our contact card permissions screen. Yes that means more Pagey!
- Lots of behind the scenes work on bettering volume and dnd override functionality, and for other upcoming functionality. Hint: It’s going to be great!
**iOS**
- We’ve been doing a lot of behind the scenes work for upcoming functionality so stay tuned! Hint: it’s going to be great!
Thanks for all the great feedback! We’re always looking for ways to improve the app. Email [support@pagerduty.com](mailto:support@pagerduty.com) with any comments.
## 6.02 — 19 Oct 2020
**Android**
- Lots of work going on to make your notifications more reliable.
- Ongoing work behind the scenes on new features.
**iOS**
- You can now post resolution notes as status updates when resolving an incident. Let 'em know what you did!
- Links to the PagerDuty status page will open in your browser, as they should.
- A few iOS 14 fixes, like colours and stuff.
- Fixed some icon funkiness when you turned your phone sideways.
Thanks for all the great feedback! We’re always looking for ways to improve the app. Email [support@pagerduty.com](mailto:support@pagerduty.com) with any comments.
## 6.01 — 6 Oct 2020
**Android**
- You can now post resolution notes as status updates when resolving an incident
- Bug fixes and UI improvements
- On-going work behind the scenes on new features
**iOS**
- Fixed a bug related to the incident share link when shared through iMessage
- Bug fixes and UI improvements
- On-going work behind the scenes on new features
Thanks for all the great feedback! We're always looking for ways to improve the app. Email [support@pagerduty.com](mailto:support@pagerduty.com) with any comments.
## 6.0 — 4 Sept 2020
**Android**
- We've been working on a mountain of new functionality and bug fixes so stay tuned.
- Talking about mountains, don't forget to register for Summit20: The virtual event for real-time digital ops professionals! Snow-cap it'll be fun, trust. Register for free: [https://summit.pagerduty.com/global/begin](https://summit.pagerduty.com/global/begin)
**iOS**
- We've been working on a mountain of new functionality and bug fixes so stay tuned.
- Talking about mountains, don't forget to register for Summit20: The virtual event for real-time digital ops professionals! Snow-cap it'll be fun, trust. Register for free: [https://summit.pagerduty.com/global/begin](https://summit.pagerduty.com/global/begin)
Thanks for all the great feedback! We’re always looking for ways to improve the app. Email [support@pagerduty.com](mailto:support@pagerduty.com) with any comments.
## 5.103 — 1 Sept 2020
**Android**
- Service Directory now shows a list of impacting incidents for disrupted services confetti all around
- We now have a fancy new way to help you setup your notification rules right from the app!
- More behind-the-scenes features cooking away in our kitchen.
**iOS**
- Service Directory now shows a list of impacting incidents for disrupted services confetti all around
- More behind-the-scenes features cooking away in our kitchen.
Thanks for all the great feedback! We’re always looking for ways to improve the app. Email [support@pagerduty.com](mailto:support@pagerduty.com) with any comments.
## 5.102 — 24 Aug 2020
**Android**
- We crushed-a-crash(TM) that was happening in the Accounts screen.
- We fixed a bug with clicking on links in Incident Details.
- We’re like chefs in a kitchen with some behind-the-scene features cooking in the back.
**iOS**
- Critical alerts are here! Now you can turn on Do Not Disturb and ignore everyone except for us!
- We’re like chefs in a kitchen with some behind-the-scene features cooking in the back.
Thanks for all the great feedback! We’re always looking for ways to improve the app. Email [support@pagerduty.com](mailto:support@pagerduty.com) with any comments.
## 5.101 — 10 Aug 2020
**Android**
- Fixed a bug where empty resolution notes were appearing as “null”. You don’t have to worry about it anymore cause we’ve nulled the null bug.
- We’ve added some extra info to let you know when the last time your contact card was updated.
**iOS**
- We fixed some bugs that were added into the app. I’m not going to say it was me. But I’m also not going to say it wasn’t.
- We’re like chefs in a kitchen with some behind-the-scene features cooking in the back.
Thanks for all the great feedback! We’re always looking for ways to improve the app. Email [support@pagerduty.com](mailto:support@pagerduty.com) with any comments.
## 5.100 — 27 Jul 2020
**Android**
- You can escalate an incident from the menu in the incident detail screen
- You can also add resolution notes when resolving an incident now
- Fix push notification issues from the Settings screen with the new Troubleshoot Notifications feature
- Fixed push notification issues for LG devices
**iOS**
- You can escalate an incident from the menu in the incident detail screen
- We’ve added some user tips to help you better understand how to override your shifts
- Fix push notification issues from the Settings screen with the new Troubleshoot Notifications feature
- Bug fixes and ongoing work behind the scenes for upcoming functionality
Thanks for all the great feedback! We’re always looking for ways to improve the app. Email [support@pagerduty.com](mailto:support@pagerduty.com) with any comments.
## 5.99.1 — 13 Jul 2020
**Android**
- You can now view incidents that impact a business service through the status dashboard!
- Bug fixes and ongoing work behind the scenes for upcoming functionality.
**iOS**
- Bug fixes and ongoing work behind the scenes for upcoming functionality.
Thanks for all the great feedback! We’re always looking for ways to improve the app. Email [support@pagerduty.com](mailto:support@pagerduty.com) with any comments.
## 5.98 — 29 Jun 2020
**Android**
- Added support for better deep linking to PagerDuty from links and other apps.
- Bug fixes and ongoing work behind the scenes for upcoming functionality.
Thanks for all the great feedback! We’re always looking for ways to improve the app. Email [support@pagerduty.com](mailto:support@pagerduty.com) with any comments.
**iOS**
- You can now edit an Incident’s title! Select Edit Title from the incident actions menu.
- Bug fixes and ongoing work behind the scenes for upcoming functionality.
Thanks for all the great feedback! We’re always looking for ways to improve the app. Email [support@pagerduty.com](mailto:support@pagerduty.com) with any comments.
## 5.97 — 15 Jun 2020
**Android**
- Tapping on an on-call hand off push notification will now take you to its schedule!
- Adding support for more deep links into the app and fixing some bugs along the way.
- More work going on behind the scenes for upcoming functionality.
**iOS**
- You can now Resolve Alerts from the app!
- Fixed a pesky crash in the New User Demo and a custom actions error for Restricted Access users.
- More work going on behind the scenes for upcoming functionality.
## 5.96.1 — 3 Jun 2020
**Android**
- Fixed push notification issues for OnePlus and Samsung devices
- Fixed a crash when trying to save your contact information
- More work going on behind the scenes for upcoming functionality
**iOS**
- You can now share a link to an incident from the Incident Details screen by tapping the More button!
- Fixed accessibility bug where VoiceOver would not interact with the Menu button
- More work going on behind the scenes for upcoming functionality
Thanks for all the great feedback! We’re always looking for ways to improve the app. Email [support@pagerduty.com](mailto:support@pagerduty.com) with any comments.
## 5.95 — 18 May 2020
**Android**
- Pagey has joined to help get you setup. Say hi the next time you login!
- We had some bugs that weren’t practicing proper social distancing so we made sure to put a mask on it.
Thanks for all the great feedback! We’re always looking for ways to improve the app. Email [support@pagerduty.com](mailto:support@pagerduty.com) with any comments.
**iOS**
- Pagey has joined to help get you setup. Say hi the next time you login!
- There’s fresh look to the more menu in the incident details. Go check it out!
- We’ve made it so that tapping on a schedules link or a status update will take you to the appropriate location in the app instead of opening it up on your browser.
Thanks for all the great feedback! We’re always looking for ways to improve the app. Email [support@pagerduty.com](mailto:support@pagerduty.com) with any comments.
## 5.94 — 04 May 2020
**Android**
- Whoa, there’s a new button on the Incident Details? It says “Related Incidents”? WHAT? I CAN SEE RELATED INCIDENTS NOW? Yes you can folks+!
- Check out the new sleek redesign of the more menu on the Incident Details!
- Light/dark mode default is now your system settings unless otherwise specified already.
+only for certain plans
**iOS**
- Whoa, there’s a new button on the Incident Details? It says “Related Incidents”? WHAT? I CAN SEE RELATED INCIDENTS NOW? Yes you can folks+
- Bug fixes and behind the scenes work in preparation for upcoming functionality
+only for certain plans
## 5.93 — 13 Apr 2020
**Android**
- We fixed a crash that would sometimes appear when launching the app.
- Continued behind the scenes work in preparation for some super cool upcoming functionality!
**iOS** - No release as of 23 Apr 2020
## 5.92.1 — 23 Apr 2020
**iOS Only**
- This week we cleaned up some bugs (looking at you, iPad) and continued behind the scenes work in preparation for upcoming functionality.
- Fixed a bug causing acknowledging incidents via push notification to fail
## 5.92 — 06 Apr 2020
**Android**
- This week we continue behind the scenes work in preparation for upcoming functionality.
**iOS**
- This week we cleaned up some bugs (looking at you, iPad) and continued behind the scenes work in preparation for upcoming functionality.
## 5.91.1 — 30 Mar 2020
**Android**
- Bug fixes and improvements.
**iOS**
- Bug fixes and improvements.
## 5.91 — 23 Mar 2020
**Android**
- Got some nifty little arrows showing up in Service Details, so if you were confused before, just keep clicking away. It doesn’t bite, we promise!
- More work going on behind the scenes for upcoming functionality.
**iOS**
- Got you a professional looking dot to SWIFTLY (cuz you know, iOS uses Swift… No? Ok I’ll show myself out) tell you what’s new in your app!
- More work going on behind the scenes for upcoming functionality.
## 5.90 — 16 Mar 2020
**Android**
- More fixes for notifications! Some of the pesky bugs when phone's on silent should now be fixed!
- More work going on behind the scenes for upcoming functionality.
Thanks for all the great feedback! We're always looking for ways to improve the app. Email [support@pagerduty.com](mailto:support@pagerduty.com) with any comments.
**iOS**
- More work going on behind the scenes for upcoming functionality.
Thanks for all the great feedback! We're always looking for ways to improve the app. Email [support@pagerduty.com](mailto:support@pagerduty.com) with any comments.
## 5.89 — 09 Mar 2020
**Android**
- Work continues behind the scenes on some great UI improvements. Like all great art, it doesn’t make sense until it’s finished, although they also say that great art is never finished, so I’m going to have to talk to my Product Manager and get back to you.
Thanks for all the great feedback! We’re always looking for ways to improve the app. Email [support@pagerduty.com](mailto:support@pagerduty.com) with any comments, which can even be over 500 characters, unlike these release notes.
**iOS**
- Added the option of including a resolution note when resolving an incident from Incident Details. Pay it forward and let the next responder know how you fixed it! If you don't know how you fixed it, you can leave it blank.
- If you were having trouble getting rid of that “new” badge on the Status Dashboard, don’t worry, it’s been evicted and lost its damage deposit.
- We’ve made the process of adding extra accounts a bit smoother... thanks Dema!
- Work continues behind the scenes on some great UI improvements. Like all great art, it doesn’t make sense until it’s finished, although they also say that great art is never finished, so I’m going to have to talk to my Product Manager and get back to you.
Thanks for all the great feedback! We’re always looking for ways to improve the app. Email [support@pagerduty.com](mailto:support@pagerduty.com) with any comments.
## 5.88 — 02 Mar 2020
**Android**
- Clicking on the version number in Settings will now copy it to your clipboard!
- Are you experiencing notification issues? Do you wish they would just be fixed already? Well look no further! In this new update we hope to solve all(most) of your problems! Here is a full list of notification updates in this release:
- FIXED: [Android 9/10] Notifications received during scheduled/timed DND would permanently set DND to be ON.
- FIXED: [Android 10] When DND is OFF and Volume Override is ON the device could be set to ringer mode when initially in silent mode.
- FIXED: [Android 10] When DND is ON and Volume Override is ON the device could be set to silent mode when initially in ringer mode.
- FIXED: [Android 8] When Volume Override is ON and the device is in vibrate or silent mode, the volume in ringer mode won’t be reset to its initial volume.
- KNOWN BUG: [Android 9/10] When Volume Override is ON and the device is in vibrate or silent mode, the volume in ringer mode won’t be reset to its initial volume.
Thanks for all the great feedback! We’re always looking for ways to improve the app. Email [support@pagerduty.com](mailto:support@pagerduty.com) with any comments.
**iOS**
- Emailing Support through the PagerDuty app will now be pre-populated with some super-neat environment information!
- More work going on behind the scenes for upcoming functionality.
Thanks for all the great feedback! We're always looking for ways to improve the app. Email [support@pagerduty.com](mailto:support@pagerduty.com) with any comments.
## 5.87 — 24 Feb 2020
**Android**
- 9/10 dentists agree that… the other dentist is not welcome to use our product
- Fixed a bug with the badges in the menu list and made improvements
Thanks for all the great feedback! We’re always looking for ways to improve the app. Email [support@pagerduty.com](mailto:support@pagerduty.com) with any comments.
**iOS**
- 9/10 dentists agree that… the other dentist is not welcome to use our product
- Fixed a bug with the badges in the menu list and made improvements
Thanks for all the great feedback! We’re always looking for ways to improve the app. Email [support@pagerduty.com](mailto:support@pagerduty.com) with any comments.
## 5.86 — 17 Feb 2020
**Android**
- After a bit of a snafu last week we’re proud to reintroduce Status Dashboard! Quickly glance at your business services and drill down to figure out what’s up. (Replaces Visibility. Those responsible for this mixup have been sacked^H^H^H^H^H^H invited to a friendly post-mortem.)
- Changing your password will now log you out of the mobile app. You’ll continue to receive push notifications until you log in to the app again.
Thanks for all the great feedback! We’re always looking for ways to improve the app. Email [support@pagerduty.com](mailto:support@pagerduty.com) with any comments.
**iOS**
- After a bit of a snafu last week we’re proud to reintroduce Status Dashboard! Quickly glance at your business services and drill down to figure out what’s up. (Replaces Visibility. Those responsible for this mixup have been sacked^H^H^H^H^H^H invited to a friendly post-mortem.)
- If you use the Reset option in Settings > PagerDuty, we’ll stop your phone from receiving push notifications. It’s like changing your phone number to escape your ex.
- Fixed a login issue for some customers. If you are one of them, you already know!
- Changing your password will now log you out of the mobile app. You’ll continue to receive push notifications until you log in to the app again.
Thanks for all the great feedback! We’re always looking for ways to improve the app. Email [support@pagerduty.com](mailto:support@pagerduty.com) with any comments.
## 5.85 — 10 Feb 2020
**Android**
- **DUN DUN DUN…** What’s that you see? OH THAT’S RIGHT, IT’S STATUS DASHBOARD\*\*\*!!!
- More work going on behind the scenes for upcoming functionality
\*\*\*only for certain plans. batteries not included
Thanks for all the great feedback! We’re always looking for ways to improve the app. Email [support@pagerduty.com](mailto:support@pagerduty.com) with any comments.
**iOS**
- **DUN DUN DUN…** What’s that you see? OH THAT’S RIGHT, IT’S STATUS DASHBOARD\*\*\*!!!
- More work going on behind the scenes for upcoming functionality
\*\*\*only for certain plans. batteries not included
Thanks for all the great feedback! We’re always looking for ways to improve the app. Email [support@pagerduty.com](mailto:support@pagerduty.com) with any comments.
## 5.84 — 3 Feb 2020
**Android**
- My team told me I get to “officially” announce the NEW Service Directory feature… so here we are.
- Squashed some fun, pesky bugs in this release for your continued enjoyment! ( If you were enjoying those bugs, you’re outta luck. )
- More fun work going on behind the scenes for upcoming functionality.
Thanks for all the great feedback! We’re always looking for ways to improve the app. Email [support@pagerduty.com](mailto:support@pagerduty.com) with any comments.
**iOS**
- My team told me I get to “officially” announce the NEW Service Directory feature… so here we are.
- More fun work going on behind the scenes for upcoming functionality.
Thanks for all the great feedback! We’re always looking for ways to improve the app. Email [support@pagerduty.com](mailto:support@pagerduty.com) with any comments.
## 5.83 — 27 Jan 2020
**Android**
- IN THE RIGHT CORNER, WEIGHING THE WEIGHT OF TWO INCREDIBLE INTERNS… SERVICE DETAILS _crowd cheering_! You can now view the details of a service by tapping on it in the Service Directory!
- Fixed an issue that caused an incorrect message to appear when no matches were found while searching on a few screens.
Thanks for all the great feedback! We’re always looking for ways to improve the app. Email [support@pagerduty.com](mailto:support@pagerduty.com) with any comments.
**iOS**
- AND IN THE LEFT CORNER, WEIGHING THE WEIGHT OF TWO INCREDIBLE INTERNS… SERVICE DETAILS _crowd cheering_! You can now view the details of a service by tapping on it in the Service Directory!
- More super cool work going on behind the scenes for upcoming functionality.
Thanks for all the great feedback! We’re always looking for ways to improve the app. Email [support@pagerduty.com](mailto:support@pagerduty.com) with any comments.
## 5.82 — 20 Jan 2020
**Android**
- Light mode is here! In Settings, choose light mode, dark mode, or follow your system’s light and dark modes (Android Q and up).
- Below the Contact Card option in Settings, we’ll let you know when we last updated it.
- Fixed a crash in the authentication for phones without browsers. You still can’t login, but now we’ll tell you why.
Thanks for all the great feedback! We’re always looking for ways to improve the app. Email [support@pagerduty.com](mailto:support@pagerduty.com) with any comments.
**iOS**
- We’ve overhauled our login process to work better with your password managers and autocompletes and single sign-ons and funky keyboards and whatnot. Enjoy!
- Below the Contact Card option in Settings, we’ll let you know when we last updated it. This is handy to know when it’s updated in the background.
- Fixed a couple bugs in the Settings for push notifications. If you’ve previously denied and then re-approved us to send you push notifications, the switch should work correctly now.
Thanks for all the great feedback! We’re always looking for ways to improve the app. Email [support@pagerduty.com](mailto:support@pagerduty.com) with any comments.
## 5.81 — 13 Jan 2020
**Android**
- Work continues on some not-quite-yet-ready features. I hope you’re as excited as we are.
Thanks for all the great feedback! We’re always looking for ways to improve the app. Email [support@pagerduty.com](mailto:support@pagerduty.com) with any comments.
**iOS**
- Contact Card now refreshes in the background, if you’ve enabled it. Have you enabled it?
- Work continues on some not-quite-yet-ready features. I hope you’re as excited as we are.
Thanks for all the great feedback! We’re always looking for ways to improve the app. Email [support@pagerduty.com](mailto:support@pagerduty.com) with any comments.
## 5.80 — 6 Jan 2020
**Android**
- Share an incident from the Incident Details screen.
- Fixed a year-end issue in My On-Call Shifts.
- Replaced login experience with a web-based version using your device’s browser.
- Fixed the colors of the priority labels for enhanced readability.
Thanks for all the great feedback! We’re always looking for ways to improve the app. Email [support@pagerduty.com](mailto:support@pagerduty.com) with any comments.
**iOS**
- Some tune-ups to the Service Directory for upcoming functionality.
Thanks for all the great feedback! We’re always looking for ways to improve the app. Email [support@pagerduty.com](mailto:support@pagerduty.com) with any comments.
## 5.79 — 2 Jan 2020
**Android**
- Typed in a wrong title for an incident?… Don’t worry! You can now edit incident titles in the app!
- Fixed a pesky crash when updating the PagerDuty contact card for the first time.
Thanks for all the great feedback! We’re always looking for ways to improve the app. Email [support@pagerduty.com](mailto:support@pagerduty.com) with any comments.
**iOS**
- Fixed a pesky crash in Visibility when viewing a disrupted Business Service that has status updates.
- More super cool work going on behind the scenes for upcoming functionality.
Thanks for all the great feedback! We’re always looking for ways to improve the app. Email [support@pagerduty.com](mailto:support@pagerduty.com) with any comments.
## 5.78.1 — 17 Dec 2019
**Android**
- You can now unsubscribe other people from incidents if you've "accidentally" subscribed them. You're welcome.
- Fixed a bug that was causing App crashes on the Incident Details page.
Thanks for all the great feedback! We’re always looking for ways to improve the app. Email [support@pagerduty.com](mailto:support@pagerduty.com) with any comments.
## 5.78 — 16 Dec 2019
**iOS**
- You can now see user's email address when searching for a responder to add to an incident. Pretty cool, right?!
- Fixed a bug where if you were logged into an account and signed out, it would not deregister you for push notifications.
Thanks for all the great feedback! We’re always looking for ways to improve the app. Email [support@pagerduty.com](mailto:support@pagerduty.com) with any comments.
## 5.77 — 9 Dec 2019
**iOS**
- Everyone has That Person in the office\* that subscribes them to incidents as a joke. Now you can unsubscribe yourself from the Incident Details screen.
- You can also unsubscribe other people if you've "accidentally" subscribed them.
\*Based on a survey of my co-workers.
Thanks for all the great feedback! We’re always looking for ways to improve the app. Email [support@pagerduty.com](mailto:support@pagerduty.com) with any comments.
**Android**
- Everyone has That Person in the office\* that subscribes them to incidents as a joke. Now you can unsubscribe yourself from the Incident Details screen.
- We won’t let you try to change the account owner’s schedule color anymore.
\*Based on a survey of my co-workers.
Thanks for all the great feedback! We’re always looking for ways to improve the app. Email [support@pagerduty.com](mailto:support@pagerduty.com) with any comments.
## 5.76 — 25 Nov 2019
**iOS**
- Tapping the version number from the Settings screen copies the version and build number to your pasteboard making it easier to supply that information when requesting support - thanks Rob for the suggestion!
- Fixed a bug related to saving the PagerDuty Contact Card
- Links are now styled consistently throughout the app
Thanks for all the great feedback! We’re always looking for ways to improve the app. Email [support@pagerduty.com](mailto:support@pagerduty.com) with any comments.
**Android**
- Incident priority labels are now styled correctly to reflect their true colours
- Fixed a pesky crash related to updating the PagerDuty Contact Card
Thanks for all the great feedback! We’re always looking for ways to improve the app. Email [support@pagerduty.com](mailto:support@pagerduty.com) with any comments.
## 5.75 — 18 Nov 2019
**iOS**
- Why did the PagerDuty Contact Card cross the road? To make sure you don't miss any calls!... My team insisted on a joke (I'm sorry)... We've made some improvements to ensure your PagerDuty Contact Card stays up-to-date.
- More super cool work going on behind the scenes for upcoming functionality.
Thanks for all the great feedback! We’re always looking for ways to improve the app. Email [support@pagerduty.com](mailto:support@pagerduty.com) with any comments.
**Android**
- We have reworked our notifications to more thoroughly respect your DND schedules and volume settings.
- Why did the PagerDuty Contact Card cross the road? To make sure you don't miss any calls!... My team insisted on a joke (I'm sorry)... We've made some improvements to ensure your PagerDuty Contact Card stays up-to-date.
Thanks for all the great feedback! We’re always looking for ways to improve the app. Email [support@pagerduty.com](mailto:support@pagerduty.com) with any comments.
## 5.74 — 11 Nov 2019
**iOS**
- Now able to search by user's email address on user search screen.
- Notification Rule options won't be invisible below iOS 13 because we took care of the text style, didn't we?
- As mentioned last week, we've wiggled in a way to download a PagerDuty contact card so that you don't miss any important calls from us! We've snazzed up the design and UX changes for the Contact Card feature.
Thanks for all the great feedback! We’re always looking for ways to improve the app. Email [support@pagerduty.com](mailto:support@pagerduty.com) with any comments.
**Android**
- You can now edit your schedule colors - knock yourself out with the plethora of colors available at your disposal!
- As mentioned last week, we've wiggled in a way to download a PagerDuty contact card so that you don't miss any important calls from us! We've snazzed up the design and UX changes for the Contact Card feature.
Thanks for all the great feedback! We’re always looking for ways to improve the app. Email [support@pagerduty.com](mailto:support@pagerduty.com) with any comments.
## 5.73 — 4 Nov 2019
**iOS**
- Fixed a crash when snoozing incidents on iPad. Snooze away! Not too long though…
- Fixed an issue where incidents created through Slack were missing some details.
- A little polish to our feature that adds our PagerDuty contact to your phone so you don't miss any phone calls from us.
Thanks for all the great feedback! We're always looking for ways to improve the app. Email [support@pagerduty.com](mailto:support@pagerduty.com) with any comments.
**Android**
- Fixed an issue where incidents created through Slack were missing some details.
- Some polishing to the code that saves our PagerDuty Contact card. Did you know you can add the PagerDuty contact to your phone and keep it up to date so you know it's PagerDuty calling and not spam? Check it out in our Settings menu under Notifications!
Thanks for all the great feedback! We're always looking for ways to improve the app. Email [support@pagerduty.com](mailto:support@pagerduty.com) with any comments.
## 5.72 — 28 Oct 2019
**iOS**
- We added a way to automatically add the PagerDuty contact to your phone and keep it up to date so you know it's PagerDuty calling and not spam. Check it out in our Settings menu under Notifications.
- We made iPad improvements on screens where form sheets are displayed
Thanks for all the great feedback! We’re always looking for ways to improve the app. Email [support@pagerduty.com](mailto:support@pagerduty.com) with any comments.
**Android**
- We added a way to automatically add the PagerDuty contact to your phone and keep it up to date so you know it's PagerDuty calling and not spam. Check it out in our Settings menu under Notifications.
- You can now invite users from the Users screen
- We fixed a pesky bug on the Incident Details screen
Thanks for all the great feedback! We’re always looking for ways to improve the app. Email [support@pagerduty.com](mailto:support@pagerduty.com) with any comments.
## 5.71 — 21 Oct 2019
**iOS**
- Fixed a URL encoding bug with client URLs. Tapping the Thing will go to the Place.
- Spiffed up some of the colours in various places in the app.
Thanks for all the great feedback! We’re always looking for ways to improve the app. Email [support@pagerduty.com](mailto:support@pagerduty.com) with any comments.
**Android**
- Times are displayed in 24-hour time if that's how your phone is set up.
Thanks for all the great feedback! We’re always looking for ways to improve the app. Email [support@pagerduty.com](mailto:support@pagerduty.com) with any comments.
## 5.70 — 13 Oct 2019
**iOS**
- Honk! Honk! Your phone can be a horrible goose with our new goose ringtone.
- Various fixes and tweaks for light mode.
Thanks for all the great feedback! We’re always looking for ways to improve the app. Email [support@pagerduty.com](mailto:support@pagerduty.com) with any comments.
**Android**
- Snooze incident(s) more than 24 hours (up to a week)! Thanks Sophia!
- Honk! Honk! Your phone can be a horrible goose with our new goose ringtone.
- The default for hitting Back is now to exit the app rather than open the menu. Change this in Settings.
- Actions performed through an integration will say so in the Timeline tab.
Thanks for all the great feedback! We’re always looking for ways to improve the app. Email [support@pagerduty.com](mailto:support@pagerduty.com)with any comments.
## 5.69 — 7 Oct 2019
**iOS**
- We updated some of our light mode colors in the login flow.
Thanks for all the great feedback! We’re always looking for ways to improve the app. Email [support@pagerduty.com](mailto:support@pagerduty.com) with any comments.
**Android**
- More work going on behind the scenes for upcoming functionality!
- While I might eat a six-year-old KitKat bar, we will no longer be supporting six-year-old Android KitKat.
Thanks for all the great feedback! We’re always looking for ways to improve the app. Email [support@pagerduty.com](mailto:support@pagerduty.com) with any comments.
## 5.68 — 30 Sept 2019
**iOS**
- If the date picker used for snoozing an incident looked a bit weird to you, it looked weird to us too - we fixed a bug on it.
Thanks for all the great feedback! We’re always looking for ways to improve the app. Email [support@pagerduty.com](mailto:support@pagerduty.com) with any comments.
**Android**
- Doing some behind the scenes work for upcoming functionality. Stay tuned!
Thanks for all the great feedback! We’re always looking for ways to improve the app. Email [support@pagerduty.com](mailto:support@pagerduty.com) with any comments.
## 5.67 — 23 Sept 2019
**iOS**
Who's excited for _PAGERDUTY SUMMIT?!_ We sure are, and we hope to see you there. To celebrate we've added some jazzy changes:
- Introducing new ringtones! Brought to you by Tetsuya and Anton - your latest ringtones “Aaaaaaaahhhhh\~\~~!!” and “Angry Bear”
- If light themes are your thing, we’ve added a light mode for iOS 13! Try it out by changing your app’s appearance from the Settings menu
Thanks for all the great feedback! We’re always looking for ways to improve the app. Email [support](mailto:support@pagerduty.com) with any comments.
**Android**
- New ringtones! Brought to you by Tetsuya and Anton - your latest ringtones “Aaaaaaaahhhhh\~\~~!!” and “Angry Bear”
Thanks for all the great feedback! We’re always looking for ways to improve the app. Email [support](mailto:support@pagerduty.com) with any comments.
## 5.66 — 16 Sept 2019
**iOS**
- Who saw the Apple announcements?! Thanks to everyone who has written into support with iOS 13 beta findings, this release includes some of those fixes. We **love** hearing from you, keep writing into [support](mailto:support@pagerduty.com) with your findings and feedback. :heart:
**Android**
- We fixed a bug where tapping on certain links would crash the app. I call it 'a link to the crash'. I'll show myself out.
Thanks for all the great feedback! We’re always looking for ways to improve the app. Email [support@pagerduty.com](mailto:support@pagerduty.com) with any comments.
## 5.65 — 9 Sept 2019
**iOS**
- We spiffed up the app and we are so excited for you to see our new look! Our new green is Pagey-approved, and don't worry, we've got more coming... the glow up isn't over yet!
- We added a "Learn More" link in the Filter Escalation Policies by Tags screen.
- We fixed a bug where your phone may have periodically registered itself as a new device (and give you new default rules and sounds).
Thanks for all the great feedback! We’re always looking for ways to improve the app. Email [support@pagerduty.com](mailto:support@pagerduty.com) with any comments.
**Android**
- We spiffed up the app and we are so excited for you to see our new look! Our new green is Pagey-approved, and don't worry, we've got more coming... the glow up isn't over yet!
- We fixed a bug where your phone may have periodically registered itself as a new device (and give you new default rules and sounds).
Thanks for all the great feedback! We’re always looking for ways to improve the app. Email [support@pagerduty.com](mailto:support@pagerduty.com) with any comments.
## 5.64 — 3 Sept 2019
**iOS**
- More work going on behind the scenes for upcoming functionality
Thanks for all the great feedback! We’re always looking for ways to improve the app. Email [support@pagerduty.com](mailto:support@pagerduty.com) with any comments.
**Android**
- Fixed an issue affecting acknowledging incidents via notification
- Fixed up pull-to-refresh on the My On-Call Shifts screen
Thanks for all the great feedback! We’re always looking for ways to improve the app. Email [support@pagerduty.com](mailto:support@pagerduty.com) with any comments.
## 5.63 — 26 Aug 2019
**iOS**
- Did some fixin' to the menu to ensure the Accounts menu item is always reachable by scrolling.
- Fixed the New Incident screen to accommodate a really long description and accidental cancellation.
- Fixed a crash when tapping on a schedule override on iPad.
- Tightened up the graphics on Level 3.
- Cleaned up some permissions involving Status Updates to ensure the right people see 'em and the wrong people don't.
Thanks for all the great feedback! We’re always looking for ways to improve the app. Email [support@pagerduty.com](mailto:support@pagerduty.com) with any comments.
**Android**
- The top bar no longer changes colors according to your incident statuses.
- Fixed a crash opening some links on devices without Chrome.
- Fixed an issue selecting an account from a long list on login.
- Fixed an issue affecting read-only users trying to multi-select incidents.
Thanks for all the great feedback! We’re always looking for ways to improve the app. Email [support@pagerduty.com](mailto:support@pagerduty.com) with any comments.
## 5.62 — 19 Aug 2019
**iOS**
- We fixed a few bugs around the app where we'd show you a few things here and there that you possibly weren't allowed to do. Out of sight, out of mind!
- Improved phone number country detection.
Thanks for all the great feedback! We’re always looking for ways to improve the app. Email [support@pagerduty.com](mailto:support@pagerduty.com) with any comments. with any comments. Yee-haw!
**Android**
- Fixed a couple of crashes.
Thanks for all the great feedback! We’re always looking for ways to improve the app. Email [support@pagerduty.com](mailto:support@pagerduty.com) with any comments.
## 5.61 — 12 Aug 2019
**iOS**
- We've improved the app experience for stakeholders even more. _You_ can stay informed! _You_ can stay informed! You _all_ can stay informed!
- We've dialed our security up a notch by cleaning up leftover temporary files containing sensitive information. I also dialed my belt up a notch but I'm not as proud of that.
Thanks for all the great feedback! We’re always looking for ways to improve the app. Email [support@pagerduty.com](mailto:support@pagerduty.com) with any comments.
**Android**
- We fixed a pesky little crash on the Settings screen. We can't tell how it snuck in there. Oh! We have git history... Dang, it was me.
- To tighten up some security, we've disabled taking screenshots of the app. If you would like to enable that functionality and live life on the edge, you can find a toggle in the Settings screen.
Thanks for all the great feedback! We’re always looking for ways to improve the app. Email [support@pagerduty.com](mailto:support@pagerduty.com) with any comments.
## 5.60 — 5 Aug 2019
**iOS**
- We've improved the app experience for stakeholders as part of our new Business Response workflows. This helps everyone at your company stay informed wherever they are.
Thanks for all the great feedback! We’re always looking for ways to improve the app. Email [support@pagerduty.com](mailto:support@pagerduty.com) with any comments.
**Android**
- We've improved the app experience for stakeholders as part of our new Business Response workflows. This helps everyone at your company stay informed wherever they are.
Thanks for all the great feedback! We’re always looking for ways to improve the app. Email [support@pagerduty.com](mailto:support@pagerduty.com) with any comments.
## 5.59 — 29 Jul 2019
**iOS**
- Automatically share status updates with those who need to know by associating status updates with business services.
- Add stakeholders and teams as subscribers to updates so they are notified in real-time.
Thanks for all the great feedback! We’re always looking for ways to improve the app. Email [support@pagerduty.com](mailto:support@pagerduty.com) with any comments.
**Android**
- Automatically share status updates with those who need to know by associating status updates with business services.
- Add stakeholders and teams as subscribers to updates so they are notified in real-time.
Thanks for all the great feedback! We’re always looking for ways to improve the app. Email [support@pagerduty.com](mailto:support@pagerduty.com) with any comments.
## 5.58 — 22 Jul 2019
**iOS**
- We got down to business and defeated a layout issue on the Open Incidents screen.
Thanks for all the great feedback! We’re always looking for ways to improve the app. Email [support@pagerduty.com](mailto:support@pagerduty.com) with any comments.
**Android**
- We got down to business and defeated this bug that would report timeline entries from web when it came via mobile.
Thanks for all the great feedback! We’re always looking for ways to improve the app. Email [support@pagerduty.com](mailto:support@pagerduty.com) with any comments.
## 5.57 — 15 Jul 2019
**iOS**
- We found some reports of a couple of crashes and took care of them, just for you.
- Remember when we told you we fixed an issue where you'd tap a push notification for an incident and it wouldn't take you to that incident? We fixed it for real this time. Promise.
- Did we mention that we now support multitasking on iPad? This isn't new for 5.57, but we're still excited about it!
Thanks for all the great feedback! We’re always looking for ways to improve the app. Email [support@pagerduty.com](mailto:support@pagerduty.com) with any comments.
**Android**
- Doing some behind the scenes work for upcoming functionality. Stay tuned!
Thanks for all the great feedback! We’re always looking for ways to improve the app. Email [support@pagerduty.com](mailto:support@pagerduty.com) with any comments.
## 5.56 — 8 Jul 2019
**iOS**
- Last week, we brought you changes to snooze until a given date (up to a week). This week, we bring _for_ you the ability to snooze FOR (i'll show myself out) a given amount of days/hours (also up to a week).
- iPad support is here! Enjoy a roomy split view or even multitask along with another app. Thanks Spencer for pushing this!
Thanks for all the great feedback! We’re always looking for ways to improve the app. Email [support@pagerduty.com](mailto:support@pagerduty.com) with any comments.
**Android**
- Added configuration warnings to help you understand best practices when configuring your contact methods and notification rules.
Thanks for all the great feedback! We’re always looking for ways to improve the app. Email [support@pagerduty.com](mailto:support@pagerduty.com) with any comments.
## 5.55 — 1 Jul 2019
**iOS**
- You can snooze an incident for longer than 24 hours now (up to a week) by choosing Snooze Until.
- Fixed an issue where you'd tap a push notification for an incident and it wouldn't take you to that incident.
Thanks for all the great feedback! We’re always looking for ways to improve the app. Email [support@pagerduty.com](mailto:support@pagerduty.com) with any comments.
**Android**
- Clarification on warnings about your notification rules.
Thanks for all the great feedback! We’re always looking for ways to improve the app. Email [support@pagerduty.com](mailto:support@pagerduty.com) with any comments.
## 5.54 — 24 Jun 2019
**iOS**
- The decline message from a declined responder request shows in the Timeline in Incident Details. It was missing before so you couldn't see if it was "can't, no Internet" vs. "I'm fine, I just don't want to".
- More work going on behind the scenes for upcoming functionality.
Thanks for all the great feedback! We’re always looking for ways to improve the app. Email [support@pagerduty.com](mailto:support@pagerduty.com) with any comments.
**Android**
- More work going on behind the scenes for upcoming functionality.
Thanks for all the great feedback! We’re always looking for ways to improve the app. Email [support@pagerduty.com](mailto:support@pagerduty.com) with any comments.
## 5.53 — 17 Jun 2019
**iOS**
- Removed the Add Status Update button for read-only users.
Thanks for all the great feedback! We’re always looking for ways to improve the app. Email [support@pagerduty.com](mailto:support@pagerduty.com) with any comments.
**Android**
- Gave a real shot in the arm to the performance of Add Responder for large accounts.
- Added filtering escalation policies by tag to Add Responder.
- Added a Try Now button to the login screen.
- We'll load all your incident log entries now, not just the latest 100.
- Fixed an issue with Do Not Disturb for the OnePlus 6's physical switch.
Thanks for all the great feedback! We’re always looking for ways to improve the app. Email [support@pagerduty.com](mailto:support@pagerduty.com) with any comments.
## 5.52 — 10 Jun 2019
**iOS**
- You can delete an override by tapping the override in the Schedule screen and selecting Delete (thanks Jenny!).
- The Status Updates tab is now hidden for accounts without Modern Incident Response.
- Spiffed up the rainbow logo just in time to celebrate Pride Month here at PagerDuty and worldwide!
- Fixed the empty state for Open Incidents on iOS 11 devices. (No, it wasn't meant to be a piece of abstract art.)
Thanks for all the great feedback! We’re always looking for ways to improve the app. Email [support@pagerduty.com](mailto:support@pagerduty.com) with any comments.
**Android**
- Pressing Back won't exit the app unless you're on a root screen (thanks Abdollah!)
- You can delete an override by tapping the override in the Schedule screen and selecting Delete.
- The Status Updates tab is now hidden for accounts without Modern Incident Response.
- Various bugs and crashes fixed (but I'm out of room).
Thanks for all the great feedback! We’re always looking for ways to improve the app. Email [support@pagerduty.com](mailto:support@pagerduty.com) with any comments.
## 5.51 — 3 Jun 2019
**iOS**
- Now you can filter escalation policies by tag while adding a responder, not just while reassigning.
- Fixed a crash on the incidents list.
- The Toronto Raptors are advancing to the NBA Finals for the first time in franchise history.
Thanks for all the great feedback! We’re always looking for ways to improve the app. Email [support@pagerduty.com](mailto:support@pagerduty.com) with any comments.
**Android**
- An informational banner was added to the Add Status Update screen to let you know how many users and/or teams will be notified, as well as how many business services will be impacted.
- Fixed a crash-on-launch bug for folks with spotty Internet.
Thanks for all the great feedback! We’re always looking for ways to improve the app. Email [support@pagerduty.com](mailto:support@pagerduty.com) with any comments.
## 5.50 — 28 May 2019
**iOS**
- If you're not sure what tags are associated with an escalation policy, you can now see the list of tags associated with an escalation policy
- If you have a tendency to type the wrong key in your password, say no more. Our new intern Jenny has got you covered. Now you can toggle the password visibility if you're not sure if you just typed 'iluvshrek2' or 'iluvshrek3' because believe me, those are two _very_ different opinions.
- When you manually create an incident, the title and description fields will now span multiple lines, so you can see any long messages you might type. Thanks Jenny!
Thanks for all the great feedback! We’re always looking for ways to improve the app. Email [support@pagerduty.com](mailto:support@pagerduty.com) with any comments and/or Pagey fanmail.
**Android**
- If you have a tendency to type the wrong key in your password, say no more. Our new intern, Santhu has got you covered. Now you can toggle the visibility if you're not sure what you typed!
You can now see the list of tags associated with an escalation policy.
Thanks for all the great feedback! We’re always looking for ways to improve the app. Email [support@pagerduty.com](mailto:support@pagerduty.com)with any comments and/or Pagey fanmail.
## 5.49 — 20 May 2019
**iOS**
- If you tap the priority or duration of a disrupted business service in Visibility, it navigates you to that incident.
- We sped up the networking behind adding a responder. Things should be much snappier now when you're browsing and searching the lists of users and escalation policies.
- Fixed an issue where we treated alerts like incidents in the Incident Details. Alerts aren't incidents, and they don't like it when you treat them like incidents.
- Fixed a crash on iPad when you tried to merge incidents.
Thanks for all the great feedback! We’re always looking for ways to improve the app. Email [support@pagerduty.com](mailto:support@pagerduty.com) with any comments and/or Pagey fanmail.
**Android**
- Fixed a bug where tags might not load when reassigning an incident to an escalation policy and filtering them by tag.
Thanks for all the great feedback! We’re always looking for ways to improve the app. Email [support@pagerduty.com](mailto:support@pagerduty.com) with any comments and/or Pagey fanmail.
## 5.48 — 13 May 2019
**iOS**
- Tapping on the author of a status update in Incident Details will take you to their profile.
- When reassigning incidents you can now search for an Escalation Policy by any tags associated with it.
Thanks for all the great feedback! We’re always looking for ways to improve the app. Email [support@pagerduty.com](mailto:support@pagerduty.com) with any comments and/or Pagey fanmail.
**Android**
- When reassigning incidents you can now search for an Escalation Policy by any tags associated with it.
Thanks for all the great feedback! We're always looking for ways to improve the app. Email [support@pagerduty.com](mailto:support@pagerduty.com) with any comments and/or Pagey fanmail.
## 5.47 — 8 May 2019
**iOS**
Spring is here, and baseball is back! What's new in 5.47:
- The assignee now appears at the top of the Responders list in the Incident Details, and you can tap it to head straight to their profile! It's like a 5-4-3 double play on your phone.
- Fixed a bug with overlapping text on the Reassign screen when you had bad Internet connectivity. It was the mobile equivalent of Tampa Bay putting four outfielders up against Justin Smoak – looks strange, and doesn't work either.
Thanks for all the great feedback! We’re always looking for ways to improve the app. Email [support@pagerduty.com](mailto:support@pagerduty.com) with any comments or if you just wanna trash talk the Dodgers.
**Android**
- See incident Status Updates, the subscriber list, and even send out new updates from a new tab on Incident Details. Keep stakeholders informed on the go.
Thanks for all the great feedback! We're always looking for ways to improve the app. Email [support@pagerduty.com](mailto:support@pagerduty.com) with any comments or again, if you just **really** wanna trash talk the Dodgers.
## 5.46.1 — 29 Apr 2019
**iOS**
- Team information is here! Tap Teams and have a look at your teams' schedules, escalation policies, and members. There's no "I" in team, but there is "MEAT"!
- Add users and/or teams as subscribers for Status Updates from the Incident Details Screen. (Requires Modern Incident Response.)
- Fixed "the" bug for Monday-Sunday calendar users; thanks to everyone who reported it! Wednesday-Tuesday calendar functionality is probably broken, but nobody can prove it.
Thanks for all the great feedback! We’re always looking for ways to improve the app. Email [support@pagerduty.com](mailto:support@pagerduty.com) with any comments.
## 5.46 — 29 Apr 2019
**Android**
- Fixed some display issues in My On-Call Shifts to get you what you need to know more quickly.
- Fixed an issue with some OnePlus devices where Override System Volume would not play sounds if the device was muted.
Thanks for all the great feedback! We're always looking for ways to improve the app. Email [support@pagerduty.com](mailto:support@pagerduty.com) with any comments.
## 5.45 — 23 Apr 2019
**iOS**
- Tap a responder on Incident Details to jump to their profile.
- Add a subscriber (user or team) to an incident (requires Modern Incident Response).
- Send subscriber status updates directly from the app. This was in the last release but we wanted to see if anyone would notice first.
- Invite users directly from the app, in the User list. Tap that little "+" button. (Only for Owner and Global Admin roles.)
Thanks for all the great feedback! We’re always looking for ways to improve the app. Email [support@pagerduty.com](mailto:support@pagerduty.com) with any comments.
**Android**
- Bug fixes and performance improvements.
Thanks for all the great feedback! We're always looking for ways to improve the app. Email [support@pagerduty.com](mailto:support@pagerduty.com) with any comments.
## 5.44 — 16 Apr 2019
**iOS**
- Quickly see which users have been added as responders (and their status) in the Incident Details view, along with their avatars, which are probably all grey silhouettes, so maybe I shouldn't advertise that part.
- Squashed some bugs in schedules.
Thanks for all the great feedback! We’re always looking for ways to improve the app. Email [support@pagerduty.com](mailto:support@pagerduty.com) with any comments.
**Android**
- Unacknowledge an incident from the Incident Details screen.
- Custom Actions should be more reliable on Resolved Incidents.
Thanks for all the great feedback! We're always looking for ways to improve the app. Email [support@pagerduty.com](mailto:support@pagerduty.com) with any comments.
## 5.43 — 8 Apr 2019
**iOS**
- Due to a misunderstanding (between myself and the English language) the Apple Watch app was accidentally removed for owners of the original Apple Watch. It's back now, and we're sorry for the inconvenience.
- Fixed a couple crashes WHICH I WILL NOT NAME SO AS TO DEPRIVE THEM OF THE SATISFACTION.
Thanks for all the great feedback! We’re always looking for ways to improve the app and bring back lost functionality. Email [support@pagerduty.com](mailto:support@pagerduty.com) with any comments.
**Android**
- A few tune-ups to our multi-select functionality from the last release.
- Swiping incidents now changes colo(u)r to make you feel like **The Thing Is Going To Happen** when you let go.
Thanks for all the great feedback! We're always looking for ways to improve the app. Email [support@pagerduty.com](mailto:support@pagerduty.com) with any comments.
## 5.42 — 2 Apr 2019
**iOS**
- The redesigned My On-Call Shifts displays your upcoming and always-on-calls in a new easy-to-grok manner. Quickly navigate from an on-call to do an override, view the escalation policy, or the schedule.
- View Status Updates on incidents, along with who's subscribed to the incidents. (Requires Modern Incident Response.)
Thanks for all the great feedback! We’re always looking for ways to improve the app. Email [support@pagerduty.com](mailto:support@pagerduty.com) with any comments.
**Android**
- Multi-select is here! Long-press an incident to start multi-selecting. From there, ack, resolve, snooze, or merge some incidents.
- Fixed a couple crashes here and there.
Thanks for all the great feedback! We're always looking for ways to improve the app. Email [support@pagerduty.com](mailto:support@pagerduty.com) with any comments.
## 5.41 — 25 Mar 2019
**iOS**
- If you have more than 100 log entries in the Timeline of an incident, we'll load 'em all. We won't even stop to think about it.
Thanks for all the great feedback! We’re always looking for ways to improve the app. Email [support@pagerduty.com](mailto:support@pagerduty.com) with any comments.
**Android**
- We've revamped the "On-call Timeline" so much so that it's now called “My On-Call Shifts!” We've brought visual as well as usability updates that are in line with your feedback!
- We've introduced the ability to customize how swiping works on Android. Go to "Settings"=>"Swipe Actions" to see how.
Thanks for all the great feedback! We're always looking for ways to improve the app. Email [support@pagerduty.com](mailto:support@pagerduty.com) with any comments.
## 5.40 — 18 Mar 2019
**iOS**
No bugs in this kitchen but we have some improvements cooking. Thanks for reading our release notes! Here's a grilled cheese recipe from one of our own.
Ingredients
- Two pieces of bread
- American cheese
- Butter
Directions
1. Turn on stove to medium (DON'T burn yourself)
2. Butter the pan (it's a CHEAT meal)
3. Place both slices of bread ON pan until brown
4. Flip one piece over (you don't need to go to COLLEGE for this)
5. Place 1-2 slices of cheese on that piece
6. Put other piece of bread on top
7. Press down and cook until cheese is melted and that umami flavor comes out
8. Enjoy a trip to Flavortown
Thanks for all the great feedback and ADMISSIONS of appreciation! We’re always looking for ways to improve the app. Email [support@pagerduty.com](mailto:support@pagerduty.com) with any comments.
**Android**
Chandler the Product Manager: I need you to freshen up the app.
Me: Say no more fam
Thanks for all the great feedback! We're always looking for ways to improve the app. Email [support@pagerduty.com](mailto:support@pagerduty.com) with any comments.
## 5.39 — 11 Mar 2019
**iOS**
- We fixed a bug with Single Sign-On, especially if you're not launching it from Safari. Try again!
- We brought back the Tip of the Day on the Open Incidents screen so we can get ready to highlight some upcoming new functionality.
- Fixed an issue where embedded charts with really, uhhh, non-conformant URLs would not render.
- Restricted Access users should no longer see "Access Denied" warnings when viewing incidents. Unless you don't have an account anymore, in which case your access will still be denied. We can't fix that for you.
Thanks for all the great feedback! We’re always looking for ways to improve the app. Email [support@pagerduty.com](mailto:support@pagerduty.com) with any comments.
## 5.38 — 6 Mar 2019
**iOS**
- We spiffed up the incident list to make it more modern. When I say "we", I mean Spencer the intern. Say thanks to Spencer when you see him!
Thanks for all the great feedback! We’re always looking for ways to improve the app. Email [support@pagerduty.com](mailto:support@pagerduty.com) with any comments.
**Android**
- "On-Call Timeline" is now called "My On-Call Shifts". Changes are coming!
- We reclaimed some empty space on Resolved Incidents if you aren't on any teams.
Thanks for all the great feedback! We’re always looking for ways to improve the app. Email [support@pagerduty.com](mailto:support@pagerduty.com) with any comments.
## 5.37 — 25 Feb 2019
**iOS**
- Improvements to the SSO process to make it more seamless.
Thanks for all the great feedback! We’re always looking for ways to improve the app. Email [support@pagerduty.com](mailto:support@pagerduty.com) with any comments.
**Android**
- Bug fixes
Thanks for all the great feedback! We’re always looking for ways to improve the app. Email [support@pagerduty.com](mailto:support@pagerduty.com) with any comments.
## 5.36 — 21 Feb 2019
**iOS**
- We just added the feature every parent of triplets wishes they had – Bulk Snooze. Select multiple incidents by long-pressing an incident in the Open Incidents screen and then snooze 'em. How long is up to you, but you'd better have ants on a log ready when they wake up.
- We fixed the menu in the top-right of Open Incidents to show the Select Incidents option at the right times. We suspect this might be why few people ever found it.
- We found a few more "Incident not found" stragglers and rounded 'em up.
Thanks for all the great feedback! We’re always looking for ways to improve the app. Email [support@pagerduty.com](mailto:support@pagerduty.com) with any comments.
**Android**
- Bug fixes but no performance improvements this time around.
Thanks for all the great feedback! We’re always looking for ways to improve the app. Email [support@pagerduty.com](mailto:support@pagerduty.com) with any comments.
## 5.35 — 15 Feb 2019
**iOS**
- Version 5.35 is a special release just for you, **Edmund**! We've fixed the app icon so the top of the "p" and the top of the base of the "d" are properly aligned. (Once you pointed it out, we couldn't un-see it!)
Also, we're not gonna lie, bug fixes and performance improvements.
Thanks for all the great icon feedback! We’re always looking for ways to improve the app icon. Email [support@pagerduty.com](mailto:support@pagerduty.com) with any icon comments.
**Android**
- We did a facelift on the empty incidents list. We hope you like it!
Thanks for all the great feedback! We’re always looking for ways to improve the app. Email [support@pagerduty.com](mailto:support@pagerduty.com) with comments.
## 5.34 — 1 Feb 2019
**iOS**
- The old set of tips that used to show when you have no incidents have been excised, and in its place a positive message has appeared.
- If you've ever tapped a push notification for an incident assigned to you and gotten "Incident not found", well, we've found those incidents. You won't see that anymore.
- Incidents you've acknowledged can now be unacknowledged in Incident Details, just like on the web.
- Your avatar in the menu is now round, just like your head.
Thanks for all the great feedback! We’re always looking for ways to improve the app. Email [support@pagerduty.com](mailto:support@pagerduty.com) with any comments.
**Android**
- Fixed some small crashes.
- Put up some scaffolding for some major renovations.
Thanks for all the great feedback! We’re always looking for ways to improve the app. Email [support@pagerduty.com](mailto:support@pagerduty.com) with comments.
## 5.33 — 31 Jan 2019
**iOS**
- We've fixed a variety of issues related to Single Sign-On as well as better operation with Google Smart Lock. Should be smooth sailing from here on out.
- More indication of loading progress with our patented three-hundred-sixty-degree spinner technology.
- Thank you Jean from Schenectady who suggested we add "All Star" by Smash Mouth as a ringtone. Unfortunately we were not able to work out a licensing deal with Interscope, but we'll keep trying.
Thanks for all the great feedback! We’re always looking for ways to improve the app. Email [support@pagerduty.com](mailto:support@pagerduty.com) with any comments.
**Android**
- Users on Android 8.0+ can now choose PagerDuty ringtones directly in the System Settings. We will now link you to these settings from within our app.
- Fixed an occasional crash when visiting Schedules
- Added search to Schedules!
Thanks for all the great feedback! We’re always looking for ways to improve the app. Email [support@pagerduty.com](mailto:support@pagerduty.com) with comments.
## 5.32 — 25 Jan 2019
**iOS**
- We sped up the Resolved Incidents list for most accounts. If you aren’t getting a speed boost, don’t feel bad… we didn’t single you out! It’s just that you already had the faster behavior.
- We replaced hyphens with en dashes (the em dash’s lesser-known partner) for ranges of things. If you’re a typography nerd or just someone of the most refined culture (adjusts bowtie) this is for you! Say thanks to Spencer when you see him.
Thanks for all the great feedback! We’re always looking for ways to improve the app. Email [support@pagerduty.com](mailto:support@pagerduty.com) with any comments.
**Android**
- A few tweaks and pokes to keep things running in tip-top shape.
Thanks for all the great feedback! We’re always looking for ways to improve the app. Email [support@pagerduty.com](mailto:support@pagerduty.com) with comments.
## 5.31 — 16 Jan 2019
**iOS**
- Another big revamp ("revamp" is an industry term meaning "reapply a vampire to") for the User screen. Now it reliably shows the user's on-call shifts for the next 14 days (in order!), instead of only the next shift per schedule. This is a big help for everyone, and the nocturnal in particular.
- "On-Call Timeline" is now called "My On-Call Shifts", and there's a link to it in the User screen. Sorry, a button, not a link. It's all the same to your finger.
Thanks for all the great feedback! We’re always looking for ways to improve the app. Email [support@pagerduty.com](mailto:support@pagerduty.com) with any comments.
**Android**
A few tweaks and pokes to keep things running in tip-top shape.
Thanks for all the great feedback! We’re always looking for ways to improve the app. Email [support@pagerduty.com](mailto:support@pagerduty.com) with comments.
## 5.30 — 9 Jan 2019
**iOS**
It's the first release of 2019! You probably knew that because we were all ready for 2018 to end. We're going to be releasing more frequent and smaller updates this year.
- If you're a Team Responder (Legacy) on a team, and you're added as a responder for an incident from another team, you'll have the ability to Accept or Decline. It's funny because "Accept Decline" was my motto for 2018.
- We replaced all of our app icons. Normally I wouldn't tell you this but I want you to know there were a lot of sizes. A lot.
Thanks for all the great feedback! We’re always looking for ways to improve the app. Email [support@pagerduty.com](mailto:support@pagerduty.com) with any comments.
**Android**
- Added good constraints and removed bad constraints on creating on-call overrides. Much better confirmation dialogs.
- If you're a Team Responder (Legacy) on a team, and you're added as a responder for an incident from another team, you'll have the ability to Accept or Decline.
Thanks for all the great feedback! We’re always looking for ways to improve the app. Email [support@pagerduty.com](mailto:support@pagerduty.com) with comments.
## 5.29 — 12 Dec 2018
**iOS**
We're so excited by the response to the new Schedules feature, and we've heard your feedback and made some changes there and elsewhere:
- Cleared up the confirmation message for overrides when you're overriding yourself (hey, no shame in it), or overriding past the end of a shift into the next shift.
- Manually created incidents show who created them in the Timeline.
- In the User screen, no more anxiety-inducing warnings about notification rules and contact methods while the data is loading. The anxiety induction is now saved for after the data is loaded!
- Fixed the error banners that could appear when viewing an incident for a deleted service. (TIL you can delete a service! This product is full of delightful wonders.)
Thanks for all the great feedback! We’re always looking for ways to improve the app. Email [support@pagerduty.com](mailto:support@pagerduty.com) with any comments.
**Android**
- Fixed a bug where Test Notifications sent from our website were silent on the device, or played the low-urgency sound. I think we are all agreed on the meaning of "Test Notification" now.
- Cleared up the confirmation message for overrides when you're overriding yourself (hey, no shame in it), or overriding past the end of a shift into the next shift.
Thanks for all the great feedback! We’re always looking for ways to improve the app. Email [support@pagerduty.com](mailto:support@pagerduty.com) with any comments.
## 5.28 — 14 Nov 2018:
**iOS**
Schedules have been completely revamped! Quickly see who's on call for your team's (or any) schedules. Flip through the past to see who was on call, or head to the future to see who's going to be on call later. You can even book an override while you're there.
A similar list is also available in the user screen. Tap an on call there to immediately jump to that schedule at that time.
Thanks for all the great feedback! We’re always looking for ways to improve the app. Email [support@pagerduty.com](mailto:support@pagerduty.com) with any comments.
**Android**
Schedules have been completely revamped! Quickly see who's on call for any schedule. Flip through the past or future to see who was or will be on call, and even book an override in one place.
Push notifications are no longer treated as alarms.
Low-urgency notifications respect your in-app settings.
Non-incident notifications (on call handoffs, etc.) are no longer low-urgency.
Our apologies for the difficulties!
Thanks for all the great feedback! Email [support@pagerduty.com](mailto:support@pagerduty.com) with any comments.
## 5.26 — 03 Oct 2018
**iOS**
Our support for iOS 10 is being deprecated. As such, this is the last release devices on iOS 10 and below will receive. Rest assured, this release of the app will continue working for you should you remain on iOS 10.
For security reasons, this is also the last release for which we will allow insecure (plain HTTP) resource downloads (e.g. embedded images in incidents). To ensure your resources continue to appear in incidents, ensure you reference them by HTTPS.
What's New in Version 5.26:
- Fixed the display of incidents created through the Jira integration.
- Fixed the infamous bug (in certain circles, e.g. everyone who comes up to me and points it out) where you'd foreground the app and see "Request timed out".
- If you are the assignee and a coordinated responder for an incident, you now see ACK instead of ACCEPT.
- Fixed a strange bug where sections of the On-call Timeline would disappear after a few seconds.
- The search bar when assigning an override to a user is no longer teeny-tiny and is now the average size among its peers.
- Fixed a bug where you might look at a user to see their schedules and get an infinite "Loading..." message.
**Android**
What's New in Version 5.26:
- Fixed the display of incidents created through the Jira integration.
- If you are the assignee and a coordinated responder for an incident, you now see ACK instead of ACCEPT.
- Miscellaneous other crashes and bugfixes.
## 5.25 — 12 Sep 2018
**iOS**
Introducing the new PagerDuty Visibility dashboard! See the operational status of your business services anytime, anywhere. When problems arise, see live performance indicators that quantify the real-time impact of incidents on customers and on the business. Available for Enterprise accounts and those with the PagerDuty Visibility add-on.
As well, we've taken care of the following:
- Merge multiple open incidents together by selecting them (long-press the first incident or choose Select Incidents), pick 'em all, then Change, then Merge.
- Fixed a funky iPhone X bug where the incident action buttons would appear in the unsafe area. You're safe now.
- Fixed a crash here and there, applied another coat of wax.
**Android**
Introducing the new PagerDuty Visibility dashboard! See the operational status of your business services anytime, anywhere. When problems arise, see live performance indicators that quantify the real-time impact of incidents on customers and on the business. Available for Enterprise accounts and those with the PagerDuty Visibility add-on.
## 5.24 — 22 Aug 2018
**iOS**
- Phone numbers, URLs, and email addresses are now tappable in the expanded status updates screen for events in the Incident Timeline, just like in the summary.
- Fixed a crash on the login screen.
**Android**
- Addressed various crashes and odd behaviors.
## 5.23 — 01 Aug 2018
**iOS**
- (Improvement) Replace “0” or “1” with “False” or “True” for custom incident properties
- (Bug) Fixed an issue where the app would crash when you tried to Resolve All incidents while `Live Updating` was enabled
**Android**
- (Bug) Fixed an Oreo issue where the notification sound wouldn’t end when you tapped the notification
- (Bug) Fixed a bug where the notification sound would play even when you didn’t give our app priority in Do Not Disturb
- (Bug) Fixed a problem where some Android phones were unable to login to the app
## 5.22 — 07 July 2018
**iOS**
What's New in Version 5.22, with handy Release Notes Translation Guide:
- Bug fixes => I fixed more bugs than I caused. Probably.
- Performance improvements => no code changes but I think the new Swift compiler will speed things up.
- Lots of work behind the scenes => ... on a different project.
- Addressed some crashes => we wrote them up in JIRA.
- Visual improvements => I moved some plants around in my work area.
- Fixed a crash in Open Incidents while Live Updating is enabled => we actually fixed this.
**Android**
What’s New in Version 5.22:
- Lots of work going on behind the scenes for new features. Stay tuned!
## 5.21 — 20 Jun 2018
**iOS**
What's New in Version 5.21:
- Support for Universal Links! Links to incidents, escalation policies, and users that you tap from Safari, Mail, and Messages will now open in the PagerDuty app.\*\*
- Improved navigation for VoiceOver users in some screens for improved accessibility.
- Fixed a crash when swiping an incident to Snooze, Acknowledge, or Resolve (under very specific conditions).
- Lots and lots of work going on under the hood for a new feature that'll make your on-call life easier.
\*\* Despite the optimistic name, Universal Links are currently only supported on Earth.
**Android**
What’s New in Version 5.21:
- Fixed a crash and some bugs.
## 5.20 — 30 May 2018
**iOS**
This special Moana Soundtrack Edition of the release notes for version 5.20 are brought to you courtesy of Lin-Manuel Miranda, Repeat All, and I guess my boss, who doesn't review these before I submit them anymore. She doesn't realize HOW FAR I'LL GO.
- Introducing enhanced incident-wrangling abilities with Priority! (Only available to users on Basic and above pricing plans.)
- Create, edit and sort Incidents by Priority.
- Incident Priority now displays in push notifications.
- Incident Details enhancements now include one-click URLs and phone numbers!
- Users and decapods (look it up!) in the Observer role now have a "Mine" tab in Open Incidents. We're always trying to bring the most relevant information to WHERE YOU ARE.
- Lots of behind-the-scenes work going on for a SHINY new feature coming later this year. Early-access testers, you KNOW WHO YOU ARE!
- We've stripped down the size of the app for this update. What can we say except YOU'RE WELCOME?
- Some smaller bugs are fixed too, for smoother sailing. WE KNOW THE WAY to find 'em and squash 'em!
Thanks for all the great feedback! We’re always looking for ways to improve the app to be THE ROCK you rely on.
**Android**
What’s New in Version 5.20:
Priority! Create, edit and sort incidents by Priority on Basic (and above) pricing accounts.
Users in the Observer role now have a Mine tab on Open Incidents.
Fixed a bug that wasn't putting your device back into Do Not Disturb mode after overriding volume.
Sped up the Service selection for creating a new incident.
## 5.19 — 09 May 2018
**iOS**
We crunched a lot of bugs this time around. Our shoes are a mess. Think of this like "PagerDuty Service Pack 1". What’s New in Version 5.19:
- 1Password integration! Forget all of your PagerDuty passwords with confidence!
- We sped up the schedule list and service selection. What will you do with all the extra time?
- Fixed a bug where you search for a service and pick one and it enters a different one. This happened just often enough to make you think you were going crazy but not often enough to be reported.
- The On-Call Selfie button has been removed. We still want to see your on-call selfies, just... y'know... from someone else's app.
- Fixed a bug when you search for a user and pick them and then you're still picking a user and you're like what even?
- Fixed a bug where the priority labels disappeared while multi-selecting incidents.
- Fixed a bug where (seriously) you turn your phone upside down and then right-side up and then the Open Incidents is empty. You can imagine how hard this was to diagnose.
- Lots of work under the hood for upcoming features. IT'S UNDER THE HOOD! Please stop peeking under the hood.
Thanks for all the great feedback! We’re always looking for ways to improve the app. Email [support@pagerduty.com](mailto:support@pagerduty.com) with any comments. We won't bug you while you're using the app to give us a rating, but since you're here, in the App Store, giving this a read, we'd appreciate your rating!
Today's rejected app suggestion comes from Jared in Tulsa, OK: "plz add a cat hairball ringtone". Thanks for your suggestion, Jared, but my cat has enough hairballs that this wouldn't even wake me up.
**Android**
What’s New in Version 5.19:
- Lots and lots of fixes to bugs reported by our users.
- Serious performance improvements!
- Lots of work under the hood for upcoming features.
## 5.18 — 18 Apr 2018
**iOS**
Spring is in the air (several states and provinces excluded), and baseball is back! What could make life better, but a new PagerDuty release? What’s New in Version 5.18:
- Added a Force Touch shortcut to the app to create a new incident. Push hard on the icon (but not too hard, just kinda hard, like you're popping bubble wrap) to initiate.
- Fixed a couple small issues relating to scrolling and Live Updating. Honestly, the details would bore you.
- Setting "Mute Sound" on low-urgency notifications (available on eligible plans – contact [sales@pagerduty.com](mailto:sales@pagerduty.com) to upgrade your plan) actually mutes the sound when the app is in the background. Since the PagerDuty app is usually in the background, this is great news. If your PagerDuty app is usually in the foreground, we're flattered.
- Users on plans without separate high- and low-urgency notification rules can now see their notification rules and add or delete them in the app!
- Fixed an issue displaying an empty space for the priority on incidents when some had priorities and some didn't (available on eligible plans).
**Android**
What’s New in Version 5.18:
- Fixed some crashes.
- Log entries for reassigning incidents now show who reassigned it.
- Various other tweaks 'n' stuff.
## 5.17 — 28 Mar 2018
**iOS**
What’s New in Version 5.17:
- Some things are just better live: music, the musical Grease, sports (not baseball or curling)... and now PagerDuty! The Open Incidents list and Incident Details refresh themselves with space-age Live Updating technology. No more pulling to refresh! (Very minimal data is used, and you can turn off Live Updating in the Settings screen.)
- Phone numbers and URLs in responder requests and notes in the incident timeline are now tappable (and long-pressable for more options).
- Fixed a bug when searching Schedules where you couldn't pick a schedule. This is gonna do wonders for Schedules' sense of self-worth.
**Android**
What’s New in Version 5.17:
Some things are just better live: music, the musical Grease, sports (not baseball or curling)... and now PagerDuty! The Open Incidents list and Incident Details refresh themselves with space-age Live Updating technology. No more pulling to refresh! (Very minimal data is used, and you can turn off Live Updating in the Settings screen.)
## 5.16 — 07 Mar 2018
**iOS**
What’s New in Version 5.16:
My project manager: "So what do we announce for this new release?"
Me: "Uh, well, nothing in particular, we did a lot of cleaning up."
My project manager: "Sure, I get that, but what did you DO for the past three weeks?"
Me: "Would you accept 'bug fixes and performance improvements'?"
My project manager: "NO"
Me: "Okay, I promise I won't put that."
**Android**
What’s New in Version 5.16:
- Bug fixes and improvements
## 5.15 — 02 Feb 2018
**iOS**
What’s New in Version 5.15:
- Low-urgency notification rules are now separated from high-urgency notification rules! You can edit your low-urgency rules in your profile, located in the side menu. (Low-urgency rules not available on Lite packages.)
- As we mentioned in our last release notes, iOS 9 is now deprecated. If you can read this, you must have upgraded!
- Fixed a bug where there were two buttons with identical functionality in the Search bar. We've consolidated down to one to avoid any confusion between the two. This is a 50% reduction in buttons and the savings will be reflected in the price of our app in the App Store.
- We chopped out some extra padding here and there, which is the opposite of what you should do if you play hockey or football.
**Android**
What’s New in Version 5.15:
- Native login is finally here! Login directly through the app, not through a web page in the app. Compatible with most password managers. (No offense to the web, you've been great. You really have.)
- Low-urgency notification rules are now separated from high-urgency notification rules! You can edit your low-urgency rules in your profile, located in the side menu. (Low-urgency rules not available on Lite packages.)
## 5.14 — 24 Jan 2018
**iOS**
This will be the last release supporting iOS 9. If you're a steadfast iOS 9 user, that's okay, this version of the app will continue working for you for a long time still, but no further updates will be delivered to your device. This means we can more easily support newer iOS features.
What's New in Version 5.14:
- Improvement to the SSO login screen. It's now more clear that you're entering the subdomain, and we supply the domain. We're cool like that.
- Clarification about the length allowed for a responder message. If your message was going to be truncated for SMS, you'd want to know, right? We would.
**Android**
What's new in 5.14:
- Incidents with conference bridges now show the number more prominently, and dial the number in-app so that the extension works. You will be asked for dialing permission the first time you use this.
- Clarification about the length allowed for a custom responder message.
- Some UI polish.
## 5.13 — 03 Jan 2018
**iOS**
What's New in Version 5.13:
- Select multiple incidents by long-pressing an incident in the Open Incidents list, or through the "..." menu, then acknowledge or resolve them. I'm not going to tell you what to do but the long press is way more satisfying.
**Android**
What's New in Version 5.13:
- Fixed a bug where when a user receives status update link via SMS, clicking that link redirects them to a blank page within the PD app instead of the status page of the incident.
---
URL: https://docs.pagerduty.com/get-started/mobile-status-dashboard
# Mobile Status Dashboard
View business service operational status and impacting incident details from the PagerDuty mobile app's status dashboard.
The Mobile Status Dashboard gives stakeholders an overview of top-level business services' operational status and detailed information about service-impacting incidents. The Mobile Status Dashboard enhances transparency and communication within organizations by keeping stakeholders informed about the status and impact of incidents, ultimately aiding in quicker incident resolution and better service management.
> **Availability:** The status dashboard feature is available with PD Reliability Platform plans. It's also available with the following pricing plans: Business, Digital Operations (legacy) and Enterprise for Incident Management. Please contact our [Sales Team](https://www.pagerduty.com/contact-sales/) if you would like to upgrade to a plan including the status dashboard feature.
## View Mobile Status Dashboard
To view the status dashboard in the mobile app, navigate to **More** and select **Status Dashboard**. The main screen will present the top-level [business services](/incident-management/services/business-services) in your PagerDuty account.
You can view other Status Dashboards in your account by tapping in the top-right and selecting another dashboard.
*Select a different status dashboard*
> **Edit the Status Dashboard:** If you would like to make changes to your status dashboard (e.g., modify business service dependencies and subscriptions), you can make these changes in the web app. Please read [Status Dashboard](/incident-management/communicate/internal-status-page) for more information.
### All Business Services Operational
When there are no incidents with priority open on any supporting technical services, the business status summary will show **All business services operational**. You will see a green banner at the top of the screen and a green suitcase icon next to each business service.
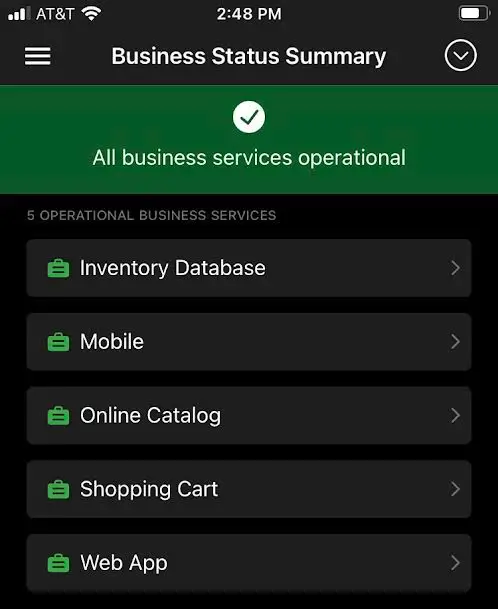
#### Incident Without Priority
It is possible for a business service to have an incident on a supporting technical service, which does not affect the status dashboard. This happens when the incident does not have a [priority](/incident-management/incidents/incident-priority). While the status dashboard will still display as operational, you can see more information about the affected technical service on the business service’s details screen.
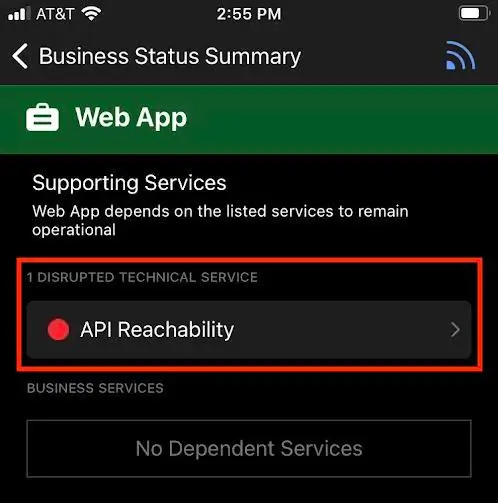
*Incident without priority*
Tap the technical service’s **name** to see more information about the service. You can also tap **View [X] Impacting Incidents** to view a list of incidents. Select an incident from the list to navigate to its details screen.
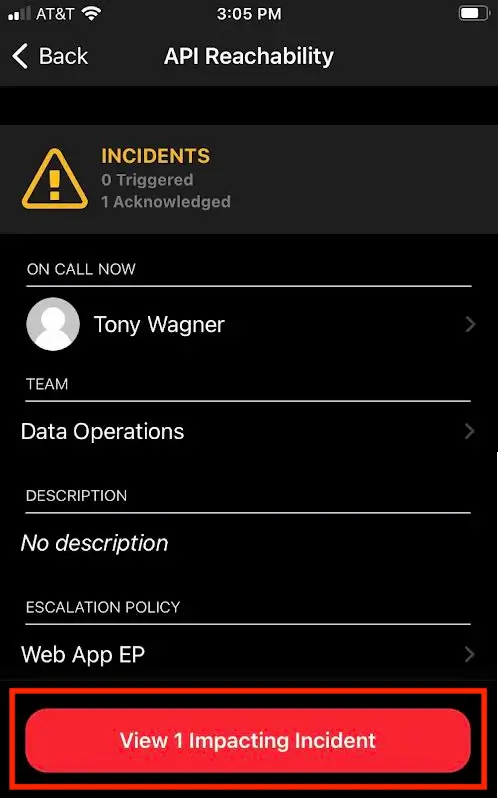
*Technical service details*
### Disrupted Business Service
When a business service is disrupted, a red banner will display at the top of the screen and the business service will display the impacting incident’s priority. If multiple incidents impact the same business service, the highest priority will be displayed next to the business service. If multiple business services are impacted, they will be ordered by the highest priority.
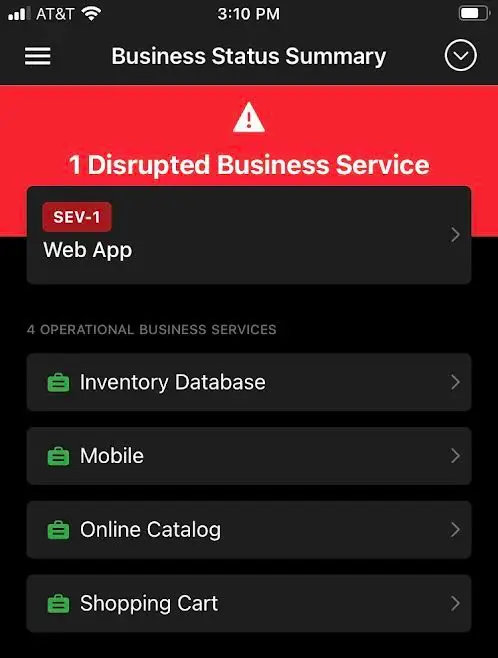
*Disrupted business service*
Select a disrupted business service to view details about the disrupted technical service, or tap **View [X] Impacting Incidents** to see a list of impacting incidents.
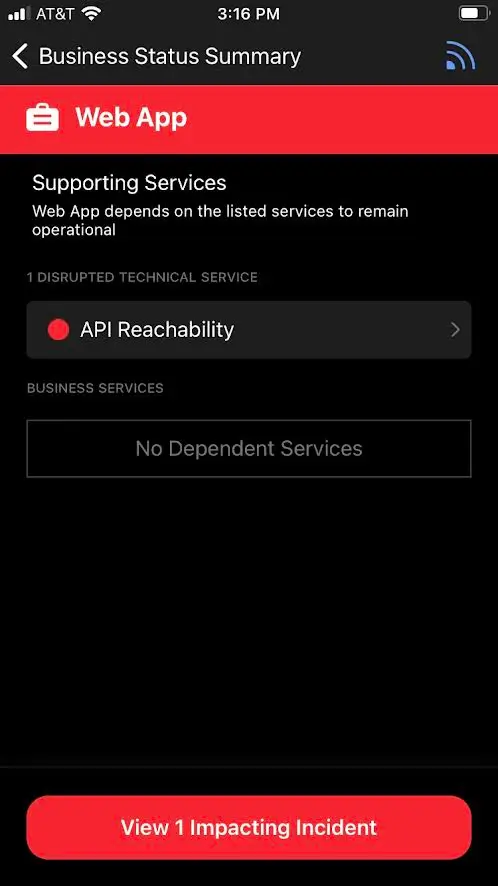
*Disrupted technical service*
## Home Screen Status Dashboard
A condensed view of the Mobile Status Dashboard is also available on the [Mobile Home Screen](/get-started/mobile-app/mobile-home-screen). Please read [Home Screen Status Dashboard](/get-started/mobile-status-dashboard/home-screen-status-dashboard) for more information.
---
URL: https://docs.pagerduty.com/get-started/mobile-status-dashboard/home-screen-status-dashboard
# Home Screen Status Dashboard
Monitor business services' status directly from your home screen
## View Status Dashboard on the Home Screen
Users can view [Internal Status Pages](/incident-management/communicate/internal-status-page) in a widget on the [Mobile Home Screen](/get-started/mobile-app/mobile-home-screen). The widget displays up to three impacted [business services](/incident-management/services/business-services). Tap a business service's name to view more details. If there are more than three disrupted services, tap **View [X] Disrupted Services** to navigate to the [Mobile Status Dashboard](/get-started/mobile-status-dashboard), where you can view the complete list of disrupted services.
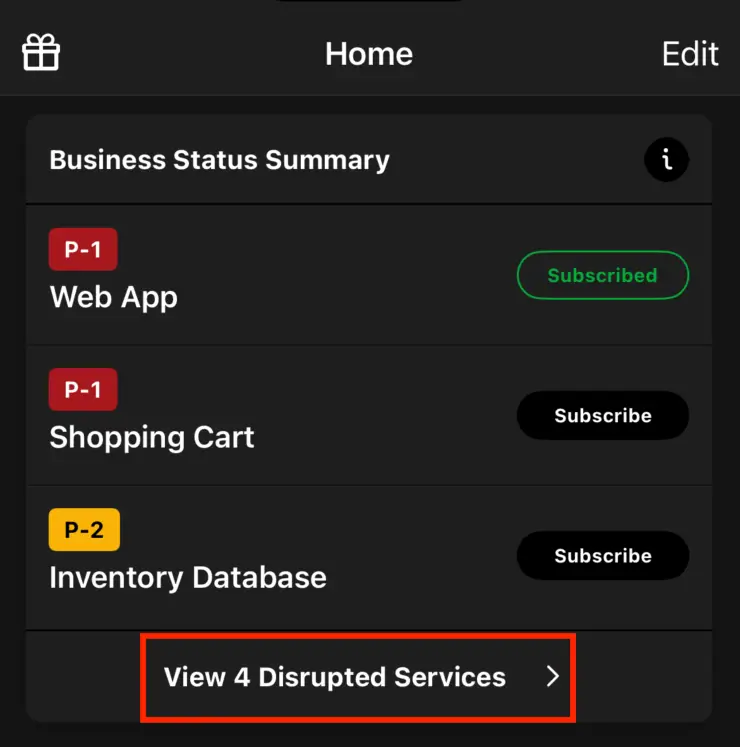
*View all disrupted business services*
When there is no disruption, the status dashboard widget displays the message **All business services operational**, with the option to view the Status Dashboard.
> **Configure Business Services:** You'll need to configure business services before the Status Dashboard widget will display any information. If you have not yet set up business services, you'll see a message **Business Services are not configured**.
>
> Please read [Business Services](/incident-management/services/business-services) for more information about configuring business services.
### Change the Default Status Dashboard
The home screen's Status Dashboard widget displays the **Business Status Summary** dashboard by default. You can change which dashboard the widget displays by selecting a different dashboard in the mobile app. Please read [View Mobile Status Dashboard](/get-started/mobile-status-dashboard#view-mobile-status-dashboard) for more information.
### Subscribe to a Business Service
Tap **Subscribe** next to a business service to receive a notification for future [status updates](/incident-management/communicate/communicate-with-stakeholders#status-updates).
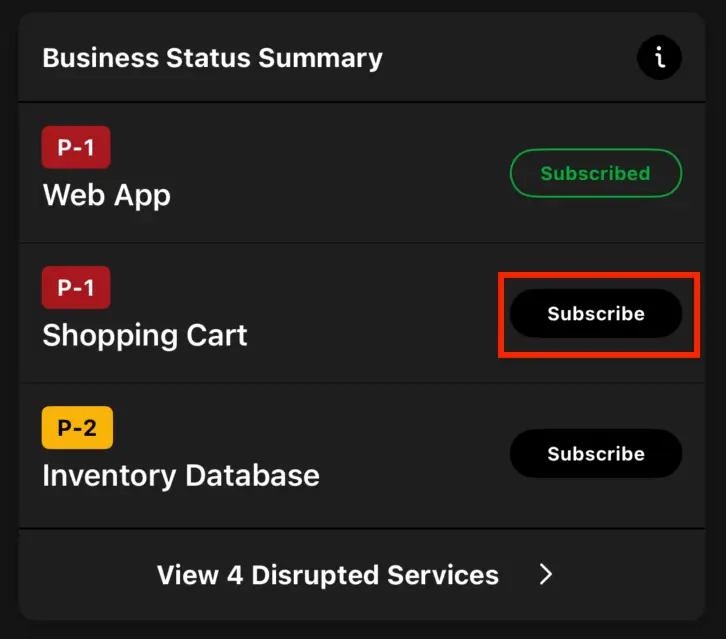
*Subscribe to an impacted business service*
## Remove Status Dashboard from the Home Screen
You can remove the status dashboard the home screen:
**iOS**
1. Navigate to **Home** → **Edit**.
2. Tap next to **Status Dashboard**.
3. Tap **Save**.
**Android**
1. Navigate to **Home** and tap .
2. Tap next to **Status Dashboard**.
3. Tap **Save**.
---
URL: https://docs.pagerduty.com/get-started/navigate-incidents-page
# Navigate the Incidents Page
A walkthrough of the features on the PagerDuty Incidents page
The Incidents page is the main screen that appears when you first log in to your PagerDuty account. You can navigate to this page from other screens by clicking **Incidents** in the menu.
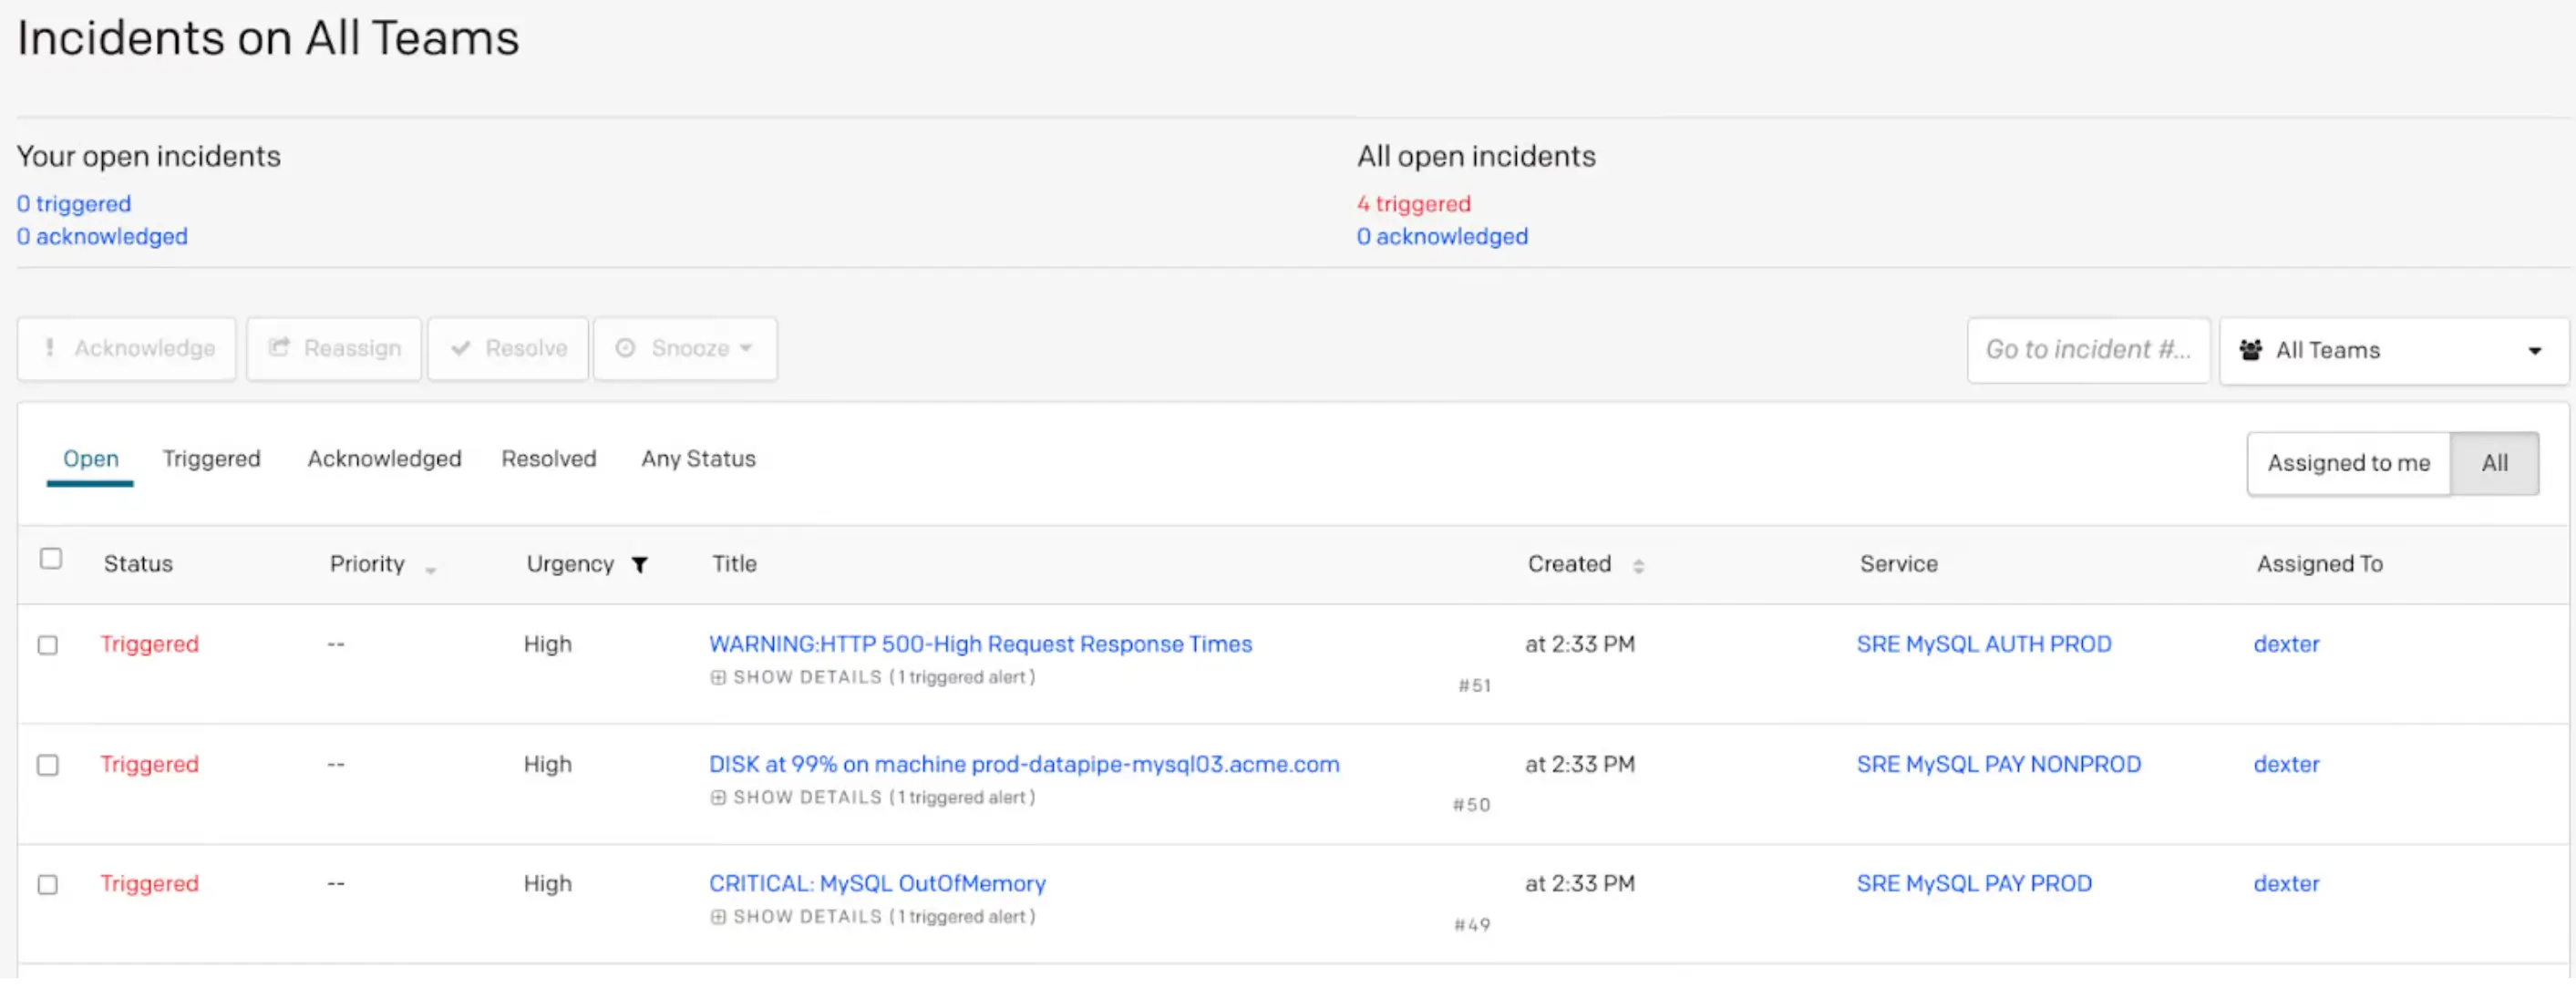
*The Incidents page*
## Incidents on All Teams
The top of the dashboard shows any open incidents currently active in the account. **Your open incidents** shows triggered and acknowledged incidents assigned to you. **All open incidents** shows all triggered or acknowledged incidents in the account. Triggered incident counts appear in red, acknowledged incident counts appear in orange, and counts with no open incidents appear in blue.

*Incidents on all Teams*
Below this module, you can view and act on incidents assigned to you or across the account:
- To view incidents assigned to you, click **Assigned to me**.
- To view all incidents in PagerDuty, click **All**.
- To filter incidents by status, select **Open**, **Triggered**, **Acknowledged**, **Resolved**, or **Any Status**.
- To take action on an incident, select the **checkbox** to the left of the incident, then click **Acknowledge**, **Reassign**, **Resolve**, **Snooze**, or **Merge Incidents**.
## High and Low Urgency Incidents
You can configure [Notification Urgency](/incident-management/services/configurable-service-settings#notification-urgency) to notify you based on your [notification rules](/account-admin/user-profile/notification-rules).
In the PagerDuty incident dashboard, incident urgency is indicated in the **Urgency** column. High-urgency incidents appear at the top, followed by low-urgency incidents.
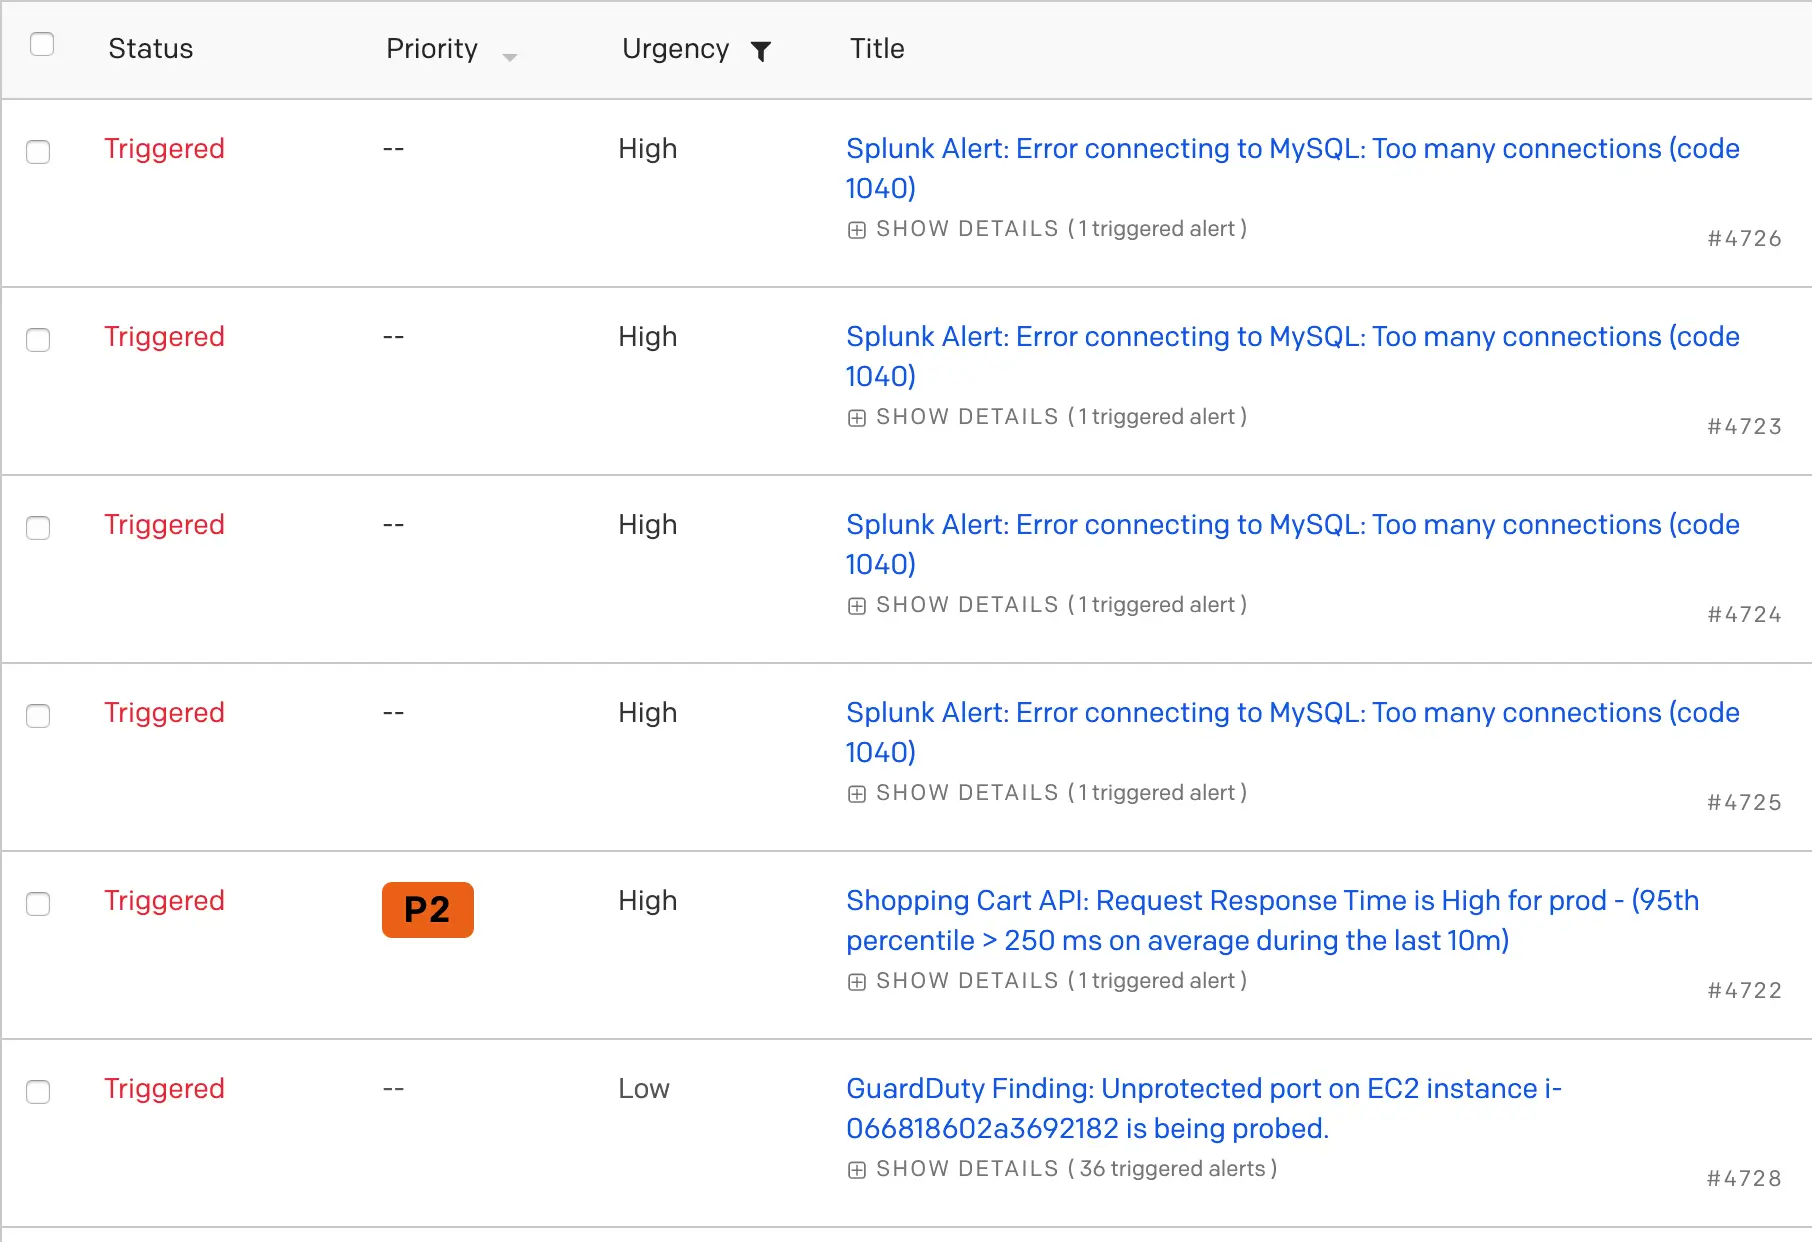
*High and low-urgency incidents*
Incidents maintain this urgency-based order even after acknowledgment — the high-urgency incident remains at the top of the table, followed by the low-urgency incident.
*Acknowledged incidents*
## Activity Over the Last 7 Days
The **Activity over last 7 days** section shows all incidents within the last week. Click an incident **Title** to view the incident details and incident log. Click a **service name** to access the service directly. Click a **user's name** to view their user profile.
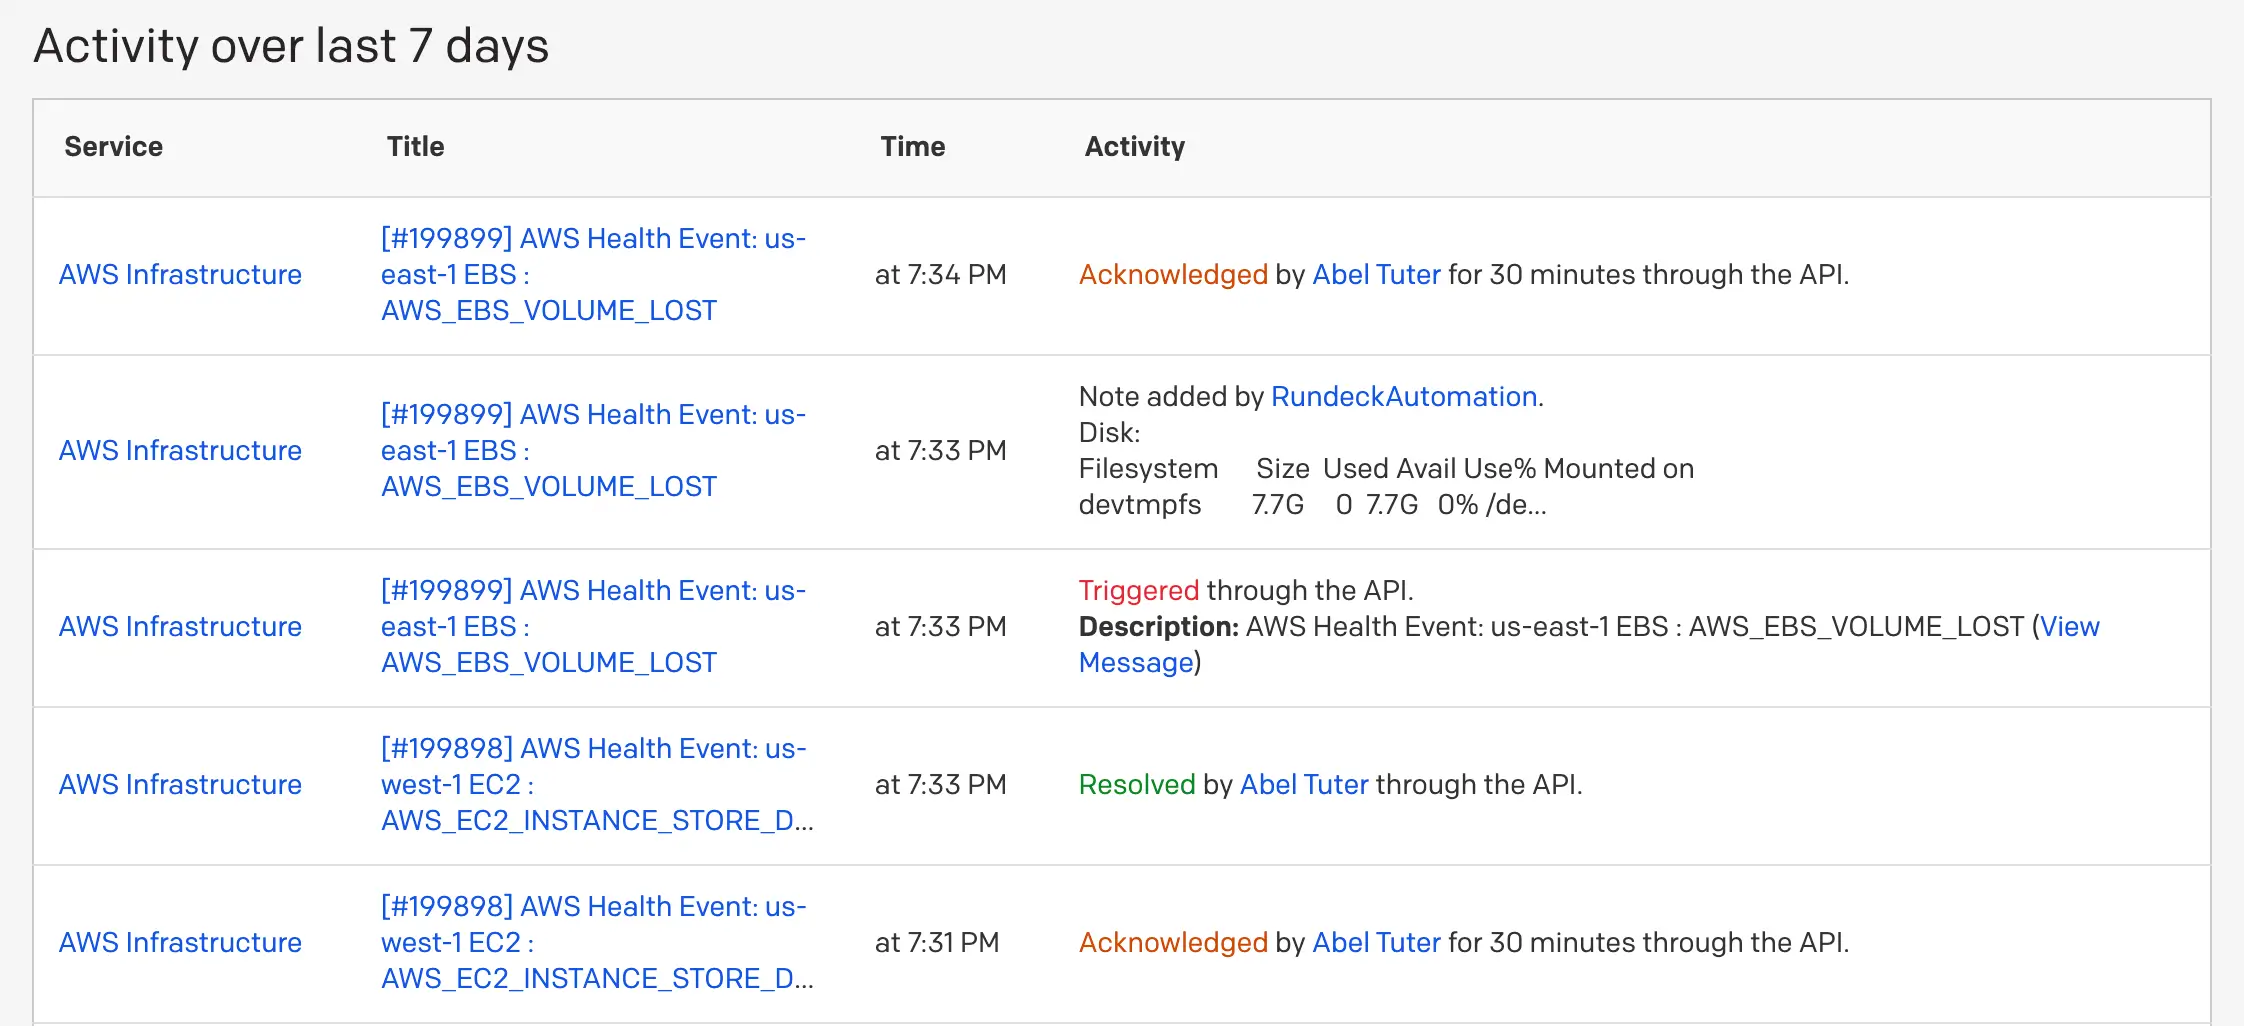
*Activity over last 7 days*
## On-Call Widgets
- The **[My On-Call Shifts](/incident-management/schedules/my-on-call-shifts#my-on-call-shifts-widget)** widget displays shifts you are currently on call for with dates and times, a list of escalation policies you are on call for, and upcoming shifts with dates and times.
- The **On Call Now** widget displays specific escalation policies and which users are on call at each escalation level.
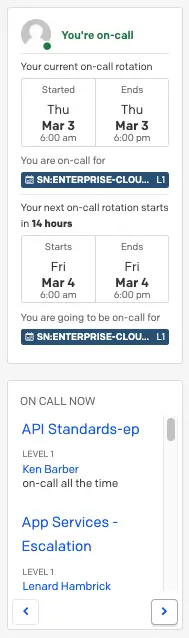
*On-call widgets*
](https://play.google.com/store/apps/details?id=com.pagerduty.android&hl=en_US&pcampaignid=MKT-Other-global-all-co-prtnr-py-PartBadge-Mar2515-1)
> **Supported Operating Systems and Configuration:** The PagerDuty mobile app is supported on devices running iOS 17 and higher, or Android 12 and higher. You do not have access to the latest features if your device does not meet minimum requirements.
>
> **Rooted devices are not supported:**
>
> PagerDuty strengthens security by discontinuing support for the PagerDuty mobile app on rooted and jailbroken devices. Additionally, PagerDuty does not support emulators and tampered versions of the app. This update ensures the integrity of services and aligns with FedRAMP compliance.
> **Minimum OS Requirement Change:** To keep the mobile app secure and up to date, PagerDuty is introducing new minimum operating system requirements. Starting November 16, 2026, new versions of the mobile app require iOS 18 or higher, or Android 13 or higher. Upgrade your device before this date to continue receiving mobile app updates.
## Log In to the Mobile App
You log in to the mobile app by entering the email address associated with your PagerDuty user account. The app then guides you through the rest of the login process and presents you with the most relevant options. Read [Log In to PagerDuty](/get-started/log-in-to-pagerduty) for more information.
### Log In to Multiple PagerDuty Accounts in the Mobile App
1. After you log in to one PagerDuty account, you can add other accounts to the app by navigating to **More** → **User Icon**.
2. Tap **Plus Icon ()** at the top-right (iOS) or bottom-right (Android). If prompted, select the **Environment** you want to open the account in.
3. [Log in to the additional account](/get-started/log-in-to-pagerduty#log-in-via-the-web-or-mobile-app). After you log in, you can see it in the list of accounts at **More** → **User Icon**.
> **PagerDuty for Intune:** PagerDuty for Intune users cannot log in to multiple PagerDuty accounts in the mobile app.
#### Switch PagerDuty Accounts in the Mobile App
1. After you log in to multiple PagerDuty accounts in the mobile app, you can find each account by navigating to **More** → **User Icon**.
2. To switch to another account, navigate to **More** → **User Icon** and tap the desired account.
#### Remove a PagerDuty Account in the Mobile App
##### Remove a PagerDuty Account (iOS)
To remove an account from the iOS mobile app:
1. Navigate to **More** → **User Icon**.
2. Tap **Edit**, then tap **Minus Circle Icon ()** next to the account you want to remove.
3. Tap **Delete**, then **Remove** to confirm your selection.
##### Remove a PagerDuty Account (Android)
To remove an account from the Android mobile app:
1. Navigate to **More** → **User Icon**.
2. Tap **Ellipsis Icon ()** to the right of the account you want to remove, and select **Remove this Account**.
3. Tap **Remove** to confirm your selection.
## Mobile App Walkthrough
Menu options are located at the bottom of the screen:
- **Home**
- **Incidents**
- **My Shifts**
- **Services**
- **More**
- **Escalation Policies**
- **Resolved Incidents**
- **Schedules**
- **Status Dashboard**
- **Teams**
- **Users**

*Mobile app overview*
The app remembers which tab you were on when you navigate away. For example, if you were on the **Incidents** tab viewing an incident **Timeline** and then you switched to the **Services** tab, when you return to the **Incidents** tab you still view that incident's **Timeline**.
### Home Screen
The mobile Home screen highlights top open incidents, and displays on-call shifts and service information, which broadens awareness and streamlines navigation to other important, non-incident information. Read [Mobile Home Screen](/get-started/mobile-app/mobile-home-screen) for more information.

*Mobile app home screen*
### Open Incidents Screen
To view open incidents, select **Incidents** from the bottom navigation.
The **Mine** tab shows all triggered and acknowledged incidents assigned to you. The **All** tab shows all triggered and acknowledged incidents in the account. If you have a Responder role or higher, you also see the **My Teams** tab, which shows all incidents assigned to your teams.
This screen remembers your tab selection (such as **Mine**, **My Teams**, or **All**), so you can access relevant incidents faster when navigating here from other screens.
#### Sort Incidents
You can sort open incidents by tapping **Sort By \[x]** and selecting **Urgency**, **Priority**, or **Recent**.
If you sort by urgency, high-urgency incidents display at the top of the queue and low-urgency incidents display at the bottom, regardless of their status (such as triggered or acknowledged).
### Trigger or Declare an Incident
To trigger an incident in the mobile app:
#### iOS
1. Navigate to **Incidents** at the bottom of the screen, tap **Ellipsis Icon ()** in the top-right, and select **New Incident**.

*Incident actions*
2. Complete the following fields on the screen:
| Field | Value |
| :--------------------------- | :--------------------------------------------------------------------------------------------------------------------------------------------------- |
| **Name** | A meaningful name for the incident. |
| **Description** _(optional)_ | A meaningful description of the incident. |
| **Incident Type** | Select an incident type. |
| **Service** | Select the affected service. |
| **Assign to** _(optional)_ | You can select an escalation policy or user other than the default escalation policy of the service. This overrides who the incident is assigned to. |
| **Priority** _(optional)_ | Add an [incident priority](/incident-management/incidents/incident-priority), if needed. |
3. Tap **Create** in the upper-right to trigger the incident.
#### Android
1. Navigate to **Incidents** at the bottom of the screen, tap **Vertical Ellipsis Icon ()** in the top-right, and select **New Incident**.

*Open incidents*
2. Complete the following fields on the screen:
| Field | Value |
| :--------------------------- | :--------------------------------------------------------------------------------------------------------------------------------------------------- |
| **Title** | A meaningful name for the incident. |
| **Incident Type** | Select an incident type. |
| **Impacted Service** | Select the affected service. |
| **Description** _(optional)_ | A meaningful description of the incident. |
| **Assign to** _(optional)_ | You can select an escalation policy or user other than the default escalation policy of the service. This overrides who the incident is assigned to. |
| **Priority** _(optional)_ | Add an [incident priority](/incident-management/incidents/incident-priority), if needed. |
3. Tap **Create Incident**.
### Respond to Incidents in the Mobile App
Tap **Incidents** in the bottom navigation to see a list of all open incidents.

*Incidents button*
#### Acknowledge an Incident
If a triggered incident is assigned to you, the banner at the top turns red. Your incidents are under the **Mine** tab on the **Open Incidents** screen. There are three ways to acknowledge an incident:
- Swipe left on the incident and tap **Ack**.
- Tap the incident and tap the **Ack** button at the bottom of the incident details page.
- Acknowledge directly from a push notification by long pressing and tapping **Ack** (iOS). PagerDuty push notifications provide the incident number, service, and incident description.
After you acknowledge the incident, the banner turns yellow.
#### Snooze an Incident
There are two ways to snooze an incident in the mobile app:
- After you acknowledge an incident in the incident details page, the **Ack** button becomes a **Snooze** button.
- You can also [snooze](/incident-management/incidents/edit-incidents#snooze-an-incident) an incident by swiping left on an acknowledged incident.
#### Resolve an Incident
##### Resolve an Incident (iOS)
There are two ways to resolve an incident:
- Tap an incident to enter the details screen and tap **Resolve** at the bottom of the screen.
- On the Open Incidents page, swipe left on an incident and tap **Resolve**.
##### Resolve an Incident (Android)
There are two ways to resolve an incident:
- Tap an incident to enter the details screen and tap **Resolve** at the bottom of the screen.
- On the Open Incidents page, swipe right on an incident.
#### Incident Details and Other Actions
Tap an incident to enter the incident details screen. The incident details screen contains incident information, a timeline, and a status updates section.
##### Triage Tab
Tap the **Triage** tab to view the details of the incident and execute different PagerDuty actions:
- **Automation Actions**: [Run an Automation Action](/ai-automation/automation/automation-actions#run-an-action-in-the-mobile-app).
- **Run a Workflow**: [Run an incident workflow](/ai-automation/automation/incident-workflows#manually-run-a-workflow-via-web-or-mobile-app).
- **Add Priority**: [Add a priority level to the incident](/incident-management/incidents/incident-priority#prioritize-an-incident).
- **Custom Incident Actions**: If your account has any [custom incident actions](/integrations/custom-incident-actions) configured, you see those specific actions as buttons.
- **Add Note**: [Add a note to the incident](/incident-management/incidents/edit-incidents#add-a-note-to-an-incident).
- **Status Update**: [Post a status update](/incident-management/communicate/communicate-with-stakeholders#status-updates).
- **Edit Title**: [Edit the incident’s title](/incident-management/incidents/edit-incidents#edit-incident-title).
- **Change Service**: [Reassign the incident's service](/incident-management/incidents/edit-incidents#reassign-an-incidents-service).
- **Change to \[Urgency Level]**: [Change the urgency level](/incident-management/incidents/edit-incidents#edit-incident-urgency) from high to low or vice versa.
- **Add Responder**: [Add responder(s) to the incident](/incident-management/incidents/add-responders#add-responders-to-an-incident).
- **Reassign**: [Reassign](/incident-management/incidents/reassign-incidents#reassign-an-incident) the incident to a different escalation policy or user.
- **Escalate**: Escalate the incident to a different user on the escalation policy.
##### Overview Tab
Tap the **Overview** tab to view the following incident details:
- **Impacted Service**: The service impacted by this incident. Tap the service name to see the details for the service.
- **Responders**: Responders currently responding to the incident. You can take the following actions:
- **View Responder Details**: Tap a responder’s name to view more details.
- **Escalate**: Escalate the incident to the next responder on the escalation policy.
- **Add Responder**: Add more responders to the incident.
- **Reassign**: Reassign the incident to a different escalation policy or user.
- **Conference Bridge**: If your account has a conference bridge configured, you see options to join the bridge and the meeting link.
- **Latest Status Update**: Status updates for the incident.
- **\[#] Subscribers**: Users who are subscribed to the incident. To send a status update to subscribers, tap **Post Status Update**, enter your status update, and tap **Paper Plane Icon ()** in the upper right.
- **Timeline**: An abridged incident timeline with the latest updates. Tap **View Timeline** to see the entire incident timeline.
- **Triggered Alerts**: Alerts for the incident.
- **Past Incidents**: Past incidents related to the current incident.
##### All Actions Button
The **All Actions** button provides quick and easy access to the actions available in the [Triage](#triage-tab) tab and the following incident actions:
- **Snooze**: [Snooze](/incident-management/incidents/edit-incidents#snooze-an-incident) the incident.
- **Unacknowledge**: [Unacknowledge](/incident-management/incidents/overview#unacknowledge-an-incident) the incident if you previously acknowledged it.
- **Subscribe**: [Subscribe](/incident-management/services/business-services/subscription#subscribe-to-incidents) to the incident.
#### Custom Fields
The Custom Fields feature allows you to enrich PagerDuty incidents with critical and helpful metadata throughout the incident lifecycle. Read [Custom Fields on Incidents](/incident-management/incidents/custom-fields-on-incidents#view-custom-fields-in-the-mobile-app) for more information.
#### Related Incidents
> **Availability:** The Related Incidents feature is currently available with the [PagerDuty AIOps](/ai-automation/aiops/overview) add-on. If you want to sign up for a trial of this and other PagerDuty AIOps features, read [PagerDuty AIOps Trials](/ai-automation/aiops/overview#pagerduty-aiops-trials).
On the incident details screen, you can select the blue **Related Incidents** button to review suggested incidents that are impacting other responders and PagerDuty services.
You can select an incident under the Related Incidents list, which opens the corresponding incident details screen. Tap **Left Chevron Icon ()** to return to the original incident.

*Related incidents*
#### Resolved Incidents Screen
Navigate to **More** → **Resolved Incidents** to view a list of all resolved incidents. Tap an incident to view its details. Select the **My Teams** tab to see incidents related to your teams, or select the **All** tab for all incidents across the entire account.
### Service Directory Screen
Select **Services** in the bottom navigation to view the Service Directory. The Service Directory is a searchable, high-level view of all PagerDuty services in your organization and their corresponding owners.
To search the Service Directory screen, tap **Search Icon ()** in the upper right and search by service name.
To filter services, select the **My Teams** tab for services related to your teams, or the **All** tab for all services account-wide.
Tap a service to view its details:
- **Incidents**: Open incidents occurring on the service.
- **On Call Now**: Responders who are currently on call on the service’s escalation policy.
- **Team**: The team associated with the service.
- **Description**: The description for the service.
- **Escalation Policy**: The escalation policy associated with the service.
- **Dependencies**: Services that have [dependencies](/incident-management/services/service-profile#service-dependencies-tab) on the current service in the **Uses** and **Used By** directions.
- **Change Events**: Recent [change events](/ai-automation/aiops/recent-changes) related to the service.
### Users Screen
Navigate to **More** → **Users** to view a list of users and their login email addresses. Select a user to show their contact methods and escalation policies where they are on call.
To search for a user, tap **Search Icon ()** in the top right and search for their name or email address. You can email, call, or SMS a user from your device by tapping a user's email address or phone number.
On Android, tap **Vertical Ellipsis Icon ()** to **Add to Contacts** or **Edit Schedule Color**.

*Contact screen*
### Schedules Screen
Navigate to **More** → **Schedules** to view a list of schedules in your account. Tap a schedule to view its details. On the details screen, you see a calendar and a list of upcoming on-call shifts. Move forward and backward in the schedule using **Right Chevron Icon ()** and **Left Chevron Icon ()**, and tap a date to view who is on call for that day. Tap **Calendar Icon ()** in the top-right to return to the current date.
To search schedules, tap **Search Icon ()** in the upper-right and search by schedule name.
To filter schedules, you can select the **My Teams** tab for schedules related to your teams, or the **All** tab for all schedules account-wide.
#### Schedule Overrides
##### Schedule Overrides (iOS)
1. To schedule an override, navigate to **More** → **Schedules** and select your desired schedule.
2. In the list of shifts, tap the **shift** you want to override.
3. By default, the app sets you as the user overriding the shift. If you want another user to override the shift, tap your **name** and select another user from the list.
- **Note**: You can enter a search term on the user list screen to limit results.
4. _Optional_: If needed, tap **Starts** or **Ends** to adjust the duration of the override. You can also tap **Duration** to select a predetermined override length:
- **one hour**
- **six hours**
- **12 hours**
- **24 hours**
- **Until the rotation ends**
5. Tap **Override** in the top-right. Tap **Override** again in the confirmation modal.
##### Schedule Overrides (Android)
1. To schedule an override, navigate to **More** → **Schedules** and select your desired schedule.
2. In the list of shifts, tap the **shift** you want to override.
3. By default, the app sets you as the user overriding the shift. If you want another user to override the shift, tap your **name**, select another user from the list, and tap **Done** in the top-right.
- **Note**: You can tap **Search Icon ()** and enter a search term on the **Select User** screen to limit results.
4. _Optional_: If needed, tap the start date, end date, start time, or end time to adjust the duration of the override. You can also tap the **Override Length** to select a predetermined override duration:
- **one hour**
- **six hours**
- **12 hours**
- **24 hours**
- **Until the rotation ends**
5. Tap **Override** in the top-right. Tap **Override** again in the confirmation modal.
### Escalation Policies Screen
Navigate to **More** → **Escalation Policies** to view the escalation policies for your account. Selecting an escalation policy shows who is on call at each level. Select a user to see their contact info and schedule details.
### My On-Call Shifts Screen
Tap **My Shifts** in the bottom navigation to view My On-Call Shifts. My On-Call Shifts displays escalation policies that you are on call for and your upcoming shifts for the next month.
To view more details about the escalation policy, tap your shift and tap **Go to Escalation Policy**.
### Status Dashboard Screen
Navigate to **More** → **Status Dashboard** to view the incident status of all business services in your account. If your account has custom dashboards configured, you can switch dashboard views by tapping **Chevron Circle Down Icon ()** in the top-right and selecting your preferred dashboard.
To view more details about a business service, tap its **name**. On the details screen, you can view supporting services. To view more details about a supporting service, tap its **name**.
To subscribe to a business service, tap the name of the business service and tap **RSS Icon ()** in the top right.
### Settings Screen
Navigate to **More** → **Settings Icon ()** in the top right to view the Settings screen. Here you can select a custom push notification sound and sounds for high- and low-urgency notifications.
For more information on notification configuration options, see [Mobile App Settings](/get-started/mobile-app-settings).

*Settings*
## Mobile App Permissions
New downloads of the mobile app ask for permission to access your contacts the first time you log in. Existing app users can access this on the mobile app's **Settings** screen under **Automatic Contact Card Management**.
We request access to your contacts so that the app can import the [PagerDuty vCard](/incident-management/notifications/notification-phone-numbers#pagerduty-vcard), which lets you know that a phone or SMS notification is from PagerDuty. The vCard is automatically kept up to date whenever a number is added to or removed from the vCard.
- We do not send messages, calls, or notifications to any contact within your contacts list.
- We do not use this permission for marketing, data gathering, or research purposes.
If you deny this permission, the app still functions as intended. However, you can miss calls if a PagerDuty phone number is blocked or marked as spam by your provider. For iOS users, installing the vCard allows you to enable an override for Do Not Disturb and ensures silencing unknown numbers does not affect calls from PagerDuty. You can also manually download the vCard from our Knowledge Base; however, you must periodically check to see if it has been updated, and if so, you must download it again.

*Access contacts screen*
## Advanced Mobile Security
Add an additional layer of mobile app security by setting up Advanced Mobile Security on your PagerDuty account.
Enabling this feature requires you to set a passcode (such as a PIN) after logging in to the mobile app. This passcode is stored locally on the device and you must enter it to access the app every time you close it or leave it in the background. On iOS, you can choose to use phone biometric features like Face ID. Administrators can also set a timeout which additionally requires the passcode when the timeout has elapsed, even if you have not minimized or closed the app.
> **Requirements:** The App Lock feature is available to customers on the following pricing plans: Business, Digital Operations (legacy), and Enterprise for Incident Management.
>
> **Note**: You configure Advanced Mobile Security in the web app as opposed to the mobile app.
To set up App Lock:
1. In the PagerDuty web app, navigate to **User Icon** → **Account Settings** → **Mobile Security Settings**.
2. Complete the fields on the screen:
| Field | Value |
| :-------------------------- | :--------------------------------------------------------------------------------------------------------------------------- |
| **Mobile App Lock Setting** | Select **On** from the dropdown menu. |
| **App Lock Timeout** | Enter a value in minutes to determine how long it takes before the app locks itself and requires you to enter your passcode. |
3. Click **Save**.

*Mobile app session locking screen*
After the setting is enabled, the app prompts you to enter a new passcode when you log into your PagerDuty mobile app.

*Mobile app lock screen*
> **Reset Passcode:** If you forget your passcode or want to change it, you can click **Forgot passcode?**, which logs you out of the entire app to set up a new one.
## FAQ
**When logging in, do I need to select my service region?**
You do not need to specify your [Service Region](/get-started/service-regions) (such as US or EU) when logging in. The login system works globally and logs you in to the appropriate account depending on the credentials you enter. If you use the same email and password combination for accounts in both the EU and US regions, you see a list of accounts, which indicates each account's service region.
**I use Single Sign-On to log in. Why do I not see the option to enter my email and password, too?**
Your PagerDuty administrator has configured the account to only allow login via single sign-on. Contact your PagerDuty administration to use an email and password to sign in to PagerDuty.
**I have multiple accounts with the same email. Why do I not see a list of accounts to log in to?**
You see a list of accounts that use the exact same email and password combination. If you use different passwords but the same email address for different accounts, the app does not present a list of accounts.
**Can I use a password manager to log in?**
Yes, the PagerDuty mobile app is compatible with industry-standard password managers, even if you have multiple PagerDuty accounts. If you use a unique password for each PagerDuty account, the app logs you in to the appropriate account.
**If I have multiple PagerDuty accounts, should I use the same password for each?**
No, using the same password across multiple accounts reduces security.
---
URL: https://docs.pagerduty.com/get-started/mobile-app-settings
# Mobile App Settings
Configure notifications and other mobile app options.
Within the mobile app, you can configure how notifications alert you as well as other app behavior settings.
Notification settings and certain features will depend on your device's operating system. Please refer to the section for your device's operating system for more information.
- [Configure Android Devices](#configure-android-devices)
- [Configure iOS Devices](#configure-ios-devices)
> **Beta Versions Not Supported:** PagerDuty mobile apps do not support beta versions of iOS or Android. Wait until the official OS release before updating, as beta builds can impact core functionality such as authentication and notifications.
## Configure Android Devices
### Notification Settings (Android)
The PagerDuty app must have app notifications enabled in order to access the notification settings. You can enable these in the app via the following steps:
1. Navigate to **More** → .
2. Tap **System Notification Settings** and ensure **Allow notifications** is enabled.

#### High-Urgency Notifications
Tap **High-Urgency Notification Settings** and ensure **Allow notifications** is enabled. Ensure the sound within the High-Urgency Notification Settings is set to **None**. Setting a sound will play two notification sounds and a warning message will be displayed.

*Override system volume*
#### High-Urgency Override System Volume
> **Override System Volume Limitations:** PagerDuty cannot override the volume for phone call and SMS notifications.
>
> OnePlus devices running on OS 10 and higher do not fully support Override System Volume. These devices may not always override the system volume when the phone is on silent or vibrate mode.
If your phone _does not_ have Do Not Disturb enabled, and your volume slider is set to 0, PagerDuty push notifications will be silent. To change this, tap the **High-Urgency Override System Volume** checkbox to enable and set your desired volume level.
#### High-Urgency Override Do Not Disturb
> **Android Modes:** If you are using Android's Modes feature to enable Do Not Disturb, you must edit the Mode's settings to allow notifications from PagerDuty. Each Mode has its own **Allowed during Do not disturb** list.
Android's Do Not Disturb mode mutes all calls, notifications and other alerts. In order to receive high-urgency push notifications when Do Not Disturb is enabled, you can follow the steps below:
1. Navigate to your device's **Settings** → **Notifications** → **Do not disturb**.
2. Under **Allowed during Do not disturb** select **App notifications**.
3. Tap **Add apps** and then select the PagerDuty app.
4. Tap **Done** to confirm your selection.

You can confirm this was successfully enabled in the PagerDuty app by navigating to **More** → . If the steps above were completed, **High-Urgency Override Do Not Disturb** will show as **Enabled**.
To have phone call and SMS notifications override Do Not Disturb, open the PagerDuty app and navigate to **More** → . Tap the **Override DND for Starred Contacts** checkbox to enable it. This will automatically add the **PagerDuty Outgoing Numbers** contact to your **Favorites** list and update your device's Do Not Disturb settings to allow calls and messages from contacts on your Favorites list.
#### App Tip Notifications (Android)
App Tip Notifications are delivered locally through the mobile app, and will occasionally notify you about new features and PagerDuty tips. Disabling this feature will _not_ affect [incident-related notifications](/incident-management/notifications/notification-content-and-behavior) or other PagerDuty communications, (e.g., [status updates](/incident-management/communicate/communicate-with-stakeholders#status-updates), [on-call handoff notifications](/account-admin/user-profile/notification-rules#on-call-handoff-notifications), [responder requests](/incident-management/incidents/add-responders#responder-notifications), etc.). Since these are local notifications, the setting selection will not be preserved if you uninstall and re-install the PagerDuty mobile app.
Navigate to **More** → → **App Tip Notification Settings**. Slide the toggle **Show notifications** to the **on** or **off** position.

*App Tip Notifications toggle*
If you are using an Android device, you can configure the sound and alert settings for these notifications using the options below.
#### Low-Urgency Notifications
Low-urgency notifications are silent by default in order to distinguish them from high-urgency notifications. To enable sound for these notifications, tap **Low-Urgency Notification Settings** and ensure **Allow notifications** is enabled. Choose a **sound** and other alert settings.
> **MIUI and EMUI (Huawei and Xiaomi devices):** For these particular forks of Android, you may not be able to set sounds from the respective High and Low Urgency Notification Settings. Instead, you may need to perform the following:
>
> 1. Navigate to **System Notification Settings**.
> 2. Make sure High and Low Urgency Notifications are **enabled**.
> 3. From here, tap either **High or Low Urgency** to choose your sound.
#### On-Call Boosters (Android)
On-Call Boosters provide push notifications about changes to your on-call schedules. You will immediately receive a push notification when:
- You are added to a schedule
- You are removed from a schedule
- Changes are made to your on-call shifts within the next eight weeks (e.g., overrides, reordering)
> **Notification Exceptions:** Please note that notifications will not be sent if the change was made by the user themselves or if the change was made through the REST API.
This feature is enabled by default for all mobile users. To disable On-Call Boosters, navigate to **More** → → **On-Call Boosters**. Slide the toggle **Show notifications** to the off position.
Android users can configure the sound and alert settings for these notifications.
#### All Other Notifications
If you have configured push notifications for [status updates](/incident-management/communicate/communicate-with-stakeholders#status-updates) and/or [on-call handoff notifications](/account-admin/user-profile/notification-rules#on-call-handoff-notifications), you can configure the sound and other alert settings for these notifications by tapping **All Other Notification Settings**.
#### Clear Notifications
If you would like to automatically clear your push notifications when the app is launched, tap the checkbox next to **Clear Notifications** to enable this option.
### App Behavior Settings
#### Swipe Actions
You may change the swipe actions for responding to PagerDuty incidents. By default, the **Right Swipe** will **Resolve** an incident, and the **Left Swipe** will **Acknowledge** an incident.
To change either swipe action:
1. Tap **Change** to the right.
2. Select from the available incident actions:
- **Resolve**
- **Acknowledge; Snooze**
- **Acknowledge; Resolve**
- **None**
### Other Settings
#### Back Button Never Exits App
To ensure the back button doesn’t exit the app (e.g., during a critical incident), tap the **Back Button Never Exits App** checkbox to enable.
#### App Screenshots
If you would like to be able to take screenshots within the app, tap the **App Screenshots** checkbox to enable. If you would like to ensure your incidents and other information have maximum security, you may want to leave this setting disabled.
## Configure iOS Devices
### Notification Settings (iOS)
#### High-Urgency and Low-Urgency Settings
To enable and adjust the sound options for push notifications:
1. Navigate to **More** → .
- If required, toggle **Push Notifications** on.
2. Tap **High-Urgency** and assign a **ringtone** (Recommended).
3. Tap **Low-Urgency** and assign a **ringtone** _(Optional)_.
> **Other Notifications:** If you have configured push notifications for [status updates](/incident-management/communicate/communicate-with-stakeholders#status-updates) and/or [on-call handoff notifications](/account-admin/user-profile/notification-rules#on-call-handoff-notifications), these notifications will use your device's **Default Alerts** (**Settings** → **Sounds & Haptics** → **Default Alerts**) configuration.
>
> When you are [added as a Responder](/incident-management/incidents/add-responders) to an incident, the iOS mobile app will always use the **PagerDuty Alert** ringtone for push notifications.
#### Critical Alerts for High-Urgency
Critical Alerts for iOS allow high-urgency push notifications to bypass an iPhone’s [Focus](#focus-mode) and silent mode settings. You can enable this setting in the mobile app by navigating to **More** → . Ensure that you have **Push Notifications** enabled, tap **Critical Alerts for High-Urgency** and then tap **Allow**.

Alternatively, you can enable Critical Alerts by navigating to your device's **Settings** → **PagerDuty** → **Notifications** and then toggle **Critical Alerts**.

*iOS: Notifications Settings*
> **Warning:** Due to iOS features beyond our control, Critical Alerts can cause some calls made through third-party communication apps to drop when they’re sent during an ongoing call.
#### On-Call Boosters (iOS)
On-Call Boosters provide push notifications about changes to your on-call schedules. You will immediately receive a push notification when:
- You are added to a schedule
- You are removed from a schedule
- Changes are made to your on-call shifts within the next eight weeks (e.g., overrides, reordering)
> **Notification Exceptions:** Please note that notifications will not be sent if the change was made by the user themselves or if the change was made through the REST API.
This feature is enabled by default for all mobile users. To disable On-Call Boosters, navigate to **More** → . Slide the toggle for **On-Call Boosters** off and tap **Done**.
For iOS devices, these notifications will use your device's **Default Alerts** (**Settings** → **Sounds & Haptics** → **Default Alerts**) configuration.
#### App Tip Notifications (iOS)
App Tip Notifications are delivered locally through the mobile app, and will occasionally notify you about new features and PagerDuty tips. Disabling this feature will _not_ affect [incident-related notifications](/incident-management/notifications/notification-content-and-behavior) or other PagerDuty communications, (e.g., [status updates](/incident-management/communicate/communicate-with-stakeholders#status-updates), [on-call handoff notifications](/account-admin/user-profile/notification-rules#on-call-handoff-notifications), [responder requests](/incident-management/incidents/add-responders#responder-notifications), etc.). Since these are local notifications, the setting selection will not be preserved if you uninstall and re-install the PagerDuty mobile app.
Navigate to **More** → . Slide the toggle for **App Tip Notification Settings** on or off and tap **Done**.

*App Tip Notifications toggle*
For iOS devices, these notifications will use your device's **Default Alerts** (**Settings** → **Sounds & Haptics** → **Default Alerts**) configuration.
### Focus Mode
The **Focus Mode** feature allows users to have granular control over which apps and contacts get to notify them at the given Focus setting (including Do Not Disturb). You can learn more about the Focus feature [here](https://support.apple.com/en-us/HT212608).
In order to bypass all Focus modes, you can complete the following:
- Enable [Critical Alerts](#critical-alerts-for-high-urgency) for push notifications.
- Activate [Emergency Bypass](#override-silent-mode-and-focus-for-phone-notifications) for the **PagerDuty Outgoing Numbers** contact for phone notifications.
You can also override a [specific Focus](#override-a-specific-focus).
#### Override Silent Mode and Focus for Phone Notifications
When you receive a phone notification from PagerDuty, you may want your phone to audibly ring, even while it is on silent or when any Focus mode is enabled.
1. If you haven't done so already, download PagerDuty's [vCard](/incident-management/notifications/notification-phone-numbers#pagerduty-vcard) to add **PagerDuty Outgoing Numbers** to your contacts.
2. Navigate to your phone's Contacts app and select **PagerDuty Outgoing Numbers**.
3. Tap **Edit**, scroll down and select the row **Ringtone**.
4. Activate **Emergency Bypass** and tap **Done**.
5. Tap **Done** again.
#### Override a Specific Focus
You can allow PagerDuty notifications to override a specific Focus (e.g., Do Not Disturb) via the steps below.
To allow push notifications:
1. Navigate to your device's **Settings** → **Focus** and select the desired Focus.
2. Tap **Apps** → **Allow Notifications From**.
3. Tap and select PagerDuty.
4. Tap **Done** to save your selection.
To allow phone notifications:
1. Within the PagerDuty Mobile App, navigate to **More** → .
2. If you already had the app installed, select **Update PagerDuty Contact Card**.
- If this is your first time logging into the app, you'll be prompted to grant PagerDuty the **Manage Contacts** permission. You can read about how we use this permission [here](/get-started/mobile-app#mobile-app-permissions).
3. Navigate to your device's **Settings** → **Focus** and select the desired Focus.
4. Tap **People** → **Allow Notifications From**.
5. Tap and select the PagerDuty contact, **PagerDuty Outgoing Numbers**.
6. Tap **Done** to save your selection.

### Notification Summary
The Notification Summary feature allows non-critical notifications to be received at a specific time of the day to avoid taking away users’ attention during focus time. A few points to take note of with this feature:
- Notification Summary is optional and disabled by default.
- If desired, the PagerDuty app will need to be part of the list of chosen apps for the Summary located in **Settings** → **Notifications** → **Scheduled Summary**.
- Critical Alerts can still be received instantly.
New PagerDuty app users will receive a prompt upon installing to either allow notifications or include them in a scheduled summary.

*Allow notifications prompt*
### Notification Preferences
You can quickly update your [notification rules](/account-admin/user-profile/notification-rules) for high urgency incidents. We offer three pre-configured options to choose from:
- **Never Miss a Page**: Immediately sends a Push notification, followed by an email after one minute, SMS after two minutes, and a call after three minutes.
- **Always Text First**: Immediately sends a SMS, followed by an email after one minute and a call and push notification after two minutes.
- **Always Call First**: Immediately calls, followed by a SMS after one minute and an email and push notification after two minutes.
You can also click **Advanced Notification Rules** to set your own preferences.
### Appearance
You can adjust various aspects of how the mobile app appears. Navigate to **More** → and tap **App Appearance**.
To change the in-app color scheme, tap **Theme** and select from the following options:
- **System**
- **Light**
- **Dark**
To change the app icon, tap **Icon** and make a selection:
- **Green (default)**
- **Blue**
- **Cream**
- **Pink**
- **Sky**
- **Yellow**
## Shared Settings
### Troubleshoot Notifications
To receive a test push notification, navigate to **More** → and tap **Troubleshooting** (Android) or **Troubleshoot Notifications** (iOS). If the notification is successful, you will receive a push notification based on your settings. If an issue occurs, a prompt will advise you on what settings may need to be adjusted to ensure you receive notifications.
_Optionally_, tap **Run Tests** to run troubleshooting tests again.
### Support Resources
If you need further assistance, we provide easy access to additional resources in the app's Settings:
- **Community Support**: Visit [PagerDuty Commons](https://community.pagerduty.com/), our community site.
- **Email Support**: Tap **Email Support** to email our Support Team directly.
- **PagerDuty System Status**: Check PagerDuty's [PagerDuty Status Page](https://status.pagerduty.com/) and sign up for notifications.
### Contact Card Settings
The [PagerDuty vCard](/incident-management/notifications/notification-phone-numbers#pagerduty-vcard) is a file containing the numbers that PagerDuty notifications can come from. These numbers are saved to the **PagerDuty Outgoing Numbers** contact. The vCard updates automatically by default in the mobile app, and there is nothing that needs to be configured. Tap **Automatic Contact Card Management** to manually update the vCard; if prompted, tap **Continue** to give the PagerDuty app permission to access your contacts.
### Live Updating
Live Updating automatically updates the incidents list and incident details screen on your mobile app with the latest information. Tap the **Live Updating** checkbox (Android) or toggle (iOS) to enable or disable this option. We recommend disabling this option if you are experiencing connectivity issues.
---
URL: https://docs.pagerduty.com/get-started/mobile-app/mobile-home-screen
# Mobile Home Screen
An overview of the mobile app's Home screen sections, including open incidents, on-call shifts, and the status dashboard widget.
The mobile Home screen highlights top open incidents, and displays on-call shift and service information, which broadens awareness and streamlines navigation to other important, non-incident information.
You can navigate to the Home screen in the mobile app by tapping **Home** in the app's navigation bar:
- [Status Dashboard Widget](#status-dashboard-widget)
- [My Open Incidents](#my-open-incidents)
- [On-Call Shifts](#on-call-shifts)
- [Analytics on Mobile](#analytics-on-mobile)
- [Recently Impacted Technical Service](#recently-impacted-technical-service)
## Status Dashboard Widget
The Home screen displays a condensed view of the [Mobile Status Dashboard](/get-started/mobile-status-dashboard), and gives you an overview of your account's incident-impacted business services. Please read [Home Screen Status Dashboard](/get-started/mobile-status-dashboard/home-screen-status-dashboard) for more information.
## My Open Incidents
The **My Open Incidents** section displays incidents that are assigned to you, indicates the total number in the top-left, and provides an overview of your three most-recent, open incidents. Tap an incident’s row to navigate to its [details page](/get-started/mobile-app#incident-details-and-other-actions), where you can find more information about the incident, and acknowledge or resolve it.
Tap **New Incident** to [trigger an incident](/get-started/mobile-app#trigger-or-declare-an-incident).
If you have more than three incidents, tap **Show More** to expand the list. The expanded list will display up to 10 incidents, and you can tap **View All Open Incidents** to view all open incidents on the [Open Incidents](/get-started/mobile-app#open-incidents-screen) screen.
**Note**: The [Open Incidents](/get-started/mobile-app#open-incidents-screen) screen will remember which tab filter you most recently selected (**Mine**, **My Teams** or **All**), which reduces the number of taps needed to display relevant incidents.

## On-Call Shifts
This section details up to three of your current on-call shifts. Tap to the right of a shift to view more options, for example: **Go To Schedule**, **Go To Escalation Policy**, **Create an Override…**, **Go To My On-Call Shifts**.

*On-call shifts*
Tap **View All Shifts** to go to the [My On-Call Shifts](/get-started/mobile-app#my-on-call-shifts-screen) screen for a detailed overview of all your on-call responsibilities.
## Analytics On Mobile
> **Availability:** Analytics on Mobile is available on PD Reliability Platform plans. It's also available on the following pricing plans: Professional, Business, Digital Operations (legacy) and Enterprise for Incident Management.
> Please contact our [Sales team](https://www.pagerduty.com/contact-us/#contact-sales) to upgrade to a plan with this feature.
You can see an analytics overview on the Home Screen for the [Teams](/account-admin/teams) you are a part of. If your account does not have Teams, you'll see analytics for your entire organization.
The Analytics section displays information from the previous month for the following metrics:
- **High Urgency Incidents**
- **MTTA** (Mean time to acknowledge)
- **MTTR** (Mean time to resolve)
Change trends are compared to metrics from the 30 days prior to the displayed date range.

*Analytics on the Mobile Home Screen*
## Recently Impacted Technical Service
This section displays the most recently impacted technical service associated with your [Teams](/account-admin/teams). If your account does not have the Teams feature, it will display the most recently impacted technical service in your PagerDuty account.
For an overview of all services in your PagerDuty account, tap **View Services** to go to the [Service Directory](/incident-management/services/service-directory).
## Customize Your Home Screen
> **Multiple Accounts:** If you have more than one PagerDuty account, you can save different customizations for each account.
> **Device Information:** Instructions and screenshots below are for the following devices. Depending on your device and operating system, information may vary slightly:
>
> - **iOS**: iPhone 16 Pro, iOS 18.1
> - **Android**: Pixel 9 Pro, Android 15.0
**iOS**
1. Tap **Home** → **Edit**.
2. Tap next to a card to add it to your Home Screen. Tap to remove a card from your Home Screen.
1. **Note**: You must have at least one card on your Home Screen.
3. _Optional_: Tap and drag to reorder the cards.
4. Tap **Save**.

**Android**
1. Tap **Home** → .
2. Tap next to a card to add it to your Home Screen. Tap to remove a card from your Home Screen.
1. **Note**: You must have at least one card on your Home Screen.
3. _Optional_: Tap and drag to reorder the cards.
4. Tap **Save**.

---
URL: https://docs.pagerduty.com/get-started/mobile-app/mobile-widgets
# Mobile Widgets
Add an on-call status widget to your device's home screen or lock screen to view upcoming on-call shifts without opening the app.
The PagerDuty on-call widget allows [PagerDuty Mobile App](/get-started/mobile-app) users to quickly view their on-call status and any upcoming shifts from their device's home screen without needing to open the app.
> **Availability:** Mobile widgets are available to users on all pricing plans.
## Add the On-Call Widget
The on-call widget will prioritize **Always On-Call** shifts. Larger widgets will show on-call shifts with a defined end time lower in the list of shifts.
> **Device Information:** Instructions and screenshots below are for the following devices. Depending on your device and operating system, information may vary slightly:
>
> - **iOS**: iPhone 16 Pro, iOS 18.1
> - **Android**: Pixel 9 Pro, Android 15.0
### iOS Home Screen
1. Long-press your device's home screen, tap **Edit** in the top left, and select **Add Widget**.
2. Search and select **PagerDuty** from the list of widgets.
3. Tap **Add Widget**.
4. _Optionally_ resize and/or drag the widget to a new location. For users with multiple escalation policies, we recommend using the larger widget, since it offers more display space.
5. Tap **Done**.

*Add the iOS on-call widget*
### iOS Lock Screen
An on-call widget is also available for your lock screen.
1. Touch and hold the Lock Screen until the Customize button appears.
2. Tap **Customize**.
3. Tap **Lock Screen**, then tap ** Add Widgets**.
4. Tap **PagerDuty** from the list of widgets, and tap or drag the **PagerDuty** widget onto your Lock Screen.
5. Tap **Done**.

*On-call widget on the iOS lock screen*
### Android Home Screen
1. Long-press your device's home screen and select **Widgets**.
2. Search and select **PagerDuty** from the list of widgets, and tap **Add**.
1. **Note**: If you do not see **PagerDuty** in the list of widgets, please make sure you are [logged in to the mobile app](/get-started/log-in-to-pagerduty#log-in-via-the-web-or-mobile-app).
3. _Optionally_ resize the widget vertically and horizontally to view more or fewer escalation policies.

*Add the Android on-call widget to the home screen*
## Interact with the On-Call Widget
Tap the widget to navigate to the mobile app's [My On-Call Shifts](/get-started/mobile-app#my-on-call-shifts-screen) screen.
> **Switch Subdomains:** To see on-call shifts from a different subdomain, you will need to switch accounts in your PagerDuty Mobile App. Please read [Switch PagerDuty Accounts in the Mobile App](/get-started/mobile-app#switch-pagerduty-accounts-in-the-mobile-app) for more information.
## Reposition the On-Call Widget
To reposition the widget, long-press it and drag-and-drop it to a new location on your device's home screen. You may also see an option to resize the widget.
## Delete the On-Call Widget
To remove the widget, long-press the widget and select the option to remove it.
---
URL: https://docs.pagerduty.com/get-started/mobile-release-notes
# Mobile Release Notes
Recent PagerDuty mobile app release notes for iOS and Android, listed by version number, release date, and platform-specific changes.
## 8.10 — 14 Apr 2025
**Android**
- We've introduced a new search filter to quickly find and run incident workflows.
- We are introducing the new minimum OS requirements to ensure the app continues to be innovative and secure. Starting April 14, 2025, the future versions of the app will require Android 12 or higher. Please ensure your device is upgraded to continue receiving mobile app updates.
**iOS**
- We've introduced a new search filter to quickly find and run incident workflows.
- We have deprecated support for iOS 16.0. Please ensure your device is upgraded to continue receiving mobile app updates.
## 8.02 — 24 Feb 2025
**Android**
- You can now view and edit Incident Types from the Incident Details Screen. Incident types allows organizations to define how specific incidents behave in order to align them with their bespoke operational processes—whether it’s a Major Incident or a Security Incident, or a custom type.
**iOS**
- You can now view and edit Incident Types from the Incident Details Screen. Incident types allows organizations to define how specific incidents behave in order to align them with their bespoke operational processes—whether it’s a Major Incident or a Security Incident, or a custom type.
### Intune (8.02)
**Android**
Introducing PagerDuty for Intune, a secure version of the PagerDuty mobile app designed for organizations using Microsoft Intune for mobile application management.
Key Features:
- Intune App Protection – Enforce security policies without requiring full device management.
- Incident Management on the go – Manage alerts, acknowledge incidents, and collaborate in real time.
- Automation: Take action faster with Automation Actions and Incident workflow
**iOS**
Introducing PagerDuty for Intune, a secure version of the PagerDuty mobile app designed for organizations using Microsoft Intune for mobile application management.
Key Features:
- Intune App Protection – Enforce security policies without requiring full device management.
- Incident Management on the go – Manage alerts, acknowledge incidents, and collaborate in real time.
- Automation: Take action faster with Automation Actions and Incident workflow
## 8.01 — 17 Feb 2025
**Android**
- You can now view and edit Incident Types from the Incident Details Screen. Incident types allows organizations to define how specific incidents behave in order to align them with their bespoke operational processes—whether it’s a Major Incident or a Security Incident, or a custom type.
**iOS**
- You can now view and edit Incident Types from the Incident Details Screen. Incident types allows organizations to define how specific incidents behave in order to align them with their bespoke operational processes—whether it’s a Major Incident or a Security Incident, or a custom type.
### Intune (8.01)
**Android**
Introducing PagerDuty for Intune, a secure version of the PagerDuty mobile app designed for organizations using Microsoft Intune for mobile application management.
Key Features:
- Intune App Protection – Enforce security policies without requiring full device management.
- Incident Management on the go – Manage alerts, acknowledge incidents, and collaborate in real time.
- Automation: Take action faster with Automation Actions and Incident workflow
**iOS**
Introducing PagerDuty for Intune, a secure version of the PagerDuty mobile app designed for organizations using Microsoft Intune for mobile application management.
Key Features:
- Intune App Protection – Enforce security policies without requiring full device management.
- Incident Management on the go – Manage alerts, acknowledge incidents, and collaborate in real time.
- Automation: Take action faster with Automation Actions and Incident workflow
## 8.00 — 6 Feb 2025
**Android**
- You can now view and edit Incident Types from the Incident Details Screen. Incident types allows organizations to define how specific incidents behave in order to align them with their bespoke operational processes—whether it’s a Major Incident or a Security Incident, or a custom type.
**iOS**
- You can now view and edit Incident Types from the Incident Details Screen. Incident types allows organizations to define how specific incidents behave in order to align them with their bespoke operational processes—whether it’s a Major Incident or a Security Incident, or a custom type.
### Intune (8.00)
**Android**
Introducing PagerDuty for Intune, a secure version of the PagerDuty mobile app designed for organizations using Microsoft Intune for mobile application management.
Key Features:
- Intune App Protection – Enforce security policies without requiring full device management.
- Incident Management on the go – Manage alerts, acknowledge incidents, and collaborate in real time.
- Automation: Take action faster with Automation Actions and Incident workflow
**iOS**
Introducing PagerDuty for Intune, a secure version of the PagerDuty mobile app designed for organizations using Microsoft Intune for mobile application management.
Key Features:
- Intune App Protection – Enforce security policies without requiring full device management.
- Incident Management on the go – Manage alerts, acknowledge incidents, and collaborate in real time.
- Automation: Take action faster with Automation Actions and Incident workflow
## 7.99 — 22 Jan 2025
**Android**
- We've got some really cool things going on behind the scenes. Stay tuned!
**iOS**
- We've got some really cool things going on behind the scenes. Stay tuned!
## 7.98 — 16 Dec 2024
**Android**
- We've got some really cool things going on behind the scenes. Stay tuned!
**iOS**
- We've got some really cool things going on behind the scenes. Stay tuned!
## 7.97 — 09 Dec 2024
**Android**
- We've got some really cool things going on behind the scenes. Stay tuned!
**iOS**
- Bug Fix: Resolved an issue on the timeline screen where information would occasionally overlap
## 7.96 — 27 Nov 2024
**Android**
- Bug Fix: Addressed an issue where in some cases the home tab in the nav bar was missing after a fresh install
- Update: The PagerDuty Community link under Settings → Community Support now directs to our new website ([https://community.pagerduty.com/](https://community.pagerduty.com/))
**iOS**
- Bug Fix: Resolved an issue where the stakeholder update push notification failed to redirect to the correct screen for users logged into multiple accounts
- Update: The PagerDuty Community link under Settings → Community Support now directs to our new website ([https://community.pagerduty.com/](https://community.pagerduty.com/))
## 7.95 — 20 Nov 2024
**Android**
- Bug Fix: Addressed an issue where in some cases the home tab in the nav bar was missing after a fresh install
- Update: The PagerDuty Community link under Settings → Community Support now directs to our new website ([https://community.pagerduty.com/](https://community.pagerduty.com/))
**iOS**
- Bug Fix: Resolved an issue where the stakeholder update push notification failed to redirect to the correct screen for users logged into multiple accounts
- Update: The PagerDuty Community link under Settings → Community Support now directs to our new website ([https://community.pagerduty.com/](https://community.pagerduty.com/))
## 7.94 — 5 Nov 2024
**Android**
- Bug Fix: Addressed an issue where in some cases the home tab in the nav bar was missing after a fresh install
Update: The PagerDuty Community link under Settings → Community Support now directs to our new website ([https://community.pagerduty.com/](https://community.pagerduty.com/))
**iOS**
- Update: The PagerDuty Community link under Settings → Community Support now directs to our new website ([https://community.pagerduty.com/](https://community.pagerduty.com/))
## 7.93 — 29 Oct 2024
**Android**
- Bug Fix: Addressed an issue where in some cases the app consumed more battery than usual during background activities.
**iOS**
- Bug Fix: Addressed an issue where an unresponsive button would occasionally appear in incident actions.
## 7.92 — 22 Oct 2024
**Android**
- Bug Fix: Addressed an issue where in some cases the app consumed more battery than usual during background activities.
**iOS**
- Bug Fix: Addressed an issue where an unresponsive button would occasionally appear in incident actions.
## 7.91 — 15 Oct 2024
**Android**
- Bug Fix: Addressed an issue where in some cases the app consumed more battery than usual during background activities.
**iOS**
- We've got some really cool things going on behind the scenes. Stay tuned!
## 7.90 — 08 Oct 2024
**Android**
- We've got some really cool things going on behind the scenes. Stay tuned!
**iOS**
- We've got some really cool things going on behind the scenes. Stay tuned!
## 7.89 — 01 Oct 2024
**Android**
- Critical Bug Fix: Fixed an issue with Live Call Routing (LCR) where users couldn't listen to recordings from Incident details
**iOS**
- We've got some really cool things going on behind the scenes. Stay tuned!
## 7.88 — 24 Sep 2024
**Android**
- Critical Bug Fix: Fixed an issue with Live Call Routing (LCR) where users couldn't listen to recordings from Incident details
**iOS**
- We've got some really cool things going on behind the scenes. Stay tuned!
## 7.87 — 17 Sep 2024
**Android**
- Critical Bug Fix: Fixed an issue with Live Call Routing (LCR) where users couldn't listen to recordings from Incident details
**iOS**
- We've got some really cool things going on behind the scenes. Stay tuned!
## 7.86 — 10 Sep 2024
**Android**
- Critical Bug Fix: Fixed an issue with Live Call Routing (LCR) where users couldn't listen to recordings from Incident details
**iOS**
- We've got some really cool things going on behind the scenes. Stay tuned!
## 7.85 — 3 Sep 2024
**Android**
- We've got some really cool things going on behind the scenes. Stay tuned!
**iOS**
- We've got some really cool things going on behind the scenes. Stay tuned!
## 7.84 — 27 Aug 2024
**Android**
- You can now view the Slack channel linked to the incident. Just tap the Slack icon on the incident details carousel or overview tab
- Check out our new "Feature Spotlight" screen to stay updated with all the exciting new and existing updates. Simply go to the Home Screen and tap the gift box icon at the top
- You can now set your notification volume directly from the Mobile App. Go to Settings → Enable High-Urgency Override System Volume and adjust the volume.
**iOS**
- You can now view the Slack channel linked to the incident. Just tap the Slack icon on the incident details carousel or overview tab
- Check out our new "Feature Spotlight" screen to stay updated with all the exciting new and existing updates. Simply go to the Home Screen and tap the gift box icon at the top
- We are introducing the new minimum OS requirements to ensure the app continues to be innovative and secure. Our app now requires iOS 16.0 or higher. Please ensure your device is upgraded to continue receiving mobile app updates.
## 7.83 — 20 Aug 2024
**Android**
- You can now view the Slack channel linked to the incident. Just tap the Slack icon on the incident details carousel or overview tab
- Check out our new "Feature Spotlight" screen to stay updated with all the exciting new and existing updates. Simply go to the Home Screen and tap the gift box icon at the top
- You can now set your notification volume directly from the Mobile App. Go to Settings → Enable High-Urgency Override System Volume and adjust the volume.
**iOS**
- You can now view the Slack channel linked to the incident. Just tap the Slack icon on the incident details carousel or overview tab
- Check out our new "Feature Spotlight" screen to stay updated with all the exciting new and existing updates. Simply go to the Home Screen and tap the gift box icon at the top
- We are introducing the new minimum OS requirements to ensure the app continues to be innovative and secure. Our app now requires iOS 16.0 or higher. Please ensure your device is upgraded to continue receiving mobile app updates.
## 7.82 — 13 Aug 2024
**Android**
- You can now view the Slack channel linked to the incident. Just tap the Slack icon on the incident details carousel or overview tab
- Check out our new "Feature Spotlight" screen to stay updated with all the exciting new and existing updates. Simply go to the Home Screen and tap the gift box icon at the top
- You can now set your notification volume directly from the Mobile App. Go to Settings → Enable High-Urgency Override System Volume and adjust the volume.
**iOS**
- You can now view the Slack channel linked to the incident. Just tap the Slack icon on the incident details carousel or overview tab
- Check out our new "Feature Spotlight" screen to stay updated with all the exciting new and existing updates. Simply go to the Home Screen and tap the gift box icon at the top
- We are introducing the new minimum OS requirements to ensure the app continues to be innovative and secure. Our app now requires iOS 16.0 or higher. Please ensure your device is upgraded to continue receiving mobile app updates.
- To improve security, Mobile app login from rooted or jailbroken devices is now blocked
## 7.81 — 6 Aug 2024
**Android**
- You can now view the Slack channel linked to the incident. Just tap the Slack icon on the incident details carousel or overview tab
- Check out our new "Feature Spotlight" screen to stay updated with all the exciting new and existing updates. Simply go to the Home Screen and tap the gift box icon at the top
- You can now set your notification volume directly from the Mobile App. Go to Settings → Enable High-Urgency Override System Volume and adjust the volume.
**iOS**
- You can now view the Slack channel linked to the incident. Just tap the Slack icon on the incident details carousel or overview tab
- Check out our new "Feature Spotlight" screen to stay updated with all the exciting new and existing updates. Simply go to the Home Screen and tap the gift box icon at the top
- We are introducing the new minimum OS requirements to ensure the app continues to be innovative and secure. Our app now requires iOS 16.0 or higher. Please ensure your device is upgraded to continue receiving mobile app updates.
- To improve security, Mobile app login from rooted or jailbroken devices is now blocked
## 7.80 — 30 Jul 2024
**Android**
- Check out our new "Feature Spotlight" screen to stay updated with all the exciting new and existing updates. Simply go to the Home Screen and tap the gift box icon at the top
- You can now set your notification volume directly from the Mobile App. Go to Settings → Enable High-Urgency Override System Volume and adjust the volume.
- New minimum OS req: Our app now requires Android 11 or higher for future updates
**iOS**
- Check out our new "Feature Spotlight" screen to stay updated with all the exciting new and existing updates. Simply go to the Home Screen and tap the gift box icon at the top
- We are introducing the new minimum OS requirements to ensure the app continues to be innovative and secure. Our app now requires iOS 16.0 or higher. Please ensure your device is upgraded to continue receiving mobile app updates.
- To improve security, Mobile app login from rooted or jailbroken devices is now blocked
## 7.79 — 23 Jul 2024
**Android**
- Check out our new "Feature Spotlight" screen to stay updated with all the exciting new and existing updates. Simply go to the Home Screen and tap the gift box icon at the top
- You can now set your notification volume directly from the Mobile App. Go to Settings → Enable High-Urgency Override System Volume and adjust the volume.
- New minimum OS req: Our app now requires Android 11 or higher for future updates
**iOS**
- Check out our new "Feature Spotlight" screen to stay updated with all the exciting new and existing updates. Simply go to the Home Screen and tap the gift box icon at the top
- We are introducing the new minimum OS requirements to ensure the app continues to be innovative and secure. Our app now requires iOS 16.0 or higher. Please ensure your device is upgraded to continue receiving mobile app updates.
- To improve security, Mobile app login from rooted or jailbroken devices is now blocked
## 7.78 — 16 Jul 2024
**Android**
- Check out our new "Feature Spotlight" screen to stay updated with all the exciting new and existing updates. Simply go to the Home Screen and tap the gift box icon at the top
- You can now set your notification volume directly from the Mobile App. Go to Settings → Enable High-Urgency Override System Volume and adjust the volume.
- New minimum OS req: Our app now requires Android 11 or higher for future updates
**iOS**
- Check out our new "Feature Spotlight" screen to stay updated with all the exciting new and existing updates. Simply go to the Home Screen and tap the gift box icon at the top
- We are introducing the new minimum OS requirements to ensure the app continues to be innovative and secure. Our app now requires iOS 16.0 or higher. Please ensure your device is upgraded to continue receiving mobile app updates.
- To improve security, Mobile app login from rooted or jailbroken devices is now blocked
## 7.77 — 9 Jul 2024
**Android**
- You can now set your notification volume directly from the Mobile App. Go to Settings → Enable High-Urgency Override System Volume and adjust the volume.
- New minimum OS req: Our app now requires Android 11 or higher for future updates
- To improve security, Mobile app login from rooted or jailbroken devices is now blocked
**iOS**
- We are introducing the new minimum OS requirements to ensure the app continues to be innovative and secure. Our app now requires iOS 16.0 or higher. Please ensure your device is upgraded to continue receiving mobile app updates.
- To improve security, Mobile app login from rooted or jailbroken devices is now blocked
## 7.76 — 2 Jul 2024
**Android**
- You can now set your notification volume directly from the Mobile App. Go to Settings → Enable High-Urgency Override System Volume and adjust the volume.
- New minimum OS req: Starting June 18, 2024, our app will require Android 11 or higher for future updates
- To improve security, Mobile app login from rooted or jailbroken devices is now blocked
**iOS**
- We are introducing the new minimum OS requirements to ensure the app continues to be innovative and secure. Starting June 18, 2024, the future versions of the app will require iOS 16.0 or higher. Please ensure your device is upgraded to continue receiving mobile app updates.
- To improve security, Mobile app login from rooted or jailbroken devices is now blocked
## 7.75 — 27 Jun 2024
**Android**
- You can now set your notification volume directly from the Mobile App. Go to Settings → Enable High-Urgency Override System Volume and adjust the volume.
- New minimum OS req: Starting June 18, 2024, our app will require Android 11 or higher for future updates
- To improve security, Mobile app login from rooted or jailbroken devices is now blocked
**iOS**
- We are introducing the new minimum OS requirements to ensure the app continues to be innovative and secure. Starting June 18, 2024, the future versions of the app will require iOS 16.0 or higher. Please ensure your device is upgraded to continue receiving mobile app updates.
- To improve security, Mobile app login from rooted or jailbroken devices is now blocked
## 7.74 — 20 Jun 2024
**Android**
- Introducing Widgets! The On Call widget can be added to your phone’s Home screen for easy access to existing & upcoming On-Call shifts info, without even having to open the App
- Introducing Home screen Customization: Add, remove & rearrange cards on your App Home screen
- New minimum OS req: Starting June 18, 2024, our app will require Android 11 or higher for future updates
- To improve security, Mobile app login from rooted or jailbroken devices is now blocked
**iOS**
- Introducing Widgets! Our new On Call widget can be added to your phone’s Home or Lock screen for easy access to your existing and upcoming On-Call shifts information, without even having to open the App
- Introducing Home screen Customization: Add, remove & rearrange cards on your App Home screen
- We are introducing the new minimum OS requirements to ensure the app continues to be innovative and secure. Starting June 18, 2024, the future versions of the app will require iOS 16.0 or higher. Please ensure your device is upgraded to continue receiving mobile app updates.
- To improve security, Mobile app login from rooted or jailbroken devices is now blocked
## 7.73 — 13 Jun 2024
**Android**
- Introducing Widgets! The On Call widget can be added to your phone’s Home screen for easy access to existing & upcoming On-Call shifts info, without even having to open the App
- Introducing Home screen Customization: Add, remove & rearrange cards on your App Home screen
- New minimum OS req: Starting June 18, 2024, our app will require Android 11 or higher for future updates
- To improve security, Mobile app login from rooted or jailbroken devices is now blocked
**iOS**
- Introducing Widgets! Our new On Call widget can be added to your phone’s Home or Lock screen for easy access to your existing and upcoming On-Call shifts information, without even having to open the App
- Introducing Home screen Customization: Add, remove & rearrange cards on your App Home screen
- We are introducing the new minimum OS requirements to ensure the app continues to be innovative and secure. Starting June 18, 2024, the future versions of the app will require iOS 16.0 or higher. Please ensure your device is upgraded to continue receiving mobile app updates.
- To improve security, Mobile app login from rooted or jailbroken devices is now blocked
## 7.72 — 6 Jun 2024
**Android**
- Introducing Widgets! The On Call widget can be added to your phone’s Home screen for easy access to existing & upcoming On-Call shifts info, without even having to open the App
- Introducing Home screen Customization: Add, remove & rearrange cards on your App Home screen
- New minimum OS req: Starting June 18, 2024, our app will require Android 11 or higher for future updates
- To improve security, Mobile app login from rooted or jailbroken devices is now blocked
**iOS**
- Introducing Widgets! Our new On Call widget can be added to your phone’s Home or Lock screen for easy access to your existing and upcoming On-Call shifts information, without even having to open the App
- Introducing Home screen Customization: Add, remove & rearrange cards on your App Home screen
- We are introducing the new minimum OS requirements to ensure the app continues to be innovative and secure. Starting June 18, 2024, the future versions of the app will require iOS 16.0 or higher. Please ensure your device is upgraded to continue receiving mobile app updates.
- To improve security, Mobile app login from rooted or jailbroken devices is now blocked
## 7.71 — 26 May 2024
**Android**
- Introducing Widgets! The On Call widget can be added to your phone’s Home screen for easy access to existing & upcoming On-Call shifts info, without even having to open the App
- Introducing Home screen Customization: Add, remove & rearrange cards on your App Home screen
- New minimum OS req: Starting June 18, 2024, our app will require Android 11 or higher for future updates
- To improve security, Mobile app login from rooted or jailbroken devices is now blocked
**iOS**
- Introducing Widgets! Our new On Call widget can be added to your phone’s Home or Lock screen for easy access to your existing and upcoming On-Call shifts information, without even having to open the App
- Introducing Home screen Customization: Add, remove & rearrange cards on your App Home screen
- We are introducing the new minimum OS requirements to ensure the app continues to be innovative and secure. Starting June 18, 2024, the future versions of the app will require iOS 16.0 or higher. Please ensure your device is upgraded to continue receiving mobile app updates.
- To improve security, Mobile app login from rooted or jailbroken devices is now blocked
## 7.70 — 17 May 2024
**Android**
- Introducing Widgets! The On Call widget can be added to your phone’s Home screen for easy access to existing & upcoming On-Call shifts info, without even having to open the App
- Introducing Home screen Customization: Add, remove & rearrange cards on your App Home screen
- New minimum OS req: Starting June 18, 2024, our app will require Android 11 or higher for future updates
- To improve security, Mobile app login from rooted or jailbroken devices is now blocked
**iOS**
- Introducing Widgets! Our new On Call widget can be added to your phone’s Home or Lock screen for easy access to your existing and upcoming On-Call shifts information, without even having to open the App
- Introducing Home screen Customization: Add, remove & rearrange cards on your App Home screen
- We are introducing the new minimum OS requirements to ensure the app continues to be innovative and secure. Starting June 18, 2024, the future versions of the app will require iOS 16.0 or higher. Please ensure your device is upgraded to continue receiving mobile app updates.
- To improve security, Mobile app login from rooted or jailbroken devices is now blocked
## 7.69 — 09 May 2024
**Android**
- Introducing Widgets! The On Call widget can be added to your phone’s Home screen for easy access to existing & upcoming On-Call shifts info, without even having to open the App
- Introducing Home screen Customization: Add, remove & rearrange cards on your App Home screen
- New minimum OS req: Starting June 18, 2024, our app will require Android 11 or higher for future updates
- To improve security, Mobile app login from rooted or jailbroken devices is now blocked
**iOS**
- Introducing Widgets! Our new On Call widget can be added to your phone’s Home or Lock screen for easy access to your existing and upcoming On-Call shifts information, without even having to open the App
- Introducing Home screen Customization: Add, remove & rearrange cards on your App Home screen
- We are introducing the new minimum OS requirements to ensure the app continues to be innovative and secure. Starting June 18, 2024, the future versions of the app will require iOS 16.0 or higher. Please ensure your device is upgraded to continue receiving mobile app updates.
- To improve security, Mobile app login from rooted or jailbroken devices is now blocked
## 7.68 — 02 May 2024
**Android**
- Introducing Widgets! Our new On Call widget can be added to your phone’s Home screen for easy access to your existing and upcoming On-Call shifts information, without even having to open the App
- We are introducing the new minimum OS requirements. Starting June 18, 2024, our app will require Android 11 or higher for future updates. Upgrade your device to keep receiving app updates
- To improve security, Mobile app login from rooted or jailbroken devices is now blocked
**iOS**
- Introducing Widgets! Our new On Call widget can be added to your phone’s Home or Lock screen for easy access to your existing and upcoming On-Call shifts information, without even having to open the App
- We are introducing the new minimum OS requirements to ensure the app continues to be innovative and secure. Starting June 18, 2024, the future versions of the app will require iOS 16.0 or higher. Please ensure your device is upgraded to continue receiving mobile app updates.
- To improve security, Mobile app login from rooted or jailbroken devices is now blocked
## 7.66 — 18 Apr 2024
**Android**
- To improve security, Mobile app login from rooted or jailbroken devices is now blocked.
**iOS**
- To improve security, Mobile app login from rooted or jailbroken devices is now blocked.
## 7.64 — 4 Apr 2024
**Android**
- We've got some really cool things going on behind the scenes. Stay tuned!
**iOS**
- We've got some really cool things going on behind the scenes. Stay tuned!.
## 7.63 — 28 Mar 2024
**Android**
- We've got some really cool things going on behind the scenes. Stay tuned!
**iOS**
- We've got some really cool things going on behind the scenes. Stay tuned!.
## 7.62 — 21 Mar 2024
**Android**
- We've got some really cool things going on behind the scenes. Stay tuned!
**iOS**
- We've got some really cool things going on behind the scenes. Stay tuned!.
## 7.61 — 11 Mar 2024
**Android**
- We've got some really cool things going on behind the scenes. Stay tuned!
**iOS**
- We've got some really cool things going on behind the scenes. Stay tuned!.
## 7.60 — 7 Mar 2024
**Android**
- We've got some really cool things going on behind the scenes. Stay tuned!
**iOS**
- We've got some really cool things going on behind the scenes. Stay tuned!.
## 7.58 — 22 Feb 2024
**Android**
- Introducing the Analytics Card on App Home Screen! Monitor your team's MTTA and MTTR, plus the count and details of High Urgency Incidents from the previous month until yesterday. It highlights the specific date range covered and compares trends with data from 30 days before the selected period.
- App Tip Notifications will occasionally notify you about new features and PagerDuty tips. To disable them Navigate to More (Settings) and toggle App Tip Notifications.
**iOS**
- Introducing the Analytics Card on App Home Screen! Monitor your team's MTTA and MTTR, plus the count and details of High Urgency Incidents from the previous month until yesterday. It highlights the specific date range covered and compares trends with data from 30 days before the selected period.
- Bug fix for app crash when users access 'PagerDuty System Status' on the Settings screen
- Bug fix for an intermittent app crash when users are on the Landscape Mode
- App Tip Notifications will occasionally notify you about new features and PagerDuty tips. To disable them Navigate to More (Settings) and toggle App Tip Notifications.
## 7.57 — 16 Feb 2024
**Android**
- Introducing the Analytics Card on App Home Screen! Monitor your team's MTTA and MTTR, plus the count and details of High Urgency Incidents from the previous month until yesterday. It highlights the specific date range covered and compares trends with data from 30 days before the selected period.
- App Tip Notifications will occasionally notify you about new features and PagerDuty tips. To disable them Navigate to More (Settings) and toggle App Tip Notifications.
**iOS**
- Introducing the Analytics Card on App Home Screen! Monitor your team's MTTA and MTTR, plus the count and details of High Urgency Incidents from the previous month until yesterday. It highlights the specific date range covered and compares trends with data from 30 days before the selected period.
- Bug fix for app crash when users access 'PagerDuty System Status' on the Settings screen
- Bug fix for an intermittent app crash when users are on the Landscape Mode
- App Tip Notifications will occasionally notify you about new features and PagerDuty tips. To disable them Navigate to More (Settings) and toggle App Tip Notifications.
## 7.55.1 — 1 Feb 2024
**Android**
- Introducing the Analytics Card on App Home Screen! Monitor your team's MTTA and MTTR, plus the count and details of High Urgency Incidents from the previous month until yesterday. It highlights the specific date range covered and compares trends with data from 30 days before the selected period.
- Bug fix for app crash when users access 'PagerDuty System Status' on the Settings screen
- App Tip Notifications will occasionally notify you about new features and PagerDuty tips. To disable them Navigate to More (Settings) and toggle App Tip Notifications.
**iOS**
- Introducing the Analytics Card on App Home Screen! Monitor your team's MTTA and MTTR, plus the count and details of High Urgency Incidents from the previous month until yesterday. It highlights the specific date range covered and compares trends with data from 30 days before the selected period.
- Bug fix for app crash when users access 'PagerDuty System Status' on the Settings screen
- App Tip Notifications will occasionally notify you about new features and PagerDuty tips. To disable them Navigate to More (Settings) and toggle App Tip Notifications.
## 7.54.1 — 24 Jan 2024
**Android**
- Introducing the Analytics Card on App Home Screen! Monitor your team's MTTA and MTTR, plus the count and details of High Urgency Incidents from the previous month until yesterday. It highlights the specific date range covered and compares trends with data from 30 days before the selected period.
- App Tip Notifications will occasionally notify you about new features and PagerDuty tips. To disable them Navigate to More (Settings) and toggle App Tip Notifications.
**iOS**
- Introducing the Analytics Card on App Home Screen! Monitor your team's MTTA and MTTR, plus the count and details of High Urgency Incidents from the previous month until yesterday. It highlights the specific date range covered and compares trends with data from 30 days before the selected period.
- App Tip Notifications will occasionally notify you about new features and PagerDuty tips. To disable them Navigate to More (Settings) and toggle App Tip Notifications.
## 7.54 — 23 Jan 2024
**Android**
- Introducing the Analytics Card on App Home Screen! Monitor your team's MTTA and MTTR, plus the count and details of High Urgency Incidents from the previous month until yesterday. It highlights the specific date range covered and compares trends with data from 30 days before the selected period.
- App Tip Notifications will occasionally notify you about new features and PagerDuty tips. To disable them Navigate to More (Settings) and toggle App Tip Notifications.
**iOS**
- Introducing the Analytics Card on App Home Screen! Monitor your team's MTTA and MTTR, plus the count and details of High Urgency Incidents from the previous month until yesterday. It highlights the specific date range covered and compares trends with data from 30 days before the selected period.
- App Tip Notifications will occasionally notify you about new features and PagerDuty tips. To disable them Navigate to More (Settings) and toggle App Tip Notifications.
## 7.53.1 — 18 Jan 2024
**Android**
- Introducing the Analytics Card on App Home Screen! Monitor your team's MTTA and MTTR, plus the count and details of High Urgency Incidents from the previous month until yesterday. It highlights the specific date range covered and compares trends with data from 30 days before the selected period.
- Bug fix for app crash when users access 'PagerDuty System Status' in the Settings screen.
**iOS**
- Introducing the Analytics Card on App Home Screen! Monitor your team's MTTA and MTTR, plus the count and details of High Urgency Incidents from the previous month until yesterday. It highlights the specific date range covered and compares trends with data from 30 days before the selected period.
- App Tip Notifications will occasionally notify you about new features and PagerDuty tips. You can disable them from the App Settings. Navigate to More (Settings) and toggle App Tip Notifications.
## 7.53 — 16 Jan 2024
**Android**
- Introducing the Analytics Card on App Home Screen! Monitor your team's MTTA and MTTR, plus the count and details of High Urgency Incidents from the previous month until yesterday. It highlights the specific date range covered and compares trends with data from 30 days before the selected period.
- Bug fix for app crash when users access 'PagerDuty System Status' in the Settings screen.
**iOS**
- Introducing the Analytics Card on App Home Screen! Monitor your team's MTTA and MTTR, plus the count and details of High Urgency Incidents from the previous month until yesterday. It highlights the specific date range covered and compares trends with data from 30 days before the selected period.
## 7.52 — 8 Jan 2024
**Android**
- Introducing the Analytics Card on App Home Screen! Monitor your team's MTTA and MTTR, plus the count and details of High Urgency Incidents from the previous month until yesterday. It highlights the specific date range covered and compares trends with data from 30 days before the selected period.
- Bug fix for app crash when users access 'PagerDuty System Status' in the Settings screen.
**iOS**
- Introducing the Analytics Card on App Home Screen! Monitor your team's MTTA and MTTR, plus the count and details of High Urgency Incidents from the previous month until yesterday. It highlights the specific date range covered and compares trends with data from 30 days before the selected period.
## 7.51 — 4 Jan 2024
**Android**
- We've addressed a bug causing the app to crash when attempting to access 'PagerDuty System Status' in the Settings screen
- We've resolved a bug that led to app crashes in certain scenarios when users attempted to log out of their accounts
- You can now trigger a New Incident from the Home Screen
**iOS**
- We've addressed a bug causing the app to crash when attempting to access 'PagerDuty System Status' in the Settings screen
- We've resolved a bug that led to app crashes in certain scenarios when users attempted to log out of their accounts
- You can now trigger a New Incident from the Home Screen
---
URL: https://docs.pagerduty.com/get-started/mobile-release-notes/mobile-release-notes-archive
# Mobile Release Notes (Archive)
An archive of older PagerDuty mobile app release notes for iOS and Android versions no longer listed on the current page.
## 7.50 — 21 Dec 2023
**Android**
- Triggering an incident is now much easier with the 'New Incident' button on the Home Screen
- Resolved critical Android 14 login issue.
- Fixed country code picker bug when adding a contact on the profile page.
**iOS**
- We've got some really cool things going on behind the scenes. Stay tuned!
## 7.49 — 14 Dec 2023
**Android**
- We've addressed a bug causing the app to crash when attempting to access 'PagerDuty System Status' in the Settings screen
- We've resolved a bug that led to app crashes in certain scenarios when users attempted to log out of their accounts.
- You can now trigger a New Incident from the Home Screen
**iOS**
- We've addressed a bug causing the app to crash when attempting to access 'PagerDuty System Status' in the Settings screen
- We've resolved a bug that led to app crashes in certain scenarios when users attempted to log out of their accounts.
- You can now trigger a New Incident from the Home Screen
##
## 7.48 — 07 Dec 2023
**Android**
- Triggering an incident is now much easier with the 'New Incident' button on the Home Screen
- Resolved critical Android 14 login issue.
- Fixed country code picker bug when adding a contact on the profile page.
**iOS**
- We've got some really cool things going on behind the scenes. Stay tuned!
## 7.47 — 30 Nov 2023
**Android**
- Stay informed on disruptions effortlessly with our latest mobile app update! Introducing the new Status Dashboard Card, on your Mobile Home Screen. Easily monitor your top three affected Business Services, sorted by priority. Simply choose your preferred dashboards from the Status Dashboard Screen, accessible in the 'More' Tab.
Other Updates:
- Resolved critical Android 14 login issue
- Fixed country code picker bug when adding a contact on the profile page
**iOS**
- Stay informed on disruptions effortlessly with our latest mobile app update! Introducing the new Status Dashboard Card, on your Mobile Home Screen. Easily monitor your top three affected Business Services, sorted by priority. Simply choose your preferred dashboards from the Status Dashboard Screen, accessible in the 'More' Tab.
## 7.46 — 20 Nov 2023
**Android**
- Stay informed on disruptions effortlessly with our latest mobile app update! Introducing the new Status Dashboard Card, on your Mobile Home Screen. Easily monitor your top three affected Business Services, sorted by priority. Simply choose your preferred dashboards from the Status Dashboard Screen, accessible in the 'More' Tab.
**Attention Android 14 Users**: In this release, we've addressed a critical login issue specifically affecting devices on Android 14.
**iOS**
- Stay informed on disruptions effortlessly with our latest mobile app update! Introducing the new Status Dashboard Card, on your Mobile Home Screen. Easily monitor your top three affected Business Services, sorted by priority. Simply choose your preferred dashboards from the Status Dashboard Screen, accessible in the 'More' Tab.
## 7.45 — 14 Nov 2023
**Android**
- Stay informed on disruptions effortlessly with our latest mobile app update! Introducing the new Status Dashboard Card, on your Mobile Home Screen. Easily monitor your top three affected Business Services, sorted by priority. Simply choose your preferred dashboards from the Status Dashboard Screen, accessible in the 'More' Tab.
**Attention Android 14 Users**: In this release, we've addressed a critical login issue specifically affecting devices on Android 14.
**iOS**
- Stay informed on disruptions effortlessly with our latest mobile app update! Introducing the new Status Dashboard Card, on your Mobile Home Screen. Easily monitor your top three affected Business Services, sorted by priority. Simply choose your preferred dashboards from the Status Dashboard Screen, accessible in the 'More' Tab.
## 7.43 — 30 Oct 2023
**Android**
- Stay informed on disruptions effortlessly with our latest mobile app update! Introducing the new Status Dashboard Card, on your Mobile Home Screen. Easily monitor your top three affected Business Services, sorted by priority. Simply choose your preferred dashboards from the Status Dashboard Screen, accessible in the 'More' Tab.
**Attention Android 14 Users**: In this release, we've addressed a critical login issue specifically affecting devices on Android 14.
**iOS**
- Stay informed on disruptions effortlessly with our latest mobile app update! Introducing the new Status Dashboard Card, on your Mobile Home Screen. Easily monitor your top three affected Business Services, sorted by priority. Simply choose your preferred dashboards from the Status Dashboard Screen, accessible in the 'More' Tab.
## 7.42 — 23 Oct 2023
**Android** → **Attention Android 14 Users**: In this release, we've addressed a critical login issue specifically affecting devices on Android 14. We understand how crucial it is for you to have a seamless experience, and this update ensures that the PagerDuty Mobile app continues to work flawlessly.
Other Updates:
- You can update your High Urgency Notification Rules: Choose Preset options or customize with 'Advanced Rules'. To access this, navigate to Profile → Update Notification Preference
**iOS**
- We've got some really cool things going on behind the scenes. Stay tuned!
## 7.41 — 16 Oct 2023
**Android** → **Attention Android 14 Users**: In this release, we've addressed a critical login issue specifically affecting devices on Android 14. We understand how crucial it is for you to have a seamless experience, and this update ensures that the PagerDuty Mobile app continues to work flawlessly.
Other Updates:
- Behind the scenes Android 13 compatibility updates.
- Added Notification Permission prompts during onboarding for Android 13 users.
**iOS**
- You can now update your High Urgency Notification Preferences from Pre-configured and Recommended options or tailor your own notification rules using 'Advanced Notification Rules'. To access this feature, simply navigate to Settings → Notification Preference
## 7.40 — 9 Oct 2023
**Android** → **Attention Android 14 Users**: In this release, we've addressed a critical login issue specifically affecting devices on Android 14. We understand how crucial it is for you to have a seamless experience, and this update ensures that the PagerDuty Mobile app continues to work flawlessly.
Other Updates:
- Behind the scenes Android 13 compatibility updates.
- Added Notification Permission prompts during onboarding for Android 13 users.
**iOS**
- You can now update your High Urgency Notification Preferences from Pre-configured and Recommended options or tailor your own notification rules using 'Advanced Notification Rules'. To access this feature, simply navigate to Settings → Notification Preference
## 7.39 — 2 Oct 2023
**Android**
- We've got some really cool things going on behind the scenes. Stay tuned!
**iOS**
- You can now update your High Urgency Notification Preferences from Pre-configured and Recommended options or tailor your own notification rules using 'Advanced Notification Rules'. To access this feature, simply navigate to Settings → Notification Preference
## 7.38 — 25 Sept 2023
**Android**
- We've got some really cool things going on behind the scenes. Stay tuned!
**iOS**
- We've got some really cool things going on behind the scenes. Stay tuned!
## 7.37 — 18 Sept 2023
**Android**
- Addressed an intermittent crash occurring on the Home screen.
- Bug fix for crashes on the Profile Screen in certain use cases.
**iOS**
- We've got some really cool things going on behind the scenes. Stay tuned!
## 7.36 — 11 Sept 2023
**Android**
- Addressed an intermittent crash occurring on the Home screen.
- Bug fix for crashes on the Profile Screen in certain use cases.
**iOS**
- We've got some really cool things going on behind the scenes. Stay tuned!
## 7.35 — 5 Sept 2023
**Android**
- Addressed an intermittent crash occurring on the Home screen.
- Bug fix for crashes on the Profile Screen in certain use cases.
**iOS**
- We've got some really cool things going on behind the scenes. Stay tuned!
## 7.34 — 28 Aug 2023
**Android**
- Fixed a bug where the Incident Workflows list occasionally failed to load.
- Implemented a major behind-the-scenes refactor to increase app performance and stability.
**iOS**
- Incase you log out of the app, your previous Mobile Notification Preferences will still be retained.
- Fixed the bug where the 'High Urgency' audio tone is set back to default after you log out.
- Fixed an issue where some users with multiple accounts were shown a blank screen after being logged out due to session timeout.
## 7.33 — 22 Aug 2023
**Android**
- Fixed a bug where the Incident Workflows list occasionally failed to load.
- Implemented a major behind-the-scenes refactor to increase app performance and stability.
**iOS**
- Incase you log out of the app, your previous Mobile Notification Preferences will still be retained.
- Fixed the bug where the 'High Urgency' audio tone is set back to default after you log out.
- Fixed an issue where some users with multiple accounts were shown a blank screen after being logged out due to session timeout.
## 7.32 — 14 Aug 2023
**Android**
- Fixed a bug where the Incident Workflows list occasionally failed to load.
- Implemented a major behind-the-scenes refactor to increase app performance and stability.
**iOS**
- Incase you log out of the app, your previous Mobile Notification Preferences will still be retained.
- Fixed the bug where the 'High Urgency' audio tone is set back to default after you log out.
- Fixed an issue where some users with multiple accounts were shown a blank screen after being logged out due to session timeout.
## 7.30.1 — 01 Aug 2023
**Android**
- Implemented a major behind-the-scenes refactor to increase app performance and stability.
**iOS**
- In case you log out of the app, your previous Mobile Notification Preferences will still be retained.
- Fixed the bug where the 'High Urgency' audio tone is set back to default after you log out.
- Fixed an issue where some users with multiple accounts were shown a blank screen after being logged out due to session timeout.
## 7.30 — 31 Jul 2023
**Android**
- Implemented a major behind-the-scenes refactor to increase app performance and stability.
**iOS**
- Bug Fixes around rare use cases where users were unintentionally being logged out of the app.
## 7.29 — 24 Jul 2023
**Android**
- Minor UI fixes on Schedules Screen for certain Account types.
**iOS**
- Bug Fixes around rare use cases where users were unintentionally being logged out of the app.
## 7.28 — 17 Jul 2023
**Android**
- Introducing Modernized navigation. Switch screens seamlessly, bypassing the hidden hamburger menu. Your navigation history is now preserved even while you simultaneously navigate multiple screens.
- You can now view Custom Fields on the Incident details screen. Custom Fields allows you to pull in important incident data from any system of record and put it at the fingertips of responders so they have the information needed to resolve incidents faster.
**iOS**
- You can now view Custom Fields on the Incident details screen. Custom Fields allows you to pull in important incident data from any system of record and put it at the fingertips of responders so they have the information needed to resolve incidents faster.
## 7.27 — 11 Jul 2023
**Android**
- Introducing Modernized navigation. Switch screens seamlessly, bypassing the hidden hamburger menu. Your navigation history is now preserved even while you simultaneously navigate multiple screens.
- You can now view Custom Fields on the Incident details screen. Custom Fields allows you to pull in important incident data from any system of record and put it at the fingertips of responders so they have the information needed to resolve incidents faster
**iOS**
- You can now view Custom Fields on the Incident details screen. Custom Fields allows you to pull in important incident data from any system of record and put it at the fingertips of responders so they have the information needed to resolve incidents faster.
## 7.26 — 26 Jun 2023
**Android**
- Introducing Modernized navigation. Switch screens seamlessly, bypassing the hidden hamburger menu. Your navigation history is now preserved even while you simultaneously navigate multiple screens
- You can now view Custom Fields on the Incident details screen. Custom Fields allows you to pull in important incident data from any system of record and put it at the fingertips of responders so they have the information needed to resolve incidents faster
**iOS**
- You can now view Custom Fields on the Incident details screen. Custom Fields allows you to pull in important incident data from any system of record and put it at the fingertips of responders so they have the information needed to resolve incidents faster.
## 7.25 — 20 Jun 2023
**Android**
- Introducing Modernized navigation. Switch screens seamlessly, bypassing the hidden hamburger menu. Your navigation history is now preserved even while you simultaneously navigate multiple screens
- You can now view Custom Fields on the Incident details screen. Custom Fields allows you to pull in important incident data from any system of record and put it at the fingertips of responders so they have the information needed to resolve incidents faster
**iOS**
- You can now view Custom Fields on the Incident details screen. Custom Fields allows you to pull in important incident data from any system of record and put it at the fingertips of responders so they have the information needed to resolve incidents faster.
## 7.24 — 12 Jun 2023
**Android**
- Bug fix for intermittent crash during the multi-selection of incidents
**iOS**
- We have revamped our error messaging to provide clearer and more user-friendly error messages
## 7.23 — 5 Jun 2023
**Android**
- We have introduced the new minimum OS requirements to ensure the app continues to be innovative and secure. As a result, the current and future versions of the app will require Android 10.0 or higher. Please ensure your device is upgraded to continue receiving mobile app updates.
**iOS**
- We have revamped our error messaging to provide clearer and more user-friendly error messages
## 7.22 — 29 May 2023
**Android**
- We have introduced the new minimum OS requirements to ensure the app continues to be innovative and secure. As a result, the current and future versions of the app will require Android 10.0 or higher. Please ensure your device is upgraded to continue receiving mobile app updates.
**iOS**
- We have revamped our error messaging to provide clearer and more user-friendly error messages
## 7.21 — 23 May 2023
**Android**
- We have introduced the new minimum OS requirements to ensure the app continues to be innovative and secure. As a result, the current and future versions of the app will require Android 10.0 or higher. Please ensure your device is upgraded to continue receiving mobile app updates.
- Bug fix for app crashes
**iOS**
- We have introduced the new minimum OS requirements to ensure the app continues to be innovative and secure. As a result, the current and future versions of the app will require iOS 15.0 or higher. Please ensure your device is upgraded to continue receiving mobile app updates.
## 7.20 — 15 May 2023
**Android**
- Bug fix for app crashes
- We have introduced the new minimum OS requirements to ensure the app continues to be innovative and secure. As a result, this will be the last version to support Android 9. The future versions of the app will require Android 10.0 or higher. Please ensure your device is upgraded to continue receiving mobile app updates.
**iOS**
- We have introduced the new minimum OS requirements to ensure the app continues to be innovative and secure. As a result, the current and future versions of the app will require iOS 15.0 or higher. Please ensure your device is upgraded to continue receiving mobile app updates.
## 7.19 — 8 May 2023
**iOS**
- We have introduced the new minimum OS requirements to ensure the app continues to be innovative and secure. As a result, the current and future versions of the app will require iOS 15.0 or higher. Please ensure your device is upgraded to continue receiving mobile app updates.
## 7.18 — 24 Apr 2023
**Android**
- We have fixed the bug where sometimes tapping on a notification would lead to a blank page
- We are introducing the new minimum OS requirements to ensure the app continues to be innovative and secure. Starting May 1, 2023, the future versions of the app will require Android 10.0 or higher. Please ensure your device is upgraded to continue receiving mobile app updates.
**iOS**
- Introducing Modernized navigation on Mobile: With Modernized Navigation, you can switch between screens easily without the need to tap the hidden Hamburger Menu and relaunch the screens. This upgrade means you can move from one screen to another quickly and without any extra steps. Additionally, your history will be preserved even while you simultaneously navigate multiple screens.
- We are introducing the new minimum OS requirements to ensure the app continues to be innovative and secure. Starting May 1, 2023, the future versions of the app will require iOS 15.0 or higher. Please ensure your device is upgraded to continue receiving mobile app updates.
## 7.17 — 17 Apr 2023
**Android**
- We have fixed the bug where sometimes tapping on a notification would lead to a blank page
- We are introducing the new minimum OS requirements to ensure the app continues to be innovative and secure. Starting May 1, 2023, the future versions of the app will require Android 10.0 or higher. Please ensure your device is upgraded to continue receiving mobile app updates.
**iOS**
- Introducing Modernized navigation on Mobile: With Modernized Navigation, you can switch between screens easily without the need to tap the hidden Hamburger Menu and relaunch the screens. This upgrade means you can move from one screen to another quickly and without any extra steps. Additionally, your history will be preserved even while you simultaneously navigate multiple screens.
- We are introducing the new minimum OS requirements to ensure the app continues to be innovative and secure. Starting May 1, 2023, the future versions of the app will require iOS 15.0 or higher. Please ensure your device is upgraded to continue receiving mobile app updates.
## 7.16 — 10 Apr 2023
**Android**
- We have fixed the bug where sometimes tapping on a notification would lead to a blank page
- We are introducing the new minimum OS requirements to ensure the app continues to be innovative and secure. Starting May 1, 2023, the future versions of the app will require Android 10.0 or higher. Please ensure your device is upgraded to continue receiving mobile app updates.
**iOS**
- Introducing Modernized navigation on Mobile: With Modernized Navigation, you can switch between screens easily without the need to tap the hidden Hamburger Menu and relaunch the screens. This upgrade means you can move from one screen to another quickly and without any extra steps. Additionally, your history will be preserved even while you simultaneously navigate multiple screens.
- We are introducing the new minimum OS requirements to ensure the mobile app continues to be innovative and secure and improve the user experience. Starting May 1, 2023, the future versions of the PagerDuty mobile app will require iOS 15.0 or higher. Please ensure your device is upgraded to continue receiving mobile app updates.
## 7.15 — 3 Apr 2023
**Android**
- We've got some really cool things going on behind the scenes. Stay tuned!
**iOS**
- Introducing Modernized navigation on Mobile: With Modernized Navigation, you can switch between screens easily without the need to tap the hidden Hamburger Menu and relaunch the screens. This upgrade means you can move from one screen to another quickly and without any extra steps. Additionally, your history will be preserved even while you simultaneously navigate multiple screens.
## 7.14 — 20 Mar 2023
**Android**
- We've got some really cool things going on behind the scenes. Stay tuned!
**iOS**
- Triggering an incident is now much easier with the 'New Incident' button on the Home Screen
- Requested responders can now ack/resolve/snooze incidents during a coordinated response
## 7.13 — 14 Mar 2023
**Android**
- We've got some really cool things going on behind the scenes. Stay tuned!
**iOS**
- Triggering an incident is now much easier with the 'New Incident' button on the Home Screen
- Requested responders can now ack/resolve/snooze incidents during a coordinated response
- Fixed the bug where hyperlinks in the incident's overview status update could not be tapped
## 7.12 — 6 Mar 2023
**Android**
- We've got some really cool things going on behind the scenes. Stay tuned!
**iOS**
- Triggering an incident is now much easier with the 'New Incident' button on the Home Screen
- Requested responders can now ack/resolve/snooze incidents during a coordinated response
- Fixed the bug where hyperlinks in the incident's overview status update could not be tapped
## 7.11 — 27 Feb 2023
**Android**
- We've got some really cool things going on behind the scenes. Stay tuned!
**iOS**
- Triggering an incident is now much easier with the 'New Incident' button on the Home Screen
- Fixed a bug where on-call shifts could show up twice on the Home Screen
- Fixed a crash that some users may have experienced on the Service Details screen
## 7.10 — 21 Feb 2023
**Android**
- Optimized overall App performance
- We've got some really cool things going on behind the scenes. Stay tuned!
**iOS**
- Triggering an incident is now much easier with the 'New Incident' button on the Home Screen
- Fixed a bug where on-call shifts could show up twice on the Home Screen
- Fixed a crash that some users may have experienced on the Service Details screen
## 7.09 — 13 Feb 2023
**Android**
- Optimized overall App performance
- We've got some really cool things going on behind the scenes. Stay tuned!
**iOS**
- Bug fix for intermittent app crash when schedules dates are updated
- We've got some really cool things going on behind the scenes. Stay tuned!
## 7.08 — 6 Feb 2023
**Android**
- Introducing the Mobile Home Screen. The new Home screen highlights top open incidents, and displays on-call shift and service information, which broadens awareness and streamlines navigation to other important, non-incident information.
- Optimized overall App performance
**iOS**
- Introducing the Mobile Home Screen. The new Home screen highlights top open incidents, and displays on-call shift and service information, which broadens awareness and streamlines navigation to other important, non-incident information.
## 7.07 — 30 Jan 2023
**Android**
- Introducing the Mobile Home Screen. The new Home screen highlights top open incidents, and displays on-call shift and service information, which broadens awareness and streamlines navigation to other important, non-incident information.
- Bug fix for the intermittent App crash when the Incident detail section is tapped
**iOS**
- Introducing the Mobile Home Screen. The new Home screen highlights top open incidents, and displays on-call shift and service information, which broadens awareness and streamlines navigation to other important, non-incident information.
- Optimized overall App performance
## 7.06 — 25 Jan 2023
**Android**
- Introducing the Mobile Home Screen. The new Home screen highlights top open incidents, and displays on-call shift and service information, which broadens awareness and streamlines navigation to other important, non-incident information.
- Optimized overall App performance
**iOS**
- Introducing the Mobile Home Screen. The new Home screen highlights top open incidents, and displays on-call shift and service information, which broadens awareness and streamlines navigation to other important, non-incident information.
- Bug fix for the issue where tapping "Show more" on the incident page didn't display the data
- Bug fix for broken links when the URL contains spaces
## 7.05 — 16 Jan 2023
**Android**
- Introducing the Mobile Home Screen. The new Home screen highlights top open incidents, and displays on-call shift and service information, which broadens awareness and streamlines navigation to other important, non-incident information.
- Bug fix for when the App hangs after app lock is enabled or when the user switches themes
**iOS**
- Introducing the Mobile Home Screen. The new Home screen highlights top open incidents, and displays on-call shift and service information, which broadens awareness and streamlines navigation to other important, non-incident information.
- Bug fix for the App crash on iPad, when the share icon is tapped
- Bug fix for broken links when the URL contains spaces
Thanks for all the great feedback! Email [support@pagerduty.com](mailto:support@pagerduty.com) with any comments.
## 7.04 — 9 Jan 2023
**Android**
- We're like chefs in a kitchen cooking up features behind-the-scenes.
**iOS**
- We're like chefs in a kitchen cooking up features behind-the-scenes.
Thanks for all the great feedback! Email [support@pagerduty.com](mailto:support@pagerduty.com) with any comments.
## 7.03 — 3 Jan 2023
**Android**
- We're like chefs in a kitchen cooking up features behind-the-scenes.
**iOS**
- We're like chefs in a kitchen cooking up features behind-the-scenes.
Thanks for all the great feedback! Email [support@pagerduty.com](mailto:support@pagerduty.com) with any comments.
## 7.02 — 19 Dec 2022
**Android**
- We increased the font size on a few screens for better readability
- We made performance improvements to help get your incident data faster
**iOS**
- We increased the font size on a few screens for better readability
- We made performance improvements to help get your incident data faster
Thanks for all the great feedback! Email [support@pagerduty.com](mailto:support@pagerduty.com) with any comments.
## 7.01 — 12 Dec 2022
**Android**
- We're like chefs in a kitchen cooking up features behind-the-scenes.
**iOS**
- We're like chefs in a kitchen cooking up features behind-the-scenes.
Thanks for all the great feedback! Email [support@pagerduty.com](mailto:support@pagerduty.com) with any comments.
## 7.00 — 5 Dec 2022
**Android**
- Updated snackbar colors for better contrast in light & dark mode
- Updated default secondary sort on the Open Incidents screen
**iOS**
- Updated default secondary sort on the Open Incidents screen
- Fixed a bug in the service details screen correcting the behavior of the loading indicators
Thanks for all the great feedback! We're always looking for ways to improve the app. Email [support@pagerduty.com](mailto:support@pagerduty.com) with any comments.
## 6.99 — 28 Nov 2022
**Android**
- We're like chefs in a kitchen cooking up features behind the scenes.
**iOS**
- We're like chefs in a kitchen cooking up features behind the scenes.
Thanks for all the great feedback! We're always looking for ways to improve the app. Email [support@pagerduty.com](mailto:support@pagerduty.com) with any comments.
## 6.98 — 21 Nov 2022
**Android**
- We're like chefs in a kitchen cooking up features behind the scenes.
**iOS**
- We're like chefs in a kitchen cooking up features behind the scenes.
Thanks for all the great feedback! We're always looking for ways to improve the app. Email [support@pagerduty.com](mailto:support@pagerduty.com) with any comments.
## 6.97 — 14 Nov 2022
**Android**
- We're like chefs in a kitchen cooking up features behind the scenes.
**iOS**
- We're like chefs in a kitchen cooking up features behind the scenes.
Thanks for all the great feedback! We're always looking for ways to improve the app. Email [support@pagerduty.com](mailto:support@pagerduty.com) with any comments.
## 6.96 — 7 Nov 2022
**Android**
- We're like chefs in a kitchen cooking up features behind the scenes.
**iOS**
- We're like chefs in a kitchen cooking up features behind the scenes.
Thanks for all the great feedback! We're always looking for ways to improve the app. Email [support@pagerduty.com](mailto:support@pagerduty.com) with any comments.
## 6.95 — 31 Oct 2022
**Android**
- We've got some really cool things going on behind the scenes. Stay tuned!
**iOS**
- We've got some really cool things going on behind the scenes. Stay tuned!
Thanks for all the great feedback! We're always looking for ways to improve the app. Email [support@pagerduty.com](mailto:support@pagerduty.com) with any comments.
## 6.94 — 24 Oct 2022
**Android**
- The Open Incidents screen will now remember your previously viewed tab so you can access them faster, reducing the number of navigation taps.
**iOS**
- The Open Incidents screen will now remember your previously viewed tab so you can access them faster, reducing the number of navigation taps.
Thanks for all the great feedback! We're always looking for ways to improve the app. Email [support@pagerduty.com](mailto:support@pagerduty.com) with any comments.
## 6.93 — 17 Oct 2022
**Android**
- We've got some really cool things going on behind the scenes. Stay tuned!
**iOS**
- We've got some really cool things going on behind the scenes. Stay tuned!
Thanks for all the great feedback! We're always looking for ways to improve the app. Email [support@pagerduty.com](mailto:support@pagerduty.com) with any comments.
## 6.92 — 10 Oct 2022
**Android**
- We've got some really cool things going on behind the scenes. Stay tuned!
**iOS**
- We've got some really cool things going on behind the scenes. Stay tuned!
Thanks for all the great feedback! We're always looking for ways to improve the app. Email [support@pagerduty.com](mailto:support@pagerduty.com) with any comments.
## 6.91 — 26 Sep 2022
**Android**
- We've got some really cool things going on behind the scenes. Stay tuned!
**iOS**
- We've got some really cool things going on behind the scenes. Stay tuned!
Thanks for all the great feedback! We're always looking for ways to improve the app. Email [support@pagerduty.com](mailto:support@pagerduty.com) with any comments.
## 6.90 — 19 Sep 2022
**Android**
- We've got some really cool things going on behind the scenes. Stay tuned!
**iOS**
- We've got some really cool things going on behind the scenes. Stay tuned!
Thanks for all the great feedback! We're always looking for ways to improve the app. Email [support@pagerduty.com](mailto:support@pagerduty.com) with any comments.
## 6.89 — 12 Sep 2022
**Android**
- We've got some really cool things going on behind the scenes. Stay tuned!
**iOS**
- We've got some really cool things going on behind the scenes. Stay tuned!
Thanks for all the great feedback! We're always looking for ways to improve the app. Email [support@pagerduty.com](mailto:support@pagerduty.com) with any comments.
## 6.88 — 5 Sep 2022
**Android**
- We've got some really cool things going on behind the scenes. Stay tuned!
**iOS**
- We've got some really cool things going on behind the scenes. Stay tuned!
Thanks for all the great feedback! We're always looking for ways to improve the app. Email [support@pagerduty.com](mailto:support@pagerduty.com) with any comments.
## 6.87 — 29 Aug 2022
**Android**
- We've got some really cool things going on behind the scenes. Stay tuned!
**iOS**
- We've got some really cool things going on behind the scenes. Stay tuned!
Thanks for all the great feedback! We're always looking for ways to improve the app. Email [support@pagerduty.com](mailto:support@pagerduty.com) with any comments.
## 6.86 — 22 Aug 2022
**Android**
- Ever wish you could pause time? Us too! We haven't figured that one out yet, but we have brought you the convenience of Maintenance Windows. Now you can create, update, and delete Maintenance Windows on the go. We can't stop time, but we can disable services. It's so exciting you'll be wishing you could fast-forward time instead of pausing it.
**iOS**
- Ever wish you could pause time? Us too! We haven't figured that one out yet, but we have brought you the convenience of Maintenance Windows. Now you can create, update, and delete Maintenance Windows on the go. We can't stop time, but we can disable services. It's so exciting you'll be wishing you could fast-forward time instead of pausing it.
Thanks for all the great feedback! We're always looking for ways to improve the app. Email [support@pagerduty.com](mailto:support@pagerduty.com) with any comments.
## 6.85 — 15 Aug 2022
**Android**
- We've got some really cool things going on behind the scenes. Stay tuned!
**iOS**
- We've got some really cool things going on behind the scenes. Stay tuned!
Thanks for all the great feedback! We're always looking for ways to improve the app. Email [support@pagerduty.com](mailto:support@pagerduty.com) with any comments.
## 6.84 — 8 Aug 2022
**Android**
- We've got some really cool things going on behind the scenes. Stay tuned!
**iOS**
- We've got some really cool things going on behind the scenes. Stay tuned!
Thanks for all the great feedback! We're always looking for ways to improve the app. Email [support@pagerduty.com](mailto:support@pagerduty.com) with any comments.
## 6.83 — 1 Aug 2022
**Android**
- We've got some really cool things going on behind the scenes. Stay tuned!
**iOS**
- We've got some really cool things going on behind the scenes. Stay tuned!
Thanks for all the great feedback! We're always looking for ways to improve the app. Email [support@pagerduty.com](mailto:support@pagerduty.com) with any comments.
## 6.82 — 25 Jul 2022
**Android**
- We've got some really cool things going on behind the scenes. Stay tuned!
**iOS**
- We've got some really cool things going on behind the scenes. Stay tuned!
Thanks for all the great feedback! We're always looking for ways to improve the app. Email [support@pagerduty.com](mailto:support@pagerduty.com) with any comments.
## 6.81 — 18 Jul 2022
**Android**
- We've got some really cool things going on behind the scenes. Stay tuned!
**iOS**
- We've got some really cool things going on behind the scenes. Stay tuned!
Thanks for all the great feedback! We're always looking for ways to improve the app. Email [support@pagerduty.com](mailto:support@pagerduty.com) with any comments.
## 6.80 — 11 Jul 2022
**Android**
- We've got some really cool things going on behind the scenes. Stay tuned!
**iOS**
- We've got some really cool things going on behind the scenes. Stay tuned!
Thanks for all the great feedback! We're always looking for ways to improve the app. Email [support@pagerduty.com](mailto:support@pagerduty.com) with any comments.
## 6.79 — 27 Jun 2022
**Android**
- To ensure that PagerDuty continues to be innovative and secure, our mobile app now requires Android 9.0 or later. Please ensure your device is upgraded to continue receiving app updates.
- We're working behind the scenes on some great new features. Stay tuned!
**iOS**
- To ensure that PagerDuty continues to be innovative and secure, our mobile app now requires iOS 14.0 or later. Please ensure your device is upgraded to continue receiving app updates.
- We're working behind the scenes on some great new features. Stay tuned!
Thanks for all the great feedback! We're always looking for ways to improve the app. Email [support@pagerduty.com](mailto:support@pagerduty.com) with any comments.
## 6.78 — 20 Jun 2022
**Android**
- To ensure that PagerDuty continues to be innovative and secure, future versions of our mobile app will require Android 9.0 or later. Please ensure your device is upgraded to continue receiving app updates.
- We're working behind the scenes on some great new features. Stay tuned!
**iOS**
- To ensure that PagerDuty continues to be innovative and secure, future versions of our mobile app will require iOS 14.0 or later. Please ensure your device is upgraded to continue receiving app updates.
- We're working behind the scenes on some great new features. Stay tuned!
Thanks for all the great feedback! We're always looking for ways to improve the app. Email [support@pagerduty.com](mailto:support@pagerduty.com) with any comments.
## 6.77 — 13 Jun 2022
**Android**
- We're working behind the scenes on some great new features. Stay tuned!
**iOS**
- We're working behind the scenes on some great new features. Stay tuned!
Thanks for all the great feedback! We're always looking for ways to improve the app. Email [support@pagerduty.com](mailto:support@pagerduty.com) with any comments.
## 6.76 — 6 Jun 2022
**Android**
- We're working behind the scenes on some great new features. Stay tuned!
**iOS**
- We're working behind the scenes on some great new features. Stay tuned!
Thanks for all the great feedback! We're always looking for ways to improve the app. Email [support@pagerduty.com](mailto:support@pagerduty.com) with any comments.
## 6.75 — 30 May 2022
**Android**
- We're working behind the scenes on some great new features. Stay tuned!
**iOS**
- We're working behind the scenes on some great new features. Stay tuned!
Thanks for all the great feedback! We're always looking for ways to improve the app. Email [support@pagerduty.com](mailto:support@pagerduty.com) with any comments.
## 6.74 — 23 May 2022
**Android**
- We're working behind the scenes on some great new features. Stay tuned!
**iOS**
- We're working behind the scenes on some great new features. Stay tuned!
Thanks for all the great feedback! We're always looking for ways to improve the app. Email [support@pagerduty.com](mailto:support@pagerduty.com) with any comments.
## 6.73 — 16 May 2022
**Android**
- Manually writing these release notes can be tiresome. If only it could be automated... like our newest addition, Automation Actions!
- View and run Automation Actions right on an Incident!
- See a list of Initiated Automation Actions and their progress through the new Output Report screen!
**iOS**
- Manually writing these release notes can be tiresome. If only it could be automated... like our newest addition, Automation Actions!
- View and run Automation Actions right on an Incident!
- See a list of Initiated Automation Actions and their progress through the new Output Report screen!
Thanks for all the great feedback! We're always looking for ways to improve the app. Email [support@pagerduty.com](mailto:support@pagerduty.com) with any comments.
## 6.72 — 9 May 2022
**Android**
- We're working behind the scenes on some great new features. Stay tuned!
**iOS**
- We're working behind the scenes on some great new features. Stay tuned!
Thanks for all the great feedback! We're always looking for ways to improve the app. Email [support@pagerduty.com](mailto:support@pagerduty.com) with any comments.
## 6.71 — 2 May 2022
**Android**
- We're working behind the scenes on some great new features. Stay tuned!
**iOS**
- We're working behind the scenes on some great new features. Stay tuned!
Thanks for all the great feedback! We're always looking for ways to improve the app. Email [support@pagerduty.com](mailto:support@pagerduty.com) with any comments.
## 6.70 — 25 Apr 2022
**Android**
- We're working behind the scenes on some great new features. Stay tuned!
**iOS**
- We're working behind the scenes on some great new features. Stay tuned!
Thanks for all the great feedback! We're always looking for ways to improve the app. Email [support@pagerduty.com](mailto:support@pagerduty.com) with any comments.
## 6.69 — 18 Apr 2022
**Android**
- You can now remove Push Notification Contact Methods through the User Profile.
- We're working behind the scenes on some great new features. Stay tuned!
**iOS**
- Alert Alert! Resolving Alerts should now actually resolve the Alert.
- We're working behind the scenes on some great new features. Stay tuned!
Thanks for all the great feedback! We're always looking for ways to improve the app. Email [support@pagerduty.com](mailto:support@pagerduty.com) with any comments.
## 6.68 — 11 Apr 2022
**Android**
- We're working behind the scenes on some great new features. Stay tuned!
**iOS**
- We're working behind the scenes on some great new features. Stay tuned!
Thanks for all the great feedback! We're always looking for ways to improve the app. Email [support@pagerduty.com](mailto:support@pagerduty.com) with any comments.
## 6.67 — 4 Apr 2022
**Android**
- We're working behind the scenes on some great new features. Stay tuned!
**iOS**
- We're working behind the scenes on some great new features. Stay tuned!
Thanks for all the great feedback! We're always looking for ways to improve the app. Email [support@pagerduty.com](mailto:support@pagerduty.com) with any comments.
## 6.66 — 28 Mar 2022
**Android**
- We're working behind the scenes on some great new features. Stay tuned!
**iOS**
- Fixed a bug where Resolution Notes were being truncated to a single letter.
- We're working behind the scenes on some great new features. Stay tuned!
Thanks for all the great feedback! We're always looking for ways to improve the app. Email [support@pagerduty.com](mailto:support@pagerduty.com) with any comments.
## 6.65 — 21 Mar 2022
**Android**
- We're working behind the scenes on some great new features. Stay tuned!
**iOS**
- We're working behind the scenes on some great new features. Stay tuned!
Thanks for all the great feedback! We're always looking for ways to improve the app. Email [support@pagerduty.com](mailto:support@pagerduty.com) with any comments.
## 6.64 — 14 Mar 2022
**Android**
- We're working behind the scenes on some great new features. Stay tuned!
**iOS**
- We're working behind the scenes on some great new features. Stay tuned!
Thanks for all the great feedback! We're always looking for ways to improve the app. Email [support@pagerduty.com](mailto:support@pagerduty.com) with any comments.
## 6.63 — 7 Mar 2022
**Android**
- We're working behind the scenes on some great new features. Stay tuned!
**iOS**
- We fixed a bug where changing subscription settings took some users to the wrong screen.
- We're working behind the scenes on some great new features. Stay tuned!
Thanks for all the great feedback! We're always looking for ways to improve the app. Email [support@pagerduty.com](mailto:support@pagerduty.com) with any comments.
## 6.62 — 28 Feb 2022
**Android**
- We're working behind the scenes on some great new features. Stay tuned!
**iOS**
- We fixed a bug where the Accounts screen would sometimes be presented twice.
- We're working behind the scenes on some great new features. Stay tuned!
Thanks for all the great feedback! We're always looking for ways to improve the app. Email [support@pagerduty.com](mailto:support@pagerduty.com) with any comments.
## 6.61 — 22 Feb 2022
**Android**
- We removed some unnecessary spacing in our Resolved Incidents list screen.
- Fixed an issue that would sometimes prevent users from redirecting back to the App during Login.
- We're working behind the scenes on some great new features. Stay tuned!
**iOS**
- We added an empty state message to the Subscribers screen.
- We're working behind the scenes on some great new features. Stay tuned!
Thanks for all the great feedback! We're always looking for ways to improve the app. Email [support@pagerduty.com](mailto:support@pagerduty.com) with any comments.
## 6.60 — 14 Feb 2022
**Android**
- We can now sort incidents in the open incidents screen by most recent.
- We're working behind the scenes on some great new features. Stay tuned!
**iOS**
- Added a description to Automatic Contact Card Management in Settings.
- We're working behind the scenes on some great new features. Stay tuned!
Thanks for all the great feedback! We're always looking for ways to improve the app. Email [support@pagerduty.com](mailto:support@pagerduty.com) with any comments.
## 6.59 — 7 Feb 2022
**Android**
- You're gonna like a log, we've worked hard to fix an issue with our login flow. (Not as hard as I worked on this pun though)
- We're working behind the scenes on some great new features. Stay tuned!
**iOS**
- We're working behind the scenes on some great new features. Stay tuned!
Thanks for all the great feedback! We're always looking for ways to improve the app. Email [support@pagerduty.com](mailto:support@pagerduty.com) with any comments.
## 6.58 — 1 Feb 2022
**Android**
- Fixed a bug where resolution note templates did not auto-populate with a default message.
- Fixed a bug where incident labels would overlap on smaller screens. Shout out to our new intern, Tom!
**iOS**
- Fixed a bug where the incorrect duration would show for resolved incidents. Shout out to our new intern, Sparsh!
Thanks for all the great feedback! We're always looking for ways to improve the app. Email [support@pagerduty.com](mailto:support@pagerduty.com) with any comments.
## 6.57 — 25 Jan 2022
**Android**
- We're cooking up something special for you behind the scenes. Stay tuned!
**iOS**
- We're cooking up something special for you behind the scenes. Stay tuned!
Thanks for all the great feedback! We're always looking for ways to improve the app. Email [support@pagerduty.com](mailto:support@pagerduty.com) with any comments.
## 6.56 — 17 Jan 2022
**Android**
- We're cooking up something special for you behind the scenes. Stay tuned!
**iOS**
- We're cooking up something special for you behind the scenes. Stay tuned!
Thanks for all the great feedback! We're always looking for ways to improve the app. Email [support@pagerduty.com](mailto:support@pagerduty.com) with any comments.
## 6.55 — 7 Jan 2022
**Android**
- Fixed a bug where the Note and Status Update widgets were not showing properly.
**iOS**
- Calling and texting international numbers from the User Details screen now includes the "+" prefix.
- Fixed a bug where some widgets were not visible after responding to a coordinated response.
Thanks for all the great feedback! We're always looking for ways to improve the app. Email [support@pagerduty.com](mailto:support@pagerduty.com) with any comments.
## 6.53 — 6 Dec 2021
**Android**
- Fixed a minor crash on the Incident screen.
- Made improvements to actions on the Alert screen.
**iOS**
- Made improvements to actions on the Alert screen.
- We're cooking up something special for you behind the scenes. Stay tuned!
Thanks for all the great feedback! We're always looking for ways to improve the app. Email [support@pagerduty.com](mailto:support@pagerduty.com) with any comments.
## 6.52 — 30 Nov 2021
**Android**
- We're cooking up something special for you behind the scenes. Stay tuned!
**iOS**
- We're cooking up something special for you behind the scenes. Stay tuned!
Thanks for all the great feedback! We're always looking for ways to improve the app. Email [support@pagerduty.com](mailto:support@pagerduty.com) with any comments.
## 6.51 — 22 Nov 2021
**Android**
- We're cooking up something special for you behind the scenes. Stay tuned!
**iOS**
- We're cooking up something special for you behind the scenes. Stay tuned!
Thanks for all the great feedback! We're always looking for ways to improve the app. Email [support@pagerduty.com](mailto:support@pagerduty.com) with any comments.
## 6.50 — 16 Nov 2021
**Android**
- Added the ability to use existing custom notification rules.
- Fixed a bug where push notifications were sent even after removing the account.
**iOS**
- We're cooking up something special for you behind the scenes. Stay tuned!
Thanks for all the great feedback! We're always looking for ways to improve the app. Email [support@pagerduty.com](mailto:support@pagerduty.com) with any comments.
## 6.49 — 8 Nov 2021
**Android**
- Bug fixes and improvements
**iOS**
- Bug fixes and improvements
Thanks for all the great feedback! We're always looking for ways to improve the app. Email [support@pagerduty.com](mailto:support@pagerduty.com) with any comments.
## 6.48 — 1 Nov 2021
**Android**
- Fixed an issue for some of you who were being logged out.
- Fixed a couple broken menu items in Incident Details.
- We're working behind the scenes on some great new features. Stay tuned!
**iOS**
- Fixed an issue for some of you who were being logged out.
- We're working behind the scenes on some great new features. Stay tuned!
Thanks for all the great feedback! We're always looking for ways to improve the app. Email [support@pagerduty.com](mailto:support@pagerduty.com) with any comments.
## 6.47 — 25 Oct 2021
**Android**
- We're working behind the scenes on some great new features. Stay tuned!
**iOS**
- We're working behind the scenes on some great new features. Stay tuned!
Thanks for all the great feedback! We're always looking for ways to improve the app. Email [support@pagerduty.com](mailto:support@pagerduty.com) with any comments.
## 6.46 — 18 Oct 2021
**Android**
- We're working behind the scenes on some great new features. Stay tuned!
**iOS**
- A few bug fixes to keep the app running smoothly
- We're working behind the scenes on some great new features. Stay tuned!
Thanks for all the great feedback! We're always looking for ways to improve the app. Email [support@pagerduty.com](mailto:support@pagerduty.com) with any comments.
## 6.45 — 12 Oct 2021
**Android**
- Made improvements to the confirmation dialogue when scheduling an override. Thanks Amir!
**iOS**
- The Apple Watch app has been overhauled to support all models and complication styles, and the innards have been reworked to keep things more reliably up-to-date.
- Fixed a banner crash for iOS 12 users.
- Improved visual feedback when taking an incident action. Thanks Emily!
Thanks for all the great feedback! We're always looking for ways to improve the app. Email [support@pagerduty.com](mailto:support@pagerduty.com) with any comments.
## 6.44 — 27 Sep 2021
**Android**
- A few small bug fixes to keep things running smoothly!
- We're working behind the scenes on some great new features. Stay tuned!
**iOS**
- We're working behind the scenes on some great new features. Stay tuned!
Thanks for all the great feedback! We're always looking for ways to improve the app. Email [support@pagerduty.com](mailto:support@pagerduty.com) with any comments.
## 6.43 — 20 Sep 2021
**Android**
- We're like chefs cooking behind-the-scene features in the back. Stay tuned!
**iOS**
- We're like chefs cooking behind-the-scene features in the back. Stay tuned!
Thanks for all the great feedback! We're always looking for ways to improve the app. Email [support@pagerduty.com](mailto:support@pagerduty.com) with any comments.
## 6.42 — 13 Sep 2021
**Android**
- Brace yourself, Fall is coming! We've done some Fall cleaning that will aid us in delivering you a better app.
- This is the first release that no longer supports Android Lollipop (5.0 - 5.1.1).
**iOS**
- Brace yourself, Fall is coming! We've done some Fall cleaning that will aid us in delivering you a better app.
Thanks for all the great feedback! We're always looking for ways to improve the app. Email [support@pagerduty.com](mailto:support@pagerduty.com) with any comments.
## 6.41 — 7 Sep 2021
**Android**
- Restricted Access users get the Mine tab on Open Incidents, and can take actions on incidents (within the limitations of their permissions).
- Fixed the ordering and consistency of details on the Incident Details screen.
- This will be the last release that supports Android Lollipop (5.0 - 5.1.1). Make sure to upgrade your OS to continue receiving new features, and bug fixes!
**iOS**
- If you already have some custom notification rules setup, we'll let you skip the template step when logging in to a new device. Stay safe out there!
- We're busy refactoring this thing from the inside out for added reliability and speed.
Thanks for all the great feedback! We're always looking for ways to improve the app. Email [support@pagerduty.com](mailto:support@pagerduty.com) with any comments.
## 6.40 — 30 Aug 2021
**Android**
- We're doing some tune ups in the garage. Stay tuned!
**iOS**
- Adding/Editing a priority has a new look. Check it out!
- Fixed a bug for iPad users where tapping the Share button would crash the app.
Thanks for all the great feedback! We're always looking for ways to improve the app. Email [support@pagerduty.com](mailto:support@pagerduty.com) with any comments.
## 6.39 — 23 Aug 2021
**Android**
- We're backstage doing some behind-the-scenes work for new features!
**iOS**
- We're backstage doing some behind-the-scenes work for new features!
Thanks for all the great feedback! We're always looking for ways to improve the app. Email [support@pagerduty.com](mailto:support@pagerduty.com) with any comments.
## 6.38 — 17 Aug 2021
**Android**
- We're backstage doing some behind-the-scenes work for new features!
**iOS**
- You can now update the urgency of an incident
- We're backstage doing some behind-the-scenes work for new features!
Thanks for all the great feedback! We're always looking for ways to improve the app. Email [support@pagerduty.com](mailto:support@pagerduty.com) with any comments.
## 6.37 — 9 Aug 2021
**Android**
- Miscellaneous bugfixes
- We're backstage doing some behind-the-scenes work for new features!
**iOS**
- Miscellaneous bugfixes.
- We're backstage doing some behind-the-scenes work for new features!
Thanks for all the great feedback! We're always looking for ways to improve the app. Email [support@pagerduty.com](mailto:support@pagerduty.com) with any comments.
## 6.36 — 2 Aug 2021
**Android**
- Want to know the recent code changes related to your incident? We gotchu - look for our new Change Events functionality in Service & Incident Details!\*
- We're like chefs cooking behind-the-scene features in the back. Stay tuned!
\*for certain plans only
**iOS**
- Want to know the recent code changes related to your incident? We gotchu - look for our new Change Events functionality in Service & Incident Details!\*
- Fixed an issue with time formatting causing issues in My OnCall Shifts.
- We're like chefs cooking behind-the-scene features in the back. Stay tuned!
\*for certain plans only
Thanks for all the great feedback! We're always looking for ways to improve the app. Email [support@pagerduty.com](mailto:support@pagerduty.com) with any comments.
## 6.35 — 26 Jul 2021
**Android**
- We fixed a bug where your OnCall shift might not have been shown correctly if it started one day, ended the next, and was less than 24 hours long.
- Annnnd another pesky bug where an incorrect amount of team subscriptions was being shown on an Incident.
- We're like chefs cooking behind-the-scene features in the back. Stay tuned!
**iOS**
- We're like chefs cooking behind-the-scene features in the back. Stay tuned!
Thanks for all the great feedback! We're always looking for ways to improve the app. Email [support@pagerduty.com](mailto:support@pagerduty.com) with any comments.
## 6.34 — 20 Jul 2021
**Android**
- Don't forget to checkout -b the new Service Dependencies feature to keep track of, you guessed it, your service dependencies!
- We've got some bug fixes, and more behind-the-scenes features cooking in the back so get your git fork ready! Bone apple teeth!
**iOS**
- Don't forget to checkout -b the new Service Dependencies feature to keep track of, you guessed it, your service dependencies!
- We've got some bug fixes, and more behind-the-scenes features cooking in the back so get your git fork ready! Bone apple teeth!
Thanks for all the great feedback! We're always looking for ways to improve the app. Email [support@pagerduty.com](mailto:support@pagerduty.com) with any comments.
## 6.33 — 12 Jul 2021
**Android**
- We're like chefs cooking behind-the-scene features in the back. Stay tuned!
**iOS**
- We're like chefs cooking behind-the-scene features in the back. Stay tuned!
Thanks for all the great feedback! We're always looking for ways to improve the app. Email [support@pagerduty.com](mailto:support@pagerduty.com) with any comments.
## 6.32 — 5 Jul 2021
**Android**
- Ongoing work behind the scenes on new features.
**iOS**
- Ongoing work behind the scenes on new features.
- Miscellaneous bugfixes.
Thanks for all the great feedback! We're always looking for ways to improve the app. Email [support@pagerduty.com](mailto:support@pagerduty.com) with any comments.
## 6.31 — 28 Jun 2021
**Android**
- Ongoing work behind the scenes on new features.
- Fixed an issue where some users were shown the login screen when opening the app.
- A few bug fixes to make your life easier!
**iOS**
- Ongoing work behind the scenes on new features.
- A few bug fixes to make your life easier!
Thanks for all the great feedback! We're always looking for ways to improve the app. Email [support@pagerduty.com](mailto:support@pagerduty.com) with any comments.
## 6.29 — 11 Jun 2021
**Android**
- Introducing a new incident feature — Past Incidents! When history repeats itself, we can look to the past for solutions.
- More behind-the-scenes features cooking in the back!
**iOS**
- Introducing a new incident feature — Past Incidents! When history repeats itself, we can look to the past for solutions.
- More behind-the-scenes features cooking in the back!
Thanks for all the great feedback! We're always looking for ways to improve the app. Email [support@pagerduty.com](mailto:support@pagerduty.com) with any comments.
## 6.28 — 8 Jun 2021
**Android**
- Incident priority is now visible on the business service details screen when it's disrupted.
- Fixed a permission error for some users trying to add an impacted business service to an incident.
- Still working away on some big features.
**iOS**
- Added some visual indication that an operation is working on the incident details screen.
- Fixed a bug on the user details screen related to pulling to refresh.
- Fixed a bug on the business service details screen where it might look disrupted in the list but not in the details. (It was indeed disrupted.)
- Still working away on some big features.
Thanks for all the great feedback! We're always looking for ways to improve the app. Email [support@pagerduty.com](mailto:support@pagerduty.com) with any comments.
## 6.27 —31 May 2021
**Android**
- Updated Tips of the Day to be more user friendly!
- Still working away on some big features.
**iOS**
- Still working away on some big features.
Thanks for all the great feedback! We're always looking for ways to improve the app. Email [support@pagerduty.com](mailto:support@pagerduty.com) with any comments.
## 6.26 —24 May 2021
**Android**
- Fixed some of the text you see during setup to clarify that we're not going to call all your friends when there's an incident. (You can, though.) Thanks, Shalin!
- Still working away on some big features.
**iOS**
- Still working away on some big features.
Thanks for all the great feedback! We're always looking for ways to improve the app. Email [support@pagerduty.com](mailto:support@pagerduty.com) with any comments.
## 6.25 —17 May 2021
**Android**
- Fixed a lil' crash in the Incident Details screen.
- Still working away on some big features.
**iOS**
- Fixed the "Required abilities are unavailable" error.
- Fixed some colour problems in the Status Dashboard for our beloved iOS 12 users.
- Still working away on some big features.
Thanks for all the great feedback! We're always looking for ways to improve the app. Email [support@pagerduty.com](mailto:support@pagerduty.com) with any comments.
## 6.23 —3 May 2021
**Android**
- Fixed a UI issue if you were multi-selecting a LOT of incidents!
- More behind-the-scenes features cooking in the back!
**iOS**
- More behind-the-scenes features cooking in the back!
Thanks for all the great feedback! We're always looking for ways to improve the app. Email [support@pagerduty.com](mailto:support@pagerduty.com) with any comments.
## 6.22 —26 April 2021
**Android**
- More behind-the-scenes features cooking in the back!
**iOS**
- Fixed a bug where the incident card would cut off text
- More behind-the-scenes features cooking in the back!
Thanks for all the great feedback! We're always looking for ways to improve the app. Email [support@pagerduty.com](mailto:support@pagerduty.com) with any comments.
## 6.21 — 19 April 2021
**Android**
- It's April, the suns out, the bugs are out ... but the bugs are also outside of our app cause we've been working on various bug fixes and ongoing work behind the scenes on new features! Stay tuned!
**iOS**
- It's April, the suns out, the bugs are out ... but the bugs are also outside of our app cause we've been working on various bug fixes and ongoing work behind the scenes on new features! Stay tuned!
Thanks for all the great feedback! We're always looking for ways to improve the app. Email [support@pagerduty.com](mailto:support@pagerduty.com) with any comments.
## 6.20 — 13 April 2021
**Android**
- There’s been a delay with some features getting stuck on a massive cargo ship but we’ve gotten word they’re on their way. Stay tuned!
**iOS**
- There’s been a delay with some features getting stuck on a massive cargo ship but we’ve gotten word they’re on their way. Stay tuned!
Thanks for all the great feedback! We're always looking for ways to improve the app. Email [support@pagerduty.com](mailto:support@pagerduty.com) with any comments.
## 6.19 — 30 Mar 2021
**Android**
- Ongoing work behind the scenes on new features.
**iOS**
- Ongoing work behind the scenes on new features.
Thanks for all the great feedback! We're always looking for ways to improve the app. Email [support@pagerduty.com](mailto:support@pagerduty.com) with any comments.
## 6.18 — 22 Mar 2021
**Android**
- Ongoing work behind the scenes on new features.
**iOS**
- Various bug fixes in and around the app. Mostly in… we’re not allowed outside.
- Ongoing work behind the scenes on new features.
Thanks for all the great feedback! We're always looking for ways to improve the app. Email [support@pagerduty.com](mailto:support@pagerduty.com) with any comments.
## 6.17 — 15 Mar 2021
**Android**
- Ongoing work behind the scenes on new features.
**iOS**
- Ongoing work behind the scenes on new features.
Thanks for all the great feedback! We're always looking for ways to improve the app. Email [support@pagerduty.com](mailto:support@pagerduty.com) with any comments.
## 6.16 — 9 Mar 2021
**Android**
- Ongoing work behind the scenes on new features.
**iOS**
- Ongoing work behind the scenes on new features.
Thanks for all the great feedback! We're always looking for ways to improve the app. Email [support@pagerduty.com](mailto:support@pagerduty.com) with any comments.
## 6.15 — 2 Mar 2021
**Android**
- Ongoing work behind the scenes on new features.
**iOS**
- Ongoing work behind the scenes on new features.
Thanks for all the great feedback! We're always looking for ways to improve the app. Email [support@pagerduty.com](mailto:support@pagerduty.com) with any comments.
## 6.14 — 22 Feb 2021
**Android**
- Updated the list of country codes you’ll see when creating a new phone number/SMS contact method. Note: not all countries can be delivered to. Check your plan and be sure to test notifications before going on-call!
- Fixed some bugs on the Alerts screen, mostly removing things that don’t apply to Alerts.
**iOS**
- Fixed some bugs on the Alerts screen, mostly removing things that don’t apply to Alerts.
Thanks for all the great feedback! We’re always looking for ways to improve the app. Email [support@pagerduty.com](mailto:support@pagerduty.com) with any comments.
## 6.13 — 16 Feb 2021
**Android**
- We'll now log you out of the app if your authentication token is revoked.
- Working hard behind the scenes on new and upcoming features.
**iOS**
- Fixed some errors you might have seen when viewing incident details with funky permission setups
- Working hard behind the scenes on new and upcoming features.
Thanks for all the great feedback! We’re always looking for ways to improve the app. Email [support@pagerduty.com](mailto:support@pagerduty.com) with any comments.
## 6.12 — 8 Feb 2021
**Android**
- Custom Status Dashboards are now available! Quickly switch between all business services and your own specific dashboard.
- On-Call Boosters begin rolling out this week. Timely, actionable information will be delivered straight to your device, such as a change to your next on-call shift, or being added to or removed from a schedule. Tap the notification to take you straight there!
**iOS**
- Custom Status Dashboards are now available on mobile! Quickly switch between all business services and your own specific dashboard.
- On-Call Boosters will begin rolling out this week. Timely, actionable information will be delivered straight to your device, such as a change to your next on-call shift, or being added to or removed from a schedule. Tap the notification to take you straight there! More to be rolled out over the following months.
- In the Status Dashboard, Business Services with teams attached will say so, and you can tap through to the team details.
Thanks for all the great feedback! We’re always looking for ways to improve the app. Email [support@pagerduty.com](mailto:support@pagerduty.com) with any comments.
## 6.11 — 1 Feb 2021
**Android**
- Working hard behind the scenes on new upcoming features.
**iOS**
- Some UI tweaks so we can look our best for you!
- Working hard behind the scenes on new upcoming features.
Thanks for all the great feedback! We’re always looking for ways to improve the app. Email [support@pagerduty.com](mailto:support@pagerduty.com) with any comments.
## 6.10 — 25 Jan 2021
**Android**
- There was a bug where you could accidentally notify the same responder many times by tapping really fast. It’s fixed, but I still recommend slowing down and enjoying life. Great work, Aviva!
**iOS**
- Fixed a confusing message when you used the Acknowledge All/Resolve All function. Great work, Sunni!
- Fixed a crash when you’d choose Snooze from the More menu on an iPad.
Thanks for all the great feedback! We’re always looking for ways to improve the app. Email [support@pagerduty.com](mailto:support@pagerduty.com) with any comments.
## 6.09 — 18 Jan 2021
**Android**
- If tapping on an incident status update wasn't taking you anywhere, now it'll take you to the Status Dashboard
**iOS**
- If tapping on an incident status update wasn't taking you anywhere, now it'll take you to the Status Dashboard.
Thanks for all the great feedback! We’re always looking for ways to improve the app. Email [support@pagerduty.com](mailto:support@pagerduty.com) with any comments.
## 6.08 — 5 Jan 2021
**Android**
- More work going on behind the scenes for upcoming functionality!
**iOS**
- You can now setup your notification rules during onboarding! Be ready for On-Call with a tap of a button! (... maybe a few more taps).
- Login through custom browser through your enterprise's configuration
- Let it snow! Manual incident sync with an external system
Thanks for all the great feedback! We’re always looking for ways to improve the app. Email [support@pagerduty.com](mailto:support@pagerduty.com) with any comments.
## 6.07 — 22 Dec 2020
**Android**
- Login through custom browser through your enterprise's configuration
- Let it snow! Manual incident sync with an external system
Thanks for all the great feedback! We’re always looking for ways to improve the app. Email [support@pagerduty.com](mailto:support@pagerduty.com) with any comments.
## 6.06 — 14 Dec 2020
**Android**
- Bug fixes and UI improvements
\*. On-going work behind the scenes on new features
**iOS**
- Bug fixes and UI improvements
- On-going work behind the scenes on new features
Thanks for all the great feedback! We’re always looking for ways to improve the app. Email [support@pagerduty.com](mailto:support@pagerduty.com) with any comments.
## 6.05 — 1 Dec 2020
**Android**
- Bug fixes and UI improvements
- On-going work behind the scenes on new features
**iOS**
- Bug fixes and UI improvements
- On-going work behind the scenes on new features
Thanks for all the great feedback! We’re always looking for ways to improve the app. Email [support@pagerduty.com](mailto:support@pagerduty.com) with any comments.
## 6.04 — 17 Nov 2020
**Android**
- Replaced some older icons with new ones. The old ones didn’t want to go, so we convinced them to go trick-or-treating and locked the door after they left.
- Fixed the Service Directory to consume less data. Thumbs up for healthier choices.
**iOS**
- Fixed the Resolution Note screen to make the Resolve button available for iPhone SE users. So now you have all the great functionality of the PagerDuty app AND extra pocket space – truly no better time to be alive.
- Not one but TWO sets of construction going on in this app. I can’t get through a single conference call without a table saw firing up right when it’s my turn to talk. Stay tuned for new features!
Thanks for all the great feedback! We’re always looking for ways to improve the app. Email [support@pagerduty.com](mailto:support@pagerduty.com) with any comments.
## 6.03 — 2 Nov 2020
**Android**
- We’ve got a cute new look for our contact card permissions screen. Yes that means more Pagey!
- Lots of behind the scenes work on bettering volume and dnd override functionality, and for other upcoming functionality. Hint: It’s going to be great!
**iOS**
- We’ve been doing a lot of behind the scenes work for upcoming functionality so stay tuned! Hint: it’s going to be great!
Thanks for all the great feedback! We’re always looking for ways to improve the app. Email [support@pagerduty.com](mailto:support@pagerduty.com) with any comments.
## 6.02 — 19 Oct 2020
**Android**
- Lots of work going on to make your notifications more reliable.
- Ongoing work behind the scenes on new features.
**iOS**
- You can now post resolution notes as status updates when resolving an incident. Let 'em know what you did!
- Links to the PagerDuty status page will open in your browser, as they should.
- A few iOS 14 fixes, like colours and stuff.
- Fixed some icon funkiness when you turned your phone sideways.
Thanks for all the great feedback! We’re always looking for ways to improve the app. Email [support@pagerduty.com](mailto:support@pagerduty.com) with any comments.
## 6.01 — 6 Oct 2020
**Android**
- You can now post resolution notes as status updates when resolving an incident
- Bug fixes and UI improvements
- On-going work behind the scenes on new features
**iOS**
- Fixed a bug related to the incident share link when shared through iMessage
- Bug fixes and UI improvements
- On-going work behind the scenes on new features
Thanks for all the great feedback! We're always looking for ways to improve the app. Email [support@pagerduty.com](mailto:support@pagerduty.com) with any comments.
## 6.0 — 4 Sept 2020
**Android**
- We've been working on a mountain of new functionality and bug fixes so stay tuned.
- Talking about mountains, don't forget to register for Summit20: The virtual event for real-time digital ops professionals! Snow-cap it'll be fun, trust. Register for free: [https://summit.pagerduty.com/global/begin](https://summit.pagerduty.com/global/begin)
**iOS**
- We've been working on a mountain of new functionality and bug fixes so stay tuned.
- Talking about mountains, don't forget to register for Summit20: The virtual event for real-time digital ops professionals! Snow-cap it'll be fun, trust. Register for free: [https://summit.pagerduty.com/global/begin](https://summit.pagerduty.com/global/begin)
Thanks for all the great feedback! We’re always looking for ways to improve the app. Email [support@pagerduty.com](mailto:support@pagerduty.com) with any comments.
## 5.103 — 1 Sept 2020
**Android**
- Service Directory now shows a list of impacting incidents for disrupted services confetti all around
- We now have a fancy new way to help you setup your notification rules right from the app!
- More behind-the-scenes features cooking away in our kitchen.
**iOS**
- Service Directory now shows a list of impacting incidents for disrupted services confetti all around
- More behind-the-scenes features cooking away in our kitchen.
Thanks for all the great feedback! We’re always looking for ways to improve the app. Email [support@pagerduty.com](mailto:support@pagerduty.com) with any comments.
## 5.102 — 24 Aug 2020
**Android**
- We crushed-a-crash(TM) that was happening in the Accounts screen.
- We fixed a bug with clicking on links in Incident Details.
- We’re like chefs in a kitchen with some behind-the-scene features cooking in the back.
**iOS**
- Critical alerts are here! Now you can turn on Do Not Disturb and ignore everyone except for us!
- We’re like chefs in a kitchen with some behind-the-scene features cooking in the back.
Thanks for all the great feedback! We’re always looking for ways to improve the app. Email [support@pagerduty.com](mailto:support@pagerduty.com) with any comments.
## 5.101 — 10 Aug 2020
**Android**
- Fixed a bug where empty resolution notes were appearing as “null”. You don’t have to worry about it anymore cause we’ve nulled the null bug.
- We’ve added some extra info to let you know when the last time your contact card was updated.
**iOS**
- We fixed some bugs that were added into the app. I’m not going to say it was me. But I’m also not going to say it wasn’t.
- We’re like chefs in a kitchen with some behind-the-scene features cooking in the back.
Thanks for all the great feedback! We’re always looking for ways to improve the app. Email [support@pagerduty.com](mailto:support@pagerduty.com) with any comments.
## 5.100 — 27 Jul 2020
**Android**
- You can escalate an incident from the menu in the incident detail screen
- You can also add resolution notes when resolving an incident now
- Fix push notification issues from the Settings screen with the new Troubleshoot Notifications feature
- Fixed push notification issues for LG devices
**iOS**
- You can escalate an incident from the menu in the incident detail screen
- We’ve added some user tips to help you better understand how to override your shifts
- Fix push notification issues from the Settings screen with the new Troubleshoot Notifications feature
- Bug fixes and ongoing work behind the scenes for upcoming functionality
Thanks for all the great feedback! We’re always looking for ways to improve the app. Email [support@pagerduty.com](mailto:support@pagerduty.com) with any comments.
## 5.99.1 — 13 Jul 2020
**Android**
- You can now view incidents that impact a business service through the status dashboard!
- Bug fixes and ongoing work behind the scenes for upcoming functionality.
**iOS**
- Bug fixes and ongoing work behind the scenes for upcoming functionality.
Thanks for all the great feedback! We’re always looking for ways to improve the app. Email [support@pagerduty.com](mailto:support@pagerduty.com) with any comments.
## 5.98 — 29 Jun 2020
**Android**
- Added support for better deep linking to PagerDuty from links and other apps.
- Bug fixes and ongoing work behind the scenes for upcoming functionality.
Thanks for all the great feedback! We’re always looking for ways to improve the app. Email [support@pagerduty.com](mailto:support@pagerduty.com) with any comments.
**iOS**
- You can now edit an Incident’s title! Select Edit Title from the incident actions menu.
- Bug fixes and ongoing work behind the scenes for upcoming functionality.
Thanks for all the great feedback! We’re always looking for ways to improve the app. Email [support@pagerduty.com](mailto:support@pagerduty.com) with any comments.
## 5.97 — 15 Jun 2020
**Android**
- Tapping on an on-call hand off push notification will now take you to its schedule!
- Adding support for more deep links into the app and fixing some bugs along the way.
- More work going on behind the scenes for upcoming functionality.
**iOS**
- You can now Resolve Alerts from the app!
- Fixed a pesky crash in the New User Demo and a custom actions error for Restricted Access users.
- More work going on behind the scenes for upcoming functionality.
## 5.96.1 — 3 Jun 2020
**Android**
- Fixed push notification issues for OnePlus and Samsung devices
- Fixed a crash when trying to save your contact information
- More work going on behind the scenes for upcoming functionality
**iOS**
- You can now share a link to an incident from the Incident Details screen by tapping the More button!
- Fixed accessibility bug where VoiceOver would not interact with the Menu button
- More work going on behind the scenes for upcoming functionality
Thanks for all the great feedback! We’re always looking for ways to improve the app. Email [support@pagerduty.com](mailto:support@pagerduty.com) with any comments.
## 5.95 — 18 May 2020
**Android**
- Pagey has joined to help get you setup. Say hi the next time you login!
- We had some bugs that weren’t practicing proper social distancing so we made sure to put a mask on it.
Thanks for all the great feedback! We’re always looking for ways to improve the app. Email [support@pagerduty.com](mailto:support@pagerduty.com) with any comments.
**iOS**
- Pagey has joined to help get you setup. Say hi the next time you login!
- There’s fresh look to the more menu in the incident details. Go check it out!
- We’ve made it so that tapping on a schedules link or a status update will take you to the appropriate location in the app instead of opening it up on your browser.
Thanks for all the great feedback! We’re always looking for ways to improve the app. Email [support@pagerduty.com](mailto:support@pagerduty.com) with any comments.
## 5.94 — 04 May 2020
**Android**
- Whoa, there’s a new button on the Incident Details? It says “Related Incidents”? WHAT? I CAN SEE RELATED INCIDENTS NOW? Yes you can folks+!
- Check out the new sleek redesign of the more menu on the Incident Details!
- Light/dark mode default is now your system settings unless otherwise specified already.
+only for certain plans
**iOS**
- Whoa, there’s a new button on the Incident Details? It says “Related Incidents”? WHAT? I CAN SEE RELATED INCIDENTS NOW? Yes you can folks+
- Bug fixes and behind the scenes work in preparation for upcoming functionality
+only for certain plans
## 5.93 — 13 Apr 2020
**Android**
- We fixed a crash that would sometimes appear when launching the app.
- Continued behind the scenes work in preparation for some super cool upcoming functionality!
**iOS** - No release as of 23 Apr 2020
## 5.92.1 — 23 Apr 2020
**iOS Only**
- This week we cleaned up some bugs (looking at you, iPad) and continued behind the scenes work in preparation for upcoming functionality.
- Fixed a bug causing acknowledging incidents via push notification to fail
## 5.92 — 06 Apr 2020
**Android**
- This week we continue behind the scenes work in preparation for upcoming functionality.
**iOS**
- This week we cleaned up some bugs (looking at you, iPad) and continued behind the scenes work in preparation for upcoming functionality.
## 5.91.1 — 30 Mar 2020
**Android**
- Bug fixes and improvements.
**iOS**
- Bug fixes and improvements.
## 5.91 — 23 Mar 2020
**Android**
- Got some nifty little arrows showing up in Service Details, so if you were confused before, just keep clicking away. It doesn’t bite, we promise!
- More work going on behind the scenes for upcoming functionality.
**iOS**
- Got you a professional looking dot to SWIFTLY (cuz you know, iOS uses Swift… No? Ok I’ll show myself out) tell you what’s new in your app!
- More work going on behind the scenes for upcoming functionality.
## 5.90 — 16 Mar 2020
**Android**
- More fixes for notifications! Some of the pesky bugs when phone's on silent should now be fixed!
- More work going on behind the scenes for upcoming functionality.
Thanks for all the great feedback! We're always looking for ways to improve the app. Email [support@pagerduty.com](mailto:support@pagerduty.com) with any comments.
**iOS**
- More work going on behind the scenes for upcoming functionality.
Thanks for all the great feedback! We're always looking for ways to improve the app. Email [support@pagerduty.com](mailto:support@pagerduty.com) with any comments.
## 5.89 — 09 Mar 2020
**Android**
- Work continues behind the scenes on some great UI improvements. Like all great art, it doesn’t make sense until it’s finished, although they also say that great art is never finished, so I’m going to have to talk to my Product Manager and get back to you.
Thanks for all the great feedback! We’re always looking for ways to improve the app. Email [support@pagerduty.com](mailto:support@pagerduty.com) with any comments, which can even be over 500 characters, unlike these release notes.
**iOS**
- Added the option of including a resolution note when resolving an incident from Incident Details. Pay it forward and let the next responder know how you fixed it! If you don't know how you fixed it, you can leave it blank.
- If you were having trouble getting rid of that “new” badge on the Status Dashboard, don’t worry, it’s been evicted and lost its damage deposit.
- We’ve made the process of adding extra accounts a bit smoother... thanks Dema!
- Work continues behind the scenes on some great UI improvements. Like all great art, it doesn’t make sense until it’s finished, although they also say that great art is never finished, so I’m going to have to talk to my Product Manager and get back to you.
Thanks for all the great feedback! We’re always looking for ways to improve the app. Email [support@pagerduty.com](mailto:support@pagerduty.com) with any comments.
## 5.88 — 02 Mar 2020
**Android**
- Clicking on the version number in Settings will now copy it to your clipboard!
- Are you experiencing notification issues? Do you wish they would just be fixed already? Well look no further! In this new update we hope to solve all(most) of your problems! Here is a full list of notification updates in this release:
- FIXED: [Android 9/10] Notifications received during scheduled/timed DND would permanently set DND to be ON.
- FIXED: [Android 10] When DND is OFF and Volume Override is ON the device could be set to ringer mode when initially in silent mode.
- FIXED: [Android 10] When DND is ON and Volume Override is ON the device could be set to silent mode when initially in ringer mode.
- FIXED: [Android 8] When Volume Override is ON and the device is in vibrate or silent mode, the volume in ringer mode won’t be reset to its initial volume.
- KNOWN BUG: [Android 9/10] When Volume Override is ON and the device is in vibrate or silent mode, the volume in ringer mode won’t be reset to its initial volume.
Thanks for all the great feedback! We’re always looking for ways to improve the app. Email [support@pagerduty.com](mailto:support@pagerduty.com) with any comments.
**iOS**
- Emailing Support through the PagerDuty app will now be pre-populated with some super-neat environment information!
- More work going on behind the scenes for upcoming functionality.
Thanks for all the great feedback! We're always looking for ways to improve the app. Email [support@pagerduty.com](mailto:support@pagerduty.com) with any comments.
## 5.87 — 24 Feb 2020
**Android**
- 9/10 dentists agree that… the other dentist is not welcome to use our product
- Fixed a bug with the badges in the menu list and made improvements
Thanks for all the great feedback! We’re always looking for ways to improve the app. Email [support@pagerduty.com](mailto:support@pagerduty.com) with any comments.
**iOS**
- 9/10 dentists agree that… the other dentist is not welcome to use our product
- Fixed a bug with the badges in the menu list and made improvements
Thanks for all the great feedback! We’re always looking for ways to improve the app. Email [support@pagerduty.com](mailto:support@pagerduty.com) with any comments.
## 5.86 — 17 Feb 2020
**Android**
- After a bit of a snafu last week we’re proud to reintroduce Status Dashboard! Quickly glance at your business services and drill down to figure out what’s up. (Replaces Visibility. Those responsible for this mixup have been sacked^H^H^H^H^H^H invited to a friendly post-mortem.)
- Changing your password will now log you out of the mobile app. You’ll continue to receive push notifications until you log in to the app again.
Thanks for all the great feedback! We’re always looking for ways to improve the app. Email [support@pagerduty.com](mailto:support@pagerduty.com) with any comments.
**iOS**
- After a bit of a snafu last week we’re proud to reintroduce Status Dashboard! Quickly glance at your business services and drill down to figure out what’s up. (Replaces Visibility. Those responsible for this mixup have been sacked^H^H^H^H^H^H invited to a friendly post-mortem.)
- If you use the Reset option in Settings > PagerDuty, we’ll stop your phone from receiving push notifications. It’s like changing your phone number to escape your ex.
- Fixed a login issue for some customers. If you are one of them, you already know!
- Changing your password will now log you out of the mobile app. You’ll continue to receive push notifications until you log in to the app again.
Thanks for all the great feedback! We’re always looking for ways to improve the app. Email [support@pagerduty.com](mailto:support@pagerduty.com) with any comments.
## 5.85 — 10 Feb 2020
**Android**
- **DUN DUN DUN…** What’s that you see? OH THAT’S RIGHT, IT’S STATUS DASHBOARD\*\*\*!!!
- More work going on behind the scenes for upcoming functionality
\*\*\*only for certain plans. batteries not included
Thanks for all the great feedback! We’re always looking for ways to improve the app. Email [support@pagerduty.com](mailto:support@pagerduty.com) with any comments.
**iOS**
- **DUN DUN DUN…** What’s that you see? OH THAT’S RIGHT, IT’S STATUS DASHBOARD\*\*\*!!!
- More work going on behind the scenes for upcoming functionality
\*\*\*only for certain plans. batteries not included
Thanks for all the great feedback! We’re always looking for ways to improve the app. Email [support@pagerduty.com](mailto:support@pagerduty.com) with any comments.
## 5.84 — 3 Feb 2020
**Android**
- My team told me I get to “officially” announce the NEW Service Directory feature… so here we are.
- Squashed some fun, pesky bugs in this release for your continued enjoyment! ( If you were enjoying those bugs, you’re outta luck. )
- More fun work going on behind the scenes for upcoming functionality.
Thanks for all the great feedback! We’re always looking for ways to improve the app. Email [support@pagerduty.com](mailto:support@pagerduty.com) with any comments.
**iOS**
- My team told me I get to “officially” announce the NEW Service Directory feature… so here we are.
- More fun work going on behind the scenes for upcoming functionality.
Thanks for all the great feedback! We’re always looking for ways to improve the app. Email [support@pagerduty.com](mailto:support@pagerduty.com) with any comments.
## 5.83 — 27 Jan 2020
**Android**
- IN THE RIGHT CORNER, WEIGHING THE WEIGHT OF TWO INCREDIBLE INTERNS… SERVICE DETAILS _crowd cheering_! You can now view the details of a service by tapping on it in the Service Directory!
- Fixed an issue that caused an incorrect message to appear when no matches were found while searching on a few screens.
Thanks for all the great feedback! We’re always looking for ways to improve the app. Email [support@pagerduty.com](mailto:support@pagerduty.com) with any comments.
**iOS**
- AND IN THE LEFT CORNER, WEIGHING THE WEIGHT OF TWO INCREDIBLE INTERNS… SERVICE DETAILS _crowd cheering_! You can now view the details of a service by tapping on it in the Service Directory!
- More super cool work going on behind the scenes for upcoming functionality.
Thanks for all the great feedback! We’re always looking for ways to improve the app. Email [support@pagerduty.com](mailto:support@pagerduty.com) with any comments.
## 5.82 — 20 Jan 2020
**Android**
- Light mode is here! In Settings, choose light mode, dark mode, or follow your system’s light and dark modes (Android Q and up).
- Below the Contact Card option in Settings, we’ll let you know when we last updated it.
- Fixed a crash in the authentication for phones without browsers. You still can’t login, but now we’ll tell you why.
Thanks for all the great feedback! We’re always looking for ways to improve the app. Email [support@pagerduty.com](mailto:support@pagerduty.com) with any comments.
**iOS**
- We’ve overhauled our login process to work better with your password managers and autocompletes and single sign-ons and funky keyboards and whatnot. Enjoy!
- Below the Contact Card option in Settings, we’ll let you know when we last updated it. This is handy to know when it’s updated in the background.
- Fixed a couple bugs in the Settings for push notifications. If you’ve previously denied and then re-approved us to send you push notifications, the switch should work correctly now.
Thanks for all the great feedback! We’re always looking for ways to improve the app. Email [support@pagerduty.com](mailto:support@pagerduty.com) with any comments.
## 5.81 — 13 Jan 2020
**Android**
- Work continues on some not-quite-yet-ready features. I hope you’re as excited as we are.
Thanks for all the great feedback! We’re always looking for ways to improve the app. Email [support@pagerduty.com](mailto:support@pagerduty.com) with any comments.
**iOS**
- Contact Card now refreshes in the background, if you’ve enabled it. Have you enabled it?
- Work continues on some not-quite-yet-ready features. I hope you’re as excited as we are.
Thanks for all the great feedback! We’re always looking for ways to improve the app. Email [support@pagerduty.com](mailto:support@pagerduty.com) with any comments.
## 5.80 — 6 Jan 2020
**Android**
- Share an incident from the Incident Details screen.
- Fixed a year-end issue in My On-Call Shifts.
- Replaced login experience with a web-based version using your device’s browser.
- Fixed the colors of the priority labels for enhanced readability.
Thanks for all the great feedback! We’re always looking for ways to improve the app. Email [support@pagerduty.com](mailto:support@pagerduty.com) with any comments.
**iOS**
- Some tune-ups to the Service Directory for upcoming functionality.
Thanks for all the great feedback! We’re always looking for ways to improve the app. Email [support@pagerduty.com](mailto:support@pagerduty.com) with any comments.
## 5.79 — 2 Jan 2020
**Android**
- Typed in a wrong title for an incident?… Don’t worry! You can now edit incident titles in the app!
- Fixed a pesky crash when updating the PagerDuty contact card for the first time.
Thanks for all the great feedback! We’re always looking for ways to improve the app. Email [support@pagerduty.com](mailto:support@pagerduty.com) with any comments.
**iOS**
- Fixed a pesky crash in Visibility when viewing a disrupted Business Service that has status updates.
- More super cool work going on behind the scenes for upcoming functionality.
Thanks for all the great feedback! We’re always looking for ways to improve the app. Email [support@pagerduty.com](mailto:support@pagerduty.com) with any comments.
## 5.78.1 — 17 Dec 2019
**Android**
- You can now unsubscribe other people from incidents if you've "accidentally" subscribed them. You're welcome.
- Fixed a bug that was causing App crashes on the Incident Details page.
Thanks for all the great feedback! We’re always looking for ways to improve the app. Email [support@pagerduty.com](mailto:support@pagerduty.com) with any comments.
## 5.78 — 16 Dec 2019
**iOS**
- You can now see user's email address when searching for a responder to add to an incident. Pretty cool, right?!
- Fixed a bug where if you were logged into an account and signed out, it would not deregister you for push notifications.
Thanks for all the great feedback! We’re always looking for ways to improve the app. Email [support@pagerduty.com](mailto:support@pagerduty.com) with any comments.
## 5.77 — 9 Dec 2019
**iOS**
- Everyone has That Person in the office\* that subscribes them to incidents as a joke. Now you can unsubscribe yourself from the Incident Details screen.
- You can also unsubscribe other people if you've "accidentally" subscribed them.
\*Based on a survey of my co-workers.
Thanks for all the great feedback! We’re always looking for ways to improve the app. Email [support@pagerduty.com](mailto:support@pagerduty.com) with any comments.
**Android**
- Everyone has That Person in the office\* that subscribes them to incidents as a joke. Now you can unsubscribe yourself from the Incident Details screen.
- We won’t let you try to change the account owner’s schedule color anymore.
\*Based on a survey of my co-workers.
Thanks for all the great feedback! We’re always looking for ways to improve the app. Email [support@pagerduty.com](mailto:support@pagerduty.com) with any comments.
## 5.76 — 25 Nov 2019
**iOS**
- Tapping the version number from the Settings screen copies the version and build number to your pasteboard making it easier to supply that information when requesting support - thanks Rob for the suggestion!
- Fixed a bug related to saving the PagerDuty Contact Card
- Links are now styled consistently throughout the app
Thanks for all the great feedback! We’re always looking for ways to improve the app. Email [support@pagerduty.com](mailto:support@pagerduty.com) with any comments.
**Android**
- Incident priority labels are now styled correctly to reflect their true colours
- Fixed a pesky crash related to updating the PagerDuty Contact Card
Thanks for all the great feedback! We’re always looking for ways to improve the app. Email [support@pagerduty.com](mailto:support@pagerduty.com) with any comments.
## 5.75 — 18 Nov 2019
**iOS**
- Why did the PagerDuty Contact Card cross the road? To make sure you don't miss any calls!... My team insisted on a joke (I'm sorry)... We've made some improvements to ensure your PagerDuty Contact Card stays up-to-date.
- More super cool work going on behind the scenes for upcoming functionality.
Thanks for all the great feedback! We’re always looking for ways to improve the app. Email [support@pagerduty.com](mailto:support@pagerduty.com) with any comments.
**Android**
- We have reworked our notifications to more thoroughly respect your DND schedules and volume settings.
- Why did the PagerDuty Contact Card cross the road? To make sure you don't miss any calls!... My team insisted on a joke (I'm sorry)... We've made some improvements to ensure your PagerDuty Contact Card stays up-to-date.
Thanks for all the great feedback! We’re always looking for ways to improve the app. Email [support@pagerduty.com](mailto:support@pagerduty.com) with any comments.
## 5.74 — 11 Nov 2019
**iOS**
- Now able to search by user's email address on user search screen.
- Notification Rule options won't be invisible below iOS 13 because we took care of the text style, didn't we?
- As mentioned last week, we've wiggled in a way to download a PagerDuty contact card so that you don't miss any important calls from us! We've snazzed up the design and UX changes for the Contact Card feature.
Thanks for all the great feedback! We’re always looking for ways to improve the app. Email [support@pagerduty.com](mailto:support@pagerduty.com) with any comments.
**Android**
- You can now edit your schedule colors - knock yourself out with the plethora of colors available at your disposal!
- As mentioned last week, we've wiggled in a way to download a PagerDuty contact card so that you don't miss any important calls from us! We've snazzed up the design and UX changes for the Contact Card feature.
Thanks for all the great feedback! We’re always looking for ways to improve the app. Email [support@pagerduty.com](mailto:support@pagerduty.com) with any comments.
## 5.73 — 4 Nov 2019
**iOS**
- Fixed a crash when snoozing incidents on iPad. Snooze away! Not too long though…
- Fixed an issue where incidents created through Slack were missing some details.
- A little polish to our feature that adds our PagerDuty contact to your phone so you don't miss any phone calls from us.
Thanks for all the great feedback! We're always looking for ways to improve the app. Email [support@pagerduty.com](mailto:support@pagerduty.com) with any comments.
**Android**
- Fixed an issue where incidents created through Slack were missing some details.
- Some polishing to the code that saves our PagerDuty Contact card. Did you know you can add the PagerDuty contact to your phone and keep it up to date so you know it's PagerDuty calling and not spam? Check it out in our Settings menu under Notifications!
Thanks for all the great feedback! We're always looking for ways to improve the app. Email [support@pagerduty.com](mailto:support@pagerduty.com) with any comments.
## 5.72 — 28 Oct 2019
**iOS**
- We added a way to automatically add the PagerDuty contact to your phone and keep it up to date so you know it's PagerDuty calling and not spam. Check it out in our Settings menu under Notifications.
- We made iPad improvements on screens where form sheets are displayed
Thanks for all the great feedback! We’re always looking for ways to improve the app. Email [support@pagerduty.com](mailto:support@pagerduty.com) with any comments.
**Android**
- We added a way to automatically add the PagerDuty contact to your phone and keep it up to date so you know it's PagerDuty calling and not spam. Check it out in our Settings menu under Notifications.
- You can now invite users from the Users screen
- We fixed a pesky bug on the Incident Details screen
Thanks for all the great feedback! We’re always looking for ways to improve the app. Email [support@pagerduty.com](mailto:support@pagerduty.com) with any comments.
## 5.71 — 21 Oct 2019
**iOS**
- Fixed a URL encoding bug with client URLs. Tapping the Thing will go to the Place.
- Spiffed up some of the colours in various places in the app.
Thanks for all the great feedback! We’re always looking for ways to improve the app. Email [support@pagerduty.com](mailto:support@pagerduty.com) with any comments.
**Android**
- Times are displayed in 24-hour time if that's how your phone is set up.
Thanks for all the great feedback! We’re always looking for ways to improve the app. Email [support@pagerduty.com](mailto:support@pagerduty.com) with any comments.
## 5.70 — 13 Oct 2019
**iOS**
- Honk! Honk! Your phone can be a horrible goose with our new goose ringtone.
- Various fixes and tweaks for light mode.
Thanks for all the great feedback! We’re always looking for ways to improve the app. Email [support@pagerduty.com](mailto:support@pagerduty.com) with any comments.
**Android**
- Snooze incident(s) more than 24 hours (up to a week)! Thanks Sophia!
- Honk! Honk! Your phone can be a horrible goose with our new goose ringtone.
- The default for hitting Back is now to exit the app rather than open the menu. Change this in Settings.
- Actions performed through an integration will say so in the Timeline tab.
Thanks for all the great feedback! We’re always looking for ways to improve the app. Email [support@pagerduty.com](mailto:support@pagerduty.com)with any comments.
## 5.69 — 7 Oct 2019
**iOS**
- We updated some of our light mode colors in the login flow.
Thanks for all the great feedback! We’re always looking for ways to improve the app. Email [support@pagerduty.com](mailto:support@pagerduty.com) with any comments.
**Android**
- More work going on behind the scenes for upcoming functionality!
- While I might eat a six-year-old KitKat bar, we will no longer be supporting six-year-old Android KitKat.
Thanks for all the great feedback! We’re always looking for ways to improve the app. Email [support@pagerduty.com](mailto:support@pagerduty.com) with any comments.
## 5.68 — 30 Sept 2019
**iOS**
- If the date picker used for snoozing an incident looked a bit weird to you, it looked weird to us too - we fixed a bug on it.
Thanks for all the great feedback! We’re always looking for ways to improve the app. Email [support@pagerduty.com](mailto:support@pagerduty.com) with any comments.
**Android**
- Doing some behind the scenes work for upcoming functionality. Stay tuned!
Thanks for all the great feedback! We’re always looking for ways to improve the app. Email [support@pagerduty.com](mailto:support@pagerduty.com) with any comments.
## 5.67 — 23 Sept 2019
**iOS**
Who's excited for _PAGERDUTY SUMMIT?!_ We sure are, and we hope to see you there. To celebrate we've added some jazzy changes:
- Introducing new ringtones! Brought to you by Tetsuya and Anton - your latest ringtones “Aaaaaaaahhhhh\~\~~!!” and “Angry Bear”
- If light themes are your thing, we’ve added a light mode for iOS 13! Try it out by changing your app’s appearance from the Settings menu
Thanks for all the great feedback! We’re always looking for ways to improve the app. Email [support](mailto:support@pagerduty.com) with any comments.
**Android**
- New ringtones! Brought to you by Tetsuya and Anton - your latest ringtones “Aaaaaaaahhhhh\~\~~!!” and “Angry Bear”
Thanks for all the great feedback! We’re always looking for ways to improve the app. Email [support](mailto:support@pagerduty.com) with any comments.
## 5.66 — 16 Sept 2019
**iOS**
- Who saw the Apple announcements?! Thanks to everyone who has written into support with iOS 13 beta findings, this release includes some of those fixes. We **love** hearing from you, keep writing into [support](mailto:support@pagerduty.com) with your findings and feedback. :heart:
**Android**
- We fixed a bug where tapping on certain links would crash the app. I call it 'a link to the crash'. I'll show myself out.
Thanks for all the great feedback! We’re always looking for ways to improve the app. Email [support@pagerduty.com](mailto:support@pagerduty.com) with any comments.
## 5.65 — 9 Sept 2019
**iOS**
- We spiffed up the app and we are so excited for you to see our new look! Our new green is Pagey-approved, and don't worry, we've got more coming... the glow up isn't over yet!
- We added a "Learn More" link in the Filter Escalation Policies by Tags screen.
- We fixed a bug where your phone may have periodically registered itself as a new device (and give you new default rules and sounds).
Thanks for all the great feedback! We’re always looking for ways to improve the app. Email [support@pagerduty.com](mailto:support@pagerduty.com) with any comments.
**Android**
- We spiffed up the app and we are so excited for you to see our new look! Our new green is Pagey-approved, and don't worry, we've got more coming... the glow up isn't over yet!
- We fixed a bug where your phone may have periodically registered itself as a new device (and give you new default rules and sounds).
Thanks for all the great feedback! We’re always looking for ways to improve the app. Email [support@pagerduty.com](mailto:support@pagerduty.com) with any comments.
## 5.64 — 3 Sept 2019
**iOS**
- More work going on behind the scenes for upcoming functionality
Thanks for all the great feedback! We’re always looking for ways to improve the app. Email [support@pagerduty.com](mailto:support@pagerduty.com) with any comments.
**Android**
- Fixed an issue affecting acknowledging incidents via notification
- Fixed up pull-to-refresh on the My On-Call Shifts screen
Thanks for all the great feedback! We’re always looking for ways to improve the app. Email [support@pagerduty.com](mailto:support@pagerduty.com) with any comments.
## 5.63 — 26 Aug 2019
**iOS**
- Did some fixin' to the menu to ensure the Accounts menu item is always reachable by scrolling.
- Fixed the New Incident screen to accommodate a really long description and accidental cancellation.
- Fixed a crash when tapping on a schedule override on iPad.
- Tightened up the graphics on Level 3.
- Cleaned up some permissions involving Status Updates to ensure the right people see 'em and the wrong people don't.
Thanks for all the great feedback! We’re always looking for ways to improve the app. Email [support@pagerduty.com](mailto:support@pagerduty.com) with any comments.
**Android**
- The top bar no longer changes colors according to your incident statuses.
- Fixed a crash opening some links on devices without Chrome.
- Fixed an issue selecting an account from a long list on login.
- Fixed an issue affecting read-only users trying to multi-select incidents.
Thanks for all the great feedback! We’re always looking for ways to improve the app. Email [support@pagerduty.com](mailto:support@pagerduty.com) with any comments.
## 5.62 — 19 Aug 2019
**iOS**
- We fixed a few bugs around the app where we'd show you a few things here and there that you possibly weren't allowed to do. Out of sight, out of mind!
- Improved phone number country detection.
Thanks for all the great feedback! We’re always looking for ways to improve the app. Email [support@pagerduty.com](mailto:support@pagerduty.com) with any comments. with any comments. Yee-haw!
**Android**
- Fixed a couple of crashes.
Thanks for all the great feedback! We’re always looking for ways to improve the app. Email [support@pagerduty.com](mailto:support@pagerduty.com) with any comments.
## 5.61 — 12 Aug 2019
**iOS**
- We've improved the app experience for stakeholders even more. _You_ can stay informed! _You_ can stay informed! You _all_ can stay informed!
- We've dialed our security up a notch by cleaning up leftover temporary files containing sensitive information. I also dialed my belt up a notch but I'm not as proud of that.
Thanks for all the great feedback! We’re always looking for ways to improve the app. Email [support@pagerduty.com](mailto:support@pagerduty.com) with any comments.
**Android**
- We fixed a pesky little crash on the Settings screen. We can't tell how it snuck in there. Oh! We have git history... Dang, it was me.
- To tighten up some security, we've disabled taking screenshots of the app. If you would like to enable that functionality and live life on the edge, you can find a toggle in the Settings screen.
Thanks for all the great feedback! We’re always looking for ways to improve the app. Email [support@pagerduty.com](mailto:support@pagerduty.com) with any comments.
## 5.60 — 5 Aug 2019
**iOS**
- We've improved the app experience for stakeholders as part of our new Business Response workflows. This helps everyone at your company stay informed wherever they are.
Thanks for all the great feedback! We’re always looking for ways to improve the app. Email [support@pagerduty.com](mailto:support@pagerduty.com) with any comments.
**Android**
- We've improved the app experience for stakeholders as part of our new Business Response workflows. This helps everyone at your company stay informed wherever they are.
Thanks for all the great feedback! We’re always looking for ways to improve the app. Email [support@pagerduty.com](mailto:support@pagerduty.com) with any comments.
## 5.59 — 29 Jul 2019
**iOS**
- Automatically share status updates with those who need to know by associating status updates with business services.
- Add stakeholders and teams as subscribers to updates so they are notified in real-time.
Thanks for all the great feedback! We’re always looking for ways to improve the app. Email [support@pagerduty.com](mailto:support@pagerduty.com) with any comments.
**Android**
- Automatically share status updates with those who need to know by associating status updates with business services.
- Add stakeholders and teams as subscribers to updates so they are notified in real-time.
Thanks for all the great feedback! We’re always looking for ways to improve the app. Email [support@pagerduty.com](mailto:support@pagerduty.com) with any comments.
## 5.58 — 22 Jul 2019
**iOS**
- We got down to business and defeated a layout issue on the Open Incidents screen.
Thanks for all the great feedback! We’re always looking for ways to improve the app. Email [support@pagerduty.com](mailto:support@pagerduty.com) with any comments.
**Android**
- We got down to business and defeated this bug that would report timeline entries from web when it came via mobile.
Thanks for all the great feedback! We’re always looking for ways to improve the app. Email [support@pagerduty.com](mailto:support@pagerduty.com) with any comments.
## 5.57 — 15 Jul 2019
**iOS**
- We found some reports of a couple of crashes and took care of them, just for you.
- Remember when we told you we fixed an issue where you'd tap a push notification for an incident and it wouldn't take you to that incident? We fixed it for real this time. Promise.
- Did we mention that we now support multitasking on iPad? This isn't new for 5.57, but we're still excited about it!
Thanks for all the great feedback! We’re always looking for ways to improve the app. Email [support@pagerduty.com](mailto:support@pagerduty.com) with any comments.
**Android**
- Doing some behind the scenes work for upcoming functionality. Stay tuned!
Thanks for all the great feedback! We’re always looking for ways to improve the app. Email [support@pagerduty.com](mailto:support@pagerduty.com) with any comments.
## 5.56 — 8 Jul 2019
**iOS**
- Last week, we brought you changes to snooze until a given date (up to a week). This week, we bring _for_ you the ability to snooze FOR (i'll show myself out) a given amount of days/hours (also up to a week).
- iPad support is here! Enjoy a roomy split view or even multitask along with another app. Thanks Spencer for pushing this!
Thanks for all the great feedback! We’re always looking for ways to improve the app. Email [support@pagerduty.com](mailto:support@pagerduty.com) with any comments.
**Android**
- Added configuration warnings to help you understand best practices when configuring your contact methods and notification rules.
Thanks for all the great feedback! We’re always looking for ways to improve the app. Email [support@pagerduty.com](mailto:support@pagerduty.com) with any comments.
## 5.55 — 1 Jul 2019
**iOS**
- You can snooze an incident for longer than 24 hours now (up to a week) by choosing Snooze Until.
- Fixed an issue where you'd tap a push notification for an incident and it wouldn't take you to that incident.
Thanks for all the great feedback! We’re always looking for ways to improve the app. Email [support@pagerduty.com](mailto:support@pagerduty.com) with any comments.
**Android**
- Clarification on warnings about your notification rules.
Thanks for all the great feedback! We’re always looking for ways to improve the app. Email [support@pagerduty.com](mailto:support@pagerduty.com) with any comments.
## 5.54 — 24 Jun 2019
**iOS**
- The decline message from a declined responder request shows in the Timeline in Incident Details. It was missing before so you couldn't see if it was "can't, no Internet" vs. "I'm fine, I just don't want to".
- More work going on behind the scenes for upcoming functionality.
Thanks for all the great feedback! We’re always looking for ways to improve the app. Email [support@pagerduty.com](mailto:support@pagerduty.com) with any comments.
**Android**
- More work going on behind the scenes for upcoming functionality.
Thanks for all the great feedback! We’re always looking for ways to improve the app. Email [support@pagerduty.com](mailto:support@pagerduty.com) with any comments.
## 5.53 — 17 Jun 2019
**iOS**
- Removed the Add Status Update button for read-only users.
Thanks for all the great feedback! We’re always looking for ways to improve the app. Email [support@pagerduty.com](mailto:support@pagerduty.com) with any comments.
**Android**
- Gave a real shot in the arm to the performance of Add Responder for large accounts.
- Added filtering escalation policies by tag to Add Responder.
- Added a Try Now button to the login screen.
- We'll load all your incident log entries now, not just the latest 100.
- Fixed an issue with Do Not Disturb for the OnePlus 6's physical switch.
Thanks for all the great feedback! We’re always looking for ways to improve the app. Email [support@pagerduty.com](mailto:support@pagerduty.com) with any comments.
## 5.52 — 10 Jun 2019
**iOS**
- You can delete an override by tapping the override in the Schedule screen and selecting Delete (thanks Jenny!).
- The Status Updates tab is now hidden for accounts without Modern Incident Response.
- Spiffed up the rainbow logo just in time to celebrate Pride Month here at PagerDuty and worldwide!
- Fixed the empty state for Open Incidents on iOS 11 devices. (No, it wasn't meant to be a piece of abstract art.)
Thanks for all the great feedback! We’re always looking for ways to improve the app. Email [support@pagerduty.com](mailto:support@pagerduty.com) with any comments.
**Android**
- Pressing Back won't exit the app unless you're on a root screen (thanks Abdollah!)
- You can delete an override by tapping the override in the Schedule screen and selecting Delete.
- The Status Updates tab is now hidden for accounts without Modern Incident Response.
- Various bugs and crashes fixed (but I'm out of room).
Thanks for all the great feedback! We’re always looking for ways to improve the app. Email [support@pagerduty.com](mailto:support@pagerduty.com) with any comments.
## 5.51 — 3 Jun 2019
**iOS**
- Now you can filter escalation policies by tag while adding a responder, not just while reassigning.
- Fixed a crash on the incidents list.
- The Toronto Raptors are advancing to the NBA Finals for the first time in franchise history.
Thanks for all the great feedback! We’re always looking for ways to improve the app. Email [support@pagerduty.com](mailto:support@pagerduty.com) with any comments.
**Android**
- An informational banner was added to the Add Status Update screen to let you know how many users and/or teams will be notified, as well as how many business services will be impacted.
- Fixed a crash-on-launch bug for folks with spotty Internet.
Thanks for all the great feedback! We’re always looking for ways to improve the app. Email [support@pagerduty.com](mailto:support@pagerduty.com) with any comments.
## 5.50 — 28 May 2019
**iOS**
- If you're not sure what tags are associated with an escalation policy, you can now see the list of tags associated with an escalation policy
- If you have a tendency to type the wrong key in your password, say no more. Our new intern Jenny has got you covered. Now you can toggle the password visibility if you're not sure if you just typed 'iluvshrek2' or 'iluvshrek3' because believe me, those are two _very_ different opinions.
- When you manually create an incident, the title and description fields will now span multiple lines, so you can see any long messages you might type. Thanks Jenny!
Thanks for all the great feedback! We’re always looking for ways to improve the app. Email [support@pagerduty.com](mailto:support@pagerduty.com) with any comments and/or Pagey fanmail.
**Android**
- If you have a tendency to type the wrong key in your password, say no more. Our new intern, Santhu has got you covered. Now you can toggle the visibility if you're not sure what you typed!
You can now see the list of tags associated with an escalation policy.
Thanks for all the great feedback! We’re always looking for ways to improve the app. Email [support@pagerduty.com](mailto:support@pagerduty.com)with any comments and/or Pagey fanmail.
## 5.49 — 20 May 2019
**iOS**
- If you tap the priority or duration of a disrupted business service in Visibility, it navigates you to that incident.
- We sped up the networking behind adding a responder. Things should be much snappier now when you're browsing and searching the lists of users and escalation policies.
- Fixed an issue where we treated alerts like incidents in the Incident Details. Alerts aren't incidents, and they don't like it when you treat them like incidents.
- Fixed a crash on iPad when you tried to merge incidents.
Thanks for all the great feedback! We’re always looking for ways to improve the app. Email [support@pagerduty.com](mailto:support@pagerduty.com) with any comments and/or Pagey fanmail.
**Android**
- Fixed a bug where tags might not load when reassigning an incident to an escalation policy and filtering them by tag.
Thanks for all the great feedback! We’re always looking for ways to improve the app. Email [support@pagerduty.com](mailto:support@pagerduty.com) with any comments and/or Pagey fanmail.
## 5.48 — 13 May 2019
**iOS**
- Tapping on the author of a status update in Incident Details will take you to their profile.
- When reassigning incidents you can now search for an Escalation Policy by any tags associated with it.
Thanks for all the great feedback! We’re always looking for ways to improve the app. Email [support@pagerduty.com](mailto:support@pagerduty.com) with any comments and/or Pagey fanmail.
**Android**
- When reassigning incidents you can now search for an Escalation Policy by any tags associated with it.
Thanks for all the great feedback! We're always looking for ways to improve the app. Email [support@pagerduty.com](mailto:support@pagerduty.com) with any comments and/or Pagey fanmail.
## 5.47 — 8 May 2019
**iOS**
Spring is here, and baseball is back! What's new in 5.47:
- The assignee now appears at the top of the Responders list in the Incident Details, and you can tap it to head straight to their profile! It's like a 5-4-3 double play on your phone.
- Fixed a bug with overlapping text on the Reassign screen when you had bad Internet connectivity. It was the mobile equivalent of Tampa Bay putting four outfielders up against Justin Smoak – looks strange, and doesn't work either.
Thanks for all the great feedback! We’re always looking for ways to improve the app. Email [support@pagerduty.com](mailto:support@pagerduty.com) with any comments or if you just wanna trash talk the Dodgers.
**Android**
- See incident Status Updates, the subscriber list, and even send out new updates from a new tab on Incident Details. Keep stakeholders informed on the go.
Thanks for all the great feedback! We're always looking for ways to improve the app. Email [support@pagerduty.com](mailto:support@pagerduty.com) with any comments or again, if you just **really** wanna trash talk the Dodgers.
## 5.46.1 — 29 Apr 2019
**iOS**
- Team information is here! Tap Teams and have a look at your teams' schedules, escalation policies, and members. There's no "I" in team, but there is "MEAT"!
- Add users and/or teams as subscribers for Status Updates from the Incident Details Screen. (Requires Modern Incident Response.)
- Fixed "the" bug for Monday-Sunday calendar users; thanks to everyone who reported it! Wednesday-Tuesday calendar functionality is probably broken, but nobody can prove it.
Thanks for all the great feedback! We’re always looking for ways to improve the app. Email [support@pagerduty.com](mailto:support@pagerduty.com) with any comments.
## 5.46 — 29 Apr 2019
**Android**
- Fixed some display issues in My On-Call Shifts to get you what you need to know more quickly.
- Fixed an issue with some OnePlus devices where Override System Volume would not play sounds if the device was muted.
Thanks for all the great feedback! We're always looking for ways to improve the app. Email [support@pagerduty.com](mailto:support@pagerduty.com) with any comments.
## 5.45 — 23 Apr 2019
**iOS**
- Tap a responder on Incident Details to jump to their profile.
- Add a subscriber (user or team) to an incident (requires Modern Incident Response).
- Send subscriber status updates directly from the app. This was in the last release but we wanted to see if anyone would notice first.
- Invite users directly from the app, in the User list. Tap that little "+" button. (Only for Owner and Global Admin roles.)
Thanks for all the great feedback! We’re always looking for ways to improve the app. Email [support@pagerduty.com](mailto:support@pagerduty.com) with any comments.
**Android**
- Bug fixes and performance improvements.
Thanks for all the great feedback! We're always looking for ways to improve the app. Email [support@pagerduty.com](mailto:support@pagerduty.com) with any comments.
## 5.44 — 16 Apr 2019
**iOS**
- Quickly see which users have been added as responders (and their status) in the Incident Details view, along with their avatars, which are probably all grey silhouettes, so maybe I shouldn't advertise that part.
- Squashed some bugs in schedules.
Thanks for all the great feedback! We’re always looking for ways to improve the app. Email [support@pagerduty.com](mailto:support@pagerduty.com) with any comments.
**Android**
- Unacknowledge an incident from the Incident Details screen.
- Custom Actions should be more reliable on Resolved Incidents.
Thanks for all the great feedback! We're always looking for ways to improve the app. Email [support@pagerduty.com](mailto:support@pagerduty.com) with any comments.
## 5.43 — 8 Apr 2019
**iOS**
- Due to a misunderstanding (between myself and the English language) the Apple Watch app was accidentally removed for owners of the original Apple Watch. It's back now, and we're sorry for the inconvenience.
- Fixed a couple crashes WHICH I WILL NOT NAME SO AS TO DEPRIVE THEM OF THE SATISFACTION.
Thanks for all the great feedback! We’re always looking for ways to improve the app and bring back lost functionality. Email [support@pagerduty.com](mailto:support@pagerduty.com) with any comments.
**Android**
- A few tune-ups to our multi-select functionality from the last release.
- Swiping incidents now changes colo(u)r to make you feel like **The Thing Is Going To Happen** when you let go.
Thanks for all the great feedback! We're always looking for ways to improve the app. Email [support@pagerduty.com](mailto:support@pagerduty.com) with any comments.
## 5.42 — 2 Apr 2019
**iOS**
- The redesigned My On-Call Shifts displays your upcoming and always-on-calls in a new easy-to-grok manner. Quickly navigate from an on-call to do an override, view the escalation policy, or the schedule.
- View Status Updates on incidents, along with who's subscribed to the incidents. (Requires Modern Incident Response.)
Thanks for all the great feedback! We’re always looking for ways to improve the app. Email [support@pagerduty.com](mailto:support@pagerduty.com) with any comments.
**Android**
- Multi-select is here! Long-press an incident to start multi-selecting. From there, ack, resolve, snooze, or merge some incidents.
- Fixed a couple crashes here and there.
Thanks for all the great feedback! We're always looking for ways to improve the app. Email [support@pagerduty.com](mailto:support@pagerduty.com) with any comments.
## 5.41 — 25 Mar 2019
**iOS**
- If you have more than 100 log entries in the Timeline of an incident, we'll load 'em all. We won't even stop to think about it.
Thanks for all the great feedback! We’re always looking for ways to improve the app. Email [support@pagerduty.com](mailto:support@pagerduty.com) with any comments.
**Android**
- We've revamped the "On-call Timeline" so much so that it's now called “My On-Call Shifts!” We've brought visual as well as usability updates that are in line with your feedback!
- We've introduced the ability to customize how swiping works on Android. Go to "Settings"=>"Swipe Actions" to see how.
Thanks for all the great feedback! We're always looking for ways to improve the app. Email [support@pagerduty.com](mailto:support@pagerduty.com) with any comments.
## 5.40 — 18 Mar 2019
**iOS**
No bugs in this kitchen but we have some improvements cooking. Thanks for reading our release notes! Here's a grilled cheese recipe from one of our own.
Ingredients
- Two pieces of bread
- American cheese
- Butter
Directions
1. Turn on stove to medium (DON'T burn yourself)
2. Butter the pan (it's a CHEAT meal)
3. Place both slices of bread ON pan until brown
4. Flip one piece over (you don't need to go to COLLEGE for this)
5. Place 1-2 slices of cheese on that piece
6. Put other piece of bread on top
7. Press down and cook until cheese is melted and that umami flavor comes out
8. Enjoy a trip to Flavortown
Thanks for all the great feedback and ADMISSIONS of appreciation! We’re always looking for ways to improve the app. Email [support@pagerduty.com](mailto:support@pagerduty.com) with any comments.
**Android**
Chandler the Product Manager: I need you to freshen up the app.
Me: Say no more fam
Thanks for all the great feedback! We're always looking for ways to improve the app. Email [support@pagerduty.com](mailto:support@pagerduty.com) with any comments.
## 5.39 — 11 Mar 2019
**iOS**
- We fixed a bug with Single Sign-On, especially if you're not launching it from Safari. Try again!
- We brought back the Tip of the Day on the Open Incidents screen so we can get ready to highlight some upcoming new functionality.
- Fixed an issue where embedded charts with really, uhhh, non-conformant URLs would not render.
- Restricted Access users should no longer see "Access Denied" warnings when viewing incidents. Unless you don't have an account anymore, in which case your access will still be denied. We can't fix that for you.
Thanks for all the great feedback! We’re always looking for ways to improve the app. Email [support@pagerduty.com](mailto:support@pagerduty.com) with any comments.
## 5.38 — 6 Mar 2019
**iOS**
- We spiffed up the incident list to make it more modern. When I say "we", I mean Spencer the intern. Say thanks to Spencer when you see him!
Thanks for all the great feedback! We’re always looking for ways to improve the app. Email [support@pagerduty.com](mailto:support@pagerduty.com) with any comments.
**Android**
- "On-Call Timeline" is now called "My On-Call Shifts". Changes are coming!
- We reclaimed some empty space on Resolved Incidents if you aren't on any teams.
Thanks for all the great feedback! We’re always looking for ways to improve the app. Email [support@pagerduty.com](mailto:support@pagerduty.com) with any comments.
## 5.37 — 25 Feb 2019
**iOS**
- Improvements to the SSO process to make it more seamless.
Thanks for all the great feedback! We’re always looking for ways to improve the app. Email [support@pagerduty.com](mailto:support@pagerduty.com) with any comments.
**Android**
- Bug fixes
Thanks for all the great feedback! We’re always looking for ways to improve the app. Email [support@pagerduty.com](mailto:support@pagerduty.com) with any comments.
## 5.36 — 21 Feb 2019
**iOS**
- We just added the feature every parent of triplets wishes they had – Bulk Snooze. Select multiple incidents by long-pressing an incident in the Open Incidents screen and then snooze 'em. How long is up to you, but you'd better have ants on a log ready when they wake up.
- We fixed the menu in the top-right of Open Incidents to show the Select Incidents option at the right times. We suspect this might be why few people ever found it.
- We found a few more "Incident not found" stragglers and rounded 'em up.
Thanks for all the great feedback! We’re always looking for ways to improve the app. Email [support@pagerduty.com](mailto:support@pagerduty.com) with any comments.
**Android**
- Bug fixes but no performance improvements this time around.
Thanks for all the great feedback! We’re always looking for ways to improve the app. Email [support@pagerduty.com](mailto:support@pagerduty.com) with any comments.
## 5.35 — 15 Feb 2019
**iOS**
- Version 5.35 is a special release just for you, **Edmund**! We've fixed the app icon so the top of the "p" and the top of the base of the "d" are properly aligned. (Once you pointed it out, we couldn't un-see it!)
Also, we're not gonna lie, bug fixes and performance improvements.
Thanks for all the great icon feedback! We’re always looking for ways to improve the app icon. Email [support@pagerduty.com](mailto:support@pagerduty.com) with any icon comments.
**Android**
- We did a facelift on the empty incidents list. We hope you like it!
Thanks for all the great feedback! We’re always looking for ways to improve the app. Email [support@pagerduty.com](mailto:support@pagerduty.com) with comments.
## 5.34 — 1 Feb 2019
**iOS**
- The old set of tips that used to show when you have no incidents have been excised, and in its place a positive message has appeared.
- If you've ever tapped a push notification for an incident assigned to you and gotten "Incident not found", well, we've found those incidents. You won't see that anymore.
- Incidents you've acknowledged can now be unacknowledged in Incident Details, just like on the web.
- Your avatar in the menu is now round, just like your head.
Thanks for all the great feedback! We’re always looking for ways to improve the app. Email [support@pagerduty.com](mailto:support@pagerduty.com) with any comments.
**Android**
- Fixed some small crashes.
- Put up some scaffolding for some major renovations.
Thanks for all the great feedback! We’re always looking for ways to improve the app. Email [support@pagerduty.com](mailto:support@pagerduty.com) with comments.
## 5.33 — 31 Jan 2019
**iOS**
- We've fixed a variety of issues related to Single Sign-On as well as better operation with Google Smart Lock. Should be smooth sailing from here on out.
- More indication of loading progress with our patented three-hundred-sixty-degree spinner technology.
- Thank you Jean from Schenectady who suggested we add "All Star" by Smash Mouth as a ringtone. Unfortunately we were not able to work out a licensing deal with Interscope, but we'll keep trying.
Thanks for all the great feedback! We’re always looking for ways to improve the app. Email [support@pagerduty.com](mailto:support@pagerduty.com) with any comments.
**Android**
- Users on Android 8.0+ can now choose PagerDuty ringtones directly in the System Settings. We will now link you to these settings from within our app.
- Fixed an occasional crash when visiting Schedules
- Added search to Schedules!
Thanks for all the great feedback! We’re always looking for ways to improve the app. Email [support@pagerduty.com](mailto:support@pagerduty.com) with comments.
## 5.32 — 25 Jan 2019
**iOS**
- We sped up the Resolved Incidents list for most accounts. If you aren’t getting a speed boost, don’t feel bad… we didn’t single you out! It’s just that you already had the faster behavior.
- We replaced hyphens with en dashes (the em dash’s lesser-known partner) for ranges of things. If you’re a typography nerd or just someone of the most refined culture (adjusts bowtie) this is for you! Say thanks to Spencer when you see him.
Thanks for all the great feedback! We’re always looking for ways to improve the app. Email [support@pagerduty.com](mailto:support@pagerduty.com) with any comments.
**Android**
- A few tweaks and pokes to keep things running in tip-top shape.
Thanks for all the great feedback! We’re always looking for ways to improve the app. Email [support@pagerduty.com](mailto:support@pagerduty.com) with comments.
## 5.31 — 16 Jan 2019
**iOS**
- Another big revamp ("revamp" is an industry term meaning "reapply a vampire to") for the User screen. Now it reliably shows the user's on-call shifts for the next 14 days (in order!), instead of only the next shift per schedule. This is a big help for everyone, and the nocturnal in particular.
- "On-Call Timeline" is now called "My On-Call Shifts", and there's a link to it in the User screen. Sorry, a button, not a link. It's all the same to your finger.
Thanks for all the great feedback! We’re always looking for ways to improve the app. Email [support@pagerduty.com](mailto:support@pagerduty.com) with any comments.
**Android**
A few tweaks and pokes to keep things running in tip-top shape.
Thanks for all the great feedback! We’re always looking for ways to improve the app. Email [support@pagerduty.com](mailto:support@pagerduty.com) with comments.
## 5.30 — 9 Jan 2019
**iOS**
It's the first release of 2019! You probably knew that because we were all ready for 2018 to end. We're going to be releasing more frequent and smaller updates this year.
- If you're a Team Responder (Legacy) on a team, and you're added as a responder for an incident from another team, you'll have the ability to Accept or Decline. It's funny because "Accept Decline" was my motto for 2018.
- We replaced all of our app icons. Normally I wouldn't tell you this but I want you to know there were a lot of sizes. A lot.
Thanks for all the great feedback! We’re always looking for ways to improve the app. Email [support@pagerduty.com](mailto:support@pagerduty.com) with any comments.
**Android**
- Added good constraints and removed bad constraints on creating on-call overrides. Much better confirmation dialogs.
- If you're a Team Responder (Legacy) on a team, and you're added as a responder for an incident from another team, you'll have the ability to Accept or Decline.
Thanks for all the great feedback! We’re always looking for ways to improve the app. Email [support@pagerduty.com](mailto:support@pagerduty.com) with comments.
## 5.29 — 12 Dec 2018
**iOS**
We're so excited by the response to the new Schedules feature, and we've heard your feedback and made some changes there and elsewhere:
- Cleared up the confirmation message for overrides when you're overriding yourself (hey, no shame in it), or overriding past the end of a shift into the next shift.
- Manually created incidents show who created them in the Timeline.
- In the User screen, no more anxiety-inducing warnings about notification rules and contact methods while the data is loading. The anxiety induction is now saved for after the data is loaded!
- Fixed the error banners that could appear when viewing an incident for a deleted service. (TIL you can delete a service! This product is full of delightful wonders.)
Thanks for all the great feedback! We’re always looking for ways to improve the app. Email [support@pagerduty.com](mailto:support@pagerduty.com) with any comments.
**Android**
- Fixed a bug where Test Notifications sent from our website were silent on the device, or played the low-urgency sound. I think we are all agreed on the meaning of "Test Notification" now.
- Cleared up the confirmation message for overrides when you're overriding yourself (hey, no shame in it), or overriding past the end of a shift into the next shift.
Thanks for all the great feedback! We’re always looking for ways to improve the app. Email [support@pagerduty.com](mailto:support@pagerduty.com) with any comments.
## 5.28 — 14 Nov 2018:
**iOS**
Schedules have been completely revamped! Quickly see who's on call for your team's (or any) schedules. Flip through the past to see who was on call, or head to the future to see who's going to be on call later. You can even book an override while you're there.
A similar list is also available in the user screen. Tap an on call there to immediately jump to that schedule at that time.
Thanks for all the great feedback! We’re always looking for ways to improve the app. Email [support@pagerduty.com](mailto:support@pagerduty.com) with any comments.
**Android**
Schedules have been completely revamped! Quickly see who's on call for any schedule. Flip through the past or future to see who was or will be on call, and even book an override in one place.
Push notifications are no longer treated as alarms.
Low-urgency notifications respect your in-app settings.
Non-incident notifications (on call handoffs, etc.) are no longer low-urgency.
Our apologies for the difficulties!
Thanks for all the great feedback! Email [support@pagerduty.com](mailto:support@pagerduty.com) with any comments.
## 5.26 — 03 Oct 2018
**iOS**
Our support for iOS 10 is being deprecated. As such, this is the last release devices on iOS 10 and below will receive. Rest assured, this release of the app will continue working for you should you remain on iOS 10.
For security reasons, this is also the last release for which we will allow insecure (plain HTTP) resource downloads (e.g. embedded images in incidents). To ensure your resources continue to appear in incidents, ensure you reference them by HTTPS.
What's New in Version 5.26:
- Fixed the display of incidents created through the Jira integration.
- Fixed the infamous bug (in certain circles, e.g. everyone who comes up to me and points it out) where you'd foreground the app and see "Request timed out".
- If you are the assignee and a coordinated responder for an incident, you now see ACK instead of ACCEPT.
- Fixed a strange bug where sections of the On-call Timeline would disappear after a few seconds.
- The search bar when assigning an override to a user is no longer teeny-tiny and is now the average size among its peers.
- Fixed a bug where you might look at a user to see their schedules and get an infinite "Loading..." message.
**Android**
What's New in Version 5.26:
- Fixed the display of incidents created through the Jira integration.
- If you are the assignee and a coordinated responder for an incident, you now see ACK instead of ACCEPT.
- Miscellaneous other crashes and bugfixes.
## 5.25 — 12 Sep 2018
**iOS**
Introducing the new PagerDuty Visibility dashboard! See the operational status of your business services anytime, anywhere. When problems arise, see live performance indicators that quantify the real-time impact of incidents on customers and on the business. Available for Enterprise accounts and those with the PagerDuty Visibility add-on.
As well, we've taken care of the following:
- Merge multiple open incidents together by selecting them (long-press the first incident or choose Select Incidents), pick 'em all, then Change, then Merge.
- Fixed a funky iPhone X bug where the incident action buttons would appear in the unsafe area. You're safe now.
- Fixed a crash here and there, applied another coat of wax.
**Android**
Introducing the new PagerDuty Visibility dashboard! See the operational status of your business services anytime, anywhere. When problems arise, see live performance indicators that quantify the real-time impact of incidents on customers and on the business. Available for Enterprise accounts and those with the PagerDuty Visibility add-on.
## 5.24 — 22 Aug 2018
**iOS**
- Phone numbers, URLs, and email addresses are now tappable in the expanded status updates screen for events in the Incident Timeline, just like in the summary.
- Fixed a crash on the login screen.
**Android**
- Addressed various crashes and odd behaviors.
## 5.23 — 01 Aug 2018
**iOS**
- (Improvement) Replace “0” or “1” with “False” or “True” for custom incident properties
- (Bug) Fixed an issue where the app would crash when you tried to Resolve All incidents while `Live Updating` was enabled
**Android**
- (Bug) Fixed an Oreo issue where the notification sound wouldn’t end when you tapped the notification
- (Bug) Fixed a bug where the notification sound would play even when you didn’t give our app priority in Do Not Disturb
- (Bug) Fixed a problem where some Android phones were unable to login to the app
## 5.22 — 07 July 2018
**iOS**
What's New in Version 5.22, with handy Release Notes Translation Guide:
- Bug fixes => I fixed more bugs than I caused. Probably.
- Performance improvements => no code changes but I think the new Swift compiler will speed things up.
- Lots of work behind the scenes => ... on a different project.
- Addressed some crashes => we wrote them up in JIRA.
- Visual improvements => I moved some plants around in my work area.
- Fixed a crash in Open Incidents while Live Updating is enabled => we actually fixed this.
**Android**
What’s New in Version 5.22:
- Lots of work going on behind the scenes for new features. Stay tuned!
## 5.21 — 20 Jun 2018
**iOS**
What's New in Version 5.21:
- Support for Universal Links! Links to incidents, escalation policies, and users that you tap from Safari, Mail, and Messages will now open in the PagerDuty app.\*\*
- Improved navigation for VoiceOver users in some screens for improved accessibility.
- Fixed a crash when swiping an incident to Snooze, Acknowledge, or Resolve (under very specific conditions).
- Lots and lots of work going on under the hood for a new feature that'll make your on-call life easier.
\*\* Despite the optimistic name, Universal Links are currently only supported on Earth.
**Android**
What’s New in Version 5.21:
- Fixed a crash and some bugs.
## 5.20 — 30 May 2018
**iOS**
This special Moana Soundtrack Edition of the release notes for version 5.20 are brought to you courtesy of Lin-Manuel Miranda, Repeat All, and I guess my boss, who doesn't review these before I submit them anymore. She doesn't realize HOW FAR I'LL GO.
- Introducing enhanced incident-wrangling abilities with Priority! (Only available to users on Basic and above pricing plans.)
- Create, edit and sort Incidents by Priority.
- Incident Priority now displays in push notifications.
- Incident Details enhancements now include one-click URLs and phone numbers!
- Users and decapods (look it up!) in the Observer role now have a "Mine" tab in Open Incidents. We're always trying to bring the most relevant information to WHERE YOU ARE.
- Lots of behind-the-scenes work going on for a SHINY new feature coming later this year. Early-access testers, you KNOW WHO YOU ARE!
- We've stripped down the size of the app for this update. What can we say except YOU'RE WELCOME?
- Some smaller bugs are fixed too, for smoother sailing. WE KNOW THE WAY to find 'em and squash 'em!
Thanks for all the great feedback! We’re always looking for ways to improve the app to be THE ROCK you rely on.
**Android**
What’s New in Version 5.20:
Priority! Create, edit and sort incidents by Priority on Basic (and above) pricing accounts.
Users in the Observer role now have a Mine tab on Open Incidents.
Fixed a bug that wasn't putting your device back into Do Not Disturb mode after overriding volume.
Sped up the Service selection for creating a new incident.
## 5.19 — 09 May 2018
**iOS**
We crunched a lot of bugs this time around. Our shoes are a mess. Think of this like "PagerDuty Service Pack 1". What’s New in Version 5.19:
- 1Password integration! Forget all of your PagerDuty passwords with confidence!
- We sped up the schedule list and service selection. What will you do with all the extra time?
- Fixed a bug where you search for a service and pick one and it enters a different one. This happened just often enough to make you think you were going crazy but not often enough to be reported.
- The On-Call Selfie button has been removed. We still want to see your on-call selfies, just... y'know... from someone else's app.
- Fixed a bug when you search for a user and pick them and then you're still picking a user and you're like what even?
- Fixed a bug where the priority labels disappeared while multi-selecting incidents.
- Fixed a bug where (seriously) you turn your phone upside down and then right-side up and then the Open Incidents is empty. You can imagine how hard this was to diagnose.
- Lots of work under the hood for upcoming features. IT'S UNDER THE HOOD! Please stop peeking under the hood.
Thanks for all the great feedback! We’re always looking for ways to improve the app. Email [support@pagerduty.com](mailto:support@pagerduty.com) with any comments. We won't bug you while you're using the app to give us a rating, but since you're here, in the App Store, giving this a read, we'd appreciate your rating!
Today's rejected app suggestion comes from Jared in Tulsa, OK: "plz add a cat hairball ringtone". Thanks for your suggestion, Jared, but my cat has enough hairballs that this wouldn't even wake me up.
**Android**
What’s New in Version 5.19:
- Lots and lots of fixes to bugs reported by our users.
- Serious performance improvements!
- Lots of work under the hood for upcoming features.
## 5.18 — 18 Apr 2018
**iOS**
Spring is in the air (several states and provinces excluded), and baseball is back! What could make life better, but a new PagerDuty release? What’s New in Version 5.18:
- Added a Force Touch shortcut to the app to create a new incident. Push hard on the icon (but not too hard, just kinda hard, like you're popping bubble wrap) to initiate.
- Fixed a couple small issues relating to scrolling and Live Updating. Honestly, the details would bore you.
- Setting "Mute Sound" on low-urgency notifications (available on eligible plans – contact [sales@pagerduty.com](mailto:sales@pagerduty.com) to upgrade your plan) actually mutes the sound when the app is in the background. Since the PagerDuty app is usually in the background, this is great news. If your PagerDuty app is usually in the foreground, we're flattered.
- Users on plans without separate high- and low-urgency notification rules can now see their notification rules and add or delete them in the app!
- Fixed an issue displaying an empty space for the priority on incidents when some had priorities and some didn't (available on eligible plans).
**Android**
What’s New in Version 5.18:
- Fixed some crashes.
- Log entries for reassigning incidents now show who reassigned it.
- Various other tweaks 'n' stuff.
## 5.17 — 28 Mar 2018
**iOS**
What’s New in Version 5.17:
- Some things are just better live: music, the musical Grease, sports (not baseball or curling)... and now PagerDuty! The Open Incidents list and Incident Details refresh themselves with space-age Live Updating technology. No more pulling to refresh! (Very minimal data is used, and you can turn off Live Updating in the Settings screen.)
- Phone numbers and URLs in responder requests and notes in the incident timeline are now tappable (and long-pressable for more options).
- Fixed a bug when searching Schedules where you couldn't pick a schedule. This is gonna do wonders for Schedules' sense of self-worth.
**Android**
What’s New in Version 5.17:
Some things are just better live: music, the musical Grease, sports (not baseball or curling)... and now PagerDuty! The Open Incidents list and Incident Details refresh themselves with space-age Live Updating technology. No more pulling to refresh! (Very minimal data is used, and you can turn off Live Updating in the Settings screen.)
## 5.16 — 07 Mar 2018
**iOS**
What’s New in Version 5.16:
My project manager: "So what do we announce for this new release?"
Me: "Uh, well, nothing in particular, we did a lot of cleaning up."
My project manager: "Sure, I get that, but what did you DO for the past three weeks?"
Me: "Would you accept 'bug fixes and performance improvements'?"
My project manager: "NO"
Me: "Okay, I promise I won't put that."
**Android**
What’s New in Version 5.16:
- Bug fixes and improvements
## 5.15 — 02 Feb 2018
**iOS**
What’s New in Version 5.15:
- Low-urgency notification rules are now separated from high-urgency notification rules! You can edit your low-urgency rules in your profile, located in the side menu. (Low-urgency rules not available on Lite packages.)
- As we mentioned in our last release notes, iOS 9 is now deprecated. If you can read this, you must have upgraded!
- Fixed a bug where there were two buttons with identical functionality in the Search bar. We've consolidated down to one to avoid any confusion between the two. This is a 50% reduction in buttons and the savings will be reflected in the price of our app in the App Store.
- We chopped out some extra padding here and there, which is the opposite of what you should do if you play hockey or football.
**Android**
What’s New in Version 5.15:
- Native login is finally here! Login directly through the app, not through a web page in the app. Compatible with most password managers. (No offense to the web, you've been great. You really have.)
- Low-urgency notification rules are now separated from high-urgency notification rules! You can edit your low-urgency rules in your profile, located in the side menu. (Low-urgency rules not available on Lite packages.)
## 5.14 — 24 Jan 2018
**iOS**
This will be the last release supporting iOS 9. If you're a steadfast iOS 9 user, that's okay, this version of the app will continue working for you for a long time still, but no further updates will be delivered to your device. This means we can more easily support newer iOS features.
What's New in Version 5.14:
- Improvement to the SSO login screen. It's now more clear that you're entering the subdomain, and we supply the domain. We're cool like that.
- Clarification about the length allowed for a responder message. If your message was going to be truncated for SMS, you'd want to know, right? We would.
**Android**
What's new in 5.14:
- Incidents with conference bridges now show the number more prominently, and dial the number in-app so that the extension works. You will be asked for dialing permission the first time you use this.
- Clarification about the length allowed for a custom responder message.
- Some UI polish.
## 5.13 — 03 Jan 2018
**iOS**
What's New in Version 5.13:
- Select multiple incidents by long-pressing an incident in the Open Incidents list, or through the "..." menu, then acknowledge or resolve them. I'm not going to tell you what to do but the long press is way more satisfying.
**Android**
What's New in Version 5.13:
- Fixed a bug where when a user receives status update link via SMS, clicking that link redirects them to a blank page within the PD app instead of the status page of the incident.
---
URL: https://docs.pagerduty.com/get-started/mobile-status-dashboard
# Mobile Status Dashboard
View business service operational status and impacting incident details from the PagerDuty mobile app's status dashboard.
The Mobile Status Dashboard gives stakeholders an overview of top-level business services' operational status and detailed information about service-impacting incidents. The Mobile Status Dashboard enhances transparency and communication within organizations by keeping stakeholders informed about the status and impact of incidents, ultimately aiding in quicker incident resolution and better service management.
> **Availability:** The status dashboard feature is available with PD Reliability Platform plans. It's also available with the following pricing plans: Business, Digital Operations (legacy) and Enterprise for Incident Management. Please contact our [Sales Team](https://www.pagerduty.com/contact-sales/) if you would like to upgrade to a plan including the status dashboard feature.
## View Mobile Status Dashboard
To view the status dashboard in the mobile app, navigate to **More** and select **Status Dashboard**. The main screen will present the top-level [business services](/incident-management/services/business-services) in your PagerDuty account.
You can view other Status Dashboards in your account by tapping in the top-right and selecting another dashboard.

*Select a different status dashboard*
> **Edit the Status Dashboard:** If you would like to make changes to your status dashboard (e.g., modify business service dependencies and subscriptions), you can make these changes in the web app. Please read [Status Dashboard](/incident-management/communicate/internal-status-page) for more information.
### All Business Services Operational
When there are no incidents with priority open on any supporting technical services, the business status summary will show **All business services operational**. You will see a green banner at the top of the screen and a green suitcase icon next to each business service.

#### Incident Without Priority
It is possible for a business service to have an incident on a supporting technical service, which does not affect the status dashboard. This happens when the incident does not have a [priority](/incident-management/incidents/incident-priority). While the status dashboard will still display as operational, you can see more information about the affected technical service on the business service’s details screen.

*Incident without priority*
Tap the technical service’s **name** to see more information about the service. You can also tap **View [X] Impacting Incidents** to view a list of incidents. Select an incident from the list to navigate to its details screen.

*Technical service details*
### Disrupted Business Service
When a business service is disrupted, a red banner will display at the top of the screen and the business service will display the impacting incident’s priority. If multiple incidents impact the same business service, the highest priority will be displayed next to the business service. If multiple business services are impacted, they will be ordered by the highest priority.

*Disrupted business service*
Select a disrupted business service to view details about the disrupted technical service, or tap **View [X] Impacting Incidents** to see a list of impacting incidents.

*Disrupted technical service*
## Home Screen Status Dashboard
A condensed view of the Mobile Status Dashboard is also available on the [Mobile Home Screen](/get-started/mobile-app/mobile-home-screen). Please read [Home Screen Status Dashboard](/get-started/mobile-status-dashboard/home-screen-status-dashboard) for more information.
---
URL: https://docs.pagerduty.com/get-started/mobile-status-dashboard/home-screen-status-dashboard
# Home Screen Status Dashboard
Monitor business services' status directly from your home screen
## View Status Dashboard on the Home Screen
Users can view [Internal Status Pages](/incident-management/communicate/internal-status-page) in a widget on the [Mobile Home Screen](/get-started/mobile-app/mobile-home-screen). The widget displays up to three impacted [business services](/incident-management/services/business-services). Tap a business service's name to view more details. If there are more than three disrupted services, tap **View [X] Disrupted Services** to navigate to the [Mobile Status Dashboard](/get-started/mobile-status-dashboard), where you can view the complete list of disrupted services.

*View all disrupted business services*
When there is no disruption, the status dashboard widget displays the message **All business services operational**, with the option to view the Status Dashboard.

> **Configure Business Services:** You'll need to configure business services before the Status Dashboard widget will display any information. If you have not yet set up business services, you'll see a message **Business Services are not configured**.
>
> Please read [Business Services](/incident-management/services/business-services) for more information about configuring business services.
### Change the Default Status Dashboard
The home screen's Status Dashboard widget displays the **Business Status Summary** dashboard by default. You can change which dashboard the widget displays by selecting a different dashboard in the mobile app. Please read [View Mobile Status Dashboard](/get-started/mobile-status-dashboard#view-mobile-status-dashboard) for more information.
### Subscribe to a Business Service
Tap **Subscribe** next to a business service to receive a notification for future [status updates](/incident-management/communicate/communicate-with-stakeholders#status-updates).

*Subscribe to an impacted business service*
## Remove Status Dashboard from the Home Screen
You can remove the status dashboard the home screen:
**iOS**
1. Navigate to **Home** → **Edit**.
2. Tap next to **Status Dashboard**.
3. Tap **Save**.
**Android**
1. Navigate to **Home** and tap .
2. Tap next to **Status Dashboard**.
3. Tap **Save**.
---
URL: https://docs.pagerduty.com/get-started/navigate-incidents-page
# Navigate the Incidents Page
A walkthrough of the features on the PagerDuty Incidents page
The Incidents page is the main screen that appears when you first log in to your PagerDuty account. You can navigate to this page from other screens by clicking **Incidents** in the menu.

*The Incidents page*
## Incidents on All Teams
The top of the dashboard shows any open incidents currently active in the account. **Your open incidents** shows triggered and acknowledged incidents assigned to you. **All open incidents** shows all triggered or acknowledged incidents in the account. Triggered incident counts appear in red, acknowledged incident counts appear in orange, and counts with no open incidents appear in blue.

*Incidents on all Teams*
Below this module, you can view and act on incidents assigned to you or across the account:
- To view incidents assigned to you, click **Assigned to me**.
- To view all incidents in PagerDuty, click **All**.
- To filter incidents by status, select **Open**, **Triggered**, **Acknowledged**, **Resolved**, or **Any Status**.
- To take action on an incident, select the **checkbox** to the left of the incident, then click **Acknowledge**, **Reassign**, **Resolve**, **Snooze**, or **Merge Incidents**.
## High and Low Urgency Incidents
You can configure [Notification Urgency](/incident-management/services/configurable-service-settings#notification-urgency) to notify you based on your [notification rules](/account-admin/user-profile/notification-rules).
In the PagerDuty incident dashboard, incident urgency is indicated in the **Urgency** column. High-urgency incidents appear at the top, followed by low-urgency incidents.

*High and low-urgency incidents*
Incidents maintain this urgency-based order even after acknowledgment — the high-urgency incident remains at the top of the table, followed by the low-urgency incident.

*Acknowledged incidents*
## Activity Over the Last 7 Days
The **Activity over last 7 days** section shows all incidents within the last week. Click an incident **Title** to view the incident details and incident log. Click a **service name** to access the service directly. Click a **user's name** to view their user profile.

*Activity over last 7 days*
## On-Call Widgets
- The **[My On-Call Shifts](/incident-management/schedules/my-on-call-shifts#my-on-call-shifts-widget)** widget displays shifts you are currently on call for with dates and times, a list of escalation policies you are on call for, and upcoming shifts with dates and times.
- The **On Call Now** widget displays specific escalation policies and which users are on call at each escalation level.

*On-call widgets*
--- URL: https://docs.pagerduty.com/get-started/pagerduty-outage-notifications # PagerDuty Outage Notifications Receive notifications if there is an outage with PagerDuty's services ## PagerDuty Status Page If there is a disruption to PagerDuty, we will notify customers on our company status page at [status.pagerduty.com](https://status.pagerduty.com). During an outage, our status page will host the most up-to-date information about incidents and affected product areas. You can [subscribe to our status page](#subscribe-to-the-pagerduty-status-page) to receive email, Slack, or webhook notifications. Subscribing to our status page will allow you to receive notifications when: - PagerDuty posts outage incidents and updates, and/or - PagerDuty publishes a postmortem analysis of an outage > **Looking for our Status Page Products?:** This article describes the PagerDuty company status page at [status.pagerduty.com](https://status.pagerduty.com), where we communicate about PagerDuty outages. If you are looking for more information about creating your own status page using our [Status Pages](/incident-management/communicate/status-pages-overview) products, please read [External Status Page](/incident-management/communicate/external-status-page) or [Internal Status Page](/incident-management/communicate/internal-status-page). ### Subscribe to the PagerDuty Status Page 1. In your browser’s address bar, go to [https://status.pagerduty.com](https://status.pagerduty.com). 2. Click **Subscribe to Updates** on the right. 3. Select your preferred notification method tab: **Email**, **Slack** or **Webhook**. 4. Enter the required information as prompted and click **Subscribe**.  *Subscribe via email* ## PagerDuty Status Page Service Descriptions During a PagerDuty outage, you will see affected services on our [status page](https://status.pagerduty.com). Review the descriptions below for more information about which technologies fall into each category. > **Service Regions:** PagerDuty accounts fall under one of two [service regions](/get-started/service-regions): the US service region and EU service region. Most Business Services on the PagerDuty Status Page have both an US and EU version, signified by **(US)** and **(EU)** respectively. These distinctions refer to the service region of the PagerDuty account as a whole, and not to individual users. For example, it is possible for users in the EU to be on a US service region account, and vice versa. | Service | Description | | --- | --- | | **Events API** | A disruption affecting the Events API [v2](/developer/api/reference/events-v2/send-change-event/create-change-event) or [v1](/developer/api/reference/events-v1/send-event/create-v1-event). | | **REST API** | A disruption affecting the [REST API v2](/developer/rest-api-overview) that is not limited in scope. | | **Web Application** | A disruption affecting the frontend web UI that is not limited in scope. | | **Webhooks** | A disruption affecting PagerDuty's ability to send [outbound webhooks](/integrations/webhooks). | | **Mobile Application** | A disruption affecting the [mobile application](/get-started/mobile-app) that is not limited in scope. | | **Integrations** | - A disruption affecting a specific integration. This includes:
- [Jira Cloud](/integrations/jira-cloud)
- [Jira Server](/integrations/jira-server)
- [Microsoft Teams](/integrations/microsoft-teams)
- [Slack](/integrations/slack-integration-guide)
- [Incoming Email (our Email Integration)](/integrations/email-integration-guide)
- [Zendesk](/integrations/zendesk-integration-guide)
- If there is a disruption affecting another integration specifically, it will be listed under **Other Integrations**. | | **Incident Timeline and Alert Logs** | A disruption affecting the timeline and logs for [incidents](/incident-management/incidents/overview#incident-timeline) and [alerts](/incident-management/incidents/alerts#view-alerts-in-the-web-app). | | **Services** | A disruption affecting our [Service Directory](/incident-management/services/service-directory) and/or [Service Profile](/incident-management/services/service-profile). | | **Schedules and Escalation Policies** | A disruption affecting [schedules](/incident-management/schedules/schedule-basics) and/or [escalation policies](/incident-management/schedules/escalation-policies). | | **Users and Teams** | A disruption affecting [users](/account-admin/manage-users) and/or [Teams](/account-admin/teams). | | **Change Events** | A disruption affecting [change events](/ai-automation/aiops/recent-changes). | | **Business Services** | A disruption affecting [Business Services](/incident-management/services/business-services). | | **Log In and SSO** | A disruption affecting users' ability to log in, or use or configure [Single Sign-On](/account-admin/sso). | | **Account Settings** | A disruption affecting the ability to update [account settings](/account-admin/account-settings). | | **Live Call Routing** | A disruption affecting [Live Call Routing](/integrations/live-call-routing). | | **Status Page** | - **Internal Status Page**: A disruption affecting the [Internal Status Page](/incident-management/communicate/internal-status-page) product.
- **External Status Page**: A disruption affecting the [External Status Page](/incident-management/communicate/external-status-page) product. | | **Notification Delivery** | - **Notification Delivery**: A disruption affecting general notification delivery, not limited to a specific delivery channel.
- **SMS**: A disruption affecting SMS notification delivery.
- **Voice**: A disruption affecting Voice notification delivery.
- **Email**: A disruption affecting Email notification delivery.
- **Push**: A disruption affecting Push notification delivery.
- **Responder Requests**: A disruption affecting general notification delivery of [responder requests](/incident-management/incidents/add-responders#responder-notifications). | | **Developer Site** | A disruption affecting our [Developer Documentation](/developer). A disruption here does not affect the PagerDuty product. | | **Workflow Automation** | A disruption affecting the [Catalytic application](https://help.catalytic.com/guides/getting-started/). A disruption here does not affect the PagerDuty product. | | **Runbook Automation** | A disruption affecting the [Runbook application](https://www.rundeck.com/what-is-runbook-automation). A disruption here does not affect the PagerDuty product. | | **PagerDuty AI** | A disruption affecting [PagerDuty AI](/ai-automation/advance). | | **Analytics** | A disruption affecting any PagerDuty analytics processes, including: [Reports](/incident-management/analytics/insights), [Intelligent Dashboards](/incident-management/analytics/dashboard), [Insights](/incident-management/analytics/insights), and [Audit Trail Reporting](/incident-management/analytics/audit-trail). | | **Incident Workflows** | A disruption affecting [Incident Workflows](/ai-automation/automation/incident-workflows). | | **Jeli** | A disruption affecting [Jeli](/incident-management/after-incident/get-started-with-jeli-post-incident-reviews). | --- URL: https://docs.pagerduty.com/get-started/platform-release-notes-archive # Platform Release Notes (Archive) An archive of past PagerDuty web platform release notes, preserved for reference after moving off the current release notes page. > **New Updates:** This page is an archive of past release notes. > > Recent updates can be found on our [Platform Release Notes](/get-started/release-notes) page. ## February 2025 ### PagerDuty Operations Cloud Spring '25 Release: Reimagining Operations in the Age of AI and Automation PagerDuty is reimagining operations in the era of AI and Automation. Check out our Spring '25 release to see what we’ve shipped (and what’s still coming) in [this blog](https://www.pagerduty.com/blog/product-launch-enhancements-to-pagerduty-operations-cloud-2025-H1/), or watch the [demo here](https://youtu.be/NJzg4tcSXOk). ### Noise Reduction Home Page Now Generally Available for AIOps customers Access a centralized hub that delivers a high-level overview of your services’ alert configurations. Seamlessly implement Alert Grouping and Auto-pause Incident Notification settings. Accelerate resolution and cut operating costs through simplified alert management. [Learn more](/ai-automation/aiops/noise-reduction). ### Audience-Specific Status Pages is now in GA Deliver customized status updates to different customer segments through a single, consolidated status page that eliminates the need to manage multiple pages. Organizations can now provide targeted incident information to specific stakeholder groups, reducing communication complexity while ensuring each audience receives relevant updates during outages, ultimately streamlining crisis communication and improving customer satisfaction. Generally available for Enterprise plans and Premium Status Page add-on customers starting February 18, 2025. [Learn more](/incident-management/communicate/external-status-page/private-status-page#audience-specific-status-page). ### Use a single Slack app to manage all your PagerDuty incidents You can now use a single PagerDuty Slack app to access all the functionality you need to manage incidents in the chat, from detection to learning! This includes the generative AI capabilities of PagerDuty Advance and the ability to ingest Slack data into your Post-incident Reviews. Take [this product tour](https://pagerduty.navattic.com/guided_remediation_slack) or watch [this demo](https://youtu.be/2ql5xfWmM7k?si=C3d2e9a9q5UwKC5j) to learn more. Generally available. ## January 2025 ### Intune Support for Mobile is Now in Early Access With Intune support for Mobile, customers can more securely manage the PagerDuty Mobile app while improving compliance with regulations and policies. Intune’s Mobile App Management (MAM) capabilities allow organizations to enforce policies like blocking copy/paste between unmanaged apps, encrypting data, remotely wiping devices, and more. This helps organizations protect revenue by reducing data breach risks and improving compliance. Enterprise Incident Management (EIM) customers can [sign up for Early Access](https://www.pagerduty.com/early-access/). ### New SMS contact method verification To combat SMS phishing, we’re introducing a 6-digit code verification for new phone numbers added to accounts. Users can now have up to 3 SMS/Voice contacts while existing numbers remain unaffected. This ensures critical notifications reach verified numbers, reducing fraud risks. [Learn more](/account-admin/user-profile/contact-information#add-an-sms-contact-method). ### Zendesk Field Mapping with PagerDuty Custom Fields Share contextual information seamlessly between Zendesk and PagerDuty to save time during incidents. [Learn more](/integrations/zendesk-integration-guide/zendesk-custom-field-mappings). ### Automation on Alerts now in Early Access for AIOps customers Proactively address issues before they escalate into incidents. Automation on Alerts allows teams to trigger automated remediation workflows at the alert level, reducing the need for responder intervention and preventing incidents from being created in the first place. By resolving issues earlier in the lifecycle, teams can reduce the total number of incidents, minimize customer impact, and free up time for value-add work. AIOps customers can sign up for [Early Access](https://www.pagerduty.com/early-access/). ### Auto-pause Incident Notifications with Recommended Pause Time Now Available for AIOps Customers Selecting the right pause time for Auto-pause Incident Notifications (APIN) just got easier. AIOps customers can now see the recommended pause time directly in the dropdown menu, helping the optimal pause time for transient noise. This enhancement helps prevent unnecessary incident noise by pausing transient alerts more effectively and reduces the need for manual adjustments. [Learn more](/ai-automation/aiops/noise-reduction/auto-pause-incident-notifications). ### Global Intelligent Alert Grouping now Generally Available AIOps customers can use PagerDuty’s proprietary machine learning algorithms to learn from both system and human data when grouping alerts for noise reduction across multiple services. Reduce operating costs and improve your incident response by focusing on critical signals, thanks to this intelligent automation. Available now for all AIOps customers. [Learn more](/ai-automation/aiops/noise-reduction/alert-grouping/global-alert-grouping#intelligent). ### End of Life for Event Rules on January 31 The End of Life for Event Rules will happen on January 31. You can continue to use and edit your Event Rules in the UI as usual until the EOL date. Starting February 1, Event Rules will be available via API only. If you’re currently using Event Rules, you will receive an email about potential migration paths. Otherwise, no action is required. To get the most value out of PagerDuty's event-driven automation offering, we recommend migrating to Event Orchestration. Event Orchestration is the best way for users to compress rule volumes, improve noise reduction, and automate manual work. Users will be able to do everything in Event Orchestration that they can in Event Rules today, and more. Read the [Knowledge Base article](/ai-automation/aiops/migrate-to-event-orchestration). ## December 2024 ### Generally available: API for managing incident Slack channels We released [new public API endpoints](/developer/api/reference/integration-slack/slack-dedicated-channels/get-dedicated-channel) to create, update and remove both incident and notification Slack channels. This provides greater flexibility to integrate any homegrown automation processes with PagerDuty and to seamlessly collaborate and coordinate incident response. Generally available for Incident Management customers. ### New Incident Workflow action: add Slack channel bookmark Automatically bookmark important resources to an incident’s dedicated channel, such as runbooks, dashboards, ITSM tickets, or other process documentation. This provides responders with instant access to key data right where they work—in chat. Please note you need to [refresh the PagerDuty Slack app authorization](/integrations/slack-integration-guide#approve-app-update) to get access to this feature. Generally available for Business and Enterprise Incident Management customers. Learn more [here](/workflow-actions/slack/add-a-bookmark). ### Operations Console with Alert Side Panel Early Access Now Available for AIOps customers The new alert side panel provides real-time visibility into alerts and their associated metadata, centralizing key information for easier triage. With the newest enhancements, responders can view and customize the alert table directly from the side panel, take action on alerts (e.g. merge/unmerge), and add new columns (e.g. # of alerts, latest alert time, alert CEF fields) to the live incidents table. Additionally, we've added Incident Custom Fields where users can customize, free-text search and live filter for incidents, and automation functions such as sync with ServiceNow (via Webhook v3). Customers can save time, reduce costs, and improve efficiency by centralizing alert data and eliminating the need for tab-switching. With better visibility and enriched data, teams can reduce MTTA and MTTR, protect revenue, and handle incidents with greater precision. AIOps customers can sign up for [Early Access](https://www.pagerduty.com/early-access/). ### New Webhooks Public SSL Client Certificates available starting Dec 6, 2024 The new public SSL Client Certificates used by PagerDuty Webhooks are now available. If your process relies on these certificates, please ensure your servers are configured to verify the new certificate. Alternatively, as a best practice, use an up-to-date trusted root CA certificate list to avoid service disruptions. Learn more here and contact [support@pagerduty.com](mailto:support@pagerduty.com) if you have questions. ### The Escalation Policies details page got a new look! We're enhancing the Escalation Policies (EPs) details page! Expect more detailed error messaging, better formatting, responsive design, and improved navigation, including a direct link to the service directory for easier EPs additions and seamless mobilization. [Learn more](/incident-management/schedules/escalation-policies). ### Improved Webhook Delivery Reliability with Extended Retry Window PagerDuty Webhooks now have an extended retry window of 48 hours, a significant improvement from the previous 20-minute window. This change reduces the risk of message loss during scheduled maintenance windows or temporary service interruptions of target systems, ultimately reducing the risk and cost of major operational failures. This change applies to all customers using PagerDuty webhooks, but no immediate action is required. We encourage customers to review their webhook handling processes to accommodate the extended delivery window. ### End of Life for Event Rules Coming January 2025 The End of Life for Event Rules will happen on January 31, 2025. You can continue to use and edit your Event Rules in the UI as usual until the EOL date. Starting February 1, 2025, Event Rules will be available via API only. If you’re currently using Event Rules, you will receive an email about potential migration paths. Otherwise, no action is required. To get the most value out of PagerDuty's event-driven automation offering, we recommend migrating to Event Orchestration. Event Orchestration is the best way for users to compress rule volumes, improve noise reduction, and automate manual work. Users will be able to do everything in Event Orchestration that they can in Event Rules today, and more. Read the [Knowledge Base article](/ai-automation/aiops/migrate-to-event-orchestration). ## November 2024 ### Status Page Automation migration to Incident Workflows now Generally Available. Configure status page incident workflows created for status pages with automated incident posts enabled to post new incidents and send updates to the status page when set conditions with Incident workflow triggers are met. ### Manage incidents end-to-end from the chat with new Slack features! Explore a revamped PagerDuty Slack experience, built to streamline incident management in chat, reducing costs and risks in response coordination and communication. New capabilities include: - The ability to create public or private Slack channels exclusively dedicated to one incident, and link up to 3 notification channels to keep dedicated channels uncluttered - The ability to trigger _any_ incident action with simple slash commands - Intuitive and interactive help commands (/pd or /pd help) that support planned and unplanned work and provide access to the full directory of slash commands, clickable buttons, and recommended actions. Available from November 26 for all customers using the PagerDuty Slack app. Learn more [here](/integrations/slack-integration-guide/slack-user-guide#dedicated-incident-channel). ### Intelligent Alert Grouping with Advanced Options is now Generally Available! Build more dynamic alert groupings using advanced options that leverage metadata fields for textual similarity analysis. Choose up to five fields, including standard CEF (Common Event Format) and custom details. Provide better context and relevance to decrease alert noise, and reduce operating costs thanks to our intelligent automation. Available now for all AIOps customers. Learn more [here](/ai-automation/aiops/noise-reduction/alert-grouping/intelligent-alert-grouping#advanced-options). ### Noise Reduction Home Page Now Available for Early Access This centralized hub offers a high-level overview of services and their alert grouping configurations, enabling users to implement noise reduction recommendations and make configuration edits seamlessly. Accelerate resolution and reduce operating costs by streamlining alert management and avoiding unnecessary disruptions. Available for AIOps customers only. [Sign up for early access now](https://www.pagerduty.com/early-access/)! ### Start a Post-incident Review with a genAI summary directly from chat with PagerDuty Advance Use the PagerDuty Advance Assistant within Slack or Microsoft Teams to create an AI-generated executive summary of the incident that is automatically imported into a new Jeli Post-incident Review. Get a jump-start on learning from incidents to build more resilient operations and improve customer experience. Generally available to Enterprise Incident Management customers using Jeli and PagerDuty Advance. Learn more [here](/ai-automation/advance/user-guide#pagerduty-ai-for-post-incident-reviews). ### EOL for Event Rules on January 31, 2025 The Event Rules UI will reach End of Life on January 31, 2025. After this date, Event Rules will be accessible via API only. Users are encouraged to migrate to Event Orchestration for enhanced event-driven automation capabilities. Event Orchestration offers improved functionality over Event Rules, including better UI, advanced conditions, rule nesting, and Terraform support. This transition enables users to compress rule volumes, reduce noise, and automate manual work more effectively, ultimately reducing operating costs thanks to intelligent automation. For more information, read this [Knowledge Base article](/ai-automation/aiops/migrate-to-event-orchestration). ## October 2024 ### Status Page Automation with Incident Worflows now Generally Available Automate a consistent set of information to your status page to keep end users informed during customer-impacting outages with PagerDuty status pages and incident workflows. Teams can now set up incident workflows to post new incidents and send updates to the status page when set conditions with Incident workflow triggers are met. This automation helps reduce the risk of human error and the cost of major operational failures. Generally available to PagerDuty Status Page and EIM customers. [Learn more](/workflow-actions). ### Generally available: PagerDuty Advance for Microsoft Teams, Analytics, and more! PagerDuty Advance capabilities are now available for Microsoft Teams, including the brand-new ability to access Knowledge Base information directly from the chat. This reduces operational complexity for teams looking for support beyond unplanned work, driving efficiency, and mitigating the risk of operational failure. Also generally available: a new Analytics dashboard providing clear visibility into improvements on operational metrics supported by genAI, enabling data-driven decision-making to reduce operating costs and improve efficiency. Available for customers on a PagerDuty Advance paid plan or [trial](https://www.pagerduty.com/try-pagerduty-advance/). ### New Incident Workflow Action: Create Post-incident Review Users can add Post-incident Reviews as an action to their Incident Workflows to automatically initiate the learning process upon incident resolution. This helps teams identify patterns across incidents and turns them into opportunities to drive continuous improvement, ultimately mitigating the risk of operational failure by learning and improving processes over time. Generally available on the Enterprise plan for Incident Management. Learn more [here](/workflow-actions/jeli/jeli-create-a-post-incident-review). ### Event Orchestration External Data Variables now in Early Access! Build more dynamic orchestrations using variables that leverage data from incidents and external systems via API to cover a more diverse set of automation use cases. Teams can now initiate actions based on existing automation outputs, such as suppressing unnecessary incidents when the diagnostics results indicate the issue has been resolved, reducing total cost of operations and freeing up time for value-add work. [Sign up for Early Access](https://www.pagerduty.com/early-access/) (AIOps customers only). ### Terraform support now available for all Alert Grouping Settings APIs Endpoints include Create, List, Get, Update, and Delete. [Learn more](https://registry.terraform.io/providers/PagerDuty/pagerduty/latest/docs/resources/alert_grouping_setting). ### Sync PagerDuty notes and ServiceNow case work notes Customer Service teams working in ServiceNow CSM can now sync PagerDuty notes with ServiceNow case work notes, making it easier to share and receive important customer information across Product and Customer Service teams. This improves coordination and communication for faster resolution of customer impacting outages, ultimately mitigating risk of bad customer experience and protecting revenue. Now generally available on all Customer Service Operations plans. Learn more [here](/integrations/servicenow-csm-integration-guide#pagerduty-csm-configuration). ### New PagerDuty Advance features in Early Access—including Microsoft Teams support Early Access is now open for 3 new genAI-powered features, including: - PagerDuty Advance Assistant for Microsoft Teams support - The ability to surface PagerDuty Knowledge Base information in-chat for extended support beyond incident response - PagerDuty Advance Analytics dashboard for a clear snapshot on the value of using our genAI features—including MTTA/MTTR improvements, time saved, and most used actions Sign up for [Early Access](https://www.pagerduty.com/early-access/) now! ### End of Life for Event Rules Coming January 2025 The End of Life for Event Rules will happen on January 31, 2025. You can continue to use and edit your Event Rules in the UI as usual until the EOL date. Starting February 1, 2025, Event Rules will be available via API only. If you’re currently using Event Rules, you will receive an email about potential migration paths. Otherwise, no action is required. To get the most value out of PagerDuty's event-driven automation offering, we recommend migrating to Event Orchestration. Event Orchestration is the best way for users to compress rule volumes, improve noise reduction, and automate manual work. Users will be able to do everything in Event Orchestration that they can in Event Rules today, and more. Read the [Knowledge Base article](/ai-automation/aiops/migrate-to-event-orchestration). ## September 2024 ### Now in Early Access: Incident Types Because no incident is the same, you can now categorize incidents differently and drive a tailored response workflow for each. Tightly integrated with Incident Workflows and Custom Fields, this new feature empowers you to trigger more precise response and coordination to meet SLAs. Sign up for [Early Access](https://www.pagerduty.com/early-access/). ### New Configuration API for Jira Cloud Application Now you can efficiently manage your Jira Cloud settings in bulk. The API allows you to automate configuration management using Terraform, making processes more streamlined. Review the [developer documentation](/developer/api/reference/integration-jira-cloud/account-mappings/get-account-mappings) for more details. ### Jeli API Update to support Security Teams Users can now set Owners, Editors, and Viewers on existing Opportunities via the API. Previously, this was possible only upon creating a new Opportunity. This new capability is essential to customers who use Jeli for security incidents. They can now assign people to roles when deemed necessary, not just at Opportunity creation. ### Our AIOps Content-Based Alert Grouping now supports email alerts Content-Based Alert Grouping now supports email alerts for alert grouping. This feature enhances our alert grouping capabilities, allowing both Content-Based Alert Grouping and Unified Alert Grouping (which combines Intelligent and Content-Based grouping types) to evaluate email alerts effectively. By incorporating email alerts into our grouping system, we’re providing a more comprehensive approach to handling notifications across different channels. For more information, read this [Knowledge Base article](/ai-automation/aiops/noise-reduction/alert-grouping/content-based-alert-grouping#email-events). ### End of Life for Event Rules Coming January 2025 The End of Life for Event Rules will happen on January 31, 2025. You can continue to use and edit your Event Rules in the UI as usual until the EOL date. Starting February 1, 2025, Event Rules will be available via API only. If you’re currently using Event Rules, you will receive an email about potential migration paths. Otherwise, no action is required. To get the most value out of PagerDuty's event-driven automation offering, we recommend migrating to Event Orchestration. Event Orchestration is the best way for users to compress rule volumes, improve noise reduction, and automate manual work. Users will be able to do everything in Event Orchestration that they can in Event Rules today, and more. Read the [Knowledge Base article](/ai-automation/aiops/migrate-to-event-orchestration). ## August 2024 ### Operations Console now Generally Available to AIOps customers Central IT teams like NOC, ITOps, and SRE need a shared, real-time view of incoming incidents and their systems' operational health to minimize business impact and protect customer experience. The PagerDuty Operations Console enables users to create customized incident views with flexible filters to triage and take action on issues from a centralized location in real-time. You can access it via the AIOps menu item. Learn more by reading this [Knowledge Base article](/ai-automation/aiops/operations-console). Don't know where to start? Take the [product tour](https://pagerduty.navattic.com/operations-console)! ### New AIOps top navigation menu item This new menu item centralizes key AIOps features, including the Operations Console, Event Orchestration, Recent Changes (only available to customers with the Change Events capability), and Event Rules. This navigation change won't impact customers' current package. Explore the new in-product menu today! ### End of Life for Event Rules Coming January 2025 The End of Life for Event Rules will happen on January 31, 2025. You can continue to use and edit your Event Rules in the UI as usual until the EOL date. Starting February 1, 2025, Event Rules will be available via API only. If you’re currently using Event Rules, you will receive an email about potential migration paths. Otherwise, no action is required. To get the most value out of PagerDuty's event-driven automation offering, we recommend migrating to Event Orchestration. Event Orchestration is the best way for users to compress rule volumes, improve noise reduction, and automate manual work. Users will be able to do everything in Event Orchestration that they can in Event Rules today, plus more. For more information, read this [Knowledge Base article](/ai-automation/aiops/migrate-to-event-orchestration). ### Salesforce Field Mapping with PagerDuty Custom Fields Customer service teams on the Enterprise Customer Service pricing plan can now share contextual information from customers with technical teams in PagerDuty by bidirectionally mapping the value of Salesforce fields with PagerDuty custom fields to reduce the time spent gathering vital information during incident resolution. For more information, read this [Knowledge Base article](/integrations/salesforce-service-cloud-integration-guide/salesforce-custom-field-mappings). ## July 2024 ### Ensure full privacy when creating Jeli Opportunities via API The Jeli API was updated to enable users to configure access controls and assign roles on all Opportunities, including private. This is particularly helpful for security teams, as it allows them to address privacy concerns when using Jeli for security related incidents. The Jeli API update includes 3 key enhancements: 1. The ability to set Owners, Editor & Viewers when creating a new Opportunity 2. The ability to set global access control role when creating a new Opportunity 3. The ability to set the Investigator role when creating a new Opportunity Check out updated [Jeli API documentation](https://api.jeli.io/v0/docs#/). ### Generally Available: New Incident Roles & Tasks functionality, including Microsoft Teams integration Now generally available on the Enterprise plan for Incident Management: the ability to assign Incident Roles & Tasks from Microsoft Teams and the option to connect Incident Roles to an Escalation Policy. These new features enable users to drive accountability during major incidents to ensure that no critical steps are missed. Learn more [here](/incident-management/incidents/incident-roles). ### Intelligent Alert Grouping with Advanced Options Available for Early Access Customers can now customize their Intelligent Alert Grouping by selecting their preferred alert fields for textual similarity analysis. This enhancement allows customers to choose up to five fields, including standard CEF and custom details, for a comprehensive alert grouping analysis. Early access is available for AIOps customers only. Sign up [here](https://www.pagerduty.com/early-access/). ### New Alerts Table View UI We are bringing updates to our UI on the Alerts table view (_Incidents > Alerts_). Key changes include a new option for a custom time range on the created filter, improving the old static range options. Additionally, the ‘show details’ option is now an expansion button. You will begin to see these changes gradually over the next few weeks. For more information, read this [Knowledge Base article](/incident-management/incidents/alerts/alerts-table). ### Route incidents at scale with Dynamic Routing, now Generally Available for PagerDuty AIOps! Route incidents at scale with Dynamic Routing, now Generally Available for PagerDuty AIOps customers. This feature allows organizations to leverage historical data and system state to dynamically adapt routing rules. It also ensures that teams can run fast and manage and maintain incident response processes at scale for an unlimited number of services. For more information, read this [Knowledge Base article](/ai-automation/aiops/event-orchestration#create-a-dynamic-routing-rule). ### Generally Available: Escalate incidents at scale with Dynamic Escalation Policy Assignment (PagerDuty AIOps) Dynamic Escalation Policy Assignment is now Generally Available to AIOps customers. This feature ensures the right responder is notified by dynamically assigning escalation policies based on event data and overriding policies defined at the service level. For more information, see this [Knowledge Base article](/ai-automation/aiops/event-orchestration#basic-event). ### New Jeli Opportunity and Narrative Builder editing enhancements Benefit from 3 new enhancements to text entry and Markdown support in Jeli to easily highlight key data points in the incident narrative you’re creating: - Markdown display is now supported for all fields within an Opportunity - Markdown preview is available when editing the Narrative Builder markers - Click-to-edit ability was removed from the Executive Summary, Takeaways, and Quick Actions sections, to avoid overwrites while showcasing key information during post-incident reviews. Learn more about Jeli Opportunities and Narrative Builder [here](/incident-management/after-incident/get-started-with-jeli-post-incident-reviews). ## June 2024 ### Operations Console Early Access Now Available for AIOps customers [New functions added!] Central IT teams like NOC, ITOps, and SRE need a shared, real-time view of incoming incidents and their systems' operational health to minimize business impact and protect customer experience. The PagerDuty Operations Console enables users to create customized views with flexible filters to triage and take action on issues from a centralized location in real time. We recently added two new functions: - View/filter/search alert custom detail fields onto the Incidents table - Perform single/bulk actions directly in the Operations Console AIOps customers can sign up for Early Access [here](https://www.pagerduty.com/early-access/). ### Re-login may be required for PagerDuty Apps and Integrations to access your PagerDuty account To bolster the security of our services, we are deprecating our legacy OAuth tokens (ones issued before Feb 2022), which previously did not expire. This update will be implemented in the next 4 to 5 weeks, starting with the mobile app. If your integrations (REST APIs or Apps) and PagerDuty mobile app use these tokens, you must log out and log in again to your mobile apps and PagerDuty integrations to prevent any service interruptions. Importantly, rest assured that this will not affect any on-call paging functionality, ensuring the continuity of your operations. ### Jeli Opportunity Stages Timeline generally available for all PagerDuty plans including Jeli Incident Analysis The new Opportunity Stages Timeline provides an at-a-glance view on the status of each Post Incident Review in the Jeli environment. The timeline is displayed at the top of each Opportunity page, highlighting the active Opportunity Stage at the moment. Learn more about Opportunity Stages [here](/incident-management/after-incident/jeli-post-incident-reviews/post-incident-review-stages). ### Now in Early Access: Operational Maturity Personalized Recommendations Discover how to elevate your team’s operational efficiency with our new Operational Maturity Recommendations! This feature delivers personalized top 3 actions to improve team performance, ideal for leaders seeking to optimize practices with actionable insights. Visit and assess your Operational Maturity today via **Analytics** → **Operational Maturity**. [Access the EA page and select 'Operational Maturity Personalized Recommendations - Beta'](https://www.pagerduty.com/early-access/) to join the program. ### Global Intelligent Alert Grouping now in Early Access AIOps customers can use PagerDuty’s proprietary machine learning algorithms to learn from both system and human data when grouping alerts for noise reduction across multiple services. Users can also combine both Content-Based and Intelligent Alert Grouping with a flexible time window for maximum precision and correlation control across multiple services. [Interested AIOps customers should sign up for Early Access](https://www.pagerduty.com/early-access/) and select **Global Intelligent Alert Grouping**. ## May 2024 ### Route incidents at scale with Dynamic Routing - now EA! Route incidents at scale with Dynamic Routing – now Early Access for PagerDuty AIOps customers. This feature allows organizations to leverage historical data and system state to dynamically adapt routing rules. It also ensures that teams can run fast and manage and maintain incident response processes at scale for an unlimited number of services. If you are interested in trying Dynamic Routing, reach out to your account team. ### Track Post-incident Reviews with Opportunity Stages Opportunity Stages provide visibility on which incidents are or have been investigated within Post-incident Reviews. There are 5 Stages to pick from: Unassigned, Assigned, In Progress, In Review, Completed. You can filter Opportunities by Stage, using the search functionality on the Opportunity list page. [Learn more](/incident-management/after-incident/jeli-post-incident-reviews/post-incident-review-stages). ### Create a Jeli Post-incident Review from PagerDuty Enterprise Incident Management and Customer Service Ops users can now create a Jeli Post-incident Review directly from a PagerDuty incident page—with just one click. This kickstarts the Post-incident Review process immediately and connects the full incident lifecycle in a single flow. Jeli Post-incident Reviews can be accessed directly from the PagerDuty global navigation bar. [Learn more](/incident-management/after-incident/jeli-post-incident-reviews). ### Incident Roles - Now Available on PagerDuty Web UI We are thrilled to introduce Incident Roles in our PagerDuty Web UI, an enhancement initially available only via the Slack Experience. This feature streamlines incident management and boosts efficiency by allowing flexible role assignments, automated processes, and comprehensive access, ensuring each team member knows their responsibilities for effective decision-making and resolution. [Learn more](/incident-management/incidents/incident-roles). We encourage you to explore these new capabilities through our knowledge base and see how they can improve your incident management process. ## April 2024 ### Dynamic Escalation Policy Assignment now Early Access! Dynamic Escalation Policy Assignment is now Early Access for AIOps customers. This feature ensures the right responder is notified by dynamically assigning escalation policies based on event data and overriding policies defined at the service level. If you are interested in trying Dynamic Escalation Policy Assignment, [fill out this form](https://www.pagerduty.com/early-access/). ### Insights The escalation policy ID and name shown in [Insights](/incident-management/analytics/insights) now respect the escalation policy used in the incident as it changes. Previously the escalation policy associated with the incident's service was always shown. See the [developer changelog](/developer/api-changelog#2024-04-04) for more technical details. ## March 2024 ### Public API Support for Status Pages Status Pages Customers can now CRUD actions to post, update, and manage subscribers for PagerDuty Internal and External Status pages. [Learn More](/developer/api/reference/rest/status-pages/list-status-pages). ### Unified Alert Grouping on a Single Service Combine both Content-Based and Intelligent Alert Grouping with a flexible time window for maximum precision and correlation control. Specify which fields and criteria need to be met before Intelligent Alert Grouping is applied on a single service. Now generally available to AIOps customers only. For more information, check out the [KB article](/ai-automation/aiops/noise-reduction/alert-grouping/unified-alert-grouping). ### New Enterprise plan for PagerDuty Incident Management We’ve launched a new Enterprise plan for Incident Management by combining capabilities from our Jeli acquisition with our latest incident management innovations into a single end-to-end offering. The unified platform eliminates guesswork with built-in automation and guides remediation throughout the incident lifecycle. [Learn more](https://www.pagerduty.com/blog/enterprise-plan-pagerduty-incident-management). ## February 2024 ### Unified Alert Grouping Available for Early Access Combine both Content-Based and Intelligent Alert Grouping with a flexible time window for maximum precision and correlation control. Specify which fields and criteria need to be met before Intelligent Alert Grouping is applied on a single service. Early access is available now for AIOps customers only. [Learn more](/ai-automation/aiops/noise-reduction/alert-grouping/unified-alert-grouping). ### PagerDuty for Customer Service in Salesforce Release notes for Version 3.13 of the PagerDuty for Salesforce service cloud application in [Salesforce appexchange](https://appexchange.salesforce.com/appxListingDetail?listingId=a0N3A00000FK9u7UAD). - PagerDuty Incident actions to update the PagerDuty incident Conference and Description fields with values from fields in Salesforce. ### PagerDuty for Customer Service in ServiceNow CSM Release notes for Version 2.3 of the PagerDuty for ServiceNow CSM application in the [ServiceNow Store](https://store.servicenow.com/sn_appstore_store.do#!/store/application/2e31f90d1b7b11109aeeea4fad4bcb0f/1.3.1?referer=%2Fstore%2Fsearch%3Flistingtype%3Dallintegrations%25253Bancillary_app%25253Bcertified_apps%25253Bcontent%25253Bindustry_solution%25253Boem%25253Butility%25253Btemplate%25253Bgenerative_ai%25253Bsnow_solution%26q%3DPAGERDUTY&sl=sh). - Support for ServiceNow Vancouver - Support for the PagerDuty Widget on the Case Page in the CSM Configurable workspace ## January 2024 ### Sunsetting Incidents Only Setting Beginning February 2024 we will be sunsetting the Incidents Only service setting. As of this change, new services will not be able to be created via UI or API with the Incidents Only service setting. If you currently use this setting, your services will be migrated automatically with the exception of Webhook V2 or V3 users who have received additional advance communication. [Learn more](/incident-management/incidents/alerts). ### Mobile App: Analytics Widget on Home Screen GA We're excited to announce the general availability of the [Analytics Widget](/get-started/mobile-app/mobile-home-screen#analytics-on-mobile) on the PagerDuty Mobile App home screen. Users can now Monitor their Team's MTTA and MTTR, plus the count and details of High Urgency Incidents from the previous month until yesterday. The card also highlights the specific date range covered and compares trends with data from 30 days before the selected period. ### Small UI change for Event Orchestration As of January 17, some customers may see a small UI change as we prepare for a staged rollout of improvements to the Event Orchestration rule creation module. This includes an improved drop down to select which actions should be applied to an Event Orchestration. ## December 2023 **Schedule Layer Copy now generally available** The new Schedule Layer Copy feature speeds up the schedule creation process and addresses different scheduling and rotation needs. It allows you to duplicate an entire layer configuration within a schedule or to copy specific components of an existing layer into a new one. Now generally available for all PagerDuty users. [Learn more](/incident-management/schedules/edit-schedules#duplicate-a-layer). **EU: Registering New OAuth Apps is now available** EU accounts can now create new Oauth Apps from the Integrations menu. These apps can be used for their own custom integrations or third-party developers creating an integration to PagerDuty for their customers. [Create an OAuth App](https://www.pagerduty.com/blog/build-sophisticated-apps-for-your-pagerduty-environment-using-oauth-2-0-and-api-scopes/). **The Analytics Dashboard is now Generally Available** The Dashboard was designed to streamline customers' access to key metrics and reports all on one surface. With a user-friendly navigation system, users can easily drill down into and monitor essential metrics to drive proactive improvements. It provides direct access to Insights Reports for deeper analytics and easier navigation. Accessible to paying customers in the web app by navigating to **Analytics** → **Dashboard**. Learn more [here](/incident-management/analytics). **Reminder: Legacy Reports End-of-Life** The legacy Reports have been discontinued on December 11, 2023, and have been replaced by the Insights Reports. We recommend transitioning to Insights Reports to benefit from their advanced features. Learn more [here](/incident-management/analytics/insights). **Intelligent Dashboards sunsetting on January 15, 2024** The Intelligent Dashboards are being discontinued and replaced by the Analytics Dashboard (available soon). We recommend transitioning to the Dashboard (Analytics menu > Dashboard) to benefit from its advanced features. Learn more [here](/incident-management/analytics). **Webhooks Public Certificates Expiring Soon** The public certificates used by PagerDuty Webhooks will expire on January 5, 2024. If you have a process that relies on verifying the PagerDuty's Webhooks Certificate, please have your PagerDuty admin download and install the new certificate to avoid service disruptions. Please contact [support@pagerduty.com](mailto:support@pagerduty.com) if you have additional questions. [Learn more](/developer/webhook-tls-certificates). **Introducing Slack as an Incident Contact Method** Response teams can now add Slack as a contact method and use it as a part of notification rules for incident response! As a prerequisite, PagerDuty’s Slack integration must be added to an organization's Slack Workspace. Also, PagerDuty recommends that when setting up a contact method, you always have a secondary option. Review our [integration guide](/integrations/slack-integration-guide). **Round Robin support via Escalation Policy API** It is now possible to use the Escalation Policies API to apply Round Robin to new and existing escalation policies via Terraform or the REST API directly. Teams who rely on automation will be able to use this functionality for their workflows. For more information, please reference our [API documentation](/developer/api/reference/rest/escalation-policies/update-escalation-policy). ## November 2023 **PagerDuty One-Touch Usage ends on Dec 14, 2023** We're sunsetting the "One-Touch Usage" feature on December 14, 2023. This admin feature provides usage metrics for one-touch conference bridges. It has been underused, and offers limited value since consumption-based pricing was never implemented. If you have questions, please [contact our Support team](https://www.pagerduty.com/contact-us/). **Updates to Existing Content-Based Alert Grouping** Content-Based Alert Grouping now allows users to customize their grouping time using Flexible Time Windows. Previously, it only featured a static 24-hour time window available for users. Now, users can customize their grouping with either the 24-hour static time window, or the Flexible Time Window. This feature is available for existing AIOps, Enterprise for Incident Management, Digital Operations (Legacy), and Event Intelligence customers. [Learn more](/ai-automation/aiops/noise-reduction/alert-grouping/content-based-alert-grouping). **Reduce time to diagnose and next action for Responders** The Automation Actions Log allows Process and Runbook Automation users to curate Automation Action log data. Responders have less searching and comprehension toil with a summarized view of automation results attached to the incident. This feature is now Generally Available for Automation Actions customers. Please [contact our Support team](https://www.pagerduty.com/contact-us/) if you have any questions about this new functionality. **Reduce Noise Across Services** Global Alert Grouping (now Generally Available to AIOps customers) allows organizations to reduce noise across one or multiple services by using Content-based Alert Grouping with a flexible time window. With this new AIOps feature, teams can experience fewer incidents, improve MTTR by distilling the signal from the noise, and better understand the incident scope. [Learn more](/ai-automation/aiops/noise-reduction/alert-grouping/global-alert-grouping). **Webhooks Public Certificates Expiring Soon** The public certificates used by PagerDuty Webhooks will expire on January 5, 2024. If you have a process that relies on verifying the PagerDuty's Webhooks Certificate, please have your PagerDuty admin download and install the new certificate to avoid service disruptions. Please [contact our Support team](https://www.pagerduty.com/contact-us/) if you have additional questions. [Learn more](/developer/webhook-tls-certificates). **Legacy Reports to be deprecated on December 11, 2023** The legacy Reports will be discontinued on December 11, 2023 and will be replaced by the Insights Reports. We recommend transitioning to Insights Reports to benefit from their advanced features. For more details, visit our [Knowledge Base](/incident-management/analytics/insights) or contact our support team. **Updates to REST API Rate Limits** Starting Dec 4th 2023, we are [rolling out some updates to PagerDuty’s REST API Rate Limit](/developer/rest-api-rate-limits), including: 1. A refreshed rate limiting system to more consistently and accurately enforce REST API rate limits, 2. New response headers within our REST APIs so that customers can programmatically control the request load sent to PagerDuty and 3. Four dimensions used to enforce the rate limit. **Analytics API Service is Generally Available** The Analytics API Service is now GA, ensuring we continue to be API-first. We removed the X-EARLY-ACCESS header requirement for all Analytics endpoints, added seven new endpoints, and we also added new escalation/reassignment metrics and filters to existing endpoints. The AAS powers our Insights reports, which are available to all paying customers. You can find more information on the [PagerDuty Developer Platform](/developer/api-changelog#2023-11-03). **Analytics Dashboard in Early Access** The new Analytics Dashboard allows you to easily monitor key metrics in one place! The dashboard links to Insights reports for deeper analytics and easier navigation. [Sign up now](https://www.pagerduty.com/early-access/) to get Early Access to this feature. Access it via Analytics → Dashboard. **Mobile App: Status Dashboard Widget on Home Screen GA** We're excited to announce the general availability of the Status Dashboard Widget on the PagerDuty Mobile App home screen. This widget displays your top 3 impacted business services in order of priority. It provides a quick and easy way to monitor disruptions and stay informed. You can learn more by reading this [Knowledge Base article](/get-started/mobile-status-dashboard). ## October 2023 **Rich Text and Hyperlinks Support for Status Pages** Status Pages Customers can now use Rich Text and Hyperlinks to communicate real-time operational updates more clearly and easily. This allows more emphasis on instructions and provides clickable links. Delivering even more exceptional customer experiences to their customers. [Learn more](/incident-management/communicate/external-status-page#does-the-external-status-page-support-rich-text-and-hyperlinks). **Previous Services List view deprecated from October 25** On October 25, 2023, PagerDuty ends support to the previous Services List view. The Service Directory page is now the single source of truth for all service-related information. [Learn more](/incident-management/services/service-directory). **See your event volume in detail** As of October 17, account admins can dig into the sources of their organization's event volume broken out by the routing key receiving these events via the Event Volume Detailed Breakdown table. This can help teams manage their events and identify keys or services that drive their event volumes. For more information, please see [this Knowledge Base article](/incident-management/analytics/event-analytics). **Announcing Private Status Pages General Availability** Customers can use[ Private Status Pages](/incident-management/communicate/external-status-page/private-status-page) to proactively and securely communicate real-time operational updates with their stakeholders via Single Sign-On (SSO) without requiring a PagerDuty account. By doing so, they can consolidate communication tools, drive operational efficiencies, and break down silos to deliver exceptional customer experiences. **ServiceNow Customer Service Management Integration** Review release notes for version 2 of the PagerDuty for ServiceNow CSM application in the [ServiceNow store](https://store.servicenow.com/sn_appstore_store.do#!/store/application/2e31f90d1b7b11109aeeea4fad4bcb0f/2.0.0?referer=%2Fstore%2Fsearch%3Flistingtype%3Dallintegrations%25253Bancillary_app%25253Bcertified_apps%25253Bcontent%25253Bindustry_solution%25253Boem%25253Butility%25253Btemplate%25253Bgenerative_ai%25253Bsnow_solution%26q%3Dpagerduty&sl=sh). PagerDuty Ruleset for ServiceNow CSM. Automate actions in PagerDuty and ServiceNow CSM when conditions on a PagerDuty incident or ServiceNow case are met. [Learn more here](/integrations/servicenow-csm-integration-guide). ## September 2023 **Service Event Rules Migration now generally available** All accounts now have access to the new [Service Event Rule to Service Event Orchestration migration tool](/ai-automation/aiops/migrate-to-event-orchestration#push-button-rule-migration). This tool will allow users to migrate all the rules in a service event ruleset to Event Orchestration at the push of a button. This functionality can also be triggered via API. For more information, check out our Knowledge Base. **New Teams Workflow Action: Create Incident Chat Room** Along with Create a Meeting, customers can now create a dedicated Incident chat room via PagerDuty Workflows. The incident chat will include an incident notification card with real-time incident updates and incident action buttons. It will also automatically add responders that have been added to the incident. Learn more in our [Integration Guide](/integrations/microsoft-teams). **New Wizard UI available for App Registration** We have been listening to a lot of feedback on our [App Registration experience](/developer/register-an-app). We made minor tweaks to it with our API Scopes launch in May 2023 and helped our developer reduce the time to register by 30%! But, we wanted to do more. Hence, presenting a much smoother and better wizard experience for our developers to help them go through their app registration journey, whether its their 1st or not. Enjoy! **Service Standards API now generally available** With the Service Standards API, users can now pull the following data on their [Service Standards](/incident-management/services/service-directory#service-standards): - A list of all standards of an account - A list of how a set of resources score on their standards - How a resource is scored on its standards Also, Admins and Account Owner can change the description of a service standard. For more information, please read [Service Standards](/incident-management/services/service-directory#service-standards) in our Knowledge Base. **Insights Reports and Analytics API now in Early Access** All paying customers now have access to the Insights Reports. These reports are loaded with interactive visualizations, drill-down capabilities, and detailed response effort data. Check them out in the Analytics dropdown marked as “New.” We’ve also opened the Analytics API to all plans so teams can access incident response and detailed responder data directly in their preferred analytics platform. Check the [Knowledge Base article](/incident-management/analytics/insights) for more information. ## August 2023 **Custom Fields in Status Updates Templates now available** Custom Fields in Status Update Notifications Templates (STUNTs) help response teams to share important information from 3rd party integrations or company-specific incident data with stakeholders. Also, the selection of available standard fields in STUNTs was expanded to include "Assignments”, “Urgency”, and “Previous Status Updates”, so teams can add even more context about the incidents at hand. To learn more, check out our [Knowledge Base article](/incident-management/communicate/status-update-templates#fields-in-email-notifications). **Schedules upgrades now generally available** The final set of upgrades to the scheduling pages is now generally available for all customer accounts. Layers can be renamed and rearranged in both schedule creation and scheduling editing. Users with at least an admin base role can add or remove teams when editing a schedule. The restrictions modal was redesigned to become more intuitive. Learn more by checking out our [Knowledge Base article](/incident-management/schedules/edit-schedules). ## July 2023 **Incident Workflow Templates Now Generally Available** We’ve made it easier for you to get off and running with Incident Workflows by introducing templates, which provide a helpful starting point and show best practices. Now, when you navigate to Incident Workflows you will see 3 templates: Major Incident Workflow, Collaboration Workflow, and Update Stakeholders Workflow. Try templates for yourself or [learn more](/ai-automation/automation/incident-workflows#create-an-incident-workflow-from-a-template) by visiting our knowledge base. **PagerDuty for Customer Service in Zendesk** The ability to use PagerDuty Incident workflows from the customer service application in [Zendesk](/integrations/zendesk-integration-guide/zendesk-user-guide#create-a-pagerduty-incident). **PagerDuty for Customer Service in Salesforce** Release notes for [Version 3.10 of the PagerDuty for Salesforce](/integrations/salesforce-service-cloud-integration-guide/salesforce-service-cloud-user-guide) service cloud application in Salesforce appexchange. The ability to use PagerDuty Incident workflows from the customer service application in Salesforce. **Status Pages Import Subscribers is now available** Customers can now effortlessly import their email subscribers in bulk using CSV, making it easier to migrate from other tools and automatically subscribe large number of customers. [Learn more](/incident-management/communicate/external-status-page#import-subscribers-from-a-csv-file). **Incident Workflow Templates Now Generally Available** We’ve made it easier for you to get off and running with Incident Workflows by introducing templates, which provide a helpful starting point and show best practices. Now, when you navigate to Incident Workflows you will see 3 templates: Major Incident Workflow, Collaboration Workflow, and Update Stakeholders Workflow. **Status Page Postmortems is now available ** Customers can now add retrospective incidents to their Status Pages after an incident is resolved, providing an opportunity to tell their customers what went wrong and what they are doing to avoid similar incidents in the future. [Learn more](/incident-management/communicate/external-status-page#add-a-postmortem-to-a-status-page). ## June 2023 **Microsoft Teams Create Meeting via Incident Workflows** Customers can now add a new action to an incident workflow that creates a Microsoft Teams Meeting. This meeting will be attached to an incident and enable incident response in a conference bridge and an incident chat room. Check out our [Knowledge Base article](/ai-automation/automation/incident-workflows). **Modernized Navigation feature for Android Mobile App** The Modernized Navigation feature for Mobile is now also available for Android users. This update lets users switch between screens easily without tapping the hidden hamburger menu and relaunching screens. Moreover, the user's history will be preserved while navigating multiple screens simultaneously. Check out our [Knowledge Base article](/get-started/mobile-app#mobile-app-walkthrough). **New Status Pages Features** PagerDuty Status Pages launches a few features this month. - Customers can now use the Scheduled Maintenance feature to keep their customers proactively informed about when they are going to be unavailable due to maintenance. They can easily add the information to their status page while sending real-time notifications to their subscribers - Status Page Templates feature provides customers with a way to standardize their incident and maintenance posts for quick reusability. Customers can improve trust and speed up the communication process by leveraging this feature to avoid repetitive copying and pasting of updates and ensure a consistent way of communication across posts - Customers can now allow their customers to get incident and maintenance updates via both Webhook and Slack Notifications - Customers can now leverage the enhanced Status Page Management feature to define which teams, besides the original page creator, can edit or delete their status pages. " **Change to Event Rules** We will be encouraging users to leverage Event Orchestration instead of Event Rules for better user experience. New services created will process events via Service Orchestration by default. You have the option to switch back to Event Rules if you choose. Existing services will continue to process events through whatever tool is the currently selected default (either Service Event Rules or Service Orchestration Rules). **In-product trial of Runbook Automation is now available** Runbook Automation is an integral component of the PagerDuty Operations Cloud and it allows you to automate your most common troubleshooting procedures in your incident response process. Runbook Automation empowers first line responders to diagnose and remediate incidents without disrupting the work of senior engineers. This trial is available for existing PagerDuty customers on Business and Digital Ops plans. There are two paths to request or sign up for a trial: the Automation Actions page or through the 'Run Actions' button on resolved incidents on the incident details page. Please contact your account team if you would like assistance with your trial. ## May 2023 **Improved Sidebar Visibility Control In Jira Server App** Upon upgrade to v4.3.3, Jira Admins can choose the default visibility of the PagerDuty sidebar widget. It will remain auto-displayed for projects mapped to PagerDuty, but Jira Admins can now bulk hide the widget for all non-mapped and newly created projects. This will eliminate manual work for the Jira Admin who needs the widget hidden by default for projects not intended for PagerDuty usage. Upgrade to v4.3.3 Jira Server app on the [Atlassian Marketplace](https://marketplace.atlassian.com/apps/1218226/pagerduty-for-jira-server-data-center/version-history). **Scoped OAuth is here!** You asked, we listened. Scoped OAuth gives you more control over API access at a PagerDuty resource-level. It allows your private application to act as an app and controls access to your PagerDuty account data by the scopes it is granted. Checkout **App Registration** (formerly **Developer Mode**) under the **Developer Tools** list on the **Integration** menu. To learn more, read our [Scoped OAuth](/developer/oauth-functionality#scoped-oauth) developer documentation. **View CSOps Integration Links in Slack and MS Teams** Responders will be able to access additional details from Zendesk and Salesforce within chat. Instead of needing to search for related cases, this update saves time during an incident when users are collaborating in Slack or MS Teams, but need to jump to the Zendesk or Salesforce list of cases. Learn more here: - [Slack](/integrations/slack-integration-guide/slack-user-guide#view-impacted-applications-in-slack) - [MS Teams](/integrations/microsoft-teams/microsoft-teams-user-guide#view-impacted-applications-in-microsoft-teams) **PagerDuty for Customer Service in Salesforce** Release notes for Version 3.9 of the PagerDuty for Salesforce service cloud application in the [Salesforce AppExchange](https://appexchange.salesforce.com/appxListingDetail?listingId=a0N3A00000FK9u7UAD&tab=e). The option to select if the Salesforce object description should sync with the PagerDuty incident description at Salesforce object or PagerDuty Incident creation. **PagerDuty for Customer Service in Zendesk** The option to select if the Zendesk ticket description should sync with the PagerDuty incident description at Zendesk ticket or PagerDuty Incident creation. **Slack Integration Reliability Improvements** We have made a [number of improvements](/integrations/slack-integration-guide) to enhance the reliability and performance of our Slack integration experience: - We now soft delete the data for 30 days and allow customers to reinstate their own data by re-connecting workspace mapping. This avoids the need for data restoration. - To improve the performance of fetching channel lists, we now only fetch slack channels that the PD user has slack permissions for and the fetching process will only begin once a user tries to create and edit a connection. Also, the full list of channels will not show by default. **New Fields Available in Status Update Notification Templates** We have expanded the selection of available fields for Status Update Notification Templates to include “Business Impact,” “Conference Bridge,” and “Slack Channel.” These new fields help response teams add important context about the incident at hand to their communications to stakeholders. To learn more, check out the [Knowledge Base article](/incident-management/communicate/status-update-templates#what-is-the-full-list-of-supported-fields). **New Fields Available in Status Update Notification Templates** We have expanded the selection of available fields for Status Update Notification Templates to include “Business Impact,” “Conference Bridge,” and “Slack Channel.” These new fields help response teams add important context about the incident at hand to their communications to stakeholders. To learn more, check out the [KB article](/incident-management/communicate/status-update-templates#what-is-the-full-list-of-supported-fields). **Status Update Notification Templates now available as an Incident Workflow Action** Rather than manually crafting update messages from scratch, response teams can use templates to drive efficiency and consistency in their stakeholder communications. These templates can now be accessed from the “Send Status Update” workflow action and automatically sent when a workflow is triggered. To learn more, check out the [KB article](/incident-management/communicate/status-update-templates). ## April 2023 **Migrate Event Rules your way** As of June 12, 2023 PagerDuty will be sunsetting Event Rules. As the next evolution of Event Rules, Event Orchestration is now the best way for users to compress rule volumes, improve noise reduction, and automate manual work. June 12, 2023, Event Rules will go into a frozen state. They will still work, but no longer be editable. To migrate Event Rules to Event Orchestrations, click the button next to each ruleset to copy it over. Or, migrate to Event Orchestration at scale via API. For more information, check out the [Knowledge Base article](/ai-automation/aiops/migrate-to-event-orchestration). **Improvements for the routing rules page** Users can now view routing rules faster and search them easier with lazy loading and search capabilities on the routing rules page. Users can search for a routing rule based on service name to quickly edit routing logic for a service. **Global Event Orchestration is generally available for PagerDuty AIOps customers** PagerDuty's Global Event Orchestration is generally available as of April 3, 2023. Global Event Orchestration's powerful decision engine enriches events, controls their routing, and triggers self-healing actions based on event data. Teams can use this functionality across any or all services within PagerDuty. This feature is available with the purchase of PagerDuty AIOps. For questions about Global Event Orchestration, you can read [this blog](https://www.pagerduty.com/blog/introducing-pagerduty-aiops/). **Introducing PagerDuty AIOps: Harnessing the Power of AI to Transform Modern Operations for the Enterprise** PagerDuty is excited to announce the launch of a new AIOps solution that allows IT and SRE teams to adopt AIOps quickly and pay only for what they use. For more information about PagerDuty AIOps, see our [Knowledge Base article](/ai-automation/aiops/overview) or [take our new product tour](https://pagerduty.navattic.com/265z0hdg). ## March 2023 **New: Run Incident Workflows from ServiceNow or Jira Server** Incident Workflows allow teams to use a no-code/low-code builder to create custom workflows that automate manual steps of the incident response process. Now, this powerful capability can be run directly from within the ServiceNow incident record or Jira Server issue to unify your data and tools for incident response. These updates can be accessed through the v7.9 ServiceNow and v4 Jira Server integrations, respectively. To learn more, read the KB articles: [ServiceNow](/integrations/servicenow-integration-guide) \| [Jira Server](/integrations/jira-server) **Major Changes to Schedule Details Page** On March 14th, the first sets of significant changes were rolled-out to the Schedule details page, providing a more user-friendly interface with enhanced visibility to Schedule metadata and unified override modals. These modals allow users to easily override a specific shift or time. The most important information is now immediately visible, with Users, Escalation Policy, and Teams nested beneath. For more information about these changes, read the latest [Knowledge Base article](/incident-management/schedules/edit-schedules#override-a-specific-schedule-shift). **Enable and disable rules in Event Orchestration** Users can now disable and enable rules in Event Orchestration. This allows users a higher level of control over which rules are executed. Instead of needing to remove and re-add rules as needed, you can now disable and enable them with the click of a button for quick editing. For more information reach out to your account team. **Salesforce Service Cloud V3.8 is now available** Upgrade to the new version of the named credential feature from Salesforce, now available in in [Salesforce appexchange](https://appexchange.salesforce.com/listingDetail?listingId=a0N3A00000FK9u7UAD&tab=e). This replaces the Legacy named credential feature that has been [deprecated by Salesforce](https://help.salesforce.com/s/articleView?id=sf.named_credentials_about.htm&type=5). Visit the [PagerDuty knowledge base](/integrations/salesforce-service-cloud-integration-guide#in-salesforce-service-cloud-1) for more information. **Slack, Microsoft Teams, and Zoom details added to Incident log Entries** Customer will now be able to see Slack, Microsoft Teams, and Zoom details via the Incident log Entries. This will ensure customers know when a responder was successfully added to a channel and can access the link from all PD interfaces. If you have any questions please reach out to [support@pagerduty.com](mailto:support@pagerduty.com). ## February 2023 **PagerDuty for Customer Service in ServiceNow CSM is now available** PagerDuty for Customer Service in ServiceNow CSM is now available. Customer service teams can now see the status of active incidents in PagerDuty right from ServiceNow. With this new application agents can create incidents and view any notes or status updates made by development or ITOps teams to accurately and efficiently respond back to the end customer in PagerDuty from ServiceNow. This bridges the gap between Customer Service and Technical teams, engaging the right people in real time to get ahead of customer issues. Check us out in the [ServiceNow app store](https://store.servicenow.com/sn_appstore_store.do#!/store/application/2e31f90d1b7b11109aeeea4fad4bcb0f/1.0.0?referer=%2Fstore%2Fsearch%3Flistingtype%3Dallintegrations%25253Bancillary_app%25253Bcertified_apps%25253Bcontent%25253Bindustry_solution%25253Boem%25253Butility%25253Btemplate%26q%3Dpagerduty&sl=sh). **Schedules UI enhancements now GA** As of February 28, 2023 all users will see minor changes to Schedules including improvements to the UI and streamlined panels on the schedule details page. For any questions, please reach out to [support@pagerduty.com](mailto:support@pagerduty.com). **PagerDuty University Admin & Account Owner Permissions Course** Account Owners and Admins have special permissions that no one else has. Only they can add new users and update other users’ object roles, see how many full user licenses and stakeholder licenses are available in the account, among many other settings. Our [Admin & Account Owner Permissions Course](https://customerpdu.pagerduty.com/admin-account-owner-permissions) will teach you what these features are and how to manage their settings in PagerDuty. ## January 2023 **Status Update Notification Templates latest updates now generally available!** With organization-based templates, companies can now customize and standardize communications based on impact, service areas, and more. This functionality will be also available via API, so teams are able to customize and leverage status update notification templates to fit their needs in any context. Watch [this demo](https://pagerduty.wistia.com/medias/b16e9qojq5) to see the templates in action. **Custom Fields on Incidents Early Access Begins Next Week** Custom fields give users the flexibility to display critical information on incidents. Teams can aggregate data from several existing systems of record into a 360 degree view of incident response, reducing the time responders spend searching for key data, and ultimately lowering MTTR. Custom Fields on Incidents will be available on web and the API. Learn more in our [KB article](/incident-management/incidents/custom-fields-on-incidents) and sign up for [Early Access](https://www.pagerduty.com/early-access/). **Incident Workflows Generally Available Next Week** Get more flexibility and control over your incident response processes by reducing the manual work required to carry out the right response. Utilize a no-code/low-code builder to create unique Incident Workflows for any use case that trigger an orchestrated response using if-this-then-that logic. Incident Workflows are available to Business, Enterprise for Incident Management and Digital Operations (Legacy) plans only, and will fully replace Response Plays. Upgrade your Response Plays to Incident Workflows. Watch [the demo](https://pagerduty.wistia.com/medias/vhhvsoumql), read the [KB article](/ai-automation/automation/incident-workflows), and try out Incident Workflows–Generally Available next week! **Schedules UI enhancements coming soon** Beginning February 7, 2023, users will see minor changes to Schedules including improvements to the UI and streamlined panels on the schedule details page. For any questions, please reach out to [support@pagerduty.com](mailto:support@pagerduty.com). **New Login experience for PagerDuty** We are simplifying the login experience for PagerDuty, starting next week. You may notice changes to the login page, if you have any questions you can find the answers [here](/get-started/log-in-to-pagerduty). **PagerDuty Process Automation and Rundeck version 4.9.0** This release introduces the beta for Plugin Groups, which simplifies the configuration of plugins so users can build more automation faster. Now users have a graphical interface for configuring plugin properties at the project and system level using predefined sets of properties on a per plugin suite basis. Read the [release notes](https://docs.rundeck.com/docs/history/4_x/version-4.9.0.html) for more info. **Webhooks Public Certificates Expiry** The public certificate used by PagerDuty Webhooks will expire on January 8, 2023. If you have a process that relies on verifying the PagerDuty's Webhooks Certificate, please have your PagerDuty admin download and install the new certificate to avoid service disruptions. Please refer to this page to download a new certificate and for additional information about PagerDuty public certificates. Please contact [support@pagerduty.com](mailto:support@pagerduty.com) if you have additional questions. ## December 2022 **Product limit: Email subject line truncation** This change truncates reminder email subject lines to 250 characters or less. This will affect on-call reminders, incident alerts, and add responder requests. For any questions, please reach out to [support@pagerduty.com](mailto:support@pagerduty.com). **New mobile login experience** The login experience will begin with requiring you to enter your email address. Your email address will then drive the rest of the login experience, presenting the you with more streamlined and relevant options at every step. If you have additional questions, please contact [support@pagerduty.com](mailto:support@pagerduty.com). **Easier Allow-list Subdomain User Experience** Account Owners will be able to quickly change the behavior of the Email Domain Allow List in the Email Domain Restriction section. The new experience consists of the addition of an “Allow Subdomains” check box on the Account Settings page -- it will be unchecked by default. This default maintains the current functionality, which requires explicit enumeration of every sub-domain that needs to be allowed in the Email Domain Allow List. When the check box is checked however, only top level domains need be specified in the Allow List, and the sub-domains below them are automatically inferred. Please contact [support@pagerduty.com](mailto:support@pagerduty.com) if you have additional questions. **Generic Webhooks v2 EoL extension** Previously we had communicated that generic webhooks v2 would be deprecated at the end of March 2023. We have decided to postpone that date until further notice. It is important to remember that: 1. The end-of-support date that we initially communicated (October 2022) is still valid. This means that we no longer accept any new features requests for webhooks v2. 2. This extension does not apply to specific integrations (e.g. Slack) that have their own end-of-life schedule. Please refer to [this page](/integrations/webhooks) for more information about Webhooks. If you have additional questions please contact [support@pagerduty.com](mailto:support@pagerduty.com). ## November 2022 **The general availability of New Mobile Home Screen - November 14, 2022** The new PagerDuty Mobile Home Screen Experience puts "my open incidents" front and center, so the top recent incidents and related details are easily seen. Responders who want a broader awareness of digital operations can easily access non-incident information like on-call shifts and impacted technical services. This is just the latest in a series of new mobile app enhancements we've rolled out this year. You can learn more by reading [knowledge base article](/get-started/mobile-app/mobile-home-screen). **New product limit as of October 25, 2022: Max # Schedule Layers** The incident response product team is introducing a patch to a previously created product limit to our Schedule API. The Schedule API will no longer allow customers to add Schedules with more than 60 layers. Schedules that already have 60 layers will continue to be editable via the API as long as those updates do not increase the number of layers. This will not affect most customers. If you have any questions, please reach out to [support@pagerduty.com](mailto:support@pagerduty.com). **Expanded Incident Response Functionality in Microsoft Teams** Starting 11/9/2022 incident responders will soon be able to perform additional incident management actions from MSFT Teams, including: changing priority, reassigning, adding responders, escalating, and performing PagerDuty Automation Actions. You can read more about this features in this [blog](https://www.pagerduty.com/blog/Microsoft-Teams-new-features-Q4-CY2022). If you have any questions, please reach out to [support@pagerduty.com](mailto:support@pagerduty.com). **Sign up for Incident Workflows Early Access** Use a no-code/low-code builder to create customizable incident workflows that will reduce the manual work required to escalate, mobilize, and orchestrate the right incident response for any use case. Automatically trigger an orchestrated response using if-this-then-that logic to sequence common incident actions, such as adding a responder, subscribing stakeholders, or starting a conference bridge. To learn more, check out our [KB article](/ai-automation/automation/incident-workflows) and sign up for [Early Access](https://www.pagerduty.com/early-access/). **Product Launch** Everyone wants fewer incidents, faster resolution, and better customer experiences. But how can you get there? And soon. As the market leader on end-to-end incident response, we’ve released a new set of capabilities to help you do so. [Watch the webinar replay](https://www.pagerduty.com/resources/webinar/evolve-to-resolve-fewer-incidents-faster-response/) anytime for a deep-dive into these new updates, like: - Incident Workflows: Automate a series of steps during incidents (like setting up a Slack channel and notifying stakeholders), so responders don’t have to do it manually. - Status Pages and Notification Templates: Proactively communicate standardized operational updates to specific audiences in real time. - Flexible Time Windows for Intelligent Alert Grouping: Get more precision and greater flexibility when tuning out system noise during selected times. - Incident Response Ops Guide: We’ve collected our own learnings from years of incident reviews and process refinement in this refreshed reference guide. Let us know if you’re interested in joining our [Early Access Program](https://www.pagerduty.com/early-access/). ## October 2022 **Status Update Notification Templates latest updates now early access!** With organization-based templates, companies can now customize and standardize communications based on impact, service areas, and more. This functionality will be also available via API, so teams are able to customize and leverage status update notification templates to fit their needs in any tool or context. To be added to our early access list, please fill out [this form](https://www.pagerduty.com/early-access/). **The newest version of our Salesforce application is now available** PagerDuty's latest version of our Salesforce application, v3.7 is now available. Some benefits of this latest versions are: - Webhook Extension upgrade to PagerDuty webhooks v3 - This upgrade allows extensions to be added at the account level instead of the service level with webhooks v2 - New Salesforce Extension page and the ability to see what Salesforce accounts are connected to PagerDuty -Default Object mapping for the salesforce incident object with the standard integration -The ability to select if rulest actions should be limited to PagerDuty or Salesforce objects created as part of the ruleset flow. Visit our Salesforce integration guide for more details. If you have additional questions, please reach out to [support@pagerduty.com](mailto:support@pagerduty.com). **Operational Updates to Event Orchestration** Based on customer feedback, we’re launching updates to Event Orchestration to aid in overall ease of use, including: - Recent event view now includes the ability to select json payload objects and have them converted to EO rule conditions - Orchestration will aggregate all prior applicable rules for the selected rule, summarizing the relevant conditions as well as the actions that will be applied to ingested events - Page names will be standardized to better align with nomenclature in [PagerDuty Knowledge Base](/ai-automation/aiops/event-orchestration) **Product Notice: Event Rules EOL Delayed to April 2023** To give our customers more time to plan their migrations to Event Orchestration, we are delaying the End-of-Life for the Event Rules feature to April 2023. When this happens, we will auto-migrate any Event Rules over into Event Orchestrations, one-to-one. [Learn More](/ai-automation/aiops/migrate-to-event-orchestration) **Check out PagerDuty's new seamless solution for Automated Diagnostics for AWS** We just launched Automated Diagnostics for AWS in PagerDuty to help our customers quickly triage problems in AWS environments. This soliution consists of a seamless integration of Automation Actions and Runbook Automation connected to PagerDuty Incident Response and PagerDuty Event Orchesration. It provides prebuilt common diagnostics for frequently used AWS services, and an easy way to add your own diagnostics. Learn about the new solution [here](https://www.pagerduty.com/use-cases/automated-diagnostics/) **Updates to the PagerDuty Admin Experience Coming Soon** We have created a new experience for the user and subscription management pages. Account admins will now be able to quickly understand which licenses each user has been assigned and how many licenses of each license type have been deployed. You will see the following changes: • The Users List page will be the place where you manage user licenses. • Role assignment will no longer be available from the Individual User Details page. • On the Subscription Management page, the plan details and billing summary will show multiple base licenses where applicable. Your existing license assignments will not change. All corresponding updates to our APIs will be documented [here](/developer/api-changelog). We will roll out these changes gradually over the next 2 months. If you have additional questions, please contact [support@pagerduty.com.](mailto:support@pagerduty.com.) ## September 2022 **v1 Webhooks EoL (End of Life) is next month** This is a follow-up reminder to previous communications. The End of Life date for v1 Webhooks is 10/31/2022. This means: • You won’t be able to create new v1 Webhooks or use existing connections to v1 Webook extensions. • Apps or integrations that are using v1 webhooks will stop working. For more details and steps to migrate to v3 Webhooks please refer to this [page](/integrations/webhooks#migrate-from-v1v2-generic-extensions-to-v3-webhook-subscriptions). If you have additional questions, please reach out to [support@pagerduty.com](mailto:support@pagerduty.com). **New! Create and manage maintenance windows through PagerDuty Mobile App** Maintenance Windows feature for PagerDuty mobile app is generally available starting September 15th, 2022. Maintenance windows temporarily disables a service, including all its integrations, for a set period of time while it is in maintenance mode. Now, users away from their desk or office have the flexibility to create, update and delete maintenance windows through PagerDuty mobile app. You can learn more about the mobile maintenance window through [Knowledge Base Articles](/incident-management/services/maintenance-windows#maintenance-windows-in-the-mobile-app) or try it out by downloading [iOS](https://apps.apple.com/us/app/pagerduty/id594039512) or [Android](https://play.google.com/store/apps/details?id=com.pagerduty.android). **PagerDuty Process Automation 4.6.0 & Rundeck Community 4.6.0 is released** Check out the new features and enhancements for PagerDuty Process Automation (formerly Rundeck Enterprise) and PagerDuty Runbook Automation and Rundeck Community included in this release. This release includes a new plugin for AWS Athena that job definitions to include SQL queries against Amazon S3, an enhancement of the Amazon ECS node source plugin to handle multiple clusters within the same region, and a number of security and compliance updates, and bug fixes. View our [Twitch stream review](https://www.twitch.tv/pagerduty/schedule?seriesID=792f972e-f876-4135-b6c2-6ea30a5c0330) of this release live on Tuesday, Sept 13, at 10AM Pacific. View the release notes [here](https://docs.rundeck.com/docs/history/4_x/version-4.6.0.html). ## August 2022 **New Mobile Service Maintenance Window - Early Access** We will gradually release the new PagerDuty Mobile Maintenance Window for Early Access starting on August 23, 2022. The release of the mobile maintenance windows temporarily disables a service, including all its integrations, for a set period of time while it is in maintenance mode. Now, users away from their desk or office have the flexibility to create, update and delete maintenance windows through PagerDuty Mobile App. You can learn more about the mobile maintenance window through [Knowledge Base Articles](/incident-management/services/maintenance-windows#maintenance-windows-in-the-mobile-app) or try it out by downloading [iOS](https://apps.apple.com/us/app/pagerduty/id594039512) or [Android](https://play.google.com/store/apps/details?id=com.pagerduty.android). **New option to display PagerDuty on the sidebar for relevant projects for Jira Cloud customers, available in September.** - For new Jira Cloud customers, PagerDuty will not be displayed by default on the sidebar of all Jira Projects. - For existing Jira Cloud customers, JIRA project admins will have the ability to hide or display PagerDuty on the Jira sidebar per project. - If you have any questions, please reach out to your PagerDuty account team or Customer Support ([support@pagerduty.com](mailto:support@pagerduty.com)). **Annual marketplace app re-certification for Jira Data Center Integrations** We have officially re-certified our Jira DC (Data Center) integrations for another year, maintaining our DC Approved Status in the Atlassian marketplace. **Remedy Integration ownership transferred to KTSL** PagerDuty has handed the Remedy integration to a partner called KTSL who will take it over going forward. The integration is now built and supported by KTSL as outlined [here](https://www.pagerduty.com/integrations/ktsl-bmc-helix/). **New components now available on status.pagerduty.com** We have added several new components for customers to subscribe to on [status.pagerduty.com](https://status.pagerduty.com). Existing subscriptions will remain intact. These new components include: - Incident Timeline and Alert Logs - Services - Schedules and Escalation Policies - Users and Teams - Change Events - Business Services/Status Dashboard - Account Settings **PagerDuty App update in Salesforce appexchange.** There is a minor update to our [PagerDuty App](https://www.google.com/url?q=https://appexchange.salesforce.com/appxListingDetail?listingId%3Da0N3A00000FK9u7UAD&sa=D&source=docs&ust=1660251415562755&usg=AOvVaw2O38d8xPeT6_HvFDYNtKCT) in the Salesforce app exchange that improves the PagerDuty logs page with date filters as well as the logs that needed to be deleted thorough the delete interval on the on the PagerDuty configuration page. **Product Notice: Event Rules will EOL and migrate to Event Orchestration in January 2023 ** In order to deliver a robust and reliable experience for our customers, we will End-of-Life the Event Rules feature in January 2023. Don’t worry: In support of this EOL, we will auto-migrate any Event Rules you are using over as Event Orchestrations, one-to-one. From then on, you’ll be able to do everything in Event Orchestration that you can in Event Rules today. To learn more, visit PagerDuty's [knowledge base](/ai-automation/aiops/migrate-to-event-orchestration) or contact your account manager. **New Default iOS Notification Tone for “Add Responder” Requests** Starting on August 2, 2022 the iOS notification tone for “add responder” requests will change to make it more distinguishable from non-PagerDuty notifications. Previously, responder requests used the default iOS notification tone, but with this update, responder requests will use the “PagerDuty Alert” noise. If you have any questions, please reach out to your PagerDuty account team or [Customer Support](mailto:support@pagerduty.com). **Empowering Customer Service Agents with Automation** PagerDuty Automation Actions is now available within the PagerDuty application in Zendesk. With Automation Actions, agents can automatically validate problems and capture critical information instantly for the team to diagnose and resolve. Agents are empowered to validate customer-impacting issues and run automation actions directly from the PagerDuty app in Zendesk. To learn more, visit PagerDuty's [knowledge base](/integrations/zendesk-integration-guide/zendesk-user-guide) or contact your account manager. **Restricted Access Users can now manage Webhooks V3 for their teams** Restricted Access Users with a Manager Team Role, will now be able to manage Webhooks V3 integrations for their team(s). The operations team will no longer depend on Global Admins and Account Owners to manage its day-to-day operations. ## July 2022 **Service Standards now generally available to all customers** Use Service Standards to improve operational maturity and provide a better customer experience by establishing criteria that standardizes what ‘good’ looks like across teams. Configure services according to best practices and scale service ownership across the entire organization. To learn more, check out the [Knowledge Base article](/incident-management/services/service-directory#service-standards) or watch the [webinar on-demand](https://www.pagerduty.com/resources/webinar/how-to-standardize-service-ownership-at-scale-for-improved-incident-response/). ## June 2022 **PagerDuty for Google Chat is now available** PagerDuty for Google Chat was built by Google in tight collaboration with PagerDuty. PagerDuty for Google Chat enables incident responders to get notified, initiate resolution, and focus on the problem at hand without switching context from your Google Space. Learn more about PagerDuty for Google Chat by reading our [integration page](https://www.pagerduty.com/integrations/google-chat/). **The new minimum OS requirement for PagerDuty mobile app** We are introducing the new minimum OS requirements for PagerDuty mobile. The future versions of PagerDuty mobile app will require Android 9.0 and iOS 14.0 or later. This minimum change is to ensure our mobile users are getting: 1. Better data security for PagerDuty mobile 2. New and better mobile experiences on the latest operating system 3. Latest innovation by taking advantage of the most up-to-date devices and their capabilities. Please ensure your device is upgraded to the continue receiving mobile app updates. **PagerDuty Summit** We hope you could join us last week for PagerDuty Summit to hear about all of our product announcements. If you'd like to check out any of our sessions, or read deeper into our product announcements check out: - Our [launch blog](https://www.pagerduty.com/blog/summit-operations-cloud-product-updates/) with details on the highlights of the launch. - Replays of all of our [Summit sessions](https://pagerdutysummit.eventfinity.co/) - keynotes, customer sessions, and product deep-dives. - Our [What's New page](https://www.pagerduty.com/whats-new/) where you can see the launch details at a glance and express interest in participating in [early access](https://www.pagerduty.com/early-access/). **Restricted Access Users with manager permissions can now manage their Slack channel connections** PagerDuty customers on Next Generation Slack V2 on Webhooks V3 using the Restricted Access User (RAU) role with manager permissions can now manage their Slack channel connections. The Slack connection management page is accessible via the service page integration tab. When viewing that page, users will see all connections, but will only be able to edit the ones for which they have permission. **Customer Service Operations Release Notes** **_Salesforce_** Release notes for Version 3.6 of the PagerDuty for Salesforce service cloud application in [Salesforce appexchange](https://appexchange.salesforce.com/appxListingDetail?listingId=a0N3A00000FK9u7UAD). - The ability to [Edit](/incident-management/incidents/edit-incidents) incident details - Title and Priority, from the incident command console - The ability to view the information for a conference bridge and Join from the incident command console - The ability to [Run an Automation Action](/ai-automation/automation/automation-actions) from the incident command console - The ability to select an Automation Action as a ruleset action when creating a rule in Salesforce - The ability to view the output report for an automation action from the incident command console - The ability to schedule log delete duration between 1 and 90 days. The default duration remains 60 days. - Hard delete for PagerDuty logs. Logs will no longer be stored after they are deleted. - Reduced future Apex usage for rulesets processing. Future jobs will be scheduled for just events that match the rule conditions where there are rule actions to execute - each job will be processed individually. - Increase in log processing time out time from 30 seconds to 120 seconds. For more details, please read the [Salesforce Service Desk Integration Guide](/integrations/salesforce-service-cloud-integration-guide). **_Zendesk_** Release notes for the PagerDuty application in [Zendesk Marketplace](https://www.zendesk.com/marketplace/apps/support/218958/pagerduty/) The ability to [Edit](/incident-management/incidents/edit-incidents) incident details - Title and Priority, from the incident command console The ability to view the information for a conference bridge and Join from the incident command console The ability to view technical Incident details in the Status dashboard The ability to subscribe to technical incident details from the status dashboard For more details, please read the [Zendesk integration guide](/integrations/zendesk-integration-guide). **Terraform Support for Event Orchestration Now Live** Create, maintain, and update event orchestrations at scale using Terraform. Check out the [developer docs](https://registry.terraform.io/providers/PagerDuty/pagerduty/latest/docs/resources/event_orchestration). **Service Standards GA starts ramping on June 20th** Use Service Standards to improve operational maturity and provide a better customer experience by establishing criteria that standardizes what ‘good’ looks like across teams. Configure services according to best practices and scale service ownership across the entire organization. This feature will begin ramping to customers on June 20th and should reach all customers by mid July. Learn more about Service Standards [here](/incident-management/services/service-directory#service-standards). **Reauthorize Microsoft Teams Application** With PagerDuty’s authorization upgrade to [Curity](https://docs.google.com/document/d/1tam1fPx3GZWOHfa8HshZDmIyeNzP6f2tQ-GggLgOZIg/edit?usp=sharing), our integrations will begin automatically refreshing expired tokens on a bi-yearly basis. Before PagerDuty can begin auto-refreshing the tokens for our Microsoft Teams’ customers, some customers’ teams will need to be initially manually refreshed. You will receive an email about this if you are currently using [PagerDuty’s Microsoft Teams](https://www.pagerduty.com/integrations/microsoft-teams/) application for incident management and need to reauthorize your teams with old tokens. Action Needed: Perform reauthorization for PagerDuty application in Teams with expired tokens as soon as possible: 1. an instructional notification will be sent to the ‘general’ channel of all Teams with an old authorization token and 2. the Teams user that originally completed the app authorization will receive a direct message prompting them to reauthorize. Teams with old/expired tokens will no longer post incident notification into channels. Please reauthorize immediately to resume incident management in Microsoft Teams. The notifications will walk you through Option 1 in [Reauthorization Instructions](https://docs.google.com/document/d/1BC7FHLJNJbdHNi3KtZk1p0JYlQfoUit8FT3KwMjK9bs/edit#). Please Note: - You will only need to perform this action once; moving forward tokens will automatically be refreshed - Not all teams need to be reauthorized; if a team has an active token you will not be prompted and the application will refresh the token automatically. This update only impacts old expired tokens. Action Owner: PagerDuty Admins, Account Owners, and Managers have the appropriate permissions to reauthorize Microsoft team connections to PagerDuty. If you have any questions or concerns; please reach out to PagerDuty support for assistance. ## May 2022 **The refreshed Schedules List UI is now live** The Schedules List UI refresh is now generally available on all accounts. This new visual experience helps you find the information you need easier and faster while giving you more flexibility. Additionally, this page now allows for: - Enhanced search functionality - Toggling between all schedules and team schedules - Collapsing or expanding information based on the level of detail needed - Easier schedule comparison with time windows displayed - Streamlined view of on-call responders with shift times **Now ramping: Status update notification templates** [Status update notification templates](https://pagerduty.wistia.com/medias/utjcznrdsq) allow you to add the content and context you need for internal communications during incident response. Add logos and hosted third party images as well as format the text to company communication standards. Easily include incident details with a drop down menu that populates key information as needed. This feature has started ramping to customers and should reach all customers by mid June. **New SMS Formatting Standard for Incident Notifications** Starting May 23, PagerDuty will begin standardizing the way that incident notifications are formatted for SMS. Going forward, all SMS incident notifications (including status updates) will start with the prefix [PagerDuty]. Read the [Knowledge Base](/incident-management/communicate/communicate-with-stakeholders) article for more information. **New version of PagerDuty App for Splunk** The latest release of the [PagerDuty App for Splunk](https://splunkbase.splunk.com/app/3013/) (v 4.0.1) is now GA. **Maximum Open Incidents Per Service Set to 100K** There is a new product maximum of 100,000 open incidents allowed per service. With this change, services with over 100K open incidents will automatically have the [auto-resolve](/incident-management/services/configurable-service-settings#auto-resolution) setting enabled and set to 24 hours. This means that any new incidents on those services will be automatically resolved after they have been open for 24 hours and no further notifications will be sent for those incidents. Most customers will see no impact. If you do run into this, it’s important to note that too many open incidents on a service is an indicator that your PagerDuty configuration could be optimized. To reduce the open incident count, we recommend using the [update an incident API](/developer/api/reference/rest/incidents/update-incident) to bulk resolve incidents. Additionally, you can [use this script](https://github.com/PagerDuty/public-support-scripts/blob/master/mass_update_incidents/mass_update_incidents.py) for an automated way to bulk resolve incidents. **Update to Manage Incidents API** We’ve added two new product limits to the [manage incidents](/developer/api/reference/rest/incidents/update-incidents) endpoint to provide a better customer experience: - Maximum number of requests per minute to the endpoint will be limited to 500. - Maximum number of incidents that can be updated per API request will be set to 250 (previous limit was 500). We recommend that impacted customers update their scripts to disperse incidents updates out across a longer period of time. Please refer to our [API documentation](/developer/api/reference/rest/incidents/update-incidents) for more information. **Copy/Paste Event Orchestration Rules Now Available!** Users can now “copy” any Service Orchestration rule and then “paste” that rule into any Service Orchestration! With this feature, users can reuse rule conditions & actions, while still having the ability to tweak those conditions/actions for each specific service/orchestration. See the knowledge base article for [more information](/ai-automation/aiops/event-orchestration). **Event Orchestration + PagerDuty Automation Actions Integration** The integration between Event Orchestration and PagerDuty Automation Actions is live. By combining nested event orchestration with machine learning and precise, targeted automation triggers means that it’s possible to action an incident before responders even get paged. This integration helps teams automate common diagnostics and enable self-healing for recurring and well-understood types of incidents, resulting in reduced MTTR and escalations to specialists. To learn more, visit the [PagerDuty Knowledge Base](/ai-automation/aiops/event-orchestration#automation) . ## April 2022 **Safelist PagerDuty’s Webhooks IP Addresses** Starting on May 5, 2022, the official list of IP addresses that PagerDuty uses to send Webhooks calls will be provided on this [page](/developer/webhook-ips). Please safelist these IP addresses to ensure service continuity. **New AWS Plugins for Automated Diagnostics** By providing first-responders with diagnostic data that is typically only retrievable by domain-experts, the need to pull in more people for troubleshooting incidents is reduced significantly. New AWS plugins make it easier to get up and running with auto-diagnostics fast! Plugins with CloudWatch Logs retrieve diagnostic data from AWS infrastructure and applications. Systems Manager plugin allows users to manage their global VM footprint with security best-practices. [Request a demo](https://www.pagerduty.com/platform/automation/runbook/) to learn more. **Customer Service Operations Integrations April Release (Salesforce Service Cloud v 3.5 and 3.5.1)** All release notes for 3.5 and 3.5.1 apply to the PagerDuty for Salesforce Service Cloud application located in the [Salesforce AppExchange](https://appexchange.salesforce.com/appxListingDetail?listingId=a0N3A00000FK9u7UAD). - Integration with the new Salesforce Incident Management object. Bidirectionally integrate PagerDuty incidents with Service Cloud incidents, keeping both in sync and up to date. This feature also allows agents to [manually link a PagerDuty incident to a Salesforce incident](/integrations/salesforce-service-cloud-integration-guide/salesforce-service-cloud-user-guide). - Ability to [escalate](/incident-management/incidents/reassign-incidents#escalate-an-incident) PagerDuty incidents from the Salesforce command console. - Ability to [add subscribers](/incident-management/services/business-services/subscription#subscribe-users-and-teams-to-business-services) from the PagerDuty command console. - Ability to search for open incidents from the PagerDuty command console. This allows agents to quickly and easily link a Salesforce case to an existing PagerDuty Incident. - Enhanced PagerDuty [Ruleset](/ai-automation/aiops/rulesets) actions: - Ability to add a Salesforce user as an available dropdown option. - Ability to add subscribers in order to receive incident status updates. - Ability to automatically create a Salesforce incident after a PagerDuty incident is opened. - EU service region (v 3.5.1): - PagerDuty [service regions](/get-started/service-regions) allow customers to choose the geographic region of the PagerDuty data centers that host their account. Currently, the available options are the United States (US) and Europe (EU). For configuration details, please read the [Salesforce Service Desk Integration Guide](/integrations/salesforce-service-cloud-integration-guide). - Performance Improvements: - Ability to enable or disable case creation or case comment triggers. If disabled, this will reduce the number of triggers. This also allows greater flexibility for companies that want to perform custom actions before the rule engine is invoked. This feature is found in Salesforce under **PagerDuty Configuration** → **Object Mappings** tab. - Logging Improvements: - Improvements to reduce the number of logs created by the PagerDuty integration. - Log deletion queries now run once per day to delete logs more than 60 days old. This will help improve and mitigate past CPU and Disk usage issues. **Security Hygiene for the Current Cyber Threat Landscape** Given the current landscape, PagerDuty is preparing for increased instances of fraud and cyberattacks. Please take the necessary actions to protect your organization and users. Read about best practices to further secure your use of PagerDuty [here](/account-admin/security-hygiene-for-the-current-cyber-threat-landscape). **Action required by Account Owners– Email Domain Restriction verification** PagerDuty is changing the default setting for the “Email Domain Restriction” feature in the Account Settings, to be ON by default (the current setting is OFF) for those accounts where it has not been enabled. For existing customers, this will be automatically enabled by April 15, 2022. With this update, the email domains will be restricted only to domains that are owned by the account. Note that this applies only to login email addresses, and not contact method email addresses. The following exceptions apply to the automatic enablement of the Email Domain Restriction feature for existing customers: - Email addresses using common carrier domains (yahoo, gmail, aol etc.) will not be restricted. - The restriction will not be enabled for accounts with more than 10 email domains. Take Action: Account owners should please check that the settings, and email domains and subdomains are set appropriately for your needs. For further details on this topic, please refer to this [documentation page](/account-admin/account-settings#email-domain-restriction) **Action Required – Migration from V1 & V2 webhook extensions to V3 webhook subscriptions** If you are currently using V1/V2 webhook extensions in your PagerDuty environment you need to migrate them to V3 webhook subscriptions to maintain functionality. Please follow our [migration guide](/integrations/webhooks#migrate-from-v1v2-generic-extensions-to-v3-webhook-subscriptions). Who needs to take action? PagerDuty Admins, Account Owners and Team Managers. Important Dates: V1 webhook extensions became unsupported (no new features or bug fixes) on November 13, 2021 and will stop working in October, 2022. V2 webhooks extensions will become unsupported in October, 2022 and will stop working in March, 2023. Required Permissions: - Admins or Account Owners can migrate an entire account. - Team Managers can only migrate webhooks for their assigned Teams. **Improvements to the Business Service page** Find the business services you're looking for faster with improvements to the business service page. Now you can search for business services and navigate between pages to view the services you and your customers care most about. ## March 2022 **PagerDuty® Process Automation** We're excited to announce the latest offerings from our automation product line. We are officially rebranding our automation product line, Rundeck®, as PagerDuty Process Automation. Additionally, our runbook automation cloud service (announced last fall as “Rundeck Cloud”) is now generally available as PagerDuty Runbook Automation. Finally, we are announcing version 4.0 of Rundeck Enterprise, which will now be known as PagerDuty Process Automation On-Prem. The PagerDuty® Process Automation portfolio consists of the following offerings: - PagerDuty® Automation Actions. A PagerDuty add-on that curates and connects responders in PagerDuty to automated diagnostics and remediation for services involved in incidents. - PagerDuty® Runbook Automation. A SaaS service that enables engineers to standardize and automate runbook procedures, and delegate services as self-service operations. - PagerDuty® Process Automation On-Prem. A self-hosted software cluster that gives engineers the ability to standardize and automate end-to-end operational workflows, and safely delegate them as self-service operations to stakeholders. Watch our [launch webinar](https://www.pagerduty.com/resources/webinar/automate-it-processes-in-the-cloud-and-at-higher-scale/) where we dive into each feature. **Introducing status update notification templates!** Status update notification templates are now early access. This feature allows you to add the content and context you need for internal communications during incident response. As part of these new flexible templates, you can also add logos to your communications as well as format the text to company standards. If you are interested in being part of this early access program, fill out [this form](https://www.pagerduty.com/early-access/). ## February 2022 **Schedules List Page Improvements** The Schedules List page will be getting a UI refresh. This new visual experience helps you find the information you need easier and faster while giving you more flexibility. Additionally, this page now allows for: - Easier searching - Toggling between all schedules and team schedules - Filtering by variables like team, user, service, and more - Collapsing or expanding information based on the level of detail needed with compact and expanded view - Displaying time windows for all schedules on the page instead of advancing each schedule individually for easier schedule comparison - Streamlined viewing of who is on call and what their shift length is Early access rollout to accounts will begin February 21, 2022. To see the new Schedules List page in action, watch [this short demo](https://pagerduty.wistia.com/medias/6kjhg6hrkn). ## January 2022 **New Mobile Incident Details GA** The new mobile Incident Details screen provides you with a more compelling visual experience and easier access to all your favorite features during incident response. Run a play, add a priority or note, post a status update, and more with the new carousel. This improvement will be available to all customers by January 31, 2022. See what this looks like in action [here](https://pagerduty.wistia.com/medias/fwxtcvmiq9). **Event Orchestration now available: Reduce noise and automate more using nested rules** Say hello to the next generation of event rules. Cut down on manual event processing. With [Event Orchestration](/ai-automation/aiops/event-orchestration), you can create custom logic with nested rules to enrich, modify, and control routing or trigger automation actions based on event conditions at scale. Watch the [demo here](https://www.youtube.com/watch?v=dRMkuiAaBjM&feature=youtu.be), [read the knowledge base article](/ai-automation/aiops/event-orchestration), or [sign up for the webinar](https://www.pagerduty.com/resources/webinar/how-to-reduce-noise-and-manage-event-routing) to learn more about the feature on February 15. (This feature is only available to Event Intelligence; Enterprise for Incident Management and Digital Operations (Legacy) plans) **Round Robin Scheduling is now generally available** [Round Robin](/incident-management/schedules/round-robin-scheduling) allows teams to equitably distribute on-call shift responsibilities amongst team members. Automatically assigning new incidents across different users ensures that teams are resolving incidents as efficiently as possible with less risk of burnout. Round Robin is generally available for Business, Enterprise for Incident Management and Digital Operations (Legacy) plans. ## December 2021 **Mobile Incident Details is now Early Access!** Now in early access, the new mobile Incident Details screen provides you with a more compelling visual experience and easier access to critical features during incident response. Run a play, add a priority or note, post a status update, and more with the new carousel. Early access is available on iOS and Android to Free and Professional plans. If you have a Business, Enterprise for Incident Management or Digital Operations (Legacy) plan and would like to be part of early access, reach out to your PagerDuty account team. **PagerDuty Solution Guides for Business** Did you know that PagerDuty can be used by departments like marketing, sales, finance, and human resources? We're delighted to share some [guides](https://business-guides.pagerduty.com/?utm_source=release_notes&utm_campaign=solution_guides_business_launch_fy22q4&utm_content=release_guide_here) for handling common critical business functions with PagerDuty. You can view the solution guides here and the solution page [here](https://www.pagerduty.com/use-cases/business-ops/?utm_source=release_notes&utm_campaign=solution_guides_business_launch_fy22q4&utm_content=release_page_here). If you’d like to chat about how your team can make the most of this use case, reach out to your CSM. **Rundeck 3.4.7 - bug and security updates including Log4J CVE** Rundeck 3.4.7 is the last release of 2021, containing a number of fixes and security updates. Chief among these are updated packages that address the recent Log4j CVE. All users are recommended to update at their earliest opportunity. Read about it in the [release notes](https://docs.rundeck.com/3.4.x/history/3_4_x/version-3.4.7.html#overview). **New opportunity for design partnership!** In our latest project, PagerDuty is working on a way to onboard faster while establishing service ownership best practices organization-wide to help teams make the most of their PagerDuty experience. If you’re interested in partnering with us on this, please fill out [this form](https://docs.google.com/forms/d/e/1FAIpQLScor6jSAbCPdtBqI68J2356LkfjcGZ5468Zk_VCVDMYWpfU2w/viewform?usp=sf_link). ## November 2021 _Fall Product Launch Announcements_ We're excited to announce the following features. [Join us on November 18](https://www.pagerduty.com/resources/webinar/fall-launch-automate-incident-response-to-accelerate-critical-work/) for our launch webinar where we'll dive into each feature and take your questions live. Features announced as generally available: - [Probable Origin](/ai-automation/aiops/probable-origin) - Jumpstart your response efforts with an auto-generated list of likely incident origin points for faster resolution. - [Change Events & Change Correlation on Mobile ](/ai-automation/aiops/recent-changes#view-change-events-in-the-mobile-app) - Deliver machine-learning powered intelligence right to the palm of your hands. - [Dynamic Service Graph](/incident-management/services/service-graph) - Instantly discover, map, and visualize business and technical service dependencies across your digital ecosystem. - [Rundeck Actions](/ai-automation/automation/automation-actions) - Speeds up incident response through safe, role-based delegation of automation to responders. - [Global Search](/get-started/search) - Retrieve details about incidents, services, schedules, and alerts during both active incident response and moments of retrospection. Features launched in early access. [Let us know](https://www.pagerduty.com/early-access/) if you'd like to try out any of the features! - Event Orchestration - Cut down on manual event processing with a powerful decision engine, where teams can create custom logic to enrich, modify, and control routing based on event conditions at scale. - Auto-Pause Incident Notifications - Automatically remove unnecessary noise from flapping alerts with the click of a button. - Service Standards - Configure services with less toil for a coordinated and seamless incident response process. Easily audit current services for best practices and set standards at scale. - [Rundeck Cloud](http://www.rundeck.com/rundeck-cloud) - The SaaS version of Rundeck is the fastest and easiest way to automate and delegate self-service IT operations. ## October 2021 _[Global Search Generally Available October 19](/get-started/search)_ Find what you need faster using Global Search to retrieve details about incidents, services, schedules, and alerts during both active incident response and moments of retrospection. This feature is generally available to all PagerDuty plans starting October 19. Check out the KB article for more details. ## September 2021 _[PagerDuty App for Salesforce Service Cloud](https://www.pagerduty.com/blog/app-salesforce-service-cloud/)_ The PagerDuty App for Salesforce Service Cloud provides an integrated and native experience for customer service teams and their stakeholders. It integrates PagerDuty’s real-time customer service operations solution with Salesforce Service Cloud and builds on our existing integration with Slack, introducing Slack-first intelligent swarming for Customer Service teams. Learn more with the [Integration Guide](/integrations/salesforce-service-cloud-integration-guide). _[Announcing Rundeck 3.4.4](https://www.pagerduty.com/blog/whats-new-product-update-2021-09/)_ Rundeck released version 3.4.4 which includes exciting new features and enhancements including expanded cloud infrastructure plugins, a new UI-based Ruleset Designer, and a new, accessible color palette. ## August 2021 _[Runbook Automation](https://www.pagerduty.com/blog/whats-new-product-update-2021-08/)_ Rundeck 3.4.2 update has been released, including new features and enhancements to Rundeck Enterprise and Rundeck Community. _[Change Events in mobile](/ai-automation/aiops/recent-changes#view-change-events-in-the-mobile-app) - now generally available_ Change Events in mobile gives responders the critical information they need when they are on the go without access to their main device. It will be available in two areas—Incident Detail and Service Detail, which will display details for two recent change events. Change Events in mobile includes our recently launched [Change Correlation](/ai-automation/aiops/recent-changes#change-correlation) feature. _[Service dependencies in mobile](/incident-management/services/service-profile#service-dependencies-in-the-mobile-app) - now generally available_ Service dependencies in mobile help responders triage incidents with dependencies in the service profile by showing the full blast radius of an incident. They can be used to define other technical or business services that use your service or are used by your service. _[Service event webhooks](/developer/webhooks-overview) - now generally available_ Service change updates can now be received via webhook, allowing you to easily keep your systems in sync with service changes happening within PagerDuty. You can add service event type to an existing webhook subscription or create a new one to start receiving the service.created, service.updated, and service.deleted webhooks. _[New Services Profile fully replaced the Service Details Page](/incident-management/services/service-profile)_ As of August 31, 2021, the New Service Profile fully replaced the Service Details Page. New functionality includes viewing recent change events, adding and viewing dependencies and adding Runbooks or a communication channel to streamline incident response. _[Spotlight Recommendations Sunset](/get-started/pagerduty-outage-notifications)_ On August 2nd Spotlight Recommendations was sunset and is no longer accessible as part of Intelligent Dashboards. To see actionable recommendations for how to reduce noise and improve service configurations, use [PD Labs Recommendations](/incident-management/analytics/recommendations). _Create services with any variety of special characters in the name_ You can now create services with any special characters in the name (\*&/..$...). Provisioning services from external sources like ServiceNow can provision services as-is. _New integrations built by our partners made available to our customers_ - [Backstage](https://github.com/backstage/backstage/blob/master/plugins/pagerduty/README.md?) - with this integration you can see relevant PagerDuty information about an entity, such as the escalation policy or if there are any active incidents. - [Allma](https://support.allma.io/pagerduty) - with Slack-native integration allows you to create a workflow within Slack that acknowledges incidents. - [CloudCheckr](https://success.cloudcheckr.com/article/kkwxwsfocs-integrate-with-pager-duty) - this integration allows you to configure email notifications that can be received daily or any time there is a change to a Best Practice Check or alert. ## July 2021 _[Slack V2 Next Generation](/integrations/slack-integration-guide) - now generally available_ With the new one-click webhook migration, PagerDuty admins can now easily connect channels to PagerDuty teams and streamline their stakeholder communication. Teams can also reduce incident channel noise, based on priority and urgency. Responders can quickly collaborate and create an incident update from the Slack incident notification. Once an incident update has been created, stakeholders can keep tabs in a dedicated stakeholder channel. _[Change Correlation](/ai-automation/aiops/recent-changes#change-correlation)_ Change Correlation surfaces the changes that most likely caused an incident, so responders can eliminate irrelevant changes and identify the root cause quickly. _[Outlier Incident](/ai-automation/aiops/outlier-incident)_ Flag anomalous incidents using historical data, and identify them as rare, anomalous or frequent so responders can focus on issues that may be more challenging to resolve, or address frequent alerts for automated remediation and performance improvements. _[Custom Change Event Transformer ](/developer/custom-change-event-transformer)_ Turn any change event in any format from any of your integrated tools into a PagerDuty change event. Your responders will now have more context to know what changes occurred so they can find the root cause of incidents faster. _[Past Incidents on Mobile](/ai-automation/aiops/past-incidents#mobile-app)_ View past resolved incidents that have similar metadata and were generated on the same service as the current active incident. Get helpful context for accurate triage and to reduce resolution time. Responders can see whether they or someone on their team had been involved in a previous incident, when these types of incidents have happened, and dive into incident details to discover what remediation steps were taken in the past, all on their mobile device. _[Stakeholder Updates in ChatOps](https://www.pagerduty.com/blog/next-generation-chatops-slack/)_ Enable responders to provide incident status updates to subscribers and stakeholders without interrupting incident remediation. Adding Business Response functionality to Slack and MS Teams increases feature accessibility, promotes incident visibility, and minimizes context switching. _[Webhooks V3](/developer/webhooks-overview)_ Webhooks V3 provides a webhook format that is much smaller than previous formats to ensure the webhook will not grow arbitrarily large and can be processed quickly without the risk of getting dropped. Another exciting enhancement is that the status updates event type is now available with Webhooks V3. - Webhooks V1 and V2 are being deprecated on November 13, 2021 and March 31, 2022 respectively. Learn more about it [here](/integrations/webhooks). - Webhook delivery IPs are changing: Due to an infrastructure issue, one of our outbound webhook delivery IP addresses is changing on July 23, 2021. To ensure continued successful delivery of webhooks from PagerDuty and to learn more about this change, please see [this article](/developer/webhook-ips). ## June 2021 _[EU Service Region](/get-started/service-regions)_ We are delighted to announce that PagerDuty's EU service region is now generally available. This option enables our European customer base, including those in highly regulated markets such as financial services, public sector, and healthcare, as well as managed service providers (MSPs), to manage time-sensitive mission-critical work in their region. If you are an existing user, you will notice a change in your PagerDuty login experience: you will now need to select the service region in which your account resides prior to logging in. _[New Service Create Flow](/incident-management/services/services-and-integrations#create-a-service)_ Streamlines service setup in the UI. This simple and intuitive step flow guides all users, including those that are new or less familiar with PagerDuty, through the process of setting up a well configured service. Users will have the confidence that they've completed service set-up according to their configuration needs and that their service is ready to use. ## April 2021 _[Zendesk Status Dashboard](https://www.pagerduty.com/blog/customer-service-full-visibility/)_ We are delighted to announce a new Status Dashboard for the Zendesk Customer Service integration. The dashboard enables customer service agents to have real-time visibility into major incidents that are impacting their customers right within Zendesk, so they can proactively update customers when an incident occurs. _[Service Profile Enhancements](https://www.pagerduty.com/blog/whats-new-product-update-2021/)_ Now you can take action on incidents directly from the service profile to accelerate response, root cause analysis, and remediation activities. Perform bulk actions including acknowledge or resolve, search by incident ID, add and view change integrations, browse resolved incidents, view related escalation policies from the service profile header, and more. _[Past and Related Incidents API](https://www.pagerduty.com/blog/whats-new-product-update-2021/)_ Extract past and related incidents data via APIs and extend your Event Intelligence capabilities through our new APIs that enable you to connect and analyze all the incident data in your systems. Using an incident ID, you can receive past incidents to provide historical context and accelerate triage to build awareness of the full breadth of incident impact. _[Unfurling Analytics Insights Links in Slack](/incident-management/analytics/pagerduty-analytics-slack-integration)_ Users can now copy and paste the Curated Insights URL from PagerDuty Analytics into Slack and see the link preview directly within Slack (in both #channels and direct messages). Allowing the link to “unfurl” a visual directly in Slack makes report sharing easier and empowers more data-driven decision making and collaboration. ## March 2021 _[Add Responder Notification Rules](/account-admin/user-profile/notification-rules#when-someone-invites-me-to-respond-to-an-incident)_ High-urgency notification rules will now apply to both incident assignments and responder requests. Never miss a request and fail to join an incident during a response ever again! We're gradually releasing this to all PagerDuty customers until 15 April 2021. _[Custom Change Event Transformer](/developer/custom-change-event-transformer)_ Send change events from any system using our Custom Change Event Transformer. Turn an event in any format from your integrated tools into a PagerDuty change event with no additional infrastructure on your side. Responders will now have more context to know what changes occurred so they can find the root cause of incidents faster. _[PagerDuty’s ServiceNow Integration](/integrations/servicenow-integration-guide/servicenow-integration-details)_ PagerDuty's ServiceNow integration is certified for the Quebec release. PagerDuty’s integration with ServiceNow has now been certified to work with "Quebec". Quebec is scheduled for general availability this quarter. _[Webhook delivery IPs are changing](/developer/webhook-ips)_ Due to some infrastructure updates, some of our outbound webhook delivery IP addresses are changing on March 22, 2021. ## February 2021 _[Audit Trail Reporting UI](/incident-management/analytics/audit-trail)_ The new Audit Trail Reporting UI delivers reports for users, Teams, schedules, escalation policies, and services. Achieve compliance and stay aligned with policies by examining configuration history and audit records for the previous year, on demand and at any frequency. _[Change Events](/ai-automation/aiops/recent-changes): New Integrations_ PagerDuty fully integrates change events from the software delivery process (CI/CD pipelines) and code repositories, enabling visibility across changes to better understand their impact. Leverage this real-time context to immediately identify where changes have caused failures and predict what risk future changes could have across business-critical services. We’ve also added new integrations to further improve understanding around change impact for our customers. View the integration guides and support docs for these new change events integrations: [Ansible](https://docs.ansible.com/ansible/latest/collections/community/general/pagerduty_change_module.html), [Buildkite](https://buildkite.com/docs/integrations/pagerduty), [GitLab](/integrations/gitlab-changes), [Jenkins](/integrations/jenkins-changes), [Rundeck](https://docs.rundeck.com/docs/manual/workflow-steps/pagerduty.html#pagerduty-send-change-event), and [ServiceNow](/integrations/servicenow-integration-guide/servicenow-change-requests-integration-guide). [Start sending change events to PagerDuty](/ai-automation/aiops/recent-changes) and custom events through the [Change Events API](/developer/send-change-event) or navigate to **AIOps** → **Recent Changes** in PagerDuty. _[PagerDuty Amazon DevOps Guru Integration](https://www.pagerduty.com/docs/guides/amazon-devops-guru-integration-guide/)_ PagerDuty and Amazon DevOps Guru help operations teams improve visibility into their AWS ecosystem and AWS-based applications. Amazon DevOps Guru’s machine learning-enabled application health information and Simple Notification Service (SNS), together with PagerDuty’s capabilities, help teams get ahead of operational issues and prevent any negative impact to customers. ## January 2021 _[ServiceNow v7.5 Upgrade](https://www.pagerduty.com/blog/servicenow-integration-update-v7-5/) [Business+]_ We’ve expanded our CMDB capabilities even further by improving our service provisioning feature. Services can now be provisioned from ServiceNow into PagerDuty in any configuration desired, linking different custom relationships or utilizing the defined relationships in CMDB. We also launched system capabilities to support integrating a service’s change request information from ServiceNow into PagerDuty’s change events dashboards. _[Automated Triggers](/ai-automation/aiops/rulesets/rulesets-advanced-configuration#automated-triggers) [Digital Ops, EI add-on]_ Add custom webhook-based responses for events to trigger a remediation action or run diagnostics. Trigger with the push of a button on an incident, or configure it to auto-trigger when an incident starts. ## December 2020 _[Visibility Console 2.0 Updates](/incident-management/incidents/visibility-console)_ - [On-Call Responders Module (beta)](/incident-management/incidents/visibility-console#on-call-responders) [Digital Ops]\: Filter for escalation policies and find responders, along with their most relevant contact information, in the new On-Call Responders Module. - [Service Activity Module](/incident-management/incidents/visibility-console#services) [Business, Digital Ops]\: Expand your view within the Service Activity Module to see 7 days of incident activity across your digital operations. Investigate specific incidents with a detailed tooltip that shows total incidents for that block of time with links, titles, and urgencies. View more by clicking through to the specific incidents on that service. - [Incidents and Changes Timeline (beta)](/incident-management/incidents/visibility-console#incidents-and-changes-timeline) [Digital Ops]\: Discover potential contributing factors to incidents by investigating changes like deploys, code changes, or automation runs. Investigate how these changes affect incidents across services over time with the new Incidents and Changes Timeline Module. - [Incident Urgency Toggle and Bulk Actions](/incident-management/incidents/visibility-console#incidents) [Business, Digital Ops]\: Toggle between high urgency, low urgency, and all incidents in the Incidents Module. Acknowledge, resolve, or set priority on incidents from the Incidents Module to accelerate your incident management process from a centralized view. ## November 2020 _[Zendesk v3 Integration](https://www.pagerduty.com/integrations/zendesk/) [Professional+]_ The latest version of PagerDuty’s Zendesk integration is now available in the Zendesk Marketplace. It provides a bi-directional integration that enhances communication between engineering and support teams by giving visibility to high-impact incidents. Drive automated workflows in PagerDuty that can be run by support agents, and provide the right level of information back to customer service teams, so they can interact knowledgeably with customers. This integration is a key part of our PagerDuty for Customer Service solution. _[Dynamic Field Enrichment and Extraction](/ai-automation/aiops/rulesets/rulesets-advanced-configuration#dynamic-field-enrichment--extraction) [All plans]_ Arming responders with the right context will accelerate incident triage and prevent wasted time during an outage. That’s why we now allow you to add important context to your incident summary using alert content, so responders can act quickly. In addition to accelerating incident triage, manipulating alert format allows you to be more prescriptive when you group alerts based on alert content. _[Extended Acknowledgements Reduce Escalations](/incident-management/incidents/add-responders) [All plans]_ We’ve made it easier to ensure that responder requests get accepted and don’t escalate. Acknowledging an incident where you have a pending responder request will now _also_ accept the responder request. One click, two actions! Extended Acknowledgements are now generally available. _[Change Events](/ai-automation/aiops/recent-changes) [All plans]_ Send change events from a variety of systems to PagerDuty, so that responders and service owners can discover contributing factors that may have caused incidents and get to resolution faster. This includes code changes via a continuous software delivery process, like GitHub or GitLab, and infrastructure change orchestration systems like BuildKite or Relay by Puppet. _[On-Call Readiness Reports](/incident-management/schedules/readiness-reports) [All plans]_ Help properly set up teams so they can successfully deliver on their on-call responsibilities. Leverage these reports to improve your on-call posture and track your progress toward organizational readiness. Proper team assembly can reduce resolution times and improve your organization’s ability to respond to incidents. _[Add on-demand Microsoft Teams meeting to incidents](/integrations/microsoft-teams/microsoft-teams-user-guide#create-a-meeting-conference-bridge-from-microsoft-teams) [All plans]_ From within Microsoft Teams, you can now quickly add an on-demand/dynamic Teams meeting to a PagerDuty incident. _[Audit Trail API](/developer/api/reference/rest/audit/list-audit-records) [Business+]_ Get operational visibility and compliance to aid in understanding what changes were made that led to a missed incident. Previously, to investigate configuration problems, you needed to contact your PagerDuty account team or Customer Support. Now self-service PagerDuty audit functionality empowers you to examine service history and understand what’s going on at a larger scale. Administrators can access audit records for the previous year, on-demand and at any frequency, to comply with organization policy. _[Suggested Service Dependencies](/incident-management/services/service-profile#suggested-service-dependencies) [All plans]_ We now use machine learning to suggest dependencies between services to help you keep these relationships up-to-date as your infrastructure grows. This feature is available on the Impact tab of the service profile. _[Content Based Alert Grouping](/ai-automation/aiops/noise-reduction/alert-grouping/content-based-alert-grouping) [Digital Ops+, EI add-on]_ Building on the launch of Content Based Alert Grouping, we’ve improved ease of use by showing the most recent alerts and allowing you to directly select configured fields. _[Preview Intelligent Alert Grouping](/ai-automation/aiops/noise-reduction/alert-grouping/preview-intelligent-alert-grouping) [All plans]_ All accounts (including those without Event Intelligence, Enterprise for Incident Management or Digital Operations (Legacy) plans) can now preview how Intelligent Alert Grouping would have performed for a specific service over the previous 45 days. Preview Intelligent Alert Grouping can be found in the Alert Grouping section on a service's Response tab. ## October 2020 _[Service Level Event Rules API](/developer/api/reference/rest/services/create-service-event-rule) [All plans]_ You can now perform CRUD actions on your service rules via API. Note that APIs have already been available for Global rules. _[Multiple Overrides](/incident-management/schedules/my-on-call-shifts#multi-overrides-tool) [All plans]_ Now you can select a range of dates for which you're on-call and easily create overrides for all of them with one action. _[Content-based Alert Grouping (v1)](/ai-automation/aiops/noise-reduction/alert-grouping/content-based-alert-grouping) [Digital Ops +, add-ons]_ If you work with predictable, homogenous alert data, you can now customize how alerts are grouped without having to train the algorithm on your specific data. This allows you to configure grouping based on your preferred, user-defined fields (multi-select). Alerts that share an exact match on the selected field will be grouped together into the most recent open incident. _[Visibility Console](/incident-management/incidents/visibility-console) [Business+]_ If you’re on the Business Plan, you now have access to a version of the Visibility Console that allows for a single dashboard. The Visibility Console provides an interactive view of your digital operations to provide everyone on your team with information about your systems and their health at any time. For example, your teams can use the dashboard to prepare for an upcoming on-call shift, coordinate a number of ongoing incidents, and mitigate risks before a time-sensitive, critical business event. ## September 2020 _[Technical Service Dependencies for Triage](/incident-management/services/service-dependencies#view-technical-service-dependencies-in-an-incident) [All plans]_ A streamlined interface for rapid definition and mapping of upstream/downstream technical and business service dependencies and relations between them, with low-effort maintenance. Technical service dependencies are highlighted directly on the Incident Details page during triage to provide situational context, help teams collaborate quickly, and take the right actions to resolve issues. _[Dependency-Aware Related Incidents](/ai-automation/aiops/related-incidents#dependency-aware-related-incidents) [All plans]_ Technical service dependencies are suggested via machine learning, and like user-defined dependencies, are highlighted directly within the Incident Details page during triage to help teams avoid blind spots, and expedite incident resolution. _[ServiceNow Integration v7](/integrations/servicenow-integration-guide) [Business, Digital Ops]_ The updated ServiceNow integration helps customers get more value from their investments in ServiceNow and PagerDuty by leveraging new, bi-directional functionality like running a PagerDuty response play in ServiceNow, or posting a Call to Action from ServiceNow to the PagerDuty Incident details page, providing users with live status updates. Additionally, both business and technical service dependencies from ServiceNow's CMDB can be shared with PagerDuty's service directory, allowing teams to more clearly understand the impact of incidents and identify critical services. _[Paused Incident Notifications](/ai-automation/aiops/noise-reduction/auto-pause-incident-notifications) [Enterprise for Incident Management, Digital Operations (Legacy), Event Intelligence add-on]_ Reduce operational noise by delaying triggers, giving machines a chance to auto-remediate before notifying responders. Customers can keep an audit trail of triggers and actions, regardless of whether a responder was notified. _[Zoom Conference Integration](/integrations/zoom-integration-guide)_ Make collaboration in a distributed environment fast and easy by giving response teams the ability to quickly add on-demand, dynamic video conference bridges to their PagerDuty incidents. _[Status Update Notification Preferences](/account-admin/user-profile/notification-rules#when-an-incident-i-am-subscribed-to-has-a-status-update) [Business, Digital Ops]_ Increase stakeholder engagement and business service subscriptions by giving business users complete control over the notifications they want to receive for critical updates. Now users can determine the number of times they are notified and the channels by which they occur. _[Visibility Console Service Activity Module](/incident-management/incidents/visibility-console#service-activity) [Digital Ops]_ Help NOC teams increase operational visibility by surfacing patterns in service activity —and their scale— across the entire digital operations portfolio. ## August 2020 **Improvements** _Aug. 14 — [Paused Incident Notifications](/ai-automation/aiops/noise-reduction/auto-pause-incident-notifications)_ As a new [Rulesets](/ai-automation/aiops/rulesets) feature, paused incident notifications allows rules to be set to create alerts, but pause incident creation and notifications for a predefined amount of time. During the pause period, new alerts will be viewable in the [Alerts table](/incident-management/incidents/alerts/alerts-table#suspended-alerts) with a Suspended status. These suspended alerts have new actions, allowing users to Trigger an incident from the alert during the pause period, or Resolve the alert, preventing the incident and its notifications from being created altogether. _Aug. 4 — [Visibility Console: Service Activity Module](/incident-management/incidents/visibility-console#service-activity)_ The Service Activity module allows users to see incident activity across a multitude of their services at once, so that they can quickly understand their digital operations health, and identify if there’s a widespread major incident. It is ordered by most recently impacted service and will reorder itself when new incidents are triggered. It has different time windows so eyes on glass teams can monitor their digital operations in real-time, but can also see service activity in the last 24 hours. This module can be filtered to any set of teams and services. _Aug. 21 — [Status Update Notification Preferences](/account-admin/user-profile/notification-rules#when-an-incident-i-am-subscribed-to-has-a-status-update)_ Configure notification preferences for status updates when [subscribed](/incident-management/communicate/communicate-with-stakeholders#add-subscribers-to-an-incident) to an incident. **Integrations** _Aug. 21 – [ServiceNow Integration Update](/integrations/servicenow-integration-guide)_ The updated ServiceNow Integration allows users to run Response Plays, post status updates and set the impacted Business Service on a PagerDuty incident all from the ServiceNow interface. Administrators can perform Assignment Group and priority mapping to PagerDuty escalation policies and provision Business and technical services along with their dependency relationships. Additionally, this version allows users to author custom code for outbound REST API calls and it comes with MID server support. ## July 2020 **New Features** _Jul. 23 — [My On Call Shifts](/incident-management/schedules/my-on-call-shifts)_ My On-Call Shifts allows users to view their shifts across all escalation policies and schedules in a single, easy-to-use view. This feature displays if a user is on call now, a list of their associated shifts and what their schedule is for the upcoming weeks and months. Users can now easily create override shifts across multiple schedules because all of the shifts are accessible in one place. My On-Call Shifts is also available as a widget on the right side of the Incidents page, displaying their current shift, and when they are on call next. **Improvements** _Jul. 31 — [New Visibility Console](/incident-management/incidents/visibility-console)_ The newly redesigned Visibility Console provides users with the single pane-of-glass experience to effectively monitor their digital operations in real time. This feature provides Central Ops / NOC teams and technical stakeholders with context on their technical environment at a glance, allowing them to quickly understand the health of their digital operations. _Jul. 15 — [Dependency-Aware Related Incidents](/ai-automation/aiops/related-incidents#dependency-aware-related-incidents)_ To help responders gain better understanding of the breadth and scope of incident impact, we’ve enhanced PagerDuty’s Related Incidents capability set with Dependency-Aware Related Incidents to provide real-time, contextual insights across multiple services and teams. When two incidents are triggered within five minutes of each other and one service is directly dependent on the other, these incidents will be marked as related. Similarly, if incidents occur within this time frame and share a parent Business Service, they will also be marked as related. These service relationships will be identified in the Dependency pane on individual Related Incident cards. _Jul. 10 — [Analytics API](/developer/api/reference/rest/analytics/get-analytics-metrics-incidents-all)_ With our new Analytics API, users can get incident data aggregated from all incidents, or from services and Teams. Additionally, users can get raw data on multiple and single incidents. ## June 2020 **Improvements** _Jun. 23 — [Extensions API: Re-enable Extensions](/developer/api/reference/rest/extensions/enable-extension)_ With our Extensions API, users can now re-enable [extensions](/integrations/extensions) outside of the PagerDuty web app. _Jun. 1 — [Response Plays API](https://developer.pagerduty.com/api-reference/reference/REST/openapiv3.json/paths/~1response_plays/post)_ With our API for Response Plays, users can create, read, update, and delete [Response Plays](/ai-automation/automation/incident-workflows) without having to log into the PagerDuty web app. Fully interact with Response Plays from your preferred interface, whether it be an ITSM tool like ServiceNow or a custom interface. **Integrations** _Jun. 3 — [Splunk Integration Update](https://www.pagerduty.com/docs/guides/splunk-integration-guide/)_ The updated Splunk integration allows users to customize data that is sent from Splunk to PagerDuty. The integration also includes upgrades to support new Splunk 8 requirements. _Jun. 2 — [Microsoft Teams Integration Update](/integrations/microsoft-teams)_ The updated Microsoft Teams integration allows responders to view critical incident details within Teams. They can also acknowledge, resolve, trigger and add notes to incidents, all from one interface. _Jun. 1 — [Jira Server Integration Update](/integrations/jira-server)_ The updated Jira Server and Jira Data Center integration includes a suite of features that allows users to coordinate incident response right from Jira issues using the PagerDuty sidebar. Organizations can drive synchronization and collaboration between teams with complex workflows, and map users and accounts across PagerDuty, Jira Server and Data Center. ## May 2020 **Improvements** _May 21 — [Service Profile](/incident-management/services/service-profile)_ The new Service Profile streamlines all service configurations onto an easy-to-edit page. Responders can clearly see maintenance windows, and filter them based on status. Users can add metadata like runbooks and a communication channels to a service. Having this for as a resource on a service eases the incident triage and response process while also encouraging users to reference Services as a source of truth for their business. The Service Profile includes new metadata for services: a documentation link (use this for a wiki link, an FAQ, or a runbook), a communication chat channel (not a notification path, but helpful for finding out where a team is discussing operations issues), and (drumroll please... ) the impact tab with service dependencies. _May 14 — [Status Update Branding](/incident-management/communicate/internal-status-page#status-update-branding)_ Users who wish to change the logo that appears in status update emails may now upload a custom logo. ## April 2020 **New Features** _Apr. 23 — [Intelligent Dashboards: Service Health Dashboard](/incident-management/analytics/dashboard)_ The Service Health dashboard allows for the discovery of services that drive incidents and cause increased team response effort. Detailed performance views for each service are provided to show impact of interruptions, how teams respond to incidents, and performance details by incidents and team metrics. This feature allows service owners to make key decisions on where to allocate resources, make investments and drive continual service health improvement. _Apr. 1 — [Related Incidents](/ai-automation/aiops/related-incidents)_ The Related Incidents feature provides incident responders with the suggested 20 most recent related incidents that are impacting other responders and PagerDuty services. This feature uses a completely online and real-time machine learning algorithm to provide these insights, giving responders an at-a-glance-view of the full breadth and scope of incident impact. Related Incidents extends our machine learning capabilities beyond noise reduction, enriching incidents with deep contextual insights to help responders coordinate an effective team response and mitigate business disruption. **Improvements** _Apr. 15 — [Business Services API](/developer/api/reference/rest/business-services/list-business-services)_ Admins and service owners can now use the Business Services API to automate how they define and update business services using scripts, Terraform, or other tools. _Apr. 15 — [Business Services: Team Permissions](/incident-management/services/business-services)_ Business services can now be added to a specific team, allowing team managers to create, edit, and update business services. Existing business services that are not associated to a team are globally viewable and editable by Global Admins and Account Owners. _Apr. 6 — [Rulesets API](/developer/api/reference/rest/rulesets/create-ruleset)_ Users now have full API access to global rulesets. New functionality includes partial updates and rule ordering. _Apr. 6 — [Live Call Routing: Option to Resolve Incident When Responder Ends Call](/integrations/live-call-routing)_ Users now have the option to configure whether or not the corresponding PagerDuty incident is resolved after the responder ends the incoming call. _Apr. 1 — [Past Incidents](/ai-automation/aiops/past-incidents)_ Similar Incidents has been renamed as Past Incidents to differentiate it from the Related Incidents feature. More information on the difference between these features is available in [this FAQ](/ai-automation/aiops/related-incidents#related-incidents-vs-past-incidents-whats-the-difference). ## March 2020 **Improvements** _Mar. 30 — [Live Call Routing: Upload Your Own Audio Message](/integrations/live-call-routing#upload-your-own-audio-message)_ Customers who prefer to record their own Live Call Routing greeting may now upload their own MP3 audio file instead of using an automated message. ## February 2020 **Integrations** _Feb. 25 — [Salesforce Cloud Integration: v2 Update](/integrations/salesforce-service-cloud-integration-guide)_ The new Salesforce Cloud integration allows users to integrate any standard Salesforce object with PagerDuty. Responders can now take advantage of expanded PagerDuty actions, such as setting urgency, adding responders, incident reassignment and running response plays by setting predefined rules and actions within the Salesforce interface. PagerDuty can also send information to Salesforce Cloud by defining evaluation criteria against the updates made in PagerDuty and designating actions to be performed in Salesforce Cloud. ## January 2020 **Improvements** _Jan. 16 — [Rulesets](/ai-automation/aiops/rulesets)_ The new Rulesets feature is an extension of our legacy Global Event Rules feature. With Rulesets, users can route events to an endpoint and create collections of event rules, which define sets of actions to take based on event content. Accounts with Free, Starter and Team plans will have access to a single global ruleset, while Business, Enterprise for Incident Management and Digital Operations (Legacy) plans will now have the ability to create multiple global rulesets. For these higher-tier plans, each ruleset will have an individual endpoint and they can be associated with specific Teams, giving Team Managers edit-access to their rules. On all plans, Rulesets also expands actions available for service event rules. ## December 2019 **Improvements** _Dec. 2 — [Service Directory: Search by Integration Key](/incident-management/services/service-directory#search-by-integration-key)_ The Service Directory now allows users to search by integration key, returning a list of services where the key is configured. ## November 2019 **New Features** _Nov. 19 — [Offboarding](/account-admin/manage-users/offboarding)_ The offboarding feature allows administrators to easily deprovision users from their associated escalation policies, schedules and assigned incidents. When offboarding a user, a Global Admin or Account Owner can review their associated escalation policies and schedules, sending notifications to the user’s Team Manager that they need to be replaced by another user on those objects. Administrators can also reconcile triggered and/or acknowledged incidents that were assigned to the offboarded user by reassigning them to their affiliated escalation policy or resolving them. This feature is available to accounts with [Advanced Permissions](/account-admin/advanced-permissions). _Nov. 11 — [PagerDuty Analytics: Intelligent Dashboards](/incident-management/analytics/dashboard)_ Intelligent Dashboards measure the impact of real-time work on teams and business objectives, promoting continuous improvement in digital operations towards greater success. Digital business leaders can use flexible data visualizations to compare key metrics to industry benchmarks or teams to company averages. After making improvements in training, processes and technology investments, leaders can then monitor the performance of Teams and Services and ensure they are trending in the right direction. Intelligent Dashboards is available with the purchase of the [PagerDuty Analytics](/incident-management/analytics/pagerduty-analytics-slack-integration) product. **Improvements** _Nov. 11 — [Operational Reviews: Edit Scorecards](/incident-management/analytics/operational-reviews#edit-reviews)_ Default Team On-Call Handoff Review scorecards now allow you to edit the number of weeks, days of the week, and hour of day that they are generated. Custom scorecards of any type now allow you to edit any aspect of the scorecard that was customizable when created. ## October 2019 **Improvements** _Oct. 24 — [Service Directory: Filter by Business Service](/incident-management/services/service-directory#business-service)_ In the Service Directory, users can now search for technical services associated with Business Services with a Business Service filter. ## September 2019 **New Features** _Sep. 26 — [Service Directory](/incident-management/services/service-directory)_ The Service Directory allows everyone to search for the services they go on call for and learn more about the other services in their organization. The Service Directory is a searchable, high-level aggregate view of all the services your organization has represented in PagerDuty and their corresponding owners. From the Service Directory, you can dive into each individual service to learn more about it, make changes to the settings or metadata, and take further action. This feature replaces the old Services list view. **Integrations** _Sep. 25 — [Slack Integration: v2 Update](/integrations/slack-integration-guide)_ The v2 update to our Slack integration includes new incident response capabilities: [trigger](/incident-management/incidents/overview#triggerdeclare-an-incident) and [escalate](/incident-management/incidents/reassign-incidents#reassign-an-incident) incidents and run [response plays](/ai-automation/automation/incident-workflows) from Slack. Users will now be able to create on-demand Slack channels from PagerDuty incidents. Additionally, the new Slack integration has improvements such as an updated notification design with more context from monitoring tools, and actions that respect PagerDuty [user permissions](/account-admin/user-roles). _Sep. 25 — [Zendesk Integration: v2 Update](/integrations/zendesk-integration-guide)_ The v2 update to our Zendesk integration uses Extensions, Targets and Triggers to send Zendesk Support Ticket events to PagerDuty, triggering incidents. This update allows users to view, create and link PagerDuty incidents from the Zendesk interface, so the proper responders can be notified of critical customer issues. _Sep. 25 — [Salesforce Service Cloud Integration](/integrations/salesforce-service-cloud-integration-guide)_ The new Salesforce Service Cloud integration allows users to customize when the proper on-call team should be notified about Salesforce Service Cloud cases and it allows for exception case routing. Users can create and/or update the Service Cloud case with relevant information as soon as there’s a PagerDuty update such as an acknowledgement, resolution, reassignment, etc. This integration includes synced notes between PagerDuty and Salesforce Service Cloud, so Customer Service teams can provide relevant updates to customers. ## August 2019 **New Features** _Aug. 8 — [Email Domain Restriction](/account-admin/account-settings#email-domain-restriction)_ Admins and Account Owners can now choose to restrict users to only use domains that are in the Email Domain Allow List when they change (or create) their login or contact email addresses. The restriction applies to users when updating future email addresses; existing email addresses will continue to function. **Improvements** _Aug. 30 — [Contextual Search - API Endpoints](/developer/api/reference/rest/tags/list-tags)_ New API to manage, assign, and list Tags. A tag can be assigned to Escalation Policy, Team or User, and searches for those objects can be filtered to retrieve those with specific tags. _Aug. 23 — [Operational Reviews: Scorecard Subscribe/Unsubscribe](/incident-management/analytics/operational-reviews#subscribe-or-unsubscribe-from-a-review)_ By default, users see scorecards only for the teams they are on. With subscribe/unsubscribe, users can find scorecards for teams they care about but aren't members of, and allows them to hide scorecards they don't want to see anymore. _Aug. 1 — [Operational Reviews: Scorecard Search](/incident-management/analytics/operational-reviews#search-for-a-review)_ Each list of Team On-Call Handoff, Service Performance and Business Performance review scorecards has a search capability. For users who have many scorecards in their list, the search allows them to find specific scorecards quickly. ## July 2019 **New Features** _Jul. 25 — [Status Dashboard](/get-started/mobile-status-dashboard)_ PagerDuty’s status dashboard provides technical responders, business responders, and leaders a live, shared view of system health to improve awareness of operational issues. It displays the current status of key business services and sends notifications to alert users when business services are impacted. This feature improves communication between response teams and stakeholders during incidents. **Integrations** _Jul. 16 — [Amazon EventBridge](/integrations/amazon-eventbridge-integration-guide)_ With Amazon EventBridge, PagerDuty customers are able to leverage the full breadth of AWS-supported integrations and functionality. When a PagerDuty incident is created or updated, an event or webhook can be sent to notify a designated Event Source in your AWS Account and Region. One can create an Event Bus to retrieve these notifications and deliver them to an AWS target such as Lambda to run a specific function, workflow, SNS topic for another notification delivery, etc. _Jul. 10 — [ServiceNow: v6 Update](/integrations/servicenow-integration-guide)_ Teams are now able to [drive a coordinated response](/incident-management/incidents/add-responders), [add multiple responders](/incident-management/incidents/add-responders) and [add conference bridge](/incident-management/incidents/conference-bridge) information to an incident from the ServiceNow interface. Admins and Account Owners can configure how different [priorities](/incident-management/incidents/incident-priority) should notify responders by mapping a Priority level to a PagerDuty Urgency level (Example: P1 incidents can call responders and P3 incidents can email). They can also customize data sent from ServiceNow to PagerDuty when creating an incident, and easily add Assignment Groups or Users. ## June 2019 **New Features** _Jun. 22 — [One Touch to Join Conference Bridge](/incident-management/incidents/conference-bridge#one-touch-to-join-conference-bridge)_ The One Touch To Join Conference Bridge feature enables rapid response team assembly by giving responders a push-button means of joining a conference bridge. This feature relies on two existing [Modern Incident Response](/incident-management/incidents/add-responders) features: [Conference Bridge](/incident-management/incidents/conference-bridge#create-a-service-level-conference-bridge) and [Add Responders](/incident-management/incidents/add-responders). **Improvements** _Jun. 28 — [PagerDuty Analytics: Scorecard Search](/incident-management/analytics/operational-reviews)_ A new search capability for the list of Team On-Call Handoff, Service Performance and Business Performance review scorecards. For users who have many scorecards in their list, the search allows them to find specific scorecards quickly. **Integrations** _Jun. 19 — [AWS Security Hub](/integrations/aws-security-hub-integration-guide-pagerduty)_ The AWS Security Hub integration allows you to send AWS Security Hub Findings to PagerDuty and use the PagerDuty platform to manage, organize, and respond to events relevant to your organization. ## May 2019 **New Features** _May 8 — [Contextual Search - Tagging](/account-admin/tagging)_ Managers, Admins, Global Admins and Account Owners can now add tags to the following PagerDuty objects: Teams, Escalation Policies and Users. Adding this simple metadata provides extra context to help Responders and Managers organize and navigate to desired objects and easily reassign incidents. **Improvements** _May 31 — [Manage Your User Sessions - API Endpoints](/developer/api/reference/rest/users/delete-user-sessions)_ New API endpoints to retrieve and delete user sessions. These can be used as part of an offboarding flow to ensure users are securely removed from all of their PagerDuty sessions. ## April 2019 **Integrations** _Apr. 14 — [Cherwell Integration](https://www.pagerduty.com/docs/guides/cherwell-integration-guide/)_ The bi-directional Cherwell ITSM integration allows for advanced notification when incident tickets are created. ## March 2019 **Improvements** _Mar. 1 — [Subscribe to Business Service Notifications](/incident-management/services/business-services#create-a-business-service)_ Users with [Visibility](/incident-management/incidents/visibility-console) and [Modern Incident Response](/incident-management/incidents/add-responders) can now subscribe to be proactively notified about business service disruptions and responder updates via [response plays](/ai-automation/automation/incident-workflows). ## February 2019 **New Features** _Feb. 7 — [Event Intelligence: Preview Intelligent Alert Grouping](/ai-automation/aiops/noise-reduction/alert-grouping/preview-intelligent-alert-grouping)_ Service owners can now preview potential noise reduction and grouping behavior before activating [Intelligent Alert Grouping](/ai-automation/aiops/legacy-event-intelligence). **Improvements** _Feb. 15 — [Stakeholder Notifications for Business Services](/incident-management/services/business-services)_ Business stakeholders can be automatically notified when a business service goes from healthy to disrupted by connecting a [response play](/ai-automation/automation/incident-workflows) to a [business service](/incident-management/services/business-services). This feature is only available with the [Modern Incident Response](/incident-management/incidents/add-responders) package. ## January 2019 **New Features** _Jan. 31 — [PagerDuty Analytics: Operational Reviews](/incident-management/analytics/operational-reviews)_ The Operational Reviews feature offers metrics for three different types of reviews, targeted at different levels of leadership in a digital business. The Business Outcomes, Service Performance and Team On-Call Handoff reviews contain scorecards intended to drive meetings and provide insight into the business impact of real-time operations. **Improvements** _Jan. 30 — [Recurring Event Rules](https://support.pagerduty.com/docs/global-event-rules#section-recurring-event-rules)_ Recurring Event Rules allow Admins to set events to follow particular rules during specific hours of the day or day(s) within a week on an automatic, weekly recurring schedule. This feature is integration-specific and one can make additional changes, such as changing severity/priority, based on time of day. ## December 2018 **Improvements** _Dec. 1 — [Intelligent Alert Grouping Update](/ai-automation/aiops/noise-reduction/alert-grouping/intelligent-alert-grouping): Grouping Frequency_ Alerts that are new to a service and are seen in a short time period will be grouped together more frequently. This will reduce noise and responder alert fatigue. ## November 2018 **Improvements** _Nov. 1 — [Events API Update: Rate Limit Increase](/developer/introduction)_ The Events API rate limit has been increased to 120 events/min for Starter, Team, and Business plans. Customers who require a higher rate limit for Global Event Rules may submit a request to be approved on a case-by-case basis. This increase can help facilitates the management of even higher volumes of operational data from noisier tools. **Integrations** _Nov. 26 — [PagerDuty + AWS CloudTrail Integration](/integrations/aws-cloudtrail-integration-guide)_ New native integration with AWS CloudTrail. Customers can route CloudTrail events to PagerDuty for real-time response. _Nov. 26 — [PagerDuty + Amazon CloudWatch Integration Update](/integrations/amazon-cloudwatch-integration-guide)_ Updates to our existing Amazon CloudWatch integration. We now support CloudWatch Events and Alarms. This update also enables customers to use CloudWatch with Global Event Rules. _Nov. 26 — [PagerDuty + AWS Personal Health Dashboard Integration](/integrations/aws-health-dashboard)_ New native integration with AWS Personal Health Dashboard. Customers can route Personal Health Dashboard events to PagerDuty for real-time response. _Nov. 26 — [PagerDuty + Amazon GuardDuty Integration](/integrations/aws-guardduty-integration-guide)_ New native integration with Amazon GuardDuty. Customers can notify the right people about critical security issues for real-time response. ## October 2018 **Improvements** _Oct. 1 — [Global Event Rules Update: API](/developer/global-event-rules-api)_ An API designed to help admins and developers automate the management of their Global Event Rules. **Integrations** _Oct. 1 — [Pivotal Cloud Foundry Integration](https://www.pagerduty.com/docs/guides/pivotal-cloud-foundry-integration-guide/)_ The Pivotal integration allows development teams to quickly onboard with a basic setup of critical PagerDuty components. _Oct. 1 — [Microsoft SCOM Integration](https://www.pagerduty.com/docs/guides/scom-integration-guide-2016/)_ The Microsoft SCOM integration allows customers to route infrastructure monitoring events to PagerDuty for real-time response. ## September 2018 **New Features** _Sep. 12 — [PagerDuty Visibility](/incident-management/incidents/visibility-console)_ PagerDuty Visibility is a new product that provides technical and business responders with a shared understanding of major incident scope and impact. This facilitates organization-wide response without technical and business responders interrupting each other for details. _Sep. 12 — [PagerDuty Visibility: Business Services](/incident-management/services/business-services)_ Business Services is a key feature of PagerDuty Visibility. It provides a way to model capabilities that span multiple technical services and may be owned by several different teams. This provides business users with customer-impact context even if they lack full understanding of the function and scope of all technical services. _Sep. 12 — [PagerDuty Visibility: Business Impact Metrics](/incident-management/analytics/insights)_ Impact Metrics is a key feature of PagerDuty Visibility. It allows you to quantify the impact of incidents on your business services in real time. By placing existing business impact metrics in context of major incidents, business stakeholders can have a fully automated, live view of the impact at any time. **Improvements** _Sep. 25 — [Event Rules Update: Rule Disablement](/ai-automation/aiops/rulesets#disable-event-rules)_ To pause an event rule’s activity, one can disable and re-enable it at a later time. This feature allows you to manually initiate integration-specific disablement during maintenance or testing on a tool. **Integrations** _Sep. 12 — [Jira Service Desk Integration](/integrations/jira-server)_ Provides Jira Service Desk users with the ability to engage on-calls via PagerDuty. Tickets in Jira Service Desk can be escalated to the on-call either automatically (by configurable criteria) or manually (on button press). Integration is bidirectional, and syncs status, priority, and notes. _Sep. 4 — [PagerDuty + Atlassian Bitbucket Integration](/integrations/bitbucket)_ New integration with Atlassian Bitbucket. After a change is committed to a Bitbucket repository, failures in the pipeline can be routed to PagerDuty so they can be actioned in real time. _Sep. 4 — [PagerDuty + Atlassian Jira Cloud Integration Update](/integrations/jira-cloud):_ Updates to our existing bidirectional Jira Cloud integration. - Bidirectional status sync - Bidirectional note sync between PagerDuty and Jira - Bidirectional priority sync - Ability to have PagerDuty populate fields in Jira (such as mandatory or custom fields) - Ability to automatically or manually create a Jira issue from PagerDuty - Updated sidebar widget in Jira _Sep. 4 — [PagerDuty + Atlassian Jira Server Integration Update](/integrations/jira-server):_ Updates to our existing bidirectional Jira Server integration. - Bidirectional status sync - Bidirectional note sync between PagerDuty and Jira - Bidirectional priority sync - Ability to have PagerDuty populate fields in Jira (such as mandatory or custom fields) - Ability to automatically or manually create a Jira issue from PagerDuty - Updated sidebar widget in Jira. ## August 2018 **Improvements** _Aug. 1 — [Modern Incident Response Update: APIs](https://www.pagerduty.com/features/modern-incident-response/)_ Enables advanced API-based automation of incident response, including [mobilizing multiple responders for an incident](/developer/api/reference/rest/incidents/create-incident-responder-request), sending [status updates](/developer/api/reference/rest/incidents/create-incident-status-update), and [running response plays](https://v2.developer.pagerduty.com/v2/page/api-reference#!/Response_Plays/post_response_plays_response_play_id_run). ## June 2018 **New Features** _Jun. 7 — [Event Intelligence Product Launch](https://www.pagerduty.com/features/event-intelligence-and-automation/)_ PagerDuty Event Intelligence is a new product that looks at both digital signals and human response behavior to optimize digital operations. Using Event Intelligence, teams can automate common manual workflows, significantly reduce operational noise, and access rich context during incident triage to speed up response. _Jun. 7 — Event Intelligence: [Threshold Alerts](/ai-automation/aiops/legacy-event-intelligence)_ Threshold Alerts are a key feature of the Event Intelligence package. They allow customers to receive PagerDuty notifications only when their customized alert conditions breach specified limits, enabling, responders to effectively reduce alert noise without missing critical issues. _Jun. 7 — Event Intelligence: [Scheduled Rules](/ai-automation/aiops/legacy-event-intelligence)_ Schedule Rules are a key feature of the Event Intelligence package. Customers can gain a greater degree of control over their event rules by detailing specific times in the future in which they will be active. This is particularly helpful during rules testing and planned maintenance. _Jun. 7 — [Event Intelligence: Event Rules](https://support.pagerduty.com/v1/docs/global-event-rules)_ Event Rules is a feature release for the Event Intelligence package. Event Rules allow you to define which team receives alerts based on content in those events. **Improvements** _Jun. 28 — [Response Plays Update](/ai-automation/automation/incident-workflows): [Response Bridge](/incident-management/incidents/conference-bridge)_ Users can now set a Response Bridge on an incident as part of response plays, allowing responders to use their preferred web conferencing provider for coordination. _Jun. 12 — [Incident Timeline Update](/incident-management/incidents/overview#incident-lifecycle): Escalations Itemization During [Response Mobilization](/incident-management/incidents/add-responders)_ All escalations during response mobilization will now be itemized in the incident timeline. This facilitates the acceleration of incident response by allowing the right people to focus on resolution. Additionally, this information can be easily included in postmortems. **Integrations** _Jun. 1 — Integration Updates: Migration From API v1 to API v2 Endpoints_ Updates have been made to the following integrations using v1 APIs, and API endpoints have been migrated to v2 APIs: - [CA UIM](https://www.pagerduty.com/docs/guides/ca-uim-integration-guide/) - [Zenoss](https://www.pagerduty.com/integrations/zenoss/) - [Ansible](https://www.pagerduty.com/docs/guides/ansible-integration-guide/) - [Hubot](https://www.pagerduty.com/docs/guides/hubot-integration-guide/) - [Zapier](https://www.pagerduty.com/integrations/zapier/) Customers using an older version should update their integration to the latest version. The current integration guides are linked above. ## May 2018 **Improvements** _May 1 — [Live Call Routing Updates: Customization and Transcription](/integrations/live-call-routing)_ - Ability to customize ring duration before a call escalates to the next responder - Ability to customize the auto attendant greeting - Transcription is available with premium Live Call Routing pricing on Team, Business, Enterprise for Incident Management and Digital Operations (Legacy) plans. Please [contact our Sales team](https://www.pagerduty.com/contact-sales/) if you are interested in this feature **Integrations** _May 7 — [PagerDuty + Microsoft Azure Integration Update](https://www.pagerduty.com/docs/guides/azure-integration-guide/)_ Update to our existing Microsoft Azure integration. Support for the new Metric alert format with automatic syncing of PagerDuty incidents and Microsoft Azure Metric Alerts. _May 7 — [PagerDuty + Microsoft VSTS Integration Update](https://www.pagerduty.com/docs/guides/visual-studio-team-services-integration-guide/)_ Update to our existing Microsoft VSTS integration. Automatic syncing of PagerDuty incidents with Microsoft Visual Studio Team Services Work Items. ## April 2018 **Integrations** _Apr. 17 — [PagerDuty + Atlassian Stride](https://www.pagerduty.com/docs/guides/stride-extension-guide/)_ The Atlassian Stride extension allows you to be notified of PagerDuty incidents and acknowledge or resolve them straight from the Stride UI. ## September 2017 **Improvements** _Sep. 28 — API Updates: v2 [Webhooks](/integrations/webhooks) and [Extensions](/integrations/extensions)_ - V2 webhooks - Extensions API endpoint: Add extensions (like webhooks, etc.) to a service over the API - New Notes webhook type: receive a webhook whenever a note is added to an incident --- URL: https://docs.pagerduty.com/get-started/search # Search Search globally for attributes of incidents, alerts, services and schedules. Search allows you to find attributes corresponding to incidents, alerts, services, and schedules. In a central location, quickly retrieve incident details and context in wartime and peacetime workflows. ## Advanced Search Navigate to the **** icon in the top right of the PagerDuty web app. Enter a search term and press **Enter** to search for matching objects in your PagerDuty account. Search does not support partial strings. You can search for general attributes corresponding to incidents, alerts, services, and schedules. For incidents, you see results that match an incident's title, incident number, or [notes](/incident-management/incidents/edit-incidents#add-a-note-to-an-incident).  *Search Bar* > **Search Users:** You can search users on the users page by navigating to **People** → **Users**. Read [Manage Users](/account-admin/manage-users#search) for more information. ## Search Capabilities ### Contains Search Find results that contain a specific substring. For example, searching for `serv` returns results containing service and server. A contains search works across multiple words in a search phrase and is not limited to alphanumeric characters. ### Prefix Search Find results that start with a specific string by appending an asterisk (`*`) to the end of your search term. This allows for more targeted searches beyond simple contains searches. **Example**: Searching for `inc*` returns results that start with "inc", such as "incident" and "INC67890", but not "since" or "distinct". ### Exact Match Search Search for exact phrases by enclosing your search terms in quotation marks to ensure precise results. **Example**: Searching for `Manually escalated SEV-2` returns only results that exactly match this phrase. Regular searches without quotes return results that contain any combination of the words in the phrase in any order. ### Minor Typo Tolerance The search feature handles minor typos in search queries, which allows you to find relevant results even if there are small spelling errors in your search terms. ### Search Alerts by Alert Key To search for an alert by its alert key, filter the search results to show only alerts, then enter the alert key in the search bar. ### Filter and Sort After you enter a search term, you can refine your results. In the left panel, you can filter the displayed objects. 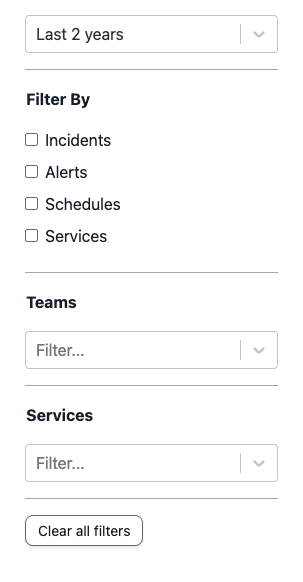 *Filter and Sort* ### Filter By Make a selection from any of the following objects to only display corresponding results. You can select more than one option: - **Incidents** - **Alerts** - **Schedules** - **Services** ### Teams To filter for results corresponding to a specific [team](/account-admin/teams), search for and select the team. You can select more than one team. ### Services To filter for results corresponding to a specific service, search for and select the service. You can select more than one service. ### Date Range Filter search results using precise time ranges with the following options: - **Last Next Seven Days** - **Last One Year** - **Last Two Years** - **Equals**: Select a specific date. - **Is Between**: Select a start date and end date. > **Supported Date Range:** Search supports incident data from the last two years and alert data from the last 12 months. Search includes all services and schedules. ### Sort Parameters The web app sorts search results by relevance by default. However, in the top right of the screen, you can choose to sort results by **Relevance** or **Recency**.  *Sort by Relevance or Recency* The search feature ranks results based on multiple factors, including: - Recency - Match type (the search feature prioritizes exact words and phrases) - Frequency of occurrence - Object type priority (the search feature generally prioritizes incidents over alerts, services, and schedules) --- URL: https://docs.pagerduty.com/get-started/service-regions # Service Regions Compare the US and EU service regions' login URLs, API endpoints, and data storage locations available to PagerDuty accounts. PagerDuty service regions allow customers to choose the geographic region of the PagerDuty data centers that host their account. When signing up for your account, you can choose one of the following service regions: - United States (US) - Europe (EU) Your service region may also determine the primary location of some service providers for your account, such as phone, SMS and email service. We may process and store some types of data outside of your account's chosen service region. These types of data may include but are not limited to: - Data for our engineering teams to secure and operate PagerDuty, such as application logs. - Data to improve PagerDuty, such as aggregated product usage analytics. - Data to provide you with technical support. - Data to conduct business with you, such as billing details. - Data to record your marketing preferences. - Data contained within Global User Profiles. If you choose to install an integration into your PagerDuty account, that data may also be stored outside of your chosen service region. It is your responsibility to review any integration you choose to and determine if it meets your requirements. > **Pricing Plan Availability:** All pricing plans are available in any service region. ## Login URLs Each service region has its own login URL: | Service Region | Login URL | | :------------- | :------------------------------ | | US | [https://app.pagerduty.com/](https://app.pagerduty.com/) | | EU | [https://app.eu.pagerduty.com/](https://app.eu.pagerduty.com/) | ## API Access URLs Each service region has its own URLs for accessing the API: | Service Region | Events API | REST API | | :------------- | :-------------------------------- | :----------------------------- | | US | [https://events.pagerduty.com](https://events.pagerduty.com) | [https://api.pagerduty.com](https://api.pagerduty.com) | | EU | [https://events.eu.pagerduty.com](https://events.eu.pagerduty.com) | [https://api.eu.pagerduty.com](https://api.eu.pagerduty.com) | > **Forwarding Support for EU-Bound API Requests:** PagerDuty can forward both REST API and Events API requests from the US service region to the EU service region when an EU integration or API key is detected. We recommend, however, sending API requests directly to the dedicated EU service region URLs above whenever possible, which improves response times and reliability. ## Hosting Locations Depending on your service region, PagerDuty could be running from any of the following data centers at any point in time: | Service Region | Data Centers | | :------------- | :------------------------------------------------------------------------------ | | US | - AWS US West (Northern California)
- AWS US West (Oregon)
- AWS US East (Ohio) | | EU | - AWS EU Central (Frankfurt)
- AWS EU West (Ireland) | ## FAQ **How do I know my account's service region?** You can tell which service region your account is based in by looking at your PagerDuty web address. EU-based accounts will have `eu` in the URL, while US-based accounts will not: | Service Region | Web Address | | :------------- | :-------------------------------- | | US | `your-subdomain.pagerduty.com` | | EU | `your-subdomain.eu.pagerduty.com` | **Can my account be split across multiple service regions?** No. An account can only exist in one service region. **Can I migrate from one service region to another?** You have the option to select your service region (i.e., US or EU) when signing up for PagerDuty. This is not considered a configurable setting. PagerDuty's [Professional Services](https://www.pagerduty.com/services/) may be able to migrate your account to a different service region, however there is typically a fee associated with this process. Please reach out to your Account Executive to discuss options. Alternatively, you can [create a new PagerDuty account](https://www.pagerduty.com/sign-up/) in your preferred service region, however you will need to rebuild any services, schedules, user accounts, etc., and historical incident data will not carry over. --- URL: https://docs.pagerduty.com/get-started/system-requirements # System Requirements Browser, JavaScript, and mobile OS version requirements needed to reliably use the PagerDuty web app and mobile apps daily. ## Web App PagerDuty's web app requires a modern web browser with JavaScript enabled. We recommend using your browser’s most recent production release. Older versions and pre-release browsers, such as betas or developer previews, are not supported. Issues with a pre-release version of a browser should be reported to the browser vendor. Browser extensions, such as ad blockers or JavaScript blockers, can interfere with, or completely prevent, certain PagerDuty features from working correctly, and are not supported. We recommend safelisting `*.pagerduty.com` in these extensions so that they don't prevent you from accessing portions of the PagerDuty web app. Current stable major versions of the following browsers are tested and supported: - Apple Safari - Google Chrome - Microsoft Edge - Mozilla Firefox - Opera ## Mobile Apps As of April 2025, the PagerDuty mobile app is supported on devices running iOS 17 and higher, or Android 12 and higher. You may not have access to the latest features if your device does not meet minimum requirements. For more information, please see [PagerDuty Mobile App](/get-started/mobile-app). > **Minimum OS Requirement Change:** To keep the mobile app secure and up to date, PagerDuty is introducing new minimum operating system requirements. Starting November 16, 2026, new versions of the mobile app require iOS 18 or higher, or Android 13 or higher. Upgrade your device before this date to continue receiving mobile app updates. Logging in to the PagerDuty app requires a browser installed on your device. If you are using an Android **work profile**, the profile must allow for access to a browser. This can be done either by adding the browser into the work profile, or allowing data to be passed outside of the work profile. Please refer to Android’s [Work profiles](https://developer.android.com/work/managed-profiles) documentation for more information. ## Integrations System requirements for integrations are listed in each product’s [integration guide](/integrations). --- URL: https://docs.pagerduty.com/get-started/training # Training Material A pointer to PagerDuty University's on-demand courses, live webinars, and certifications for teams learning the platform. PagerDuty University offers on-demand eLearning courses, live webinar trainings, and certifications to help you and your team get the most out of PagerDuty. Visit [PagerDuty University](https://university.pagerduty.com/) to explore all available training material. --- URL: https://docs.pagerduty.com/get-started/trial-account-onboarding # Trial Account Onboarding Get started with your new PagerDuty account Getting started with PagerDuty is straightforward with our trial account setup. Sign up with your work email, choose your personalized web address, and follow our step-by-step onboarding process. Learn how to set up your first service, connect your tools, configure how you want to be notified, and get your team ready to respond to incidents. ## Create a Trial Account 1. Navigate to our [sign up page](https://www.pagerduty.com/sign-up/), enter your **Work Email**, then click **Get Started**. > **Work Email Required:** Non-work email addresses (gmail.com, yahoo.com, icloud.com, and similar) are restricted and cannot be used to create a trial account. 2. Enter your **First Name**, **Last Name**, **Company**, and **Country**, then click **Next Step**. 3. Enter a **Password** and click **Next Step**. 4. Enter a **Subdomain**: PagerDuty accounts are accessible via a personalized [subdomain](/account-admin/account-subdomains). If your company name is EveryNine Inc., for example, you can set your account's subdomain to everynine.pagerduty.com, e9inc.pagerduty.com, or anything else provided that is five or more characters long and is not already in use. 5. Select the **Service Region** where you would like to [host your account](/get-started/service-regions), **USA** or **EU**. Once you have reviewed our [Terms of Service](https://www.pagerduty.com/service-terms-use/) and [Privacy Policy](https://www.pagerduty.com/privacy-policy/), check the **checkbox** to acknowledge and agree to be subject to those terms and policies. Click **Create Account** to create your account. ## Onboarding The trial onboarding flow will help you get started with your PagerDuty account, from creating your first service to adding the chat tools you’ll use to communicate. > **Skipped Onboarding?:** If you have skipped your trial’s onboarding flow and would like guidance on how to get started, refer to the **Post-Onboarding** resources linked at the end of each section below. ### Step 1: Create a Service A service is an entity you monitor that serves as a container for related incidents. Another way to think of a service is a discrete piece of functionality that is built, run, and owned by a single team. 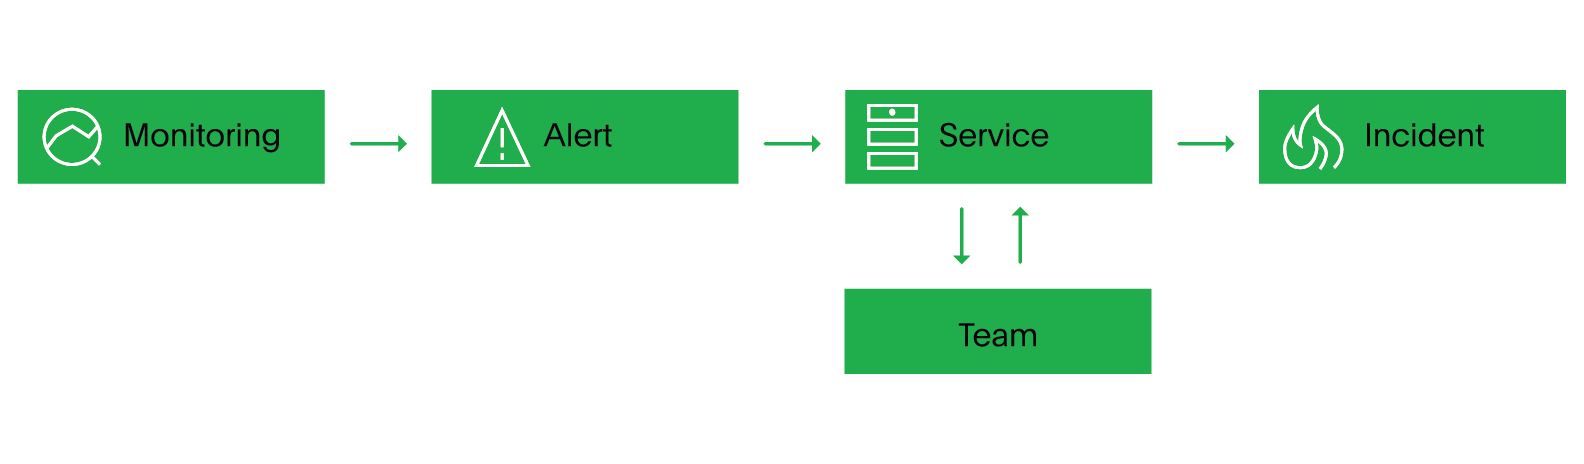 *Quickstart flow chart* 1. Enter a **Service Name** for a service your team is responsible for. The more [descriptive the name](/ops-guides/service-ownership/service-ownership-functions#service-name), the better. Examples: - Account Authentication - Checkout App Server - Inventory Database 2. Click **Continue**. **Post-Onboarding** Once you are finished with onboarding, we recommend reading the following articles to continue configuring your account: - [Create a Service](/incident-management/services/services-and-integrations#create-a-service): Create more services. - [Configurable Service Settings](/incident-management/services/configurable-service-settings): Adjust your new service’s settings to your preferences. ### Step 2: Configure Inbound Integrations Your service relies on other tools to receive alerts and data. This information helps you make the right decisions during incident response. Common integrations could include monitoring or ITSM tools. 1. Select **Integration(s)** to add to your service. You may select from the **Most Popular** tab or **All** tab. If you would like to add integrations later, you can click **Skip step** to continue. 2. If you have selected your integration(s), click **Continue**. **Post-Onboarding** Once you are finished with onboarding, we recommend reading the following guides and articles to continue configuring your account: - [Integration Guides](/integrations): Search for and follow instructions in your integration's guide to complete the integration created during onboarding. - [Add Integrations to an Existing Service](/incident-management/services/services-and-integrations#add-integrations-to-an-existing-service): Add more integrations to your service. - [Create a Service](/incident-management/services/services-and-integrations#create-a-service): Create a new service with integrations. ### Step 3: Configure Notification Methods Imagine your service is experiencing an incident. How do you want to find out? You can choose from three methods of notification including email, voice call, and SMS. In your initial account setup, we recommend that you set up all three methods to test them out. > **Trial Account Notification Limits:** Trial accounts have limits on SMS and voice notifications. See the [**Trial Account Notification Limits**](#trial-account-notification-limits) section later in this article for details. 1. To add a phone and SMS notification method, check the **checkbox** to the left of **Phone & SMS** and enter your **phone number**. To add an email notification method, check the **checkbox** to the left of **Email** and enter your **email**. If you would like to configure your notification methods later, click **Skip step** to continue. 2. If you have entered your notification method(s), click **Send Test Notification**. 3. On the next screen, confirm that your details are correct and click **Send Test Notification** again. You should receive test notifications via the methods configured. **Post-Onboarding** Once you are finished with onboarding, we recommend reading the following articles to continue configuring your account: - [Configure Notification Rules](/account-admin/user-profile/notification-rules): Determine how you are notified during incidents. - [Contact Methods](/account-admin/user-profile/contact-information): You may choose to add more contact methods. - [User Settings](/account-admin/user-profile/user-settings): Manage your user settings. ### Step 4: Download the Mobile App Your service doesn't just experience issues during work hours. You may need to acknowledge alerts, run automations, and respond to incidents from anywhere at any time. 1. Download the PagerDuty mobile app: [
](https://apps.apple.com/us/app/pagerduty/id594039512) [](https://play.google.com/store/apps/details?id=com.pagerduty.android&hl=en_US&pcampaignid=MKT-Other-global-all-co-prtnr-py-PartBadge-Mar2515-1)
2. Click **Next** to continue.
**Post-Onboarding**
Once you are finished with onboarding, we recommend reading the following articles to continue configuring your account:
- [PagerDuty Mobile App](/get-started/mobile-app): Learn more about the mobile app.
### Step 5: Configure an On-Call Schedule
On-call schedules are essential to your team’s setup in PagerDuty, as they are used to map out your on-call coverage needs. In conjunction with escalation policies, your on-call schedule determines who will be notified when an incident is triggered.
1. Enter the first and last **Name** of a user that you would like to add to your first on-call schedule. Then enter their **Email** and click to the right to invite them to PagerDuty and add them to the on-call schedule. Repeat this process for as many users as you would like to invite and add. If you would like to create an on-call schedule later, click **Skip step** to continue.
2. If you have invited user(s), click **Create Schedule**.
3. A confirmation dialog will appear stating that your first schedule and escalation policy have been created, and that invites have been sent to your new users. Click **Continue**.
**Post-Onboarding**
Once you are finished with onboarding, we recommend reading the following articles to continue configuring your account:
- [Manage Users](/account-admin/manage-users): Add more users.
- [Create a Schedule](/incident-management/schedules/schedule-basics#create-a-schedule): Add more on-call schedules.
- [Edit Schedules](/incident-management/schedules/edit-schedules): Edit the schedule you have created.
- [Create an Escalation Policy](/incident-management/schedules/escalation-policies#create-an-escalation-policy): Create more escalation policies.
- [Edit an Escalation Policy](/incident-management/schedules/escalation-policies#edit-an-escalation-policy): This step of the onboarding flow creates a Default escalation policy and assigns it to your first service and on-call schedule. If you would like to edit this escalation policy, follow instructions in this article.
### Step 6: Connect With Your Chat Tools
Resolve incidents quickly with your teammates by collaborating directly in Slack and Microsoft Teams. These tools are called extensions because they extend the functionality of your PagerDuty account to your team’s workflows and level up your incident resolution power.
1. Click **Add Extensions**. If you would like to add extensions later, click **Skip step** to continue.
2. You will be directed to your account’s Extensions page. Click **Add** below some of our most popular extensions at the top of the page, or click **New Extension** to search for others.
3. Follow the authentication workflow for your extension.
After completing the final step of onboarding, you will be directed to your PagerDuty account. Please refer to the **Post-Onboarding** articles at the end of each of the onboarding steps to continue configuring account objects.
**Post-Onboarding**
Once you are finished with onboarding, we recommend reading the following articles to continue configuring your account:
- [Extensions](/integrations/extensions)
- [Add-Ons](/integrations/add-ons)
## Trial Account Notification Limits
Trial accounts have a limit on phone-based notifications — SMS and voice combined — to prevent misuse. Push, Email, and Slack notifications are not limited.
| Limit | Threshold |
| :--- | :--- |
| Per-user limit | 100 phone-based notifications |
| Per-account limit | 500 phone-based notifications |
PagerDuty emails the account owner when the account reaches 50%, 80%, and 100% of the account limit.
> **Notifications Blocked at 100%:** When a user or account reaches its phone-based notification limit, PagerDuty blocks further SMS and voice notifications for that user or account. This block does not expire automatically. Email notifications continue to work.
> **Notifications Do Not Resume Automatically After Upgrading:** Moving from a trial to a paid account does not automatically remove an existing SMS or voice notification block. If you were blocked during your trial, contact [PagerDuty Support](mailto:support@pagerduty.com) after upgrading to have the block removed.
## Move from a Trial to a Paid Account
> **Required User Permissions:** Only the Account Owner can move from a trial to a paid account.
When you’re ready to move forward from a trial account:
1. In the web app, navigate to **User Icon** → **Subscriptions**.
2. Under Subscription Details, click **Upgrade Plan**.
3. Choose your preferred **plan**. You may use the toggle on the left to change whether this plan will be **Billed Yearly** or **Billed Monthly**. Click **Select Plan**.
> **Enterprise Plan:** If you select the Enterprise for Incident Management plan, you will be directed to [contact the Sales team](https://www.pagerduty.com/contact-us/) rather than completing the steps below.
4. Under Plan Details, select the preferred **Billing Cycle**, any **Add-Ons**, a **Full User Count**, and a **Stakeholder Bundle**. If you have a discount code, enter it in the **Discount Code** field and click **Apply Discount**.
5. In the Billing and Payment section, enter your **credit card information**. You may _optionally_ select **Same bill-to contact as credit card** to set the contact information for billing to be the same as the credit card information and/or **Same sold-to contact as credit card** to set sold-to contact information to be the same as the credit card.
6. Review your transaction details and click **Complete Your Purchase**.
---
URL: https://docs.pagerduty.com/get-started/use-mobile-schedules
# Use Mobile Schedules
Review schedules and manage overrides in the mobile app
The PagerDuty mobile app is designed with the responder experience in mind. You can easily access schedules, create overrides, and view previous and future on-call shifts.
> **Edit Schedules:** If you would like to make structural changes to your schedules, such as adding or removing users from the rotation or adjusting shift lengths, you can do that in the web app. Refer to [Edit Schedules](/incident-management/schedules/edit-schedules) for more information.
## View Schedules
To browse schedules in the mobile app, navigate to **More** → **Schedules**. The mobile app presents two tabs: **My Teams** to view schedules associated with your [Teams](/account-admin/teams), and **All** to view all schedules in your organization account.
Select a schedule from the list to see its detailed view. A two-week calendar view displays at the top. Select a specific day or scroll through the timeline to find a particular shift. The duration of a shift displays for each entry, even if the shift spans multiple days.
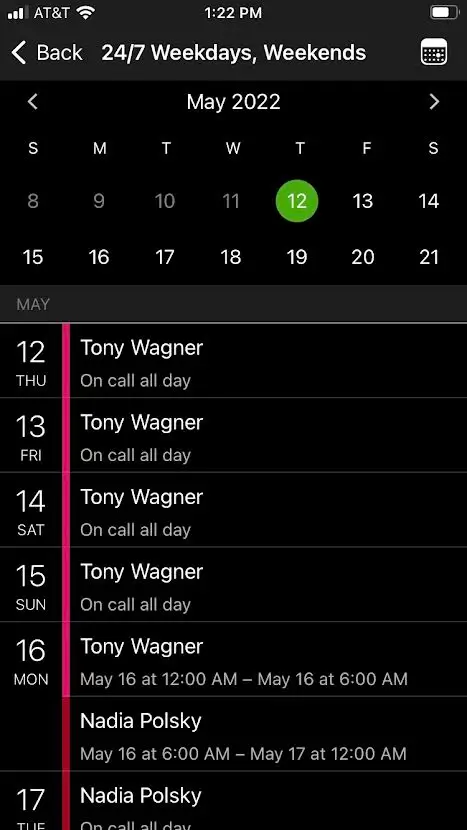
*Detailed View*
Regular shifts show the schedule color of the user in a solid color.
Overridden shifts display a horizontally striped color.
Gaps in schedules appear as **No One On Call**.

*No One On Call*
You can filter the schedule view by tapping the **Settings** icon.
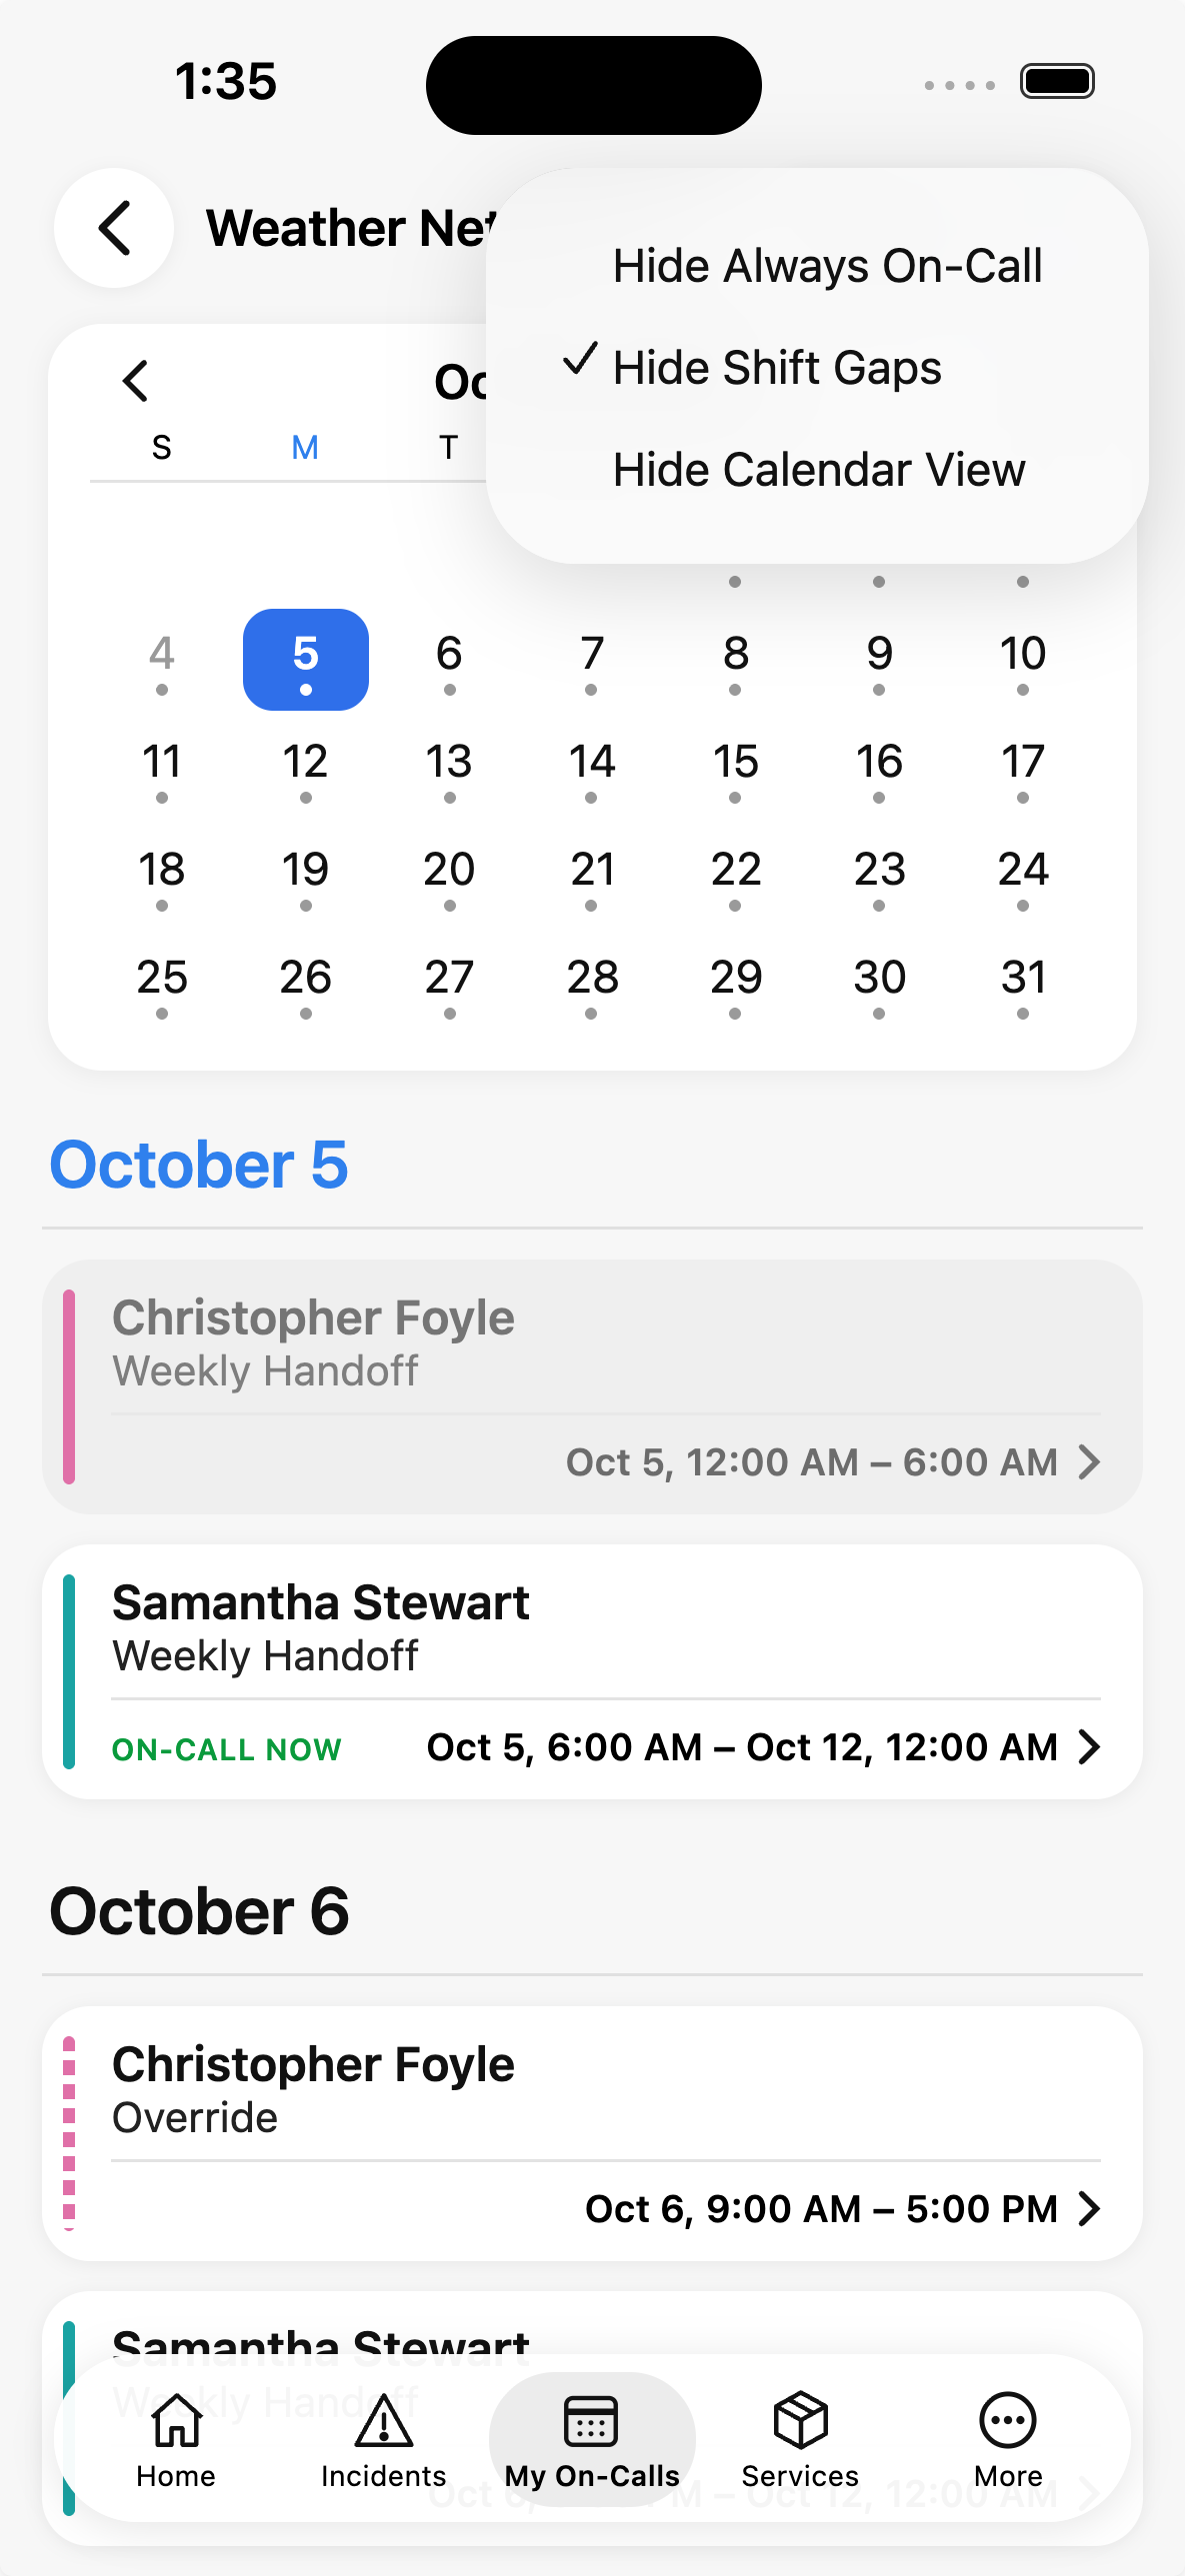
*Filter Menu*
> **My On-Call Shifts:** If you are active on multiple schedules and would like to see all of your on-call shifts in one place, you can do so in the mobile app by selecting **My Shifts** in the bottom navigation.
### Search Schedules
1. Navigate to **More** → **Schedules**.
2. Click the **Search** icon and enter a search term.
*Search Schedules*
3. Select a schedule from the list of results.
## Overrides
There are two ways to set the duration of an override:
- [Enter Start and End Times](#enter-start-and-end-times)
- [Select a Duration](#select-a-duration)
### Enter Start and End Times
**How do I enter start and end times on iOS?**
1. [Navigate to your preferred schedule](#view-schedules) and select the shift you would like to override.
2. If needed, click **Starts** and **Ends** to modify the override length. It defaults to the remainder of the shift duration.
3. Click **Override** in the top-right corner.

*Override Start and End Times*
**How do I enter start and end times on Android?**
1. [Navigate to your preferred schedule](#view-schedules) and select the shift you would like to override.
2. If needed, to the right of the **Calendar** icon, click the first date and time to modify the start time, and click the second date and time to modify the end time. It defaults to the remainder of the shift duration.
3. Click **Override** in the top-right corner.

*Override Start and End Times*
### Select a Duration
**How do I select a duration on iOS?**
You can also modify the duration of an override using a pre-populated option (for example, **Until the rotation ends**).
1. [Navigate to your preferred schedule](#view-schedules) and select the shift you would like to override.
2. Click **Duration**.

*Adjust Override Duration*
3. Select one of the pre-defined options for **Override Length**:
- **One hour**
- **Six hours**
- **12 hours**
- **24 hours**
- **Until the rotation ends**
4. Click **Override**.
**How do I select a duration on Android?**
You can also modify the duration of an override using a pre-populated option (for example, **Until the rotation ends**).
1. [Navigate to your preferred schedule](#view-schedules) and select the shift you would like to override.
2. Click the time duration next to the **Clock** icon.

*Adjust Override Duration*
3. Select one of the pre-defined options for **Override Length**:
- **One hour**
- **Six hours**
- **12 hours**
- **24 hours**
- **Until the rotation ends**
4. Click **Override**.
### Delete an Override
You can delete an override in the mobile app:
1. [Navigate to your preferred schedule](#view-schedules) and select the overridden shift.
2. In the **Shift Already Overridden** dialog, select **Delete Override**.
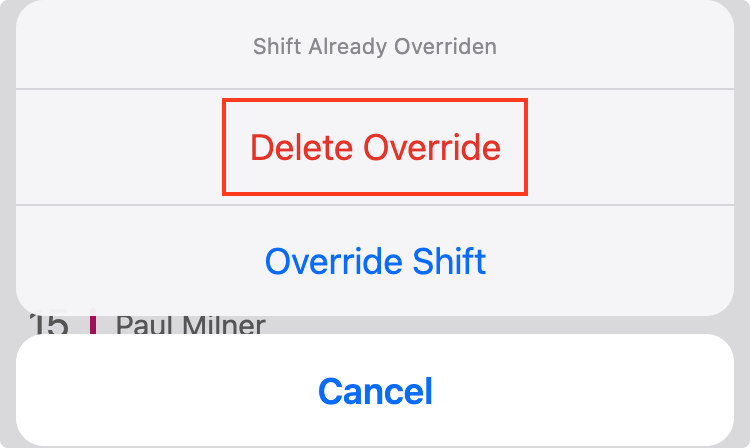
*Delete Override*
---
URL: https://docs.pagerduty.com/get-started/whats-new
# What's New in PagerDuty
A historical, dated table of PagerDuty feature announcements and product enhancements dating all the way back to 2014 through 2017.
## A List of New Features and Enhancements
| Date | Feature/Release | Summary | More info |
| --- | --- | --- | --- |
| 1/18/2017 | Stakeholder Engagement | The new Stakeholder user license makes it easy for stakeholders across the business to stay engaged during major IT incidents. With self-service incident subscription and notifications, you can ensure your cross-functional teams are equipped with the right information in real-time to improve organization-wide response. | Find out more information on how to [add stakeholders as subscribers](/incident-management/communicate/communicate-with-stakeholders#add-subscribers-to-an-incident). |
| 11/17/2016 | Infrastructure Health Application | With the Infrastructure Health Application, you can now view all of your events and alerts, across your entire infrastructure, in a single pane of glass. This holistic view empowers you to understand the complexities of your infrastructure, and ultimately improve Incident Management within your organization. | Start exploring the [Operations Command Console](/incident-management/incidents/event-management). |
| 11/17/2016 | Suppression and Event Rules | Suppression allows you to send data to PagerDuty without being immediately notified about it. Suppressed alerts are stored in PagerDuty and available for forensics, analysis, and context, but do not create incidents, notify, assign, or escalate. | Learn more about [Suppression and Event Rules](/incident-management/incidents/event-management#alert-suppression) and how to configure them. |
| 9/13/2016 | Extensions | Extensions allow you to easily manage/create extensions, add-ons, and conference bridges, across all of your services. | Learn how to manage/create [Extensions](/integrations/extensions) on your services. |
| 9/13/2016 | Live Call Routing | With Live Call Routing, you can have people call a number and be redirected to an on-call engineer, and if the caller leaves a voicemail it will trigger a PagerDuty incident. Or, you can have a people call a number to immediately trigger a PagerDuty incident. | Learn how to set up [Live Call Routing](/integrations/live-call-routing). |
| 07/11/2016 | Response Bridge | Include conference bridge information within incidents, enabling your team to collaborate and resolve incidents more quickly. | Learn how to [add Response Bridge to a service or incident](/incident-management/incidents/conference-bridge). |
| 07/11/2016 | Response Mobilizer | Request help from your team to resolve critical business-impacting incidents, right from within the PagerDuty incident. | Learn how to [add responders to an incident you're working on](/incident-management/incidents/add-responders#add-responders-to-an-incident). |
| 05/11/2016 | Service Groups | Group multiple integrations under a single service so that your PagerDuty services represent your IT systems and components. | Start grouping your integrations together by [moving existing integrations under one service](/incident-management/services/services-and-integrations). |
| 02/22/2016 | Team Responder | With the Team Responder user role, you can stop worrying about users accidentally acknowledging or resolving incidents they aren’t involved in. | Learn more about Team Responders [here](/account-admin/user-roles). |
| 10/09/2015 | Mobile app update | Effective 10/09/2015, we have deprecated support for older versions of the PagerDuty mobile apps, as well as older Android and iOS operating systems. This was done in order to improve security as well as to take advantage of additional capabilities in newer OS versions. | Minimum PagerDuty app version is PagerDuty **v2.3** for both iOS and Android. Minimum iOS version is **iOS 8**, and minimum Android version is **Android 4.0**.You can find the most up-to-date versions of our app on the Google Play store (Android) or iOS App Store (Apple).
You may be able to access limited functionality with older app or OS versions, but we cannot guarantee or provide support for your device unless it meets the minimum requirements listed above. In particular, push notifications to Apple devices running iOS 7 or earlier will not function. | | 09/10/2015 | Urgencies | Be able to specify which incidents are urgent and non-urgent and establish different notification rules based on urgency of an incident. Standard and Enterprise customers can also establish at what times of the day an incident should be deemed urgent. | [Announcement](https://www.pagerduty.com/blog/incident-analytics-urgencies/) | | 08/17/2015 | Mobile app update | - Improved incidents list UI
- Incident details are now front-and-center when viewing an incident.
- Gestures: Swipe left to acknowledge (or snooze), right to resolve.
- New custom sound, submitted by PagerDuty's youngest fan.
- Bug fixes and performance enhancements. | | | 06/03/2015 | Mobile app update | Add/edit contact methods and notification rules through the mobile app | | | 06/02/2015 | [Snooze](/incident-management/incidents/edit-incidents#snooze-an-incident) | Extend the time period for your incident acknowledgements | | | 05/17/2015 | [Advanced Analytics CSV export](/incident-management/analytics/insights) | Export your data from Advanced Analytics | | | 05/13/2015 | [Rich incidents](https://www.pagerduty.com/blog/rich-incidents/) | Help incident responders get real-time data at the most critical moment in the incident lifecycle | | | 05/04/2015 | Mobile app update | New custom sounds! | | | 04/22/2015 | [Teams](/account-admin/teams) | Improve organization of the UI by filtering views by Teams | | | 04/09/2015 | Services update | Add up to 10 webhooks to a single service | | | 04/06/2015 | Mobile app update | Rich text in incident details | | | 03/16/2015 | Grouped Navigation | UI change: tabs have been grouped under the new 'Configuration' tab. | | | 03/07/2015 | Mobile app update | Brought back volume overrides in Android | | | 02/04/2015 | Mobile app update | Support for actionable notifications! Acknowledge PagerDuty incidents directly from notification drawer/push notifications. | | | 12/17/2014 | Mobile app update | - Fully native app! Faster and more responsive than ever.
- Immediate access to Acknowledge, Resolve, and Trigger details from your incident list.
- Filter your incidents list by what’s relevant to you.
- Improved incident detail page: if your client has a URL, you’ll see it here.
- “Override System Volume” is deprecated for Android L. You can enable priority notifications for PagerDuty in Settings > Sound & notification > App notifications > PagerDuty. | | | 12/16/2014 | [Resolve incidents via email](/integrations/email-integration-guide/email-management-filters-and-rules#trigger-and-resolve-alertsincidents) | Use parsing rules to automatically resolve incidents via email. See all other related articles [here](/integrations/email-integration-guide/email-management-filters-and-rules). | [Announcement](http://blog.pagerduty.com/2014/12/email-parsing/) | | 12/15/2014 | [Test contact methods](/incident-management/notifications/notification-content-and-behavior#send-test-notifications) | Send test notifications to each of your contact methods. | | | 11/13/2014 | Incident page UI improvement | The incident page (what you see after clicking an incident number), now includes details of the incident above the log, and also now has the incident description up at the top of the page. | | | 11/06/2014 | Mobile app update: iOS improvements | - Handoff: If you’re on iOS 8.1 and OS X Yosemite, you can pick up on your Mac where you left off on your iOS device. Try it with an Incident Detail page!
- Today View: Check your on-call responsibilities at a glance.
-1Password integration | | | 10/04/2014 | Mobile app update | Incident trigger, on-call now, and escalation policies are now native views. | | | 09/09/2014 | [Status Updates](/account-admin/user-profile/notification-rules#when-an-incident-i-am-subscribed-to-has-a-status-update) | Receive status updates (or incident state change notifications) on incidents you are assigned to | | | 09/08/2014 | [Advanced Analytics](/incident-management/analytics/insights) | Gain more insight into your team's performance with our advanced reporting (available on Enterprise) | [Announcement](http://blog.pagerduty.com/2014/09/identify-and-fix-problems-faster-with-advanced-analytics/) | | 09/02/2014 | [Mobile app overrides](/get-started/mobile-app#schedule-overrides) | Create overrides directly within the mobile app | | | 07/07/2014 | [On-call handoff notifications improvements](/account-admin/user-profile/notification-rules#on-call-handoff-notifications) | Get notified when you're going on-call or off-call up to 48 hours ahead of time. Configurable on your profile page. | [Announcement](http://blog.pagerduty.com/2014/07/ochon-update/) | | 06/10/2014 | [Launch of our Statuspage](/get-started/pagerduty-outage-notifications) | Refer to our [Statuspage](https://status.pagerduty.com/) for information on operational issues. | | | 06/02/2014 | Custom alert sounds on iOS and Android | Custom alert sounds have been added on our iOS and Android apps. | [Announcement](http://blog.pagerduty.com/2014/06/custom-alert-sounds-now-available-for-ios-and-android/) | | 04/24/2014 | [Single sign-on (SSO)](/account-admin/sso) | Our enterprise customers can use leading Single Sign-on providers like Okta, OneLogin and Ping Identity. | [Announcement](http://blog.pagerduty.com/2014/04/single-sign-on-sso-now-available/) | | 04/08/2014 | [Multi-user alerting](/incident-management/schedules/escalation-policies#notify-multiple-users-at-once) | Want to alert more than one person at once? We do that. | [Announcement](http://blog.pagerduty.com/2014/04/alert-all-the-right-people-with-multi-user-alerting/) | | 02/28/2014 | [Add more services](/incident-management/services/services-and-integrations) | We've updated our add services page to make it easier to find the tool that you want to integrate with. | | | 01/31/2014 | Usability improvements | - Booking an override? [Click on the calendar](/incident-management/schedules/edit-schedules#create-overrides) directly.
- Email alerts now have [more detail](/incident-management/notifications/notification-content-and-behavior#notification-content) | | | 01/22/2014 | Minor mobile release | - [On-Call Page Improvements](/get-started/navigate-incidents-page#on-call-widgets): Easily see current on-call users and who's on-call for all escalation policies
- [User Page improvements](/account-admin/manage-users): See any user's next and current on-call status, and the escalation policies he belongs to | | | 01/15/2014 | [On-call handoff notifications](/account-admin/user-profile/notification-rules#on-call-handoff-notifications) | Get notified when you go on or off call | [Announcement](https://blog.pagerduty.com/2014/02/stop-forgetting-youre-on-call-with-handoff-notifications/) | | 01/06/2014 | Mobile updates | Pull to refresh and more mobile app updates | [Announcement](https://blog.pagerduty.com/2014/01/pull-to-refresh-and-more-pagerduty-mobile-app-updates/) | | 11/04/2013 | [Clickable SSH links](/incident-management/notifications/notification-content-and-behavior#notification-content) | SSH links are now clickable | | | 11/01/2013 | [Limited Users](/account-admin/user-roles) | New user role cannot create/edit/delete services, escalation policies, and schedules. | [Announcement](https://blog.pagerduty.com/2013/11/pagerduty-user-role/) | | 10/30/2013 | Service descriptions | Add descriptions to your services and pull this data [from the API](/developer/api/reference/rest/services/list-services) | | | 10/29/2013 | [PagerDuty Mobile App](https://www.pagerduty.com/mobile) | Manage incidents on the go with our mobile app | [Announcement](http://blog.pagerduty.com/2013/10/pagerduty-mobile-incident-management/) | | 10/18/2013 | [Calling extensions](/account-admin/user-profile/contact-information#phone-contact-methods-with-an-extension-or-delay) | Direct a phone call alert to your work extension | [Announcement](https://blog.pagerduty.com/2013/10/pagerduty-introduces-dial-extensions-clickable-urls-and-more/) | | 09/26/2013 | [Clickable links](/incident-management/notifications/notification-content-and-behavior#notification-content) | URLs in incidents in the web app are clickable | | | 08/29/2013 | Web UI updates | Touched up our web UI | [Announcement](https://blog.pagerduty.com/2013/08/touching-up-our-web-ui/) | | 08/14/2013 | [Webhooks](/integrations/webhooks) | Connect your PagerDuty service with a webhook to send HTTP callbacks to your service | [Announcement](https://blog.pagerduty.com/2013/08/pagerduty-webhooks-hipchat/) | | 08/01/2013 | [Incident reassigning](/incident-management/incidents/reassign-incidents#reassign-an-incident) | Reassign incidents to another user | | | 5/3/2013 | SMS Via Short Code | Receive your SMS alerts from one of PagerDuty's short code numbers | [Announcement](https://www.pagerduty.com/blog/sms-alerts-short-code/)
See [this article](/incident-management/notifications/notification-phone-numbers) for a list of short codes | | 3/28/2013 | Android Mobile App v1 | PagerDuty's first Android Mobile app released | [Announcement](https://www.pagerduty.com/blog/pagerduty-android-app/)
Learn more about the mobile app [here](/get-started/mobile-app) | | 2/20/2013 | iOS Mobile App v1 | PagerDuty's first iOS mobile app released | [Announcement](https://www.pagerduty.com/blog/pagerduty-iphone-app/)
Learn more about the mobile app [here](/get-started/mobile-app) | | 9/26/2012 | PagerDuty REST API | PagerDuty's REST API released | Learn about the API [here](/developer) | | 2/6/2012 | Mobile Site | m.pagerduty.com released for mobile users | [Announcement](https://www.pagerduty.com/blog/we-have-a-mobile-site/) | | 1/4/2012 | Schedules v2 | PagerDuty's new scheduling tool is released | [Announcement](https://www.pagerduty.com/blog/its-schedulin-time/)
Learn more about using schedules [here](/incident-management/schedules/schedule-basics) | | 11/29/2011 | Incident de-duping | Incidents are linked and de-duped via use of an incident key | | | 10/25/2011 | Export to iCal/WebCal feed | PagerDuty schedules can be exported via iCal file or WebCal feed for use in external calendar applications | [Announcement](https://www.pagerduty.com/blog/ical-integration-and-hand-off-notification/)
More information [here](/incident-management/schedules/schedules-in-apps#calendar-apps) | | 8/3/2010 | Integration API | PagerDuty's API for interacting with incidents released | [Announcement](https://www.pagerduty.com/blog/3-major-new-features-part-1-integration-api/)
Learn more about the integration API [here](https://developer.pagerduty.com/docs/events-api) | | 3/10/2010 | Incident Auto-Resolution | The option to automatically resolve incidents after a certain number of hours is now available as a service configuration option | [Announcement](https://www.pagerduty.com/blog/new-feature-alarm-auto-resolution/) | | 3/10/2010 | Multi-incident capability | PagerDuty's ability to handle multiple incidents for a service released | [Announcement](https://www.pagerduty.com/blog/preview-release-multi-incident/) | | 11/23/2009 | Basic Report | Basic Reporting released in PagerDuty | [Announcement](https://www.pagerduty.com/blog/new-feature-reports/)
Learn more about reporting [here](/incident-management/analytics/insights) | | 9/9/2009 | Services & Escalation Policies | Services and Escalation Policies released (originally called Alarm Groups) | [Announcement](https://www.pagerduty.com/blog/new-pagerduty-feature-alarm-groups/)
Learn more about services [here](/incident-management/services/services-and-integrations), and escalation policies [here](/incident-management/schedules/escalation-policies). | --- URL: https://docs.pagerduty.com/incident-management/after-incident # After the Incident Learn from incidents with Post-Incident Reviews and Postmortems. [Post-Incident Reviews](/incident-management/after-incident/post-incident-reviews) are a structured evaluation process conducted after an incident or crisis to analyze what happened, why it happened, and how to prevent recurrence. They are a valuable tool for learning from mistakes, improving response procedures, and enhancing overall resilience in the face of future challenges. [Postmortems](/incident-management/incidents/post-incident-reviews-and-postmortems) are reports that allow you to learn from major incidents by providing a summary of events, how the response was handled, and what resolution steps were taken. Postmortems curate a timeline of activity in PagerDuty and Slack, which teams can analyze to determine follow-up actions for similar situations in the future. --- URL: https://docs.pagerduty.com/incident-management/after-incident/get-started-with-jeli-post-incident-reviews # Get Started with Jeli Post-Incident Reviews Discover how Jeli simplifies post-incident management | Jeli Part of PagerDuty [Jeli](https://www.pagerduty.com/platform/jeli/) is where incidents turn into learning moments. With Jeli, you can easily see patterns and themes across incidents to help with future planning. It brings your tools and team together to make incident management and learning simpler. > **Availability:** Jeli is available to all customers on Professional, Business, and Enterprise Incident Management pricing plans. For customers who have Jeli as part of their pricing plan, all users (regardless of [user role](/account-admin/advanced-permissions)) will have access to Jeli. Please contact our [Sales Team](https://www.pagerduty.com/contact-us/#contact-sales) to upgrade to a pricing plan with Jeli. ## PagerDuty Slack Integration The [PagerDuty | Slack integration](/integrations/slack-integration-guide) is designed to: - Collaborate seamlessly while managing PagerDuty incidents end-to-end from [dedicated incident channels](/integrations/slack-integration-guide/slack-user-guide#dedicated-incident-channel). - [Take action](/integrations/slack-integration-guide/slack-user-guide#available-actions) on your incident, without leaving Slack. - Trigger, acknowledge, escalate, and resolve PagerDuty incidents. - Run Incident Workflows, send status updates, assign roles and delegate tasks. - Save time using [PagerDuty AI GenAI](/ai-automation/advance#pagerduty-ai-benefits). - Efficiently get context (e.g., `@PagerDuty what changed?`). - Generate status updates (e.g., `@PagerDuty draft a status update`). - Summarize the incident after resolution for Post-Incident Reviews. - Easily build Post-Incident Reviews in Jeli by importing Slack data for analysis. ## Jeli Web App The [Jeli web app](https://app.jeli.io/) is designed to: - Review all of your Slack event data to gain more context on what happened, who was involved, and what the experience was like for those involved in the incident. - Easily create timelines from automatically imported Slack event data as you piece together what happened during an incident. - Export reports and data to stakeholders and interested parties. ### Explore the Demo Environment In the top-right, select → **Go to Demo Environment** to learn more about how to use Jeli for incident analysis. In the demo environment you'll have access to a product walkthrough, information on how to use Jeli's [Narrative Builder](/incident-management/after-incident/jeli-post-incident-reviews/post-incident-review-report/narrative-builder) for investigations, and you can explore your data with Jeli's [Learning Center](/incident-management/after-incident/learning-center).  To exit the demo environment, select → **Go to Production Environment**. ## Log Into Jeli Visit [app.jeli.io](https://app.jeli.io/) and log into Jeli using your PagerDuty account. ## User Account Roles Account roles determine the access level a user has in regards to the overall account configuration. There are two roles at the account level: - **Admin**: This role has advanced permissions that allow the user to update account settings, and create, edit and delete [Post-Incident Review Templates](/incident-management/after-incident/jeli-post-incident-reviews/post-incident-review-report/post-incident-review-templates). Admins for your organization automatically inherit [Post-Incident Review Owner](/incident-management/after-incident/jeli-post-incident-reviews#post-incident-review-access-roles) level access to every Post-Incident Review in Jeli (including private Post-Incident Reviews). - **User**: This role cannot update account settings and is the default role assigned to new users. You can assign [incident roles](/incident-management/after-incident/jeli-post-incident-reviews/post-incident-review-report#add-a-role) to these users for individual Post-Incident Reviews. You can learn more about viewing and editing users' account roles in our [Post-Incident Review Access Roles](/incident-management/after-incident/jeli-post-incident-reviews#post-incident-review-access-roles) article. ## Customize Jeli > **Required User Permissions:** Only Admins can manage Jeli settings. Please contact your [Jeli Admin](https://app.jeli.io/settings/users?filter=admin) to gain access or to adjust settings. ### Incident Analysis From **Settings** → **Post-Incident Reviews** you can manage [Tag Types](/incident-management/after-incident/jeli-post-incident-reviews/post-incident-review-report/post-incident-review-tags#post-incident-review-tag-types) to help identify related Post-Incident Reviews, and you can configure [Templates](/incident-management/after-incident/jeli-post-incident-reviews/post-incident-review-report/post-incident-review-templates) to make it easier for investigators to write their executive summaries and key take-aways. --- URL: https://docs.pagerduty.com/incident-management/after-incident/get-started-with-jeli-post-incident-reviews/configure-post-incident-reviews-jeli # Configure Post-Incident Reviews (Jeli) Admins enable or disable Jeli Post-Incident Reviews in PagerDuty Account Settings, then start reviews from incidents, workflows, or PagerDuty AI. Before users can start using Post-Incident Reviews, an Admin or the Account Owner will need to enable it in the PagerDuty web app. After the toggle is enabled, users can log in to Jeli and start using Post-Incident Reviews. ## Enable Post-Incident Reviews 1. In the PagerDuty web app, navigate to **User Icon** → **Account Settings**. 2. Select the tab **Jeli Post-Incident Reviews**. 3. Click toggle **Enable Jeli Post-Incident Reviews**. All PagerDuty users will now be able to use Post-Incident Reviews.  *Post-Incident Reviews enabled* ### Disable Post-Incident Reviews 1. In the PagerDuty web app, navigate to **User Icon** → **Account Settings**. 2. Select the tab **Jeli Post-Incident Reviews**. 3. Click toggle **Enable Jeli Post-Incident Reviews**. 4. In the confirmation modal, click **Disable**. 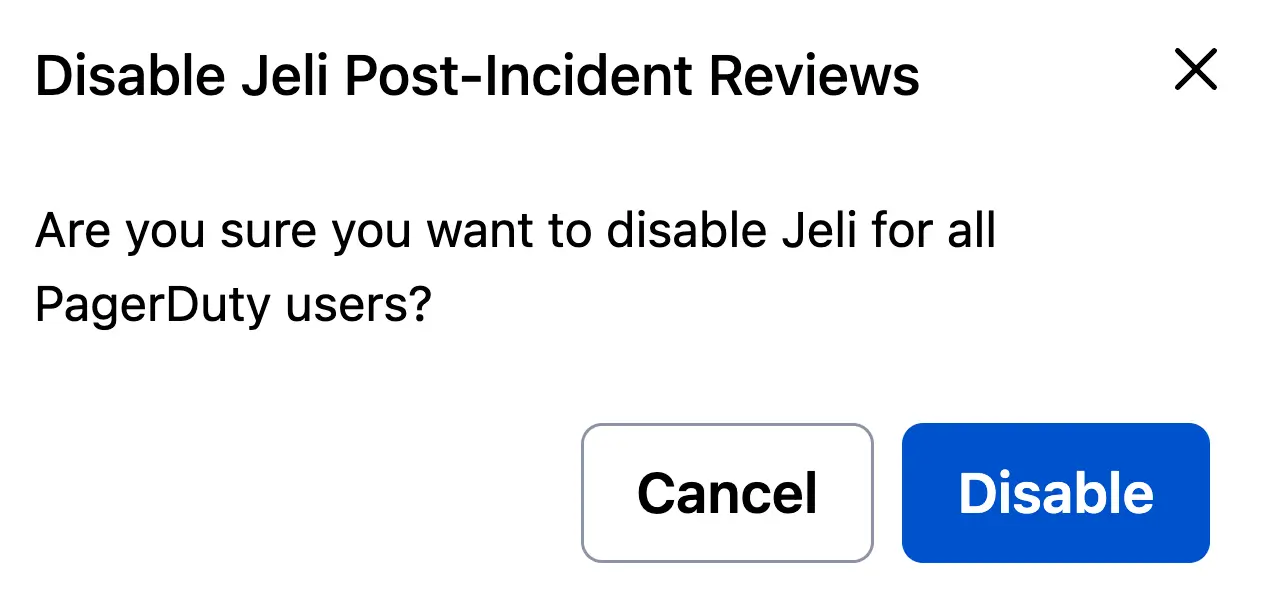 ## Use Post-Incident Reviews After an Admin or the Account Owner has [enabled Post-Incident Reviews](#enable-post-incident-reviews), there are three ways for users to create one: - [Incident Details Page](#incident-details-page) - [Incident Workflows](#incident-workflows) - [PagerDuty AI](#pagerduty-ai) ### Incident Details Page Users can start a Post-Incident Review from any resolved PagerDuty incident. Read [Create a Jeli Post-Incident Review](/incident-management/incidents/post-incident-reviews-and-postmortems#create-a-jeli-post-incident-review) for more information. ### Incident Workflows [Incident Workflows](/ai-automation/automation/incident-workflows) allow you to create automated, repeatable response processes. Read [Jeli: Create A Post-Incident Review](/workflow-actions/jeli/jeli-create-a-post-incident-review) for more information about adding Post-Incident Reviews as part of an Incident Workflow. > **Availability:** Incident Workflows are included with PD Reliability Platform plans. They're also included with the following pricing plans: Business, Digital Operations (legacy) and Enterprise for Incident Management. > > Customers on Professional pricing plans have access to Incident Workflows and can create one Incident Workflow. ### PagerDuty AI Users can create a Post-Incident Review while using PagerDuty's AI assistant, PagerDuty AI. Read [PagerDuty AI for Post-Incident Reviews](/ai-automation/advance/user-guide#pagerduty-ai-for-post-incident-reviews) for more information. > **Availability:** PagerDuty AI is generally available to Professional, Business, and Enterprise Incident Management customers using Jeli and PagerDuty AI (one-time credits, trial or paid SKU). --- URL: https://docs.pagerduty.com/incident-management/after-incident/get-started-with-jeli-post-incident-reviews/jeli-system-requirements # Jeli System Requirements System requirements for the Jeli web app or Slackbot | Jeli Part of PagerDuty Jeli helps organizations respond to, manage, and analyze incidents in order to build more resilient infrastructure and teams. ## Jeli Web App Modern web browsers are supported. We recommend using your browser’s most recent production release. Older versions and pre-release browsers, such as betas or developer previews, are not supported. Issues with a pre-release version of a browser should be reported to the browser vendor. --- URL: https://docs.pagerduty.com/incident-management/after-incident/jeli-post-incident-reviews # Jeli Post-Incident Reviews Evaluate your incident response with Post-Incident Reviews | Jeli Part of PagerDuty ## Post-Incident Reviews A post-incident review is a structured evaluation process conducted after an incident or crisis to analyze what happened, why it happened, and how to prevent recurrence. Post-incident reviews are a valuable tool for learning from mistakes, improving response procedures, and enhancing overall resilience in the face of future challenges. No matter how large or small an incident is, creating a post-incident review has significant long-term benefits for your organization. When related, aggregated, or compared with other Jeli post-incident reviews, incidents can reveal compelling organizational patterns and insights. > ****Availability**:** - Accounts on the Enterprise for Incident Management pricing plan can create unlimited Jeli post-incident reviews. > - Accounts on Professional and Business pricing plans can create up to 300 post-incident reviews per year. This is a rolling 365-day window. Review the number of post-incident reviews you have created in the past year using the date filters on the Post-Incident Review list in the Jeli web app. > > [Contact the Sales Team](mailto:sales@pagerduty.com) to upgrade to a plan featuring Jeli post-incident reviews. > ****Prerequisite**:** Before creating a post-incident review in Jeli, install the [Slack | PagerDuty integration](/integrations/slack-integration-guide#pagerduty-slack-integration-api). Select **Post-Incident Reviews** in the Jeli web app to see a list of post-incident reviews. Click a post-incident review's name to see its detailed overview. ### Search Post-Incident Reviews Use the search bar above the **Post-Incident Review** list to search for post-incident reviews by name or summary. ### Filter the Post-Incident Review List You can add filters to your search, such as who participated in the post-incident review and which teams or services were involved. Filtering the post-incident review list can answer questions such as: - How frequently was a particular service involved in incidents over the last quarter? - Were key members of your front-end engineering team involved in incidents when they were not on call? - Which post-incident reviews should be analyzed further, based on the size and impact of the event? To filter and explore your incident data from the **Post-Incident Review** list: 1. In the Jeli web app, select **Post-Incident Reviews** from the left menu. 2. Click **+ Add filter**. 3. Choose the parameter you want to filter on (e.g., **Tags** or **Key role**). 4. Choose the values you want to match against. - Selecting multiple values applies the filter using the `OR` operator. - Bulk select or unselect tags from the filtering options by clicking the checkbox next to the desired tag type. 5. Click to chain additional filters together using an `AND` operator.  *Post-Incident Review filters* #### Filter by Duration You can filter by the following duration measurements, calculated based on a post-incident review's [event markers](/incident-management/after-incident/jeli-post-incident-reviews/post-incident-review-report/narrative-builder#event-markers): - **Total incident duration**: The total time from incident start to end. - **Diagnosis marker duration**: The total time of all Diagnosis markers. - **Repair marker duration**: The total time of all Repair markers. - **Detection marker duration**: The total time of all Detection markers. These measurements support more detailed questions across your incident data, such as: - Which incidents have taken the longest to diagnose, and which services were involved? - How has time spent diagnosing and repairing issues changed over time? Which services are trending up or down? ### Share Post-Incident Reviews Once you have applied your desired filters, share the results by copying the **Post-Incident Review** page URL. Others who open the link see the same filters applied to current post-incident reviews in their view. For example, the following is a pre-set filter you can view in the Jeli web app. If prompted, log in to your Jeli account first. Which incidents do not have a primary investigator assigned? ## Document Key Takeaways During the course of an investigation, themes are expected to grow and change as you learn more and answer newly surfaced questions. Takeaways provide a place to record themes that surfaced throughout the investigation, distill them as you prepare for the learning review, and capture them once they have been discussed in the meeting. 1. In the Jeli web app, navigate to **Post-Incident Reviews** and select your desired post-incident review. 2. Select the **Takeaways** tab and click the text field to begin editing. 3. When you are finished making updates, click **Save**. The **Takeaways** field supports Markdown and [templates](/incident-management/after-incident/jeli-post-incident-reviews/post-incident-review-report/post-incident-review-templates), which help ensure information is recorded in a standardized way. > ****Topics of Interest**:** Consider the following topics while conducting an investigation: > > - What surprised you? > - What do you think others should know more about? > - What qualities does this incident share with other incidents? > ****Further Reading**:** Read Jeli's Howie: The Post-Incident Guide for a more detailed breakdown of incident analysis. ## Import Slack Data Importing Slack channel data into Jeli brings more context into your timelines and helps you prepare for your incident reviews. You can import data to create a new post-incident review or add the data to an existing post-incident review. You can also choose to import the entire channel or only data from a specific time span. ## Post-Incident Review Access Roles Jeli allows you to control who can view, edit, delete, and manage access for every post-incident review. You can assign this access in Slack before any data is imported into Jeli, and then manage it through the web app after import. The following roles are available for individuals, or as a default level of access for a post-incident review: | Action | No Access | Viewer | Editor | Owner | | :----------------------------------------- | :-------- | :----- | :----- | :---- | | View post-incident review | | ✓ | ✓ | ✓ | | Edit post-incident review | | | ✓ | ✓ | | Delete post-incident review | | | | ✓ | | Edit access roles for post-incident review | | | | ✓ | - Users with **No Access** to a post-incident review do not see it in the Jeli app homepage or in the [Learning Center](/incident-management/after-incident/learning-center). - You can assign multiple users the **Owner** role. Every post-incident review in Jeli must have at least one Owner. - Owners can change their own role, but must grant another user ownership before changing their own access level. > ****Admin Access**:** Admins for your organization automatically inherit Owner-level access to every post-incident review in Jeli. View your list of admins in your settings page. ### Manage Access Roles #### Configure Access in Slack When closing a Jeli incident with the `/jeli close` command, or creating a new post-incident review via `/jeli import`, Jeli prompts you to specify a **Post-Incident Review Owner** and a default level of access. #### Configure Access in the Jeli Web App > ****Required User Permissions**:** Account [admins](/incident-management/after-incident/get-started-with-jeli-post-incident-reviews#user-account-roles) or Post-Incident Review Owners can manage a post-incident review's access roles in the web app. You can manually set roles for existing post-incident reviews in the web app, including adding or removing roles for specific users and setting the default access role for all other users. To **view** a post-incident review's current access roles: 1. Navigate to your desired post-incident review. 2. Select **Access** from the left-hand sidebar. This page shows the list of users granted specific roles for the post-incident review. Below the user list, you can see the default access role given to all remaining users. To change this, select the current **role** dropdown and choose the desired role.  *Default access role assignment* To **assign** a user a specific access role: 1. Enter the user's name in the search box to find them. You can enter multiple users to give them the same role. 2. Select the desired **role** for the user or users from the dropdown. 3. Click **Add** to add the user or users to the post-incident review. To **edit** or **remove** a user's access role: 1. Select the dropdown next to the desired user. Choose the new **role**, or select **Remove Access** to remove the user's current role. ### Private Post-Incident Reviews When closing a [private incident](https://support.pagerduty.com/main/docs/jeli-incidents#make-a-jeli-incident-private) and creating a post-incident review for it, only users who were members of the private channel can be added as Post-Incident Review Owners. After creating the post-incident review, an Owner can grant access to additional users via the [Jeli web app](#configure-access-in-the-jeli-web-app). --- URL: https://docs.pagerduty.com/incident-management/after-incident/jeli-post-incident-reviews/basic-post-incident-review-tutorial # Basic Post-Incident Review Tutorial Learn how to effectively prepare for your incident review with Jeli Post-Incident Reviews | Jeli Part of PagerDuty > **Availability:** Jeli is available to customers with a standalone Jeli plan, or the Enterprise plan for Incident Management. > > Please contact our [Sales Team](https://www.pagerduty.com/contact-us/#contact-sales) to upgrade to an account plan with Jeli. ## Prep for Your Incident Review Meeting ⏰ **Time required**: 30 mins to 1 hour In this tutorial, you will learn how to prepare for your incident review meeting. You'll review your Slack transcript to create a **Narrative** timeline of your incident, prepare **Questions** you want to ask during the meeting, and capture a preliminary set of **Action Items**. These three topics will make up the agenda of your review meeting. ### Step 1: Create the Jeli Post-Incident Review and Gather Evidence To create your Jeli Post-Incident Review in Slack, navigate to the resolved incident in Slack and click **Create a Post-Incident Review**. This will automatically generate a report based on the channel's conversation history and details captured by PagerDuty AI. 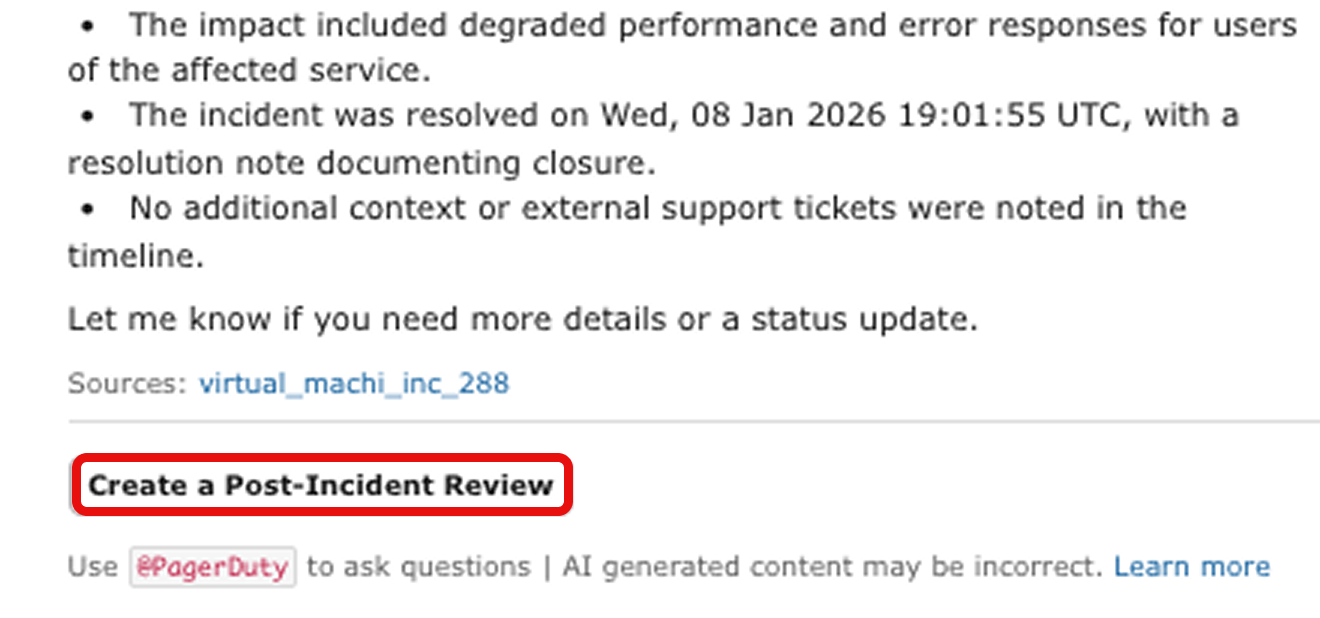 ### Step 2: Create a Narrative in the Narrative Builder When you open your Post-Incident Review in Jeli, navigate to the **Report** → **Narrative** tab. 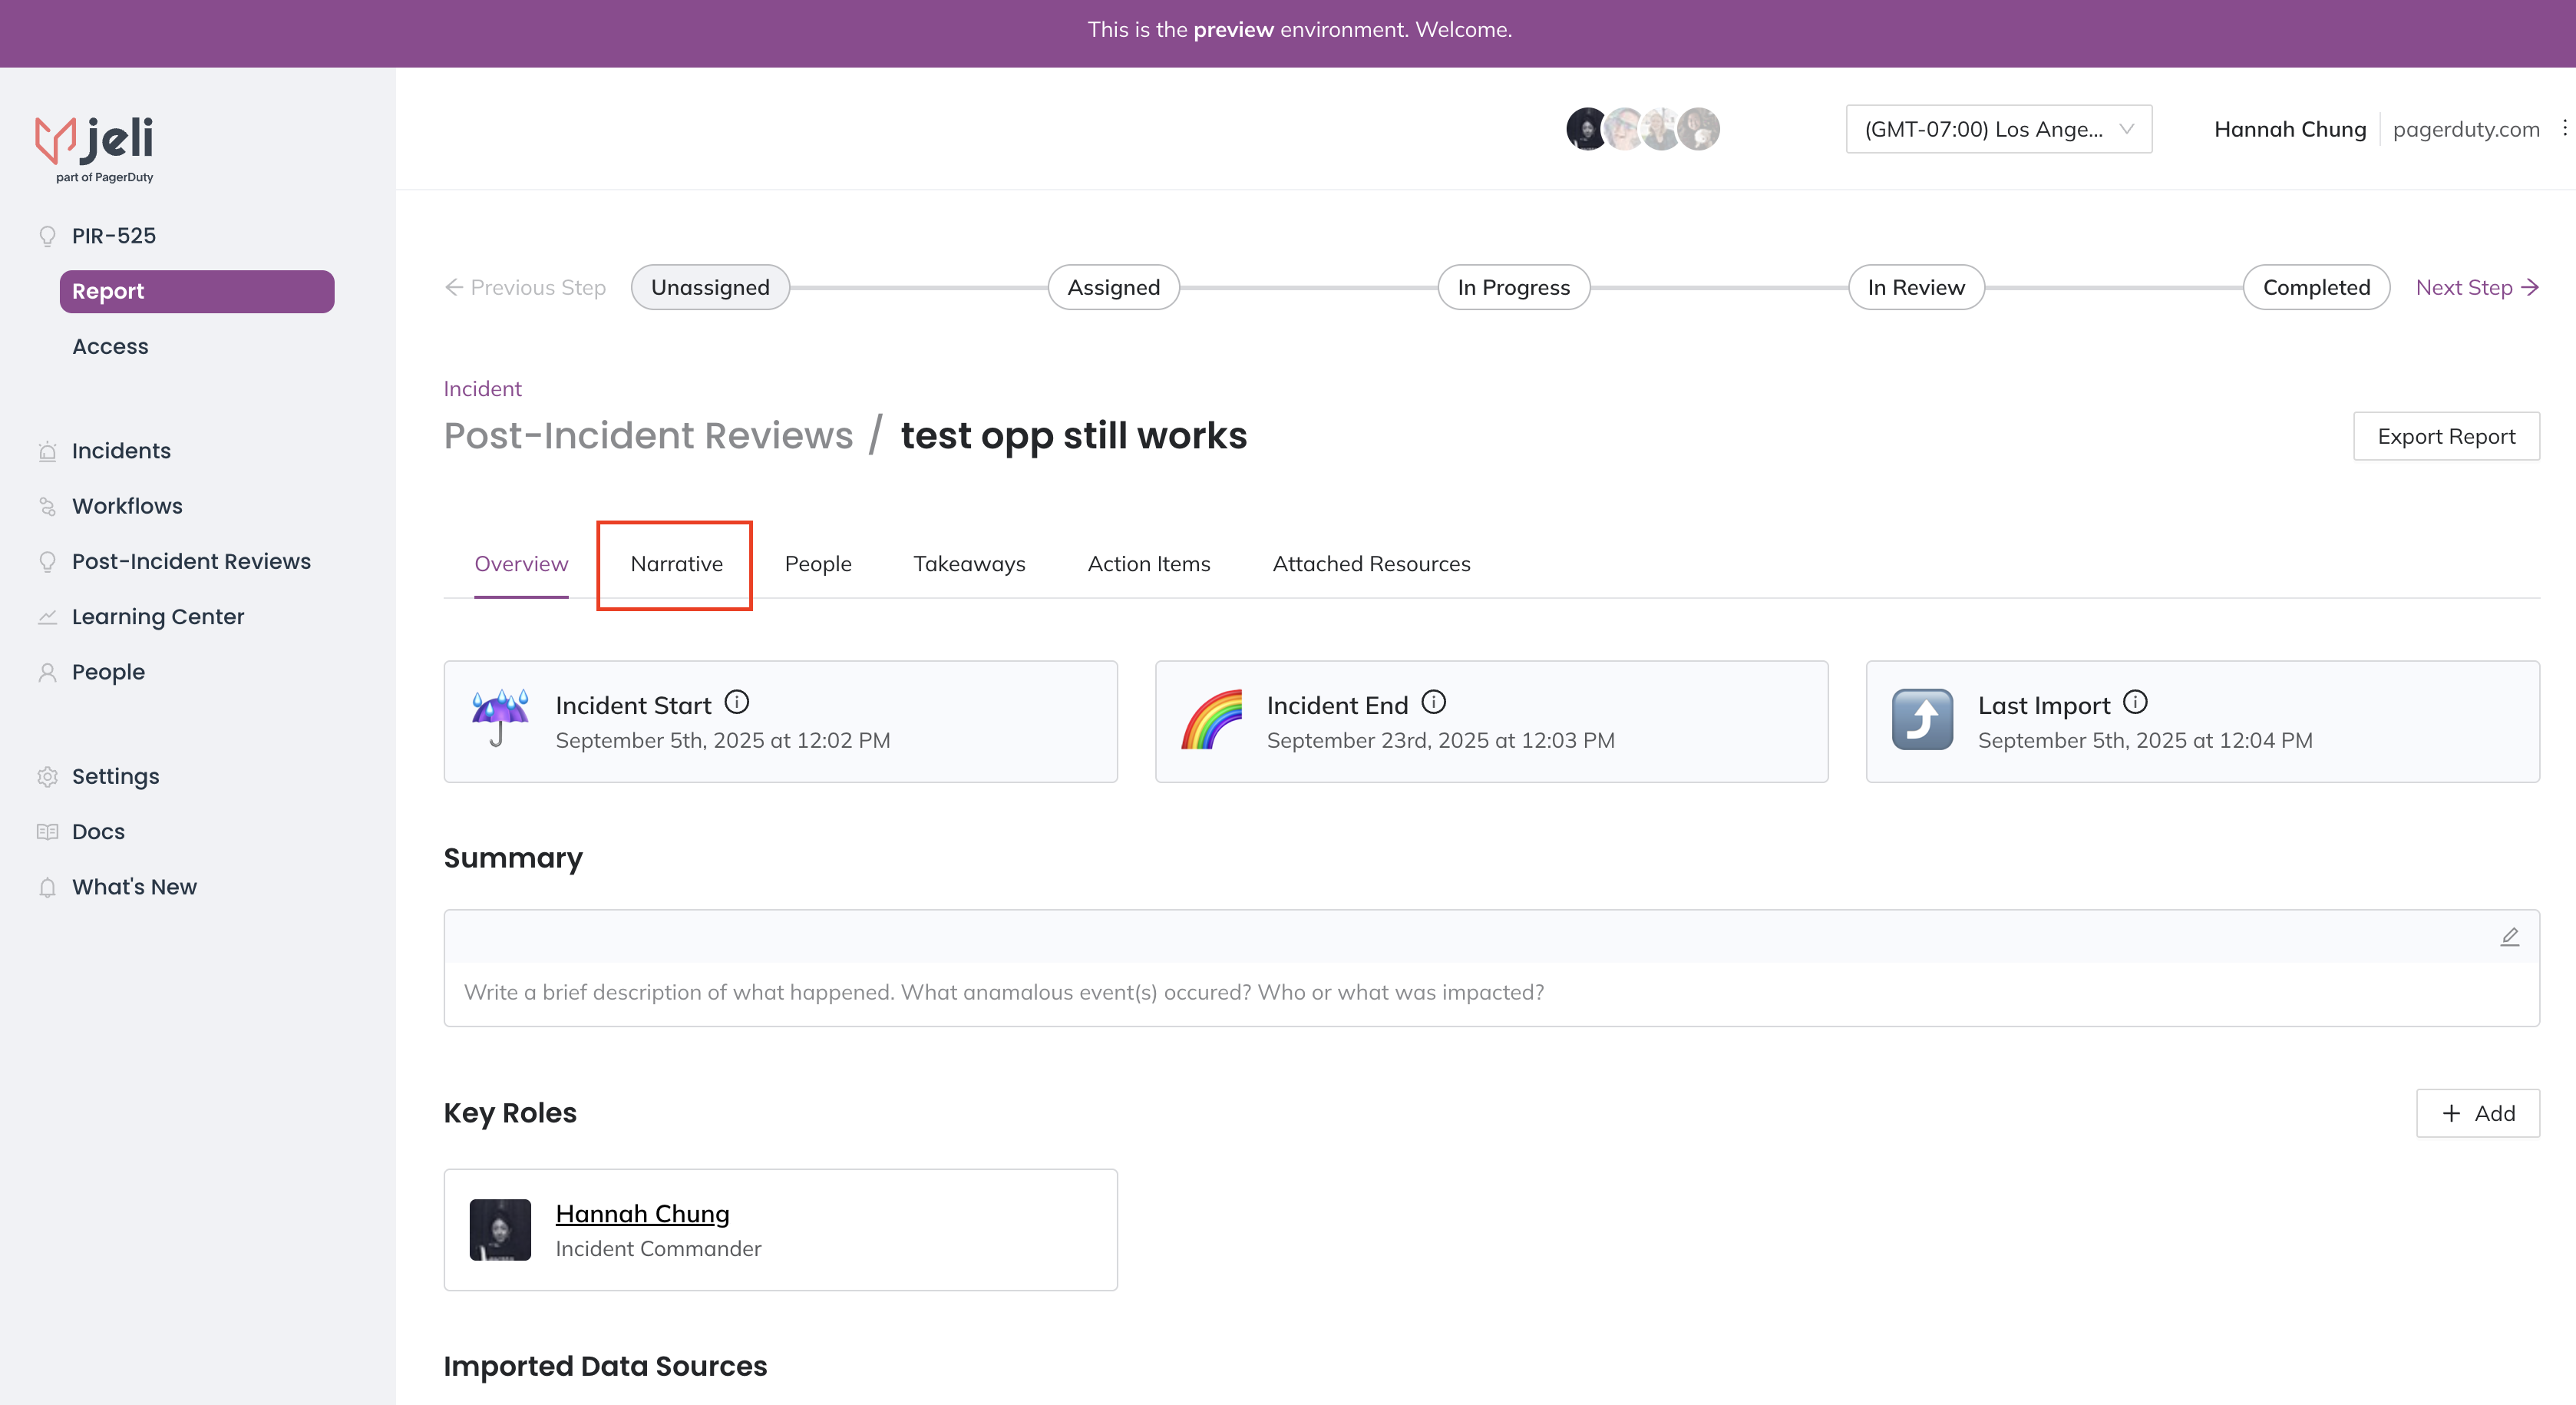 Click **Edit Narrative** and then **Add Marker** to start telling the story of your incident using the markers: - **Detection** - **Diagnosis** - **Repair** - **Key Moment** 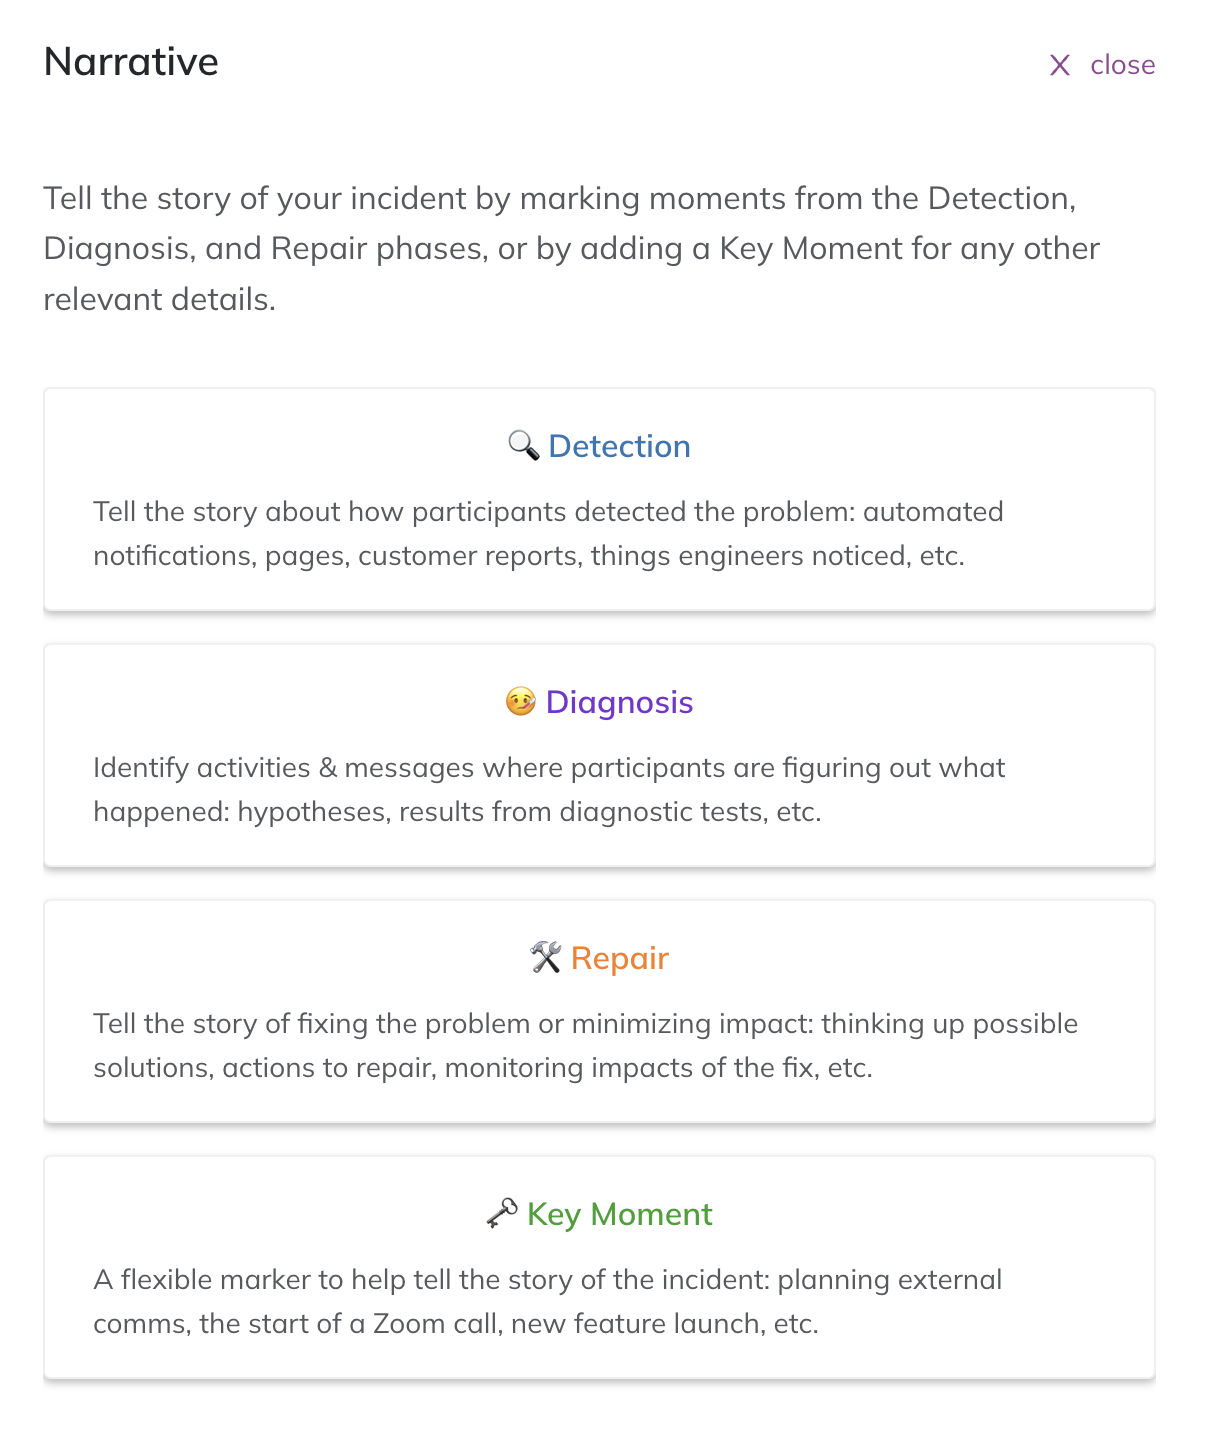 ### Step 3: Add Narrative Marker Details As you skim through the transcript, add additional information to further explain the story. - Add a **Summary** to your marker to easily explain what is happening. - Add messages directly from your sources as **Supporting Evidence** to each marker. - Add **Notes** to each marker to highlight what you want to learn more about (i.e., questions for the review meeting). 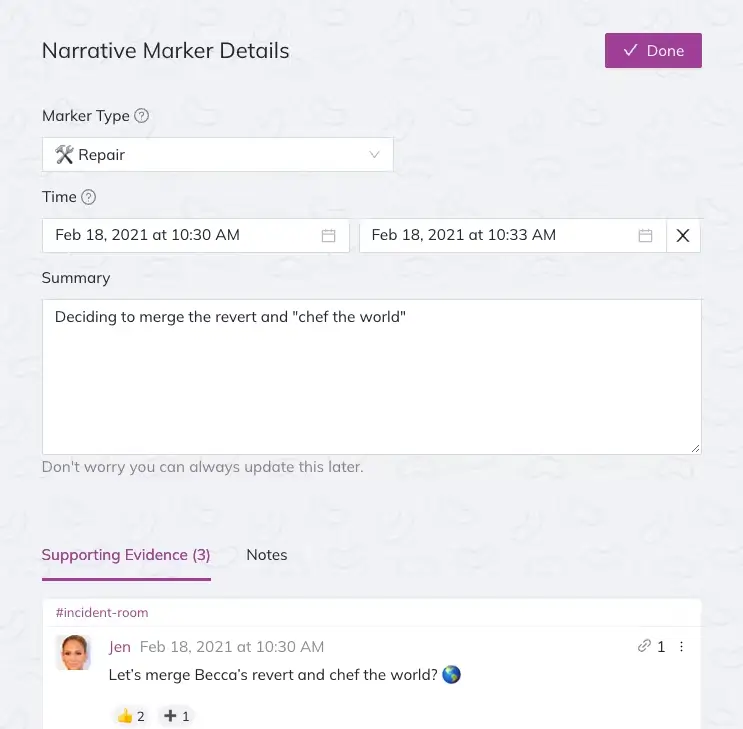 ### Step 4: Use the People View to Understand who was Involved in the Incident Navigate back to the Post-Incident Review and select the **People** tab. The **world map** can help you see how folks coordinated during the incident in different time zones. The **user list** below the map displays who was involved in the incident, and you can use this to ensure your review meeting attendee list is complete. 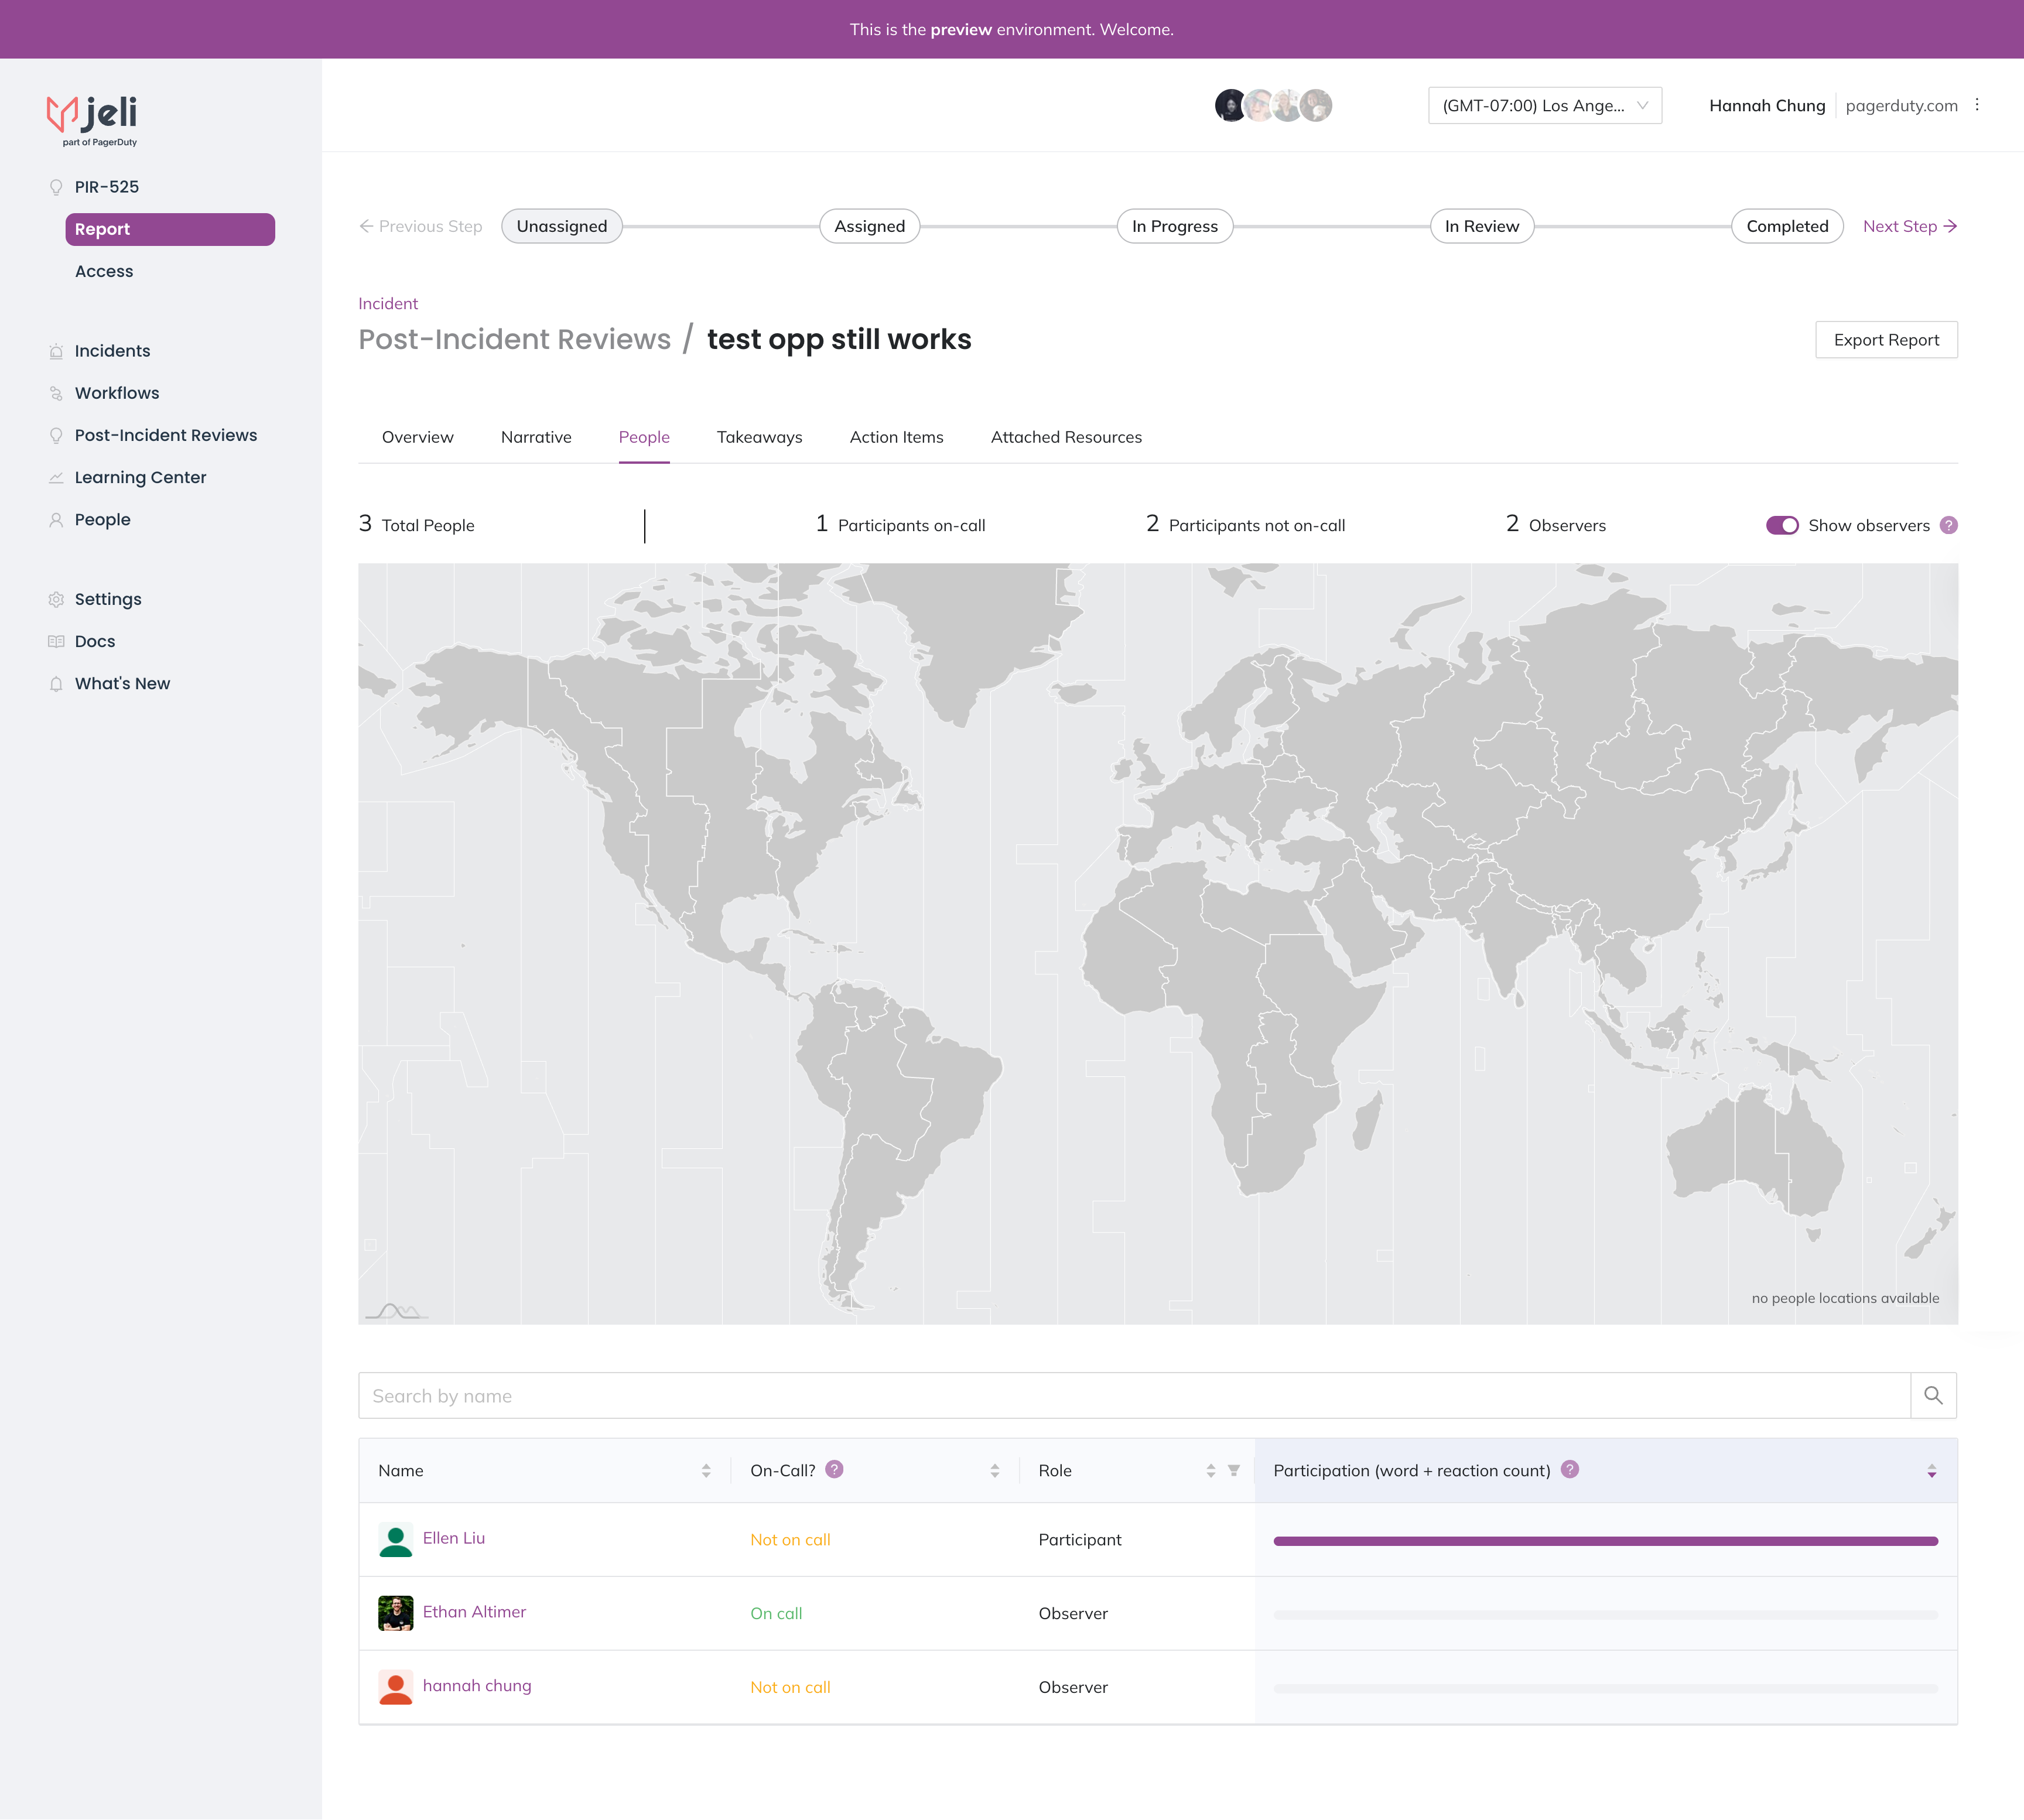 ## During your Review Meeting ### Step 1: Welcome Attendees by Summarizing the Incident Go through the **Summary** and timing details. 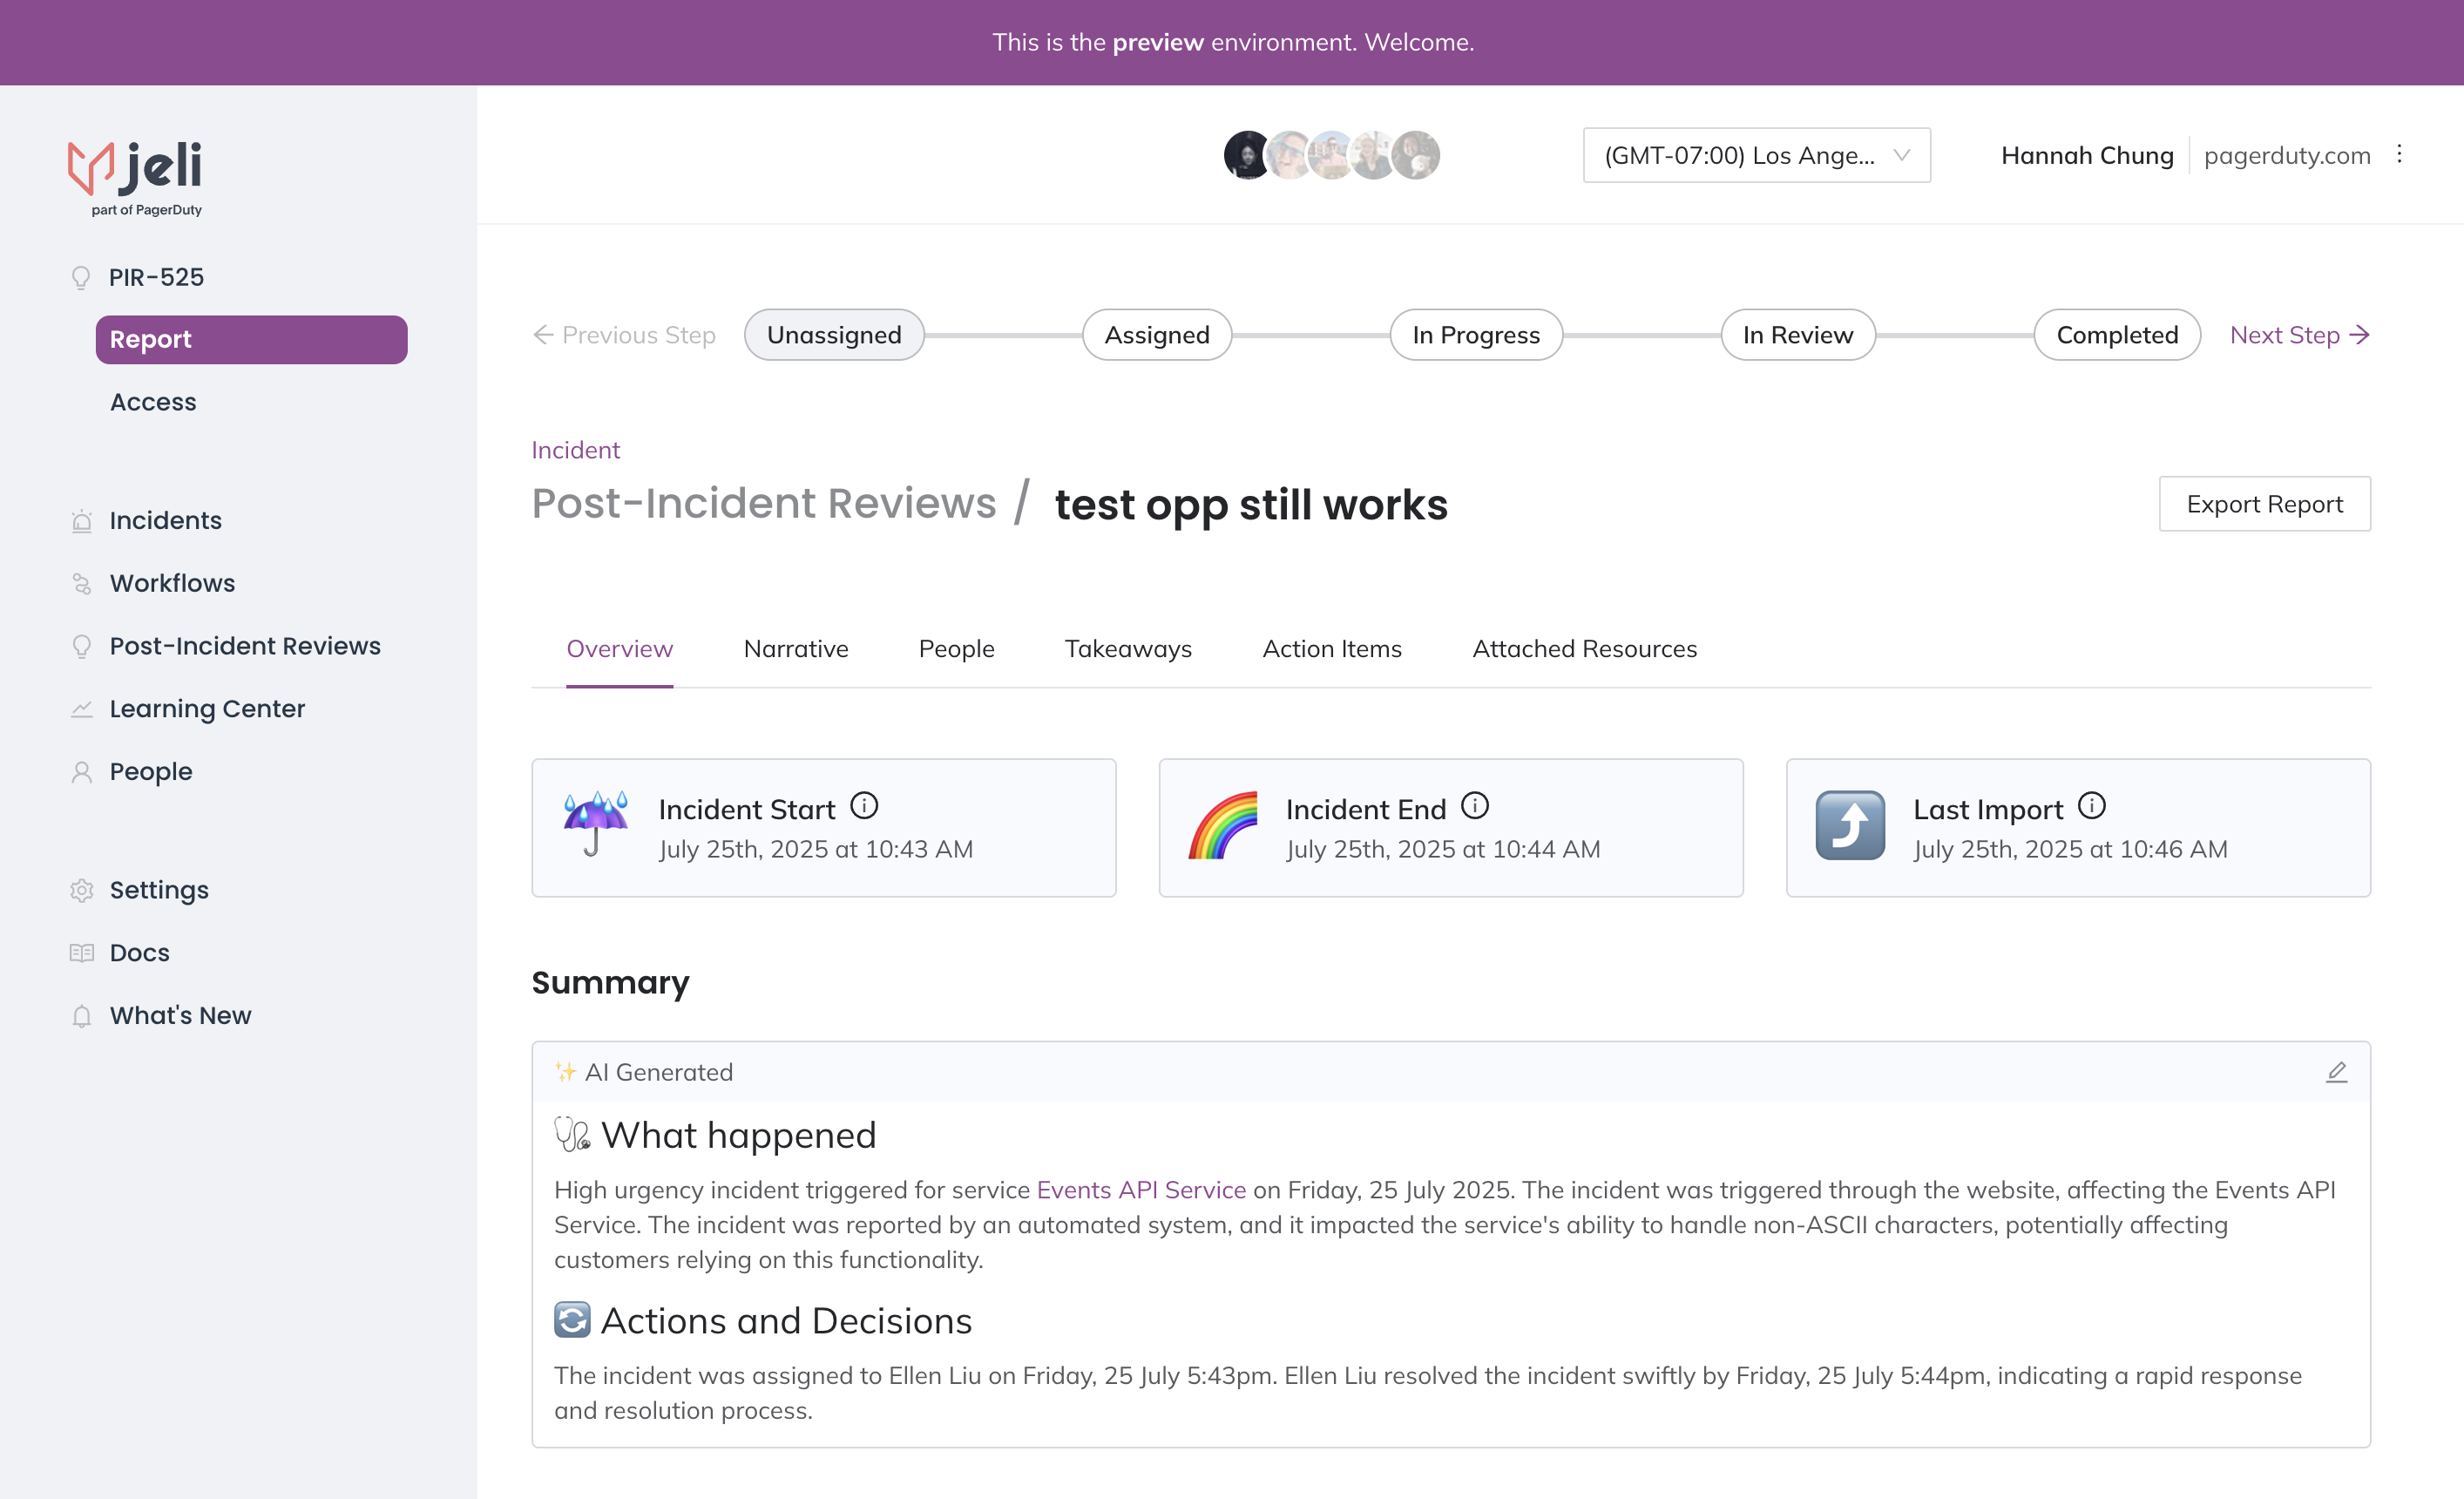 ### Step 2: Review the Narrative Timeline - Go through your narrative timeline in Jeli with the attendees. - Bring up the questions you have noted and call on those who participated in the incident. - Take down any possible action items (you can do this directly in Jeli). - Clarify any closing thoughts and learnings. 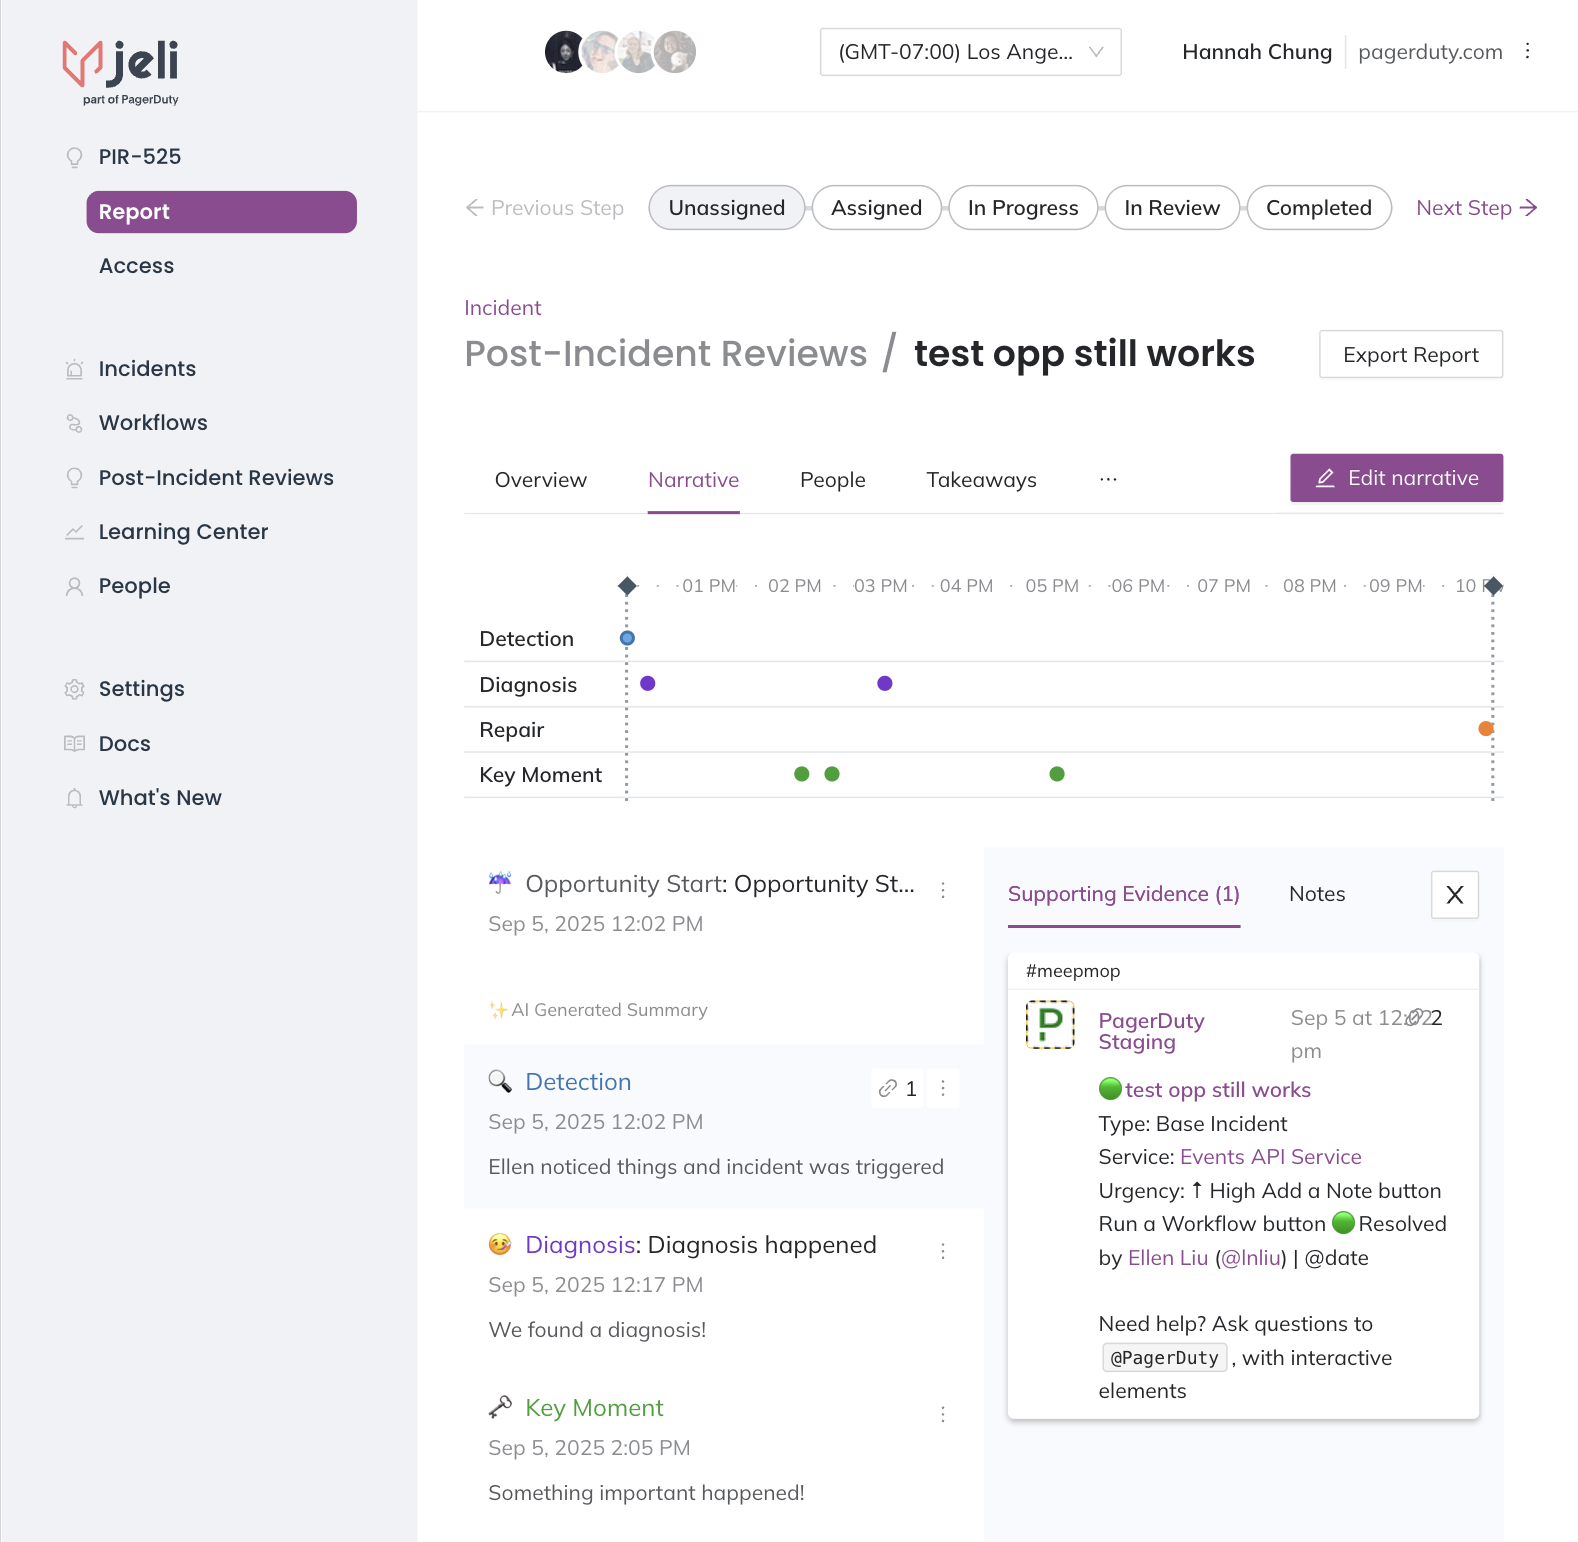 ## After Your Meeting ### Step 1: Update Takeaways and Action Items - You may include **Takeaways** and **Action Items** from your meeting directly in their respective tabs in the Post-Incident Review. - You can summarize this information from notes, or delegate to meeting participants who have the best expertise to write them up.   ### Step 2: Share Your Post-Incident Review with Others in your Organization Export your report as a `.pdf`, choosing which parts of it you want to share depending on your audience. Click **Export Report** in the upper right of the Post-Incident Review and then use the left hand **toggles** to add/remove **Report Sections**. Click **Export Report** on the left to generate a `.pdf` version. There are no user limits, so anyone at your company can benefit from your hard work. They’ll be able to see your timelines and notes, as well as explore for themselves. Check out our [blog post](https://www.jeli.io/blog/techniques-for-sharing-incident-findings) on the different ways you can share incident findings with your organization.  --- URL: https://docs.pagerduty.com/incident-management/after-incident/jeli-post-incident-reviews/post-incident-review-notes # Post-Incident Review Notes Manage and share Jeli event notes for incident review meetings | Jeli Part of PagerDuty In the Notes section of a Jeli Post-Incident Review, you can view event-related notes, add freeform notes and share notes with stakeholders. Use notes to ask incident response questions and prepare for interviews and learning review meetings. You can access the Notes section by navigating to **Post-Incident Reviews** → select your desired **Post-Incident Review** → select **Notes** in the left menu.  *Event Note Example* > **Availability:** Jeli Post-Incident Review Notes are available on the Jeli Standalone (Legacy) pricing plan. > > At this time, Jeli is not available for accounts in the EU service region (i.e., [https://subdomain.eu.pagerduty.com](https://subdomain.eu.pagerduty.com/)). ## Create Notes ### Create Event Notes Add event notes to ask broader questions and clarify what happened during response. 1. In the Jeli web app, select your desired **Post-Incident Review** and select **Events** in the left menu. 2. To the right of your desired event, click the menu and select **Add note**. 3. Enter your note and then click **Create Note**. This note will now be available in the Post-Incident Review's **Notes** section in the left menu. ### Create Freeform Notes You also can add freeform notes to Post-Incident Reviews: 1. In the Jeli web app, select your desired **Post-Incident Review** and select **Notes** in the left menu. 2. Click **Create a Note**. 3. Enter your freeform note and then click **Create Note**. ### Edit Notes 1. In the Jeli web app, select your desired **Post-Incident Review**. 2. Perform the following: i. **If you are editing an [event note](#create-event-notes)**: You can select either **Notes** or **Events** in the left menu (the note will be available in both sections). Proceed to step 3. ii. **If you are editing a [freeform note](#create-freeform-notes)**: Select **Notes** in the left menu. Proceed to step 3. 3. You may search to locate the note. Click the menu to the right of the note you want to edit and select **Edit note**. 4. Edit your note and then click **Done** to save. ### Delete Notes 1. In the Jeli web app, select your desired **Post-Incident Review**. 2. Perform the following: i. **If you are deleting an [event note](#create-event-notes)**: You can select either **Notes** or **Events** in the left menu (the note will be available in both sections). Proceed to step 3. ii. **If you are deleting a [freeform note](#create-freeform-notes)**: Select **Notes** in the left menu. Proceed to step 3. 3. You may search to locate the note. Click the menu to the right of the note you want to delete and select **Delete note**. 4. A confirmation modal will appear. Click **Delete** to delete the note. ## View and Search Notes Select **Notes** in an Post-Incident Review's left menu panel to see a list of notes created in the Events section, and/or freeform notes created in the Notes section. Enter a **search term** into the **Search** bar to find a specific note. ## Share Notes You can share the link to your Post-Incident Review's Notes page with others that you'd like to interview, so they know your questions ahead of time. You can also share this link with incident responders who you might call on for context during the learning review. 1. In the Jeli web app, navigate to your desired **Post-Incident Review** and select **Notes** in the left menu. 2. In the **Search** bar, enter the **name** of the person you’d like to share the link with. 3. This will pull up all the notes where their name appears. 4. **Copy the URL** to share a direct link with them. --- URL: https://docs.pagerduty.com/incident-management/after-incident/jeli-post-incident-reviews/post-incident-review-report # Post-Incident Review Report Compile incident data and build a narrative for analysis in incident review meetings | Jeli Part of PagerDuty The Post-Incident Review Report provides a space to build an incident narrative, view participants, and document key takeaways and action items. Post-Incident Review Reports surface insights into organizational patterns and they help create structure for incident review meetings. Navigate to **Post-Incident Reviews** → select your preferred **Post-Incident Review** → **Report**. You will then see tabs outlined in the following sections. > **Availability:** Jeli is available to customers with a standalone Jeli plan, or the Enterprise plan for Incident Management. > > Please contact our [Sales Team](https://www.pagerduty.com/contact-us/#contact-sales) to upgrade to an account plan with Jeli. ## Overview When you navigate to an Post-Incident Review's **Report** → **Overview** tab you'll see cards detailing **Incident Start**, **Incident End** and **Last Import** at the top.  *Post-Incident Review Report Overview tab* | Card | Description | | :----------------- | :------------------------------------------------------------------------------------------------------------------------------------------------------------------------------------------------------ | | **Incident Start** | By default, Jeli determines this timestamp by the earliest message collected from Slack. You can edit this value in the [Narrative Builder](/incident-management/after-incident/jeli-post-incident-reviews/post-incident-review-report/narrative-builder) under the **Incident Start** marker. | | **Incident End** | By default, Jeli determines this timestamp by the latest message collected from Slack. You can edit this value in the [Narrative Builder](/incident-management/after-incident/jeli-post-incident-reviews/post-incident-review-report/narrative-builder) under the **Incident End** marker. | | **Last Import** | Jeli determines this timestamp by the most recent data import into the Post-Incident Review. | > **Time Zone:** All times on this page are displayed in the user's local time zone. ### Summary The **Summary** section offers a Markdown-supported text field to document a high-level summary of the incident and its investigation. Click the icon to the right of the Summary to enter or edit it. You can also click **Choose a template** to populate the field with a prepared template. Read [Post-Incident Review Templates](/incident-management/after-incident/jeli-post-incident-reviews/post-incident-review-report/post-incident-review-templates) for more information. ### Key Roles The **Key Roles** section allows you to specify who filled each role during the incident. By highlighting key roles, you can see at-a-glance who played a significant part in either the logistics of an incident or its investigation.  These roles are also displayed elsewhere in Jeli. For example, displaying the investigator(s) assigned to an Post-Incident Review, on the **Post-Incident Reviews** list page.  *Key roles on the Post-Incident Reviews page* #### Add a Role  > **Tip:** If you are using the [Jeli Slackbot](/incident-management/after-incident/get-started-with-jeli-post-incident-reviews), you will have the option to assign yourself a role, e.g., Incident Commander, Communications Lead, or any other custom role you’ve added in the Jeli web app. Jeli will add the user who opened the incident as the Incident Commander by default if you do not choose one using the `/jeli open` modal. You can always update the Incident Commander later in the incident's lifecycle. 1. On an Post-Incident Review's **Reports** → **Overview** tab, under **Key Roles**, click **Add**. 2. Select a **Role**, and under **Assign to** select your preferred user. **Note**: Post-Incident Reviews may have many individuals assigned to the same role (e.g., multiple investigators). 3. Click **Add** to add the role.  #### Delete a Role To delete a role from your Post-Incident Review: 1. On a Post-Incident Review's **Reports** → **Overview** tab, under **Key Roles**, hover over the user’s name and click the menu to the right. 2. Select **Delete**. This will delete the key role assignment, but will not remove the individual as a participant in the Post-Incident Review, or impact your Post-Incident Review in any other way.  ### Imported Data Sources When you [import data from Slack](/incident-management/after-incident/jeli-post-incident-reviews#import-slack-data) or [other integrations](/incident-management/after-incident/jeli-settings-and-integrations), you will see a link to the data source(s) along with information on who uploaded them in this section. ### Post-Incident Review Tags Tags are metadata that you can apply to any Post-Incident Review. Tagging helps with categorization, correlation and filtering. Read [Post-Incident Review Tags](/incident-management/after-incident/jeli-post-incident-reviews/post-incident-review-report/post-incident-review-tags) for more information. ### Related Post-Incident Reviews The **Related Post-Incident Reviews** section details other Post-Incident Reviews that may share similarities in Technologies, Services, etc., based on [Post-Incident Review Tags](/incident-management/after-incident/jeli-post-incident-reviews/post-incident-review-report/post-incident-review-tags). Read our [Related Post-Incident Reviews](/incident-management/after-incident/jeli-post-incident-reviews/post-incident-review-report/related-post-incident-reviews) article for more information. ## Narrative The Narrative Builder is designed to help you discover, tell, and share the story of an incident. You'll write an executive summary, and develop a shareable visualization that you can center post-incident meetings around. Read our [Narrative Builder](/incident-management/after-incident/jeli-post-incident-reviews/post-incident-review-report/narrative-builder) article for more information. ## People The People tab provides insights into participants’ incident involvement and roles. Read our [View Review Participant Data](/incident-management/after-incident/jeli-post-incident-reviews/post-incident-review-report/see-participant-information) article for more information. ## Takeaways During the course of a Post-Incident Review, themes will often grow and change as you learn more and answer newly-surfaced questions. Takeaways provide a place to record themes, to distill them as you prepare for the learning review, and to capture them once they’ve been discussed in the meeting. 1. In the Jeli web app, navigate to **Post-Incident Reviews** → select your desired **Post-Incident Review** → **Report**. 2. Select the **Takeaways** tab and click the icon on the right to begin editing. 3. When you're finished making updates, click **Save** in the bottom right.  *Post-Incident Review takeaways* The **Takeaways** field supports Markdown, and it also supports [templates](/incident-management/after-incident/jeli-post-incident-reviews/post-incident-review-report/post-incident-review-templates), which can help ensure that information is recorded in a standardized way for your organization. > **Topics of Interest:** Consider the following topics while conducting an investigation: > > - What surprised you? > - What do you think others should know more about? > - What qualities does this incident share with other incidents? > **Further Reading:** Please read Jeli's [Howie: The Post-Incident Guide](https://www.jeli.io/howie/welcome) for a more detailed breakdown of incident analysis. ## Action Items Action items provide a structured way to document and track remedial steps and future improvements identified during a Jeli incident. Read our [Collect Action Items](/incident-management/after-incident/jeli-post-incident-reviews/post-incident-review-report/collect-action-items) article for more information. ## Attached Resources The **Attached Resources** tab provides a place to upload external files for reference as you conduct your investigation, and to consolidate record keeping when referring to an Post-Incident Review in the future. 1. In Jeli, select your preferred **Post-Incident Review** and navigate to **Report** → **Attached Resources**. 2. Click the **upload area** to select files from your computer, _or_ drag and drop resources into the **upload area**. Attached files will appear in the **Uploaded Files** section below.  > **Formats and File Size:** You can upload files in the following formats: `.pdf`, `.rtf`, `.txt`, `.vtt` (Zoom). The maximum file size is 200 MB. ### Edit an Attached Resource's Display Name 1. On a Post-Incident Review's **Attached Resources** tab, hover over a file name in the **Uploaded Files** section and click . 2. Enter a new file name and click . The original file name will be displayed below.  *Renamed resource* ### Delete an Attached Resource 1. On an Post-Incident Review's **Attached Resources** tab, hover over a file name in the **Uploaded Files** section and click . 2. In the confirmation modal, click **Delete file**. ## Export a Report From an Post-Incident Review's **Report** section, click **Export Report** in the upper right to export your incident analysis in a shareable format. Clicking **Export Report** will take you to a preview of your report, which includes the following by default: - **Summary** - **Key Roles** - **Timeline** - Includes the exporter's time zone - **Narrative** - Includes each narrative marker's summary. For privacy, it does not include notes or supporting evidence. - **Takeaways** - **Action Items** - **Attached Resources** - **Note**: When the report is exported as a `.pdf`, any attached resources will be converted to clickable links. This means that anyone with access to the `.pdf` report will also have access to the attached resources. > **Example Report:** Feel free to reference [Jeli Report – Post-Incident Review Butter Side Up](https://drive.google.com/file/d/1DxbM5NE7jX-Ez5YixRGCPvwlP57Ip4mo/view?usp=sharing) for an example report. For more techniques for sharing incident findings check out our [Incident 101](https://www.jeli.io/blog/techniques-for-sharing-incident-findings) blog. ### Edit the Report You can enable or disable report sections in the left hand **Report Sections** module by turning the toggles on or off. If a section does not contain any information, it will be grayed out in the selection menu.  You can also reorder report sections by selecting the section name, then dragging and dropping to a new location:  You can select the report timeline's time zone before you export. This will not change the time zone in the rest of the Post-Incident Review, only in the `.pdf` export. ### Generate the Report To generate a `.pdf` version of the report, from the report preview click **Export Report** and choose **Save as PDF** from the print dialogue. **Note**: Make sure you have **Print backgrounds** selected in your print dialog options. --- URL: https://docs.pagerduty.com/incident-management/after-incident/jeli-post-incident-reviews/post-incident-review-report/collect-action-items # Collect Action Items Track remedial follow-up steps from a Jeli incident review as Quick Items or synced Jira tickets, linked directly to the Post-Incident Review. Action items provide a structured way to document and track remedial steps and future improvements identified during a Jeli incident. Action items ensure that lessons learned are translated into concrete follow-up steps, for example: - Engineering work tickets and other work items. - Setting up a meeting to discuss the options for tackling a specific issue. - A project to pull data from incidents involving a piece of legacy code to help prioritize a re-write. - An initiative to involve support teams earlier in the product development process. > **Availability:** Jeli is available to customers with a standalone Jeli plan, or the Enterprise plan for Incident Management. > > Please contact our [Sales Team](https://www.pagerduty.com/contact-us/#contact-sales) to upgrade to an account plan with Jeli. > **More Information:** For more information on Action Items, please see our blog post [Handling Action Items](https://www.jeli.io/blog/handling-action-items) as part of our [Incident Analysis 101](https://www.jeli.io/learnings/incident-analysis-101) series. ## View Action Items You can view action items in the Jeli web app: 1. Select **Post-Incident Reviews** from the left navigation and select your desired Post-Incident Review from the list. 2. Select the **Action Items** tab. The **Action Items** tab is available in the **Report** section of an Post-Incident Review. ## Add Action Items ### Quick Items If there are action items you would like to create and track outside of Jira, we provide a simple and flexible **Quick Items** option. 1. From the **Action Items** tab in your Post-Incident Review, toggle the option for **Show Quick Items**.  2. The text field for **Action Items** supports Markdown. You may wish to create check boxes using `[ ]` and mark them off with `[x]` as they're completed.  > **Delete a Quick Item:** To delete a quick item, click into the text field, make your required deletions, and click away from the field to save changes. ### Action Items In Jira After configuring our [Jira Integration | Jeli](/incident-management/after-incident/jeli-settings-and-integrations/jira-integration-jeli), you can create new action items in Jira, or link existing Jira issues as action items. #### Create a New Jira Ticket as an Action Item 1. From the **Action Items** tab in your Post-Incident Review, select **Add an action item** → **Create**.  2. Select your Jira **Project** and **Issue type**. 3. Enter your issue's **Summary (name)** and, _optionally_, a **Description**. 4. Click **Create**. The Jira issue will be created, linked to your Post-Incident Review and the details of the issue will be displayed.  #### Link a Jira Issue as an Action Item 1. From the **Action Items** tab in your Post-Incident Review, select **Add an action item** → **Link**.  2. In the **Link a Jira issue** field, paste the **URL** of your Jira issue. The Jira issue will be linked to your Post-Incident Review and details about the issue will be displayed.  #### Delete a Jira Ticket Action Item To delete a Jira ticket action item: 1. Click to the right of the link ticket and select **Delete**.  2. When prompted, click **Delete action item**. > **Tip:** This action does not delete the issue in Jira. --- URL: https://docs.pagerduty.com/incident-management/after-incident/jeli-post-incident-reviews/post-incident-review-report/narrative-builder # Narrative Builder Create detailed incident timelines for review meetings with the Narrative Builder | Jeli Part of PagerDuty The Narrative Builder is designed to help you discover, organize, and share the story of an incident. It allows you to use primary data as evidence for your narrative, create an incident timeline, and develop a shareable visualization for incident review meetings. By using Narrative Builder you will: - Use [event markers](#event-markers) to indicate important moments of the incident. - Add descriptive notes that offer additional color and insight into the incident. - Quickly and easily attach evidence to event markers, so that those unfamiliar with the incident can follow along and learn. - Create a rich, detailed [timeline](#view-the-narrative-timeline) of what happened during the incident and highlight key events.  > **Availability:** The Narrative Builder is available with the Professional, Business, and Enterprise for Incident Management pricing plans. > > Please [contact our Sales Team](mailto:sales@pagerduty.com) if you would like to upgrade to a plan featuring Narrative Builder. ## Build a Narrative > **Import Data:** If you haven’t already, use Slack to import incident data into Jeli using the `/jeli import` command. You can also import data from additional Slack channels. Please read [Slack Integration | Jeli](/incident-management/after-incident/get-started-with-jeli-post-incident-reviews) for more information. 1. Navigate to an Post-Incident Review in the Jeli web app by using one of the following options: 1. Select a **Closed** incident and click **Go to Post-Incident Review** in the upper right. 2. Or go to **Post-Incident Reviews** in the left menu and select your preferred **Post-Incident Review**. 2. Select the report's **Narrative** tab: 1. **If you haven't started building the Narrative yet**: A **Build your Narrative** modal will appear. Click **Let's get started!** 2. **If you've already started building the Narrative**: Click **Edit narrative** to enter the Builder view. This will be your main workspace as you identify incident events that you want to mark in your timeline. ### Choose Supporting Evidence 3. **Evaluate Messages**: In the **Post-Incident Review Data** section on the left, review your transcript line-by-line and ask yourself if each message is important to tell the incident's story. You should also check to see if each message fits within one of the event marker types: | Event Marker Type | Suggested Questions | | --- | --- | | **Detection** | - How were we alerted? Where did we see this alerting and why was this brought to our attention?
- Who knew at the beginning and how did they find out?
- Who did they bring in and how did they know to do this?
- What background information did they have on this topic? | | **Diagnosis** | - What were responders looking at and why?
- What did the problem mean? What was the impact?
- What did people think was happening?
- What did they try to do? What tools did they use for this?
- How did they communicate this with each other? | | **Repair** | - What were some possible solutions to the issue?
- How did responders arrive at this solution? What constraints did they have?
- How did they confirm if the solution worked or didn’t work? | | **Key Moment** | - How did responders collaborate?
- Was anything confusing?
- Did the communication methods change?
- Did they share information with outside parties?
- Did people learn something new? | Please read [Event Markers](/incident-management/after-incident/jeli-post-incident-reviews/post-incident-review-report/narrative-builder#event-markers) for more information. 4. **Organize Messages Under Event Markers**: To add a message to an event marker, select the **checkbox** to the left of the message and select an **event marker** from **Narrative** section on the right side of the screen. 1. You may include multiple pieces of evidence under the same marker if they all relate to the same point. When choosing an event marker, read the messages around it. 2. If multiple messages explain what is happening during that part of the story, they should be included as well. 5. **Add Supplemental Evidence**: You can also add evidence from outside of Slack messages by clicking **Add supplemental evidence** when entering an event marker's details. Here you can add images, links, or text to offer additional context to the incident's story. This might be screenshots of graphs, links to a specific query, or a copy-and-paste of relevant logs. > **Tip:** As a general rule, we recommend using multiple pieces of evidence under a single marker if you can summarize what is happening within two sentences. Any more is a signal that you may want to break it out into separate markers. For example: _A conversation about a team deciding to revert a change may include multiple messages as supporting evidence under the same Repair Marker._ ### Update Event Marker Details 6. **Incident Start and End Time**: After you’ve added supporting evidence to the narrative, you may update the Incident start and end times. The **Incident Start** and **End Times** are automatically generated based on the first channel ingested into the Post-Incident Review. To change this information, click , select a new date and time, and click **OK**. 7. **Write a Summary**: Update the **Summary** field with a few sentences describing what is happening in the supporting evidence. For example, "SREs and Software Engineers decide to move forward and revert the change made earlier in the day". > **Tip:** We recommend using plain language, as if you are telling the story of what happened to a coworker or in an incident review meeting. 8. **Add Notes** (_Optional_): We recommend using the **Notes** section to ask any questions that arise based on the supporting evidence. Even if you think you know the answer, if something is unclear it is helpful to ask it during the review meeting so others can learn from it. 9. Click **Done** to save your marker. 10. **Add More Markers to Help Tell Your Story**: You can choose as many markers as you need to tell your story. You do not have to go in a linear detection-diagnosis-repair manner, either. Your focus may jump forward or backward as more information becomes available. For example, halfway through the repair phase you may discover that another component is impacted, and another team's expertise is needed to progress with the investigation. The following example highlights rich insights associated with each marker: 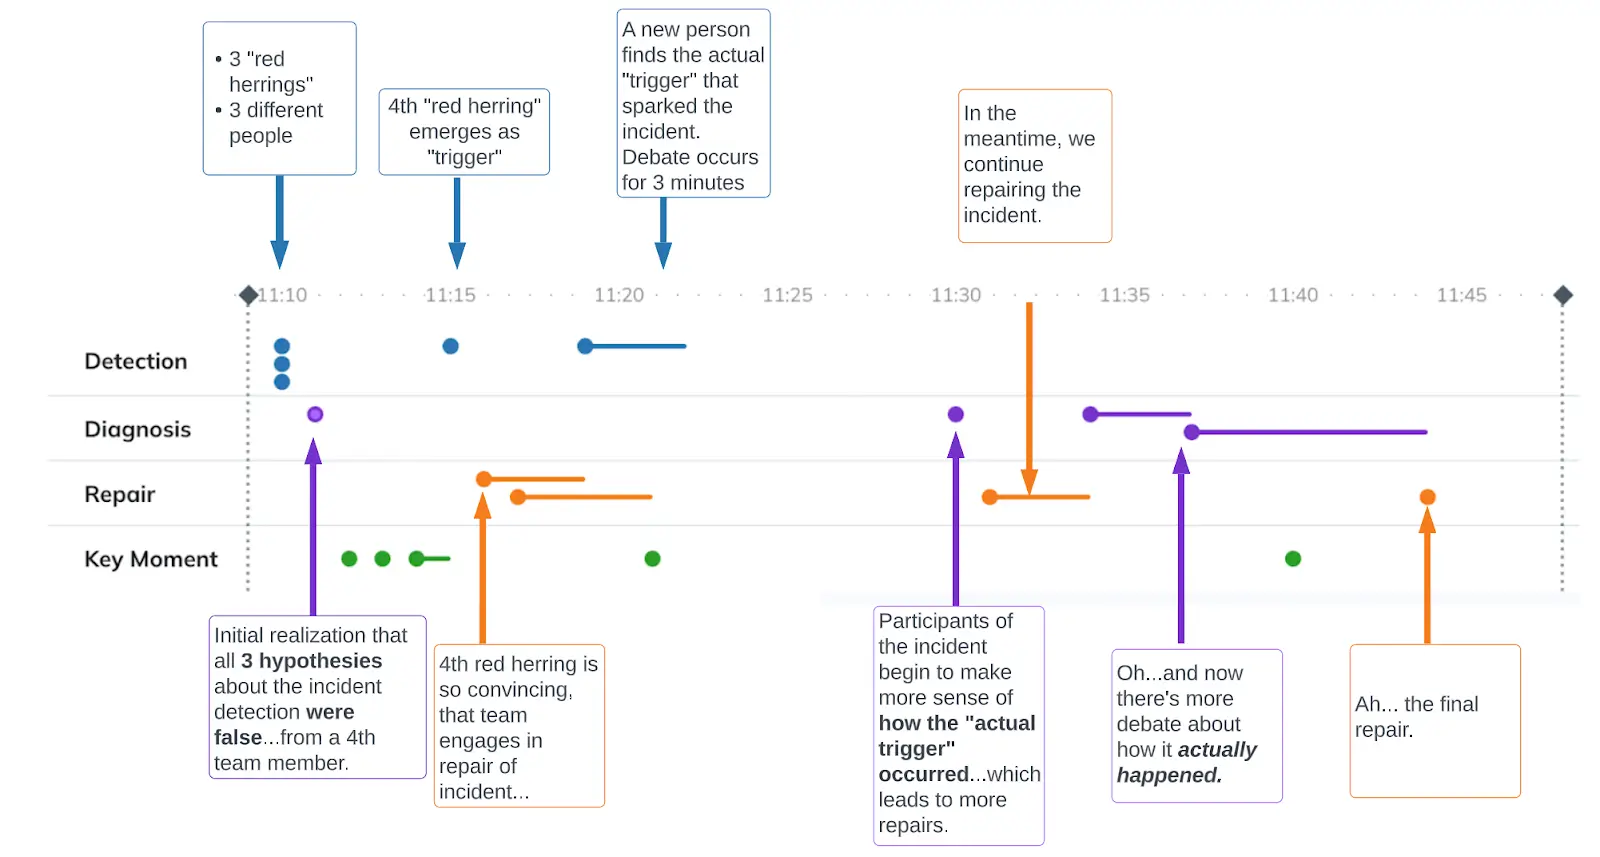 *Narrative view* ### Finish Your Narrative 10. Once you have finished adding and/or editing event markers, you can click **Close Builder** at the bottom center of the screen. You will be able to see the narrative timeline visualization as well as a list of event markers below. You may now use your narrative in the next step of your incident analysis process. We recommend using it to set your incident review meeting's agenda. Please read [Basic Post-Incident Review Tutorial](/incident-management/after-incident/jeli-post-incident-reviews/basic-post-incident-review-tutorial) for more information. 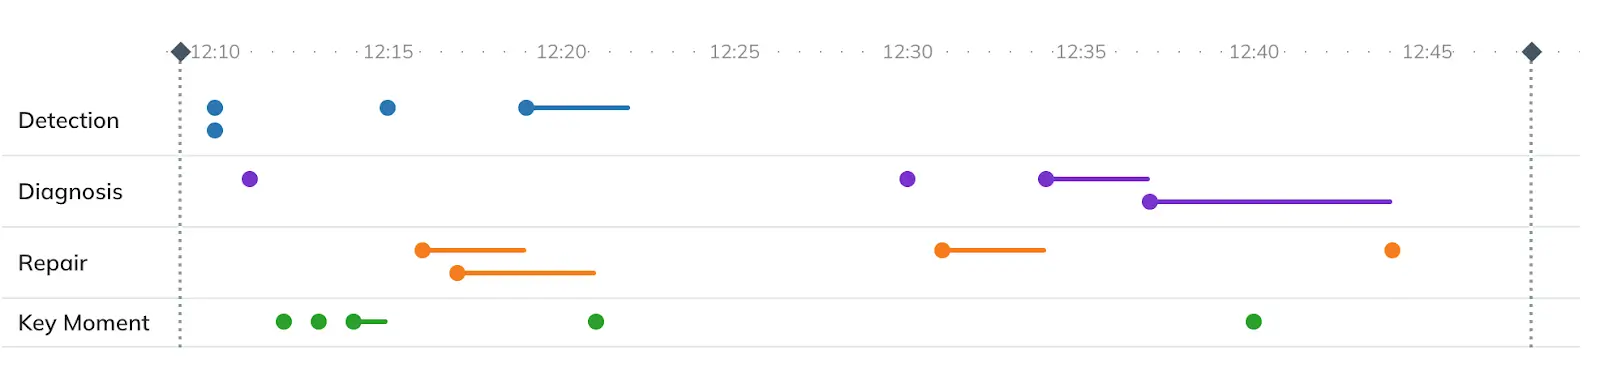 *Narrative view* ### Edit or Delete an Event Marker While building your narrative, you may need to edit or delete a marker. #### Edit an Event Marker To edit an existing marker: 1. Navigate to your preferred Post-Incident Review, select the **Narrative** tab and click **Edit narrative**. 2. Hover over the menu next to a marker and select **Edit**. 3. Make your desired changes and click **Done**.  *Edit narrative marker* #### Delete an Event Marker 1. Navigate to your preferred Post-Incident Review, select the **Narrative** tab and click **Edit narrative**. 2. Hover over the menu next to a marker and select **Delete**. 3. In the confirmation modal, click **Delete marker**.  *Delete an event marker* ## Narrative Builder Components The Builder view is split into two side-by-side panes with imported Slack channels and Post-Incident Review data on the left, and your working narrative timeline with event markers on the right. - [Post-Incident Review Data](#search-and-filter-post-incident-review-data) contains message logs from imported Slack channels with search and filter options to help you find the messages that marked different events throughout the incident. - [Narrative Timeline](#view-the-narrative-timeline) is where you create and flesh out event markers, add summaries, notes and pull in supporting evidence from messages you find in Post-Incident Review data. The event markers you create build out the story of the incident and make up the visual timeline you see at the top of the presentation view. > **Tip:** A helpful approach to narrative building is to think of the Post-Incident Review data as the pieces of a puzzle, and the narrative timeline as the canvas where you piece them together to form the bigger picture of the incident.  *Post-Incident Review Data and Narrative* ## Event Markers Event markers are the points along your Narrative timeline that compose the story of your incident. There are four types of event markers: | Event Marker | Description | | :------------- | :--------------------------------------------------------------------------------------------------------------------------------------------------------------------------------------------------------------------- | | **Detection** | Tells the story about how participants detected the problem, for example automated notifications, responder notifications, customer reports, etc. | | **Diagnosis** | Activities and messages where participants figured out what happened: tracking hypotheses, results from diagnostic tests, sharing dashboards and graphs, etc. | | **Repair** | Tells the story of how the problem was fixed or impact was minimized: brainstorming solutions, actions taken to repair, monitoring impacts of the fix, etc. | | **Key Moment** | Flexible in definition and use. These event markers help tell the story of the incident and denote various changes during incident response: planning external comms, starting a Zoom call, a new feature launch, etc. |  To add an event marker use the **+ Add marker** button in the top right hand corner:  Within each event marker you can add a summary, supporting evidence, notes, and the time of the event. - The **Summary** is where you will describe the nature of the event. What makes this important, or how does it change the story of the incident? - **Note**: This is the primary information that is displayed for each event marker in the timeline view. - **Supporting Evidence** is where you link relevant Slack messages to the marker. You can drag them from the Post-Incident Review data side of the screen directly into the marker. Supporting evidence for the earliest detection marker in your timeline might be an exchange of messages in a public engineering channel asking about a confusing dashboard, or a single ping in an alerts channel. - Drag and drop events directly into a narrative marker under **Supporting Evidence** in the Narrative Marker Details panel. This will add them as evidence within the marker.  - **Add Supplemental Evidence**: You can also add evidence from outside of Slack messages by clicking **Add supplemental evidence**. Here you can add images, text, and links to add context to the story of the incident. This might be screenshots of graphs, links to a specific query, or a copy and paste of relevant logs.  - **Notes** are your workspace to track questions, log insights, and gather thoughts. You can also edit notes from the timeline view, so that you can update or add new information while running interviews or a review meeting, for example.  - The **time** can be set manually to the second. It is in 24-hour time in your local timezone. For each event you can set a single time, or add an end time to indicate the duration of the effort depicted by this event marker. - You can also check the box **Use supporting event evidence to set time** to automatically set a marker's timeframe using the time of your events under **Supporting Evidence**. - In the timeline, event markers are represented as a single point in time. If you add an end time to an event, it will show as a continuous line for the duration of the event’s timeframe. If you leave the time blank, the event marker will fall at the end of the narrative timeline and will not be a visual point on the timeline display.  *Narrative marker details: Detection* You can edit any of the fields in an event marker from the builder at any time. If you realize the supporting evidence and notes you have added suggest a different type of event marker, you can select a different one from the **Marker Type** dropdown.  When starting a new investigation, the narrative timeline will show two event markers by default: **Opportunity Started** and **Opportunity Ended**. These markers' times are set automatically based on the timeframe of the imported Slack messages, but can be customized. These events cannot be deleted or changed to other event marker types. ## Search and Filter Post-Incident Review Data In the **Post-Incident Review Data** section you can search for keywords and phrases, and filter your data by **Participants**, **Reactions**, **Event Source**, and **Tags**. - **Participants** are the responders who engaged in the imported Slack channels during the incident. - This is a helpful filter when you are looking for messages or conversations between specific individuals. - **Reactions** are the emojis or reactjis used in response to Slack messages. - Filtering by reaction can be a useful shorthand for finding relevant moments in the story of the incident. Every company has its own culture of Slack reactions; you may have common ones used to indicate important information, interesting questions, or celebrating successes. - **Event Sources** are the channels imported from Slack, and PagerDuty, if your account has that integration configured. - This filter is good to add to a search or other parameters to narrow results to a specific channel or to look for a distinct PagerDuty notification. - **Tags** are metadata you can add in the Event Data view to associate additional context with a message. - The **Responder Joins** tag is automatically added for each new participant who joined the Slack channel. This is helpful for getting a feel for how and when people joined the incident. _All other tags are applied through the Event Data view in Jeli_. You can combine searching for a keyword or phrase with multiple of the filter types above to help narrow down your search results. 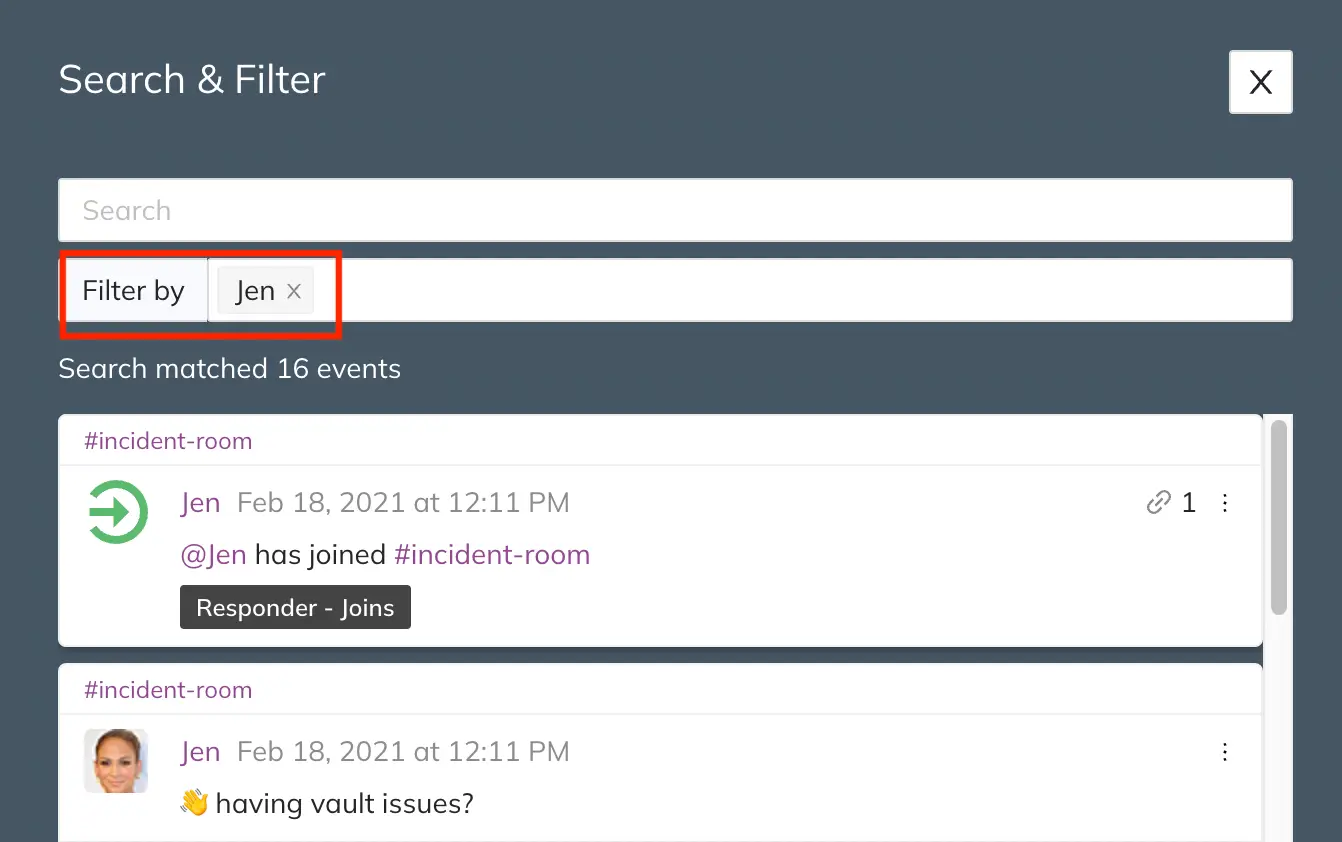 In addition to searching and filtering, if you imported multiple Slack channels, you toggle between messages from all channels (default) or individual channels. As you search and filter to uncover the incident story, you may wish to review a message in its original context. There are two options for this: **Jump to log** and **View in context**: - **Jump to log** takes you to the message in the original message log, removing all applied searches or filters. - **View in context** opens the original message log on the left-hand side of the screen, preserving your search and filtered results on the right hand side of the screen. ## View the Narrative Timeline To the view Narrative timeline, in the Jeli web app select your preferred Post-Incident Review and navigate to **Report** → **Narrative**. The Narrative timeline displays all of an incident's event markers, along with their summaries, in chronological order, including its start and end times. Any event markers created without a set time will be displayed at the bottom. You can open any of your event markers and see any attached supporting evidence, including the data source and timestamp. You can also see any attached notes, and edit them from the timeline view. 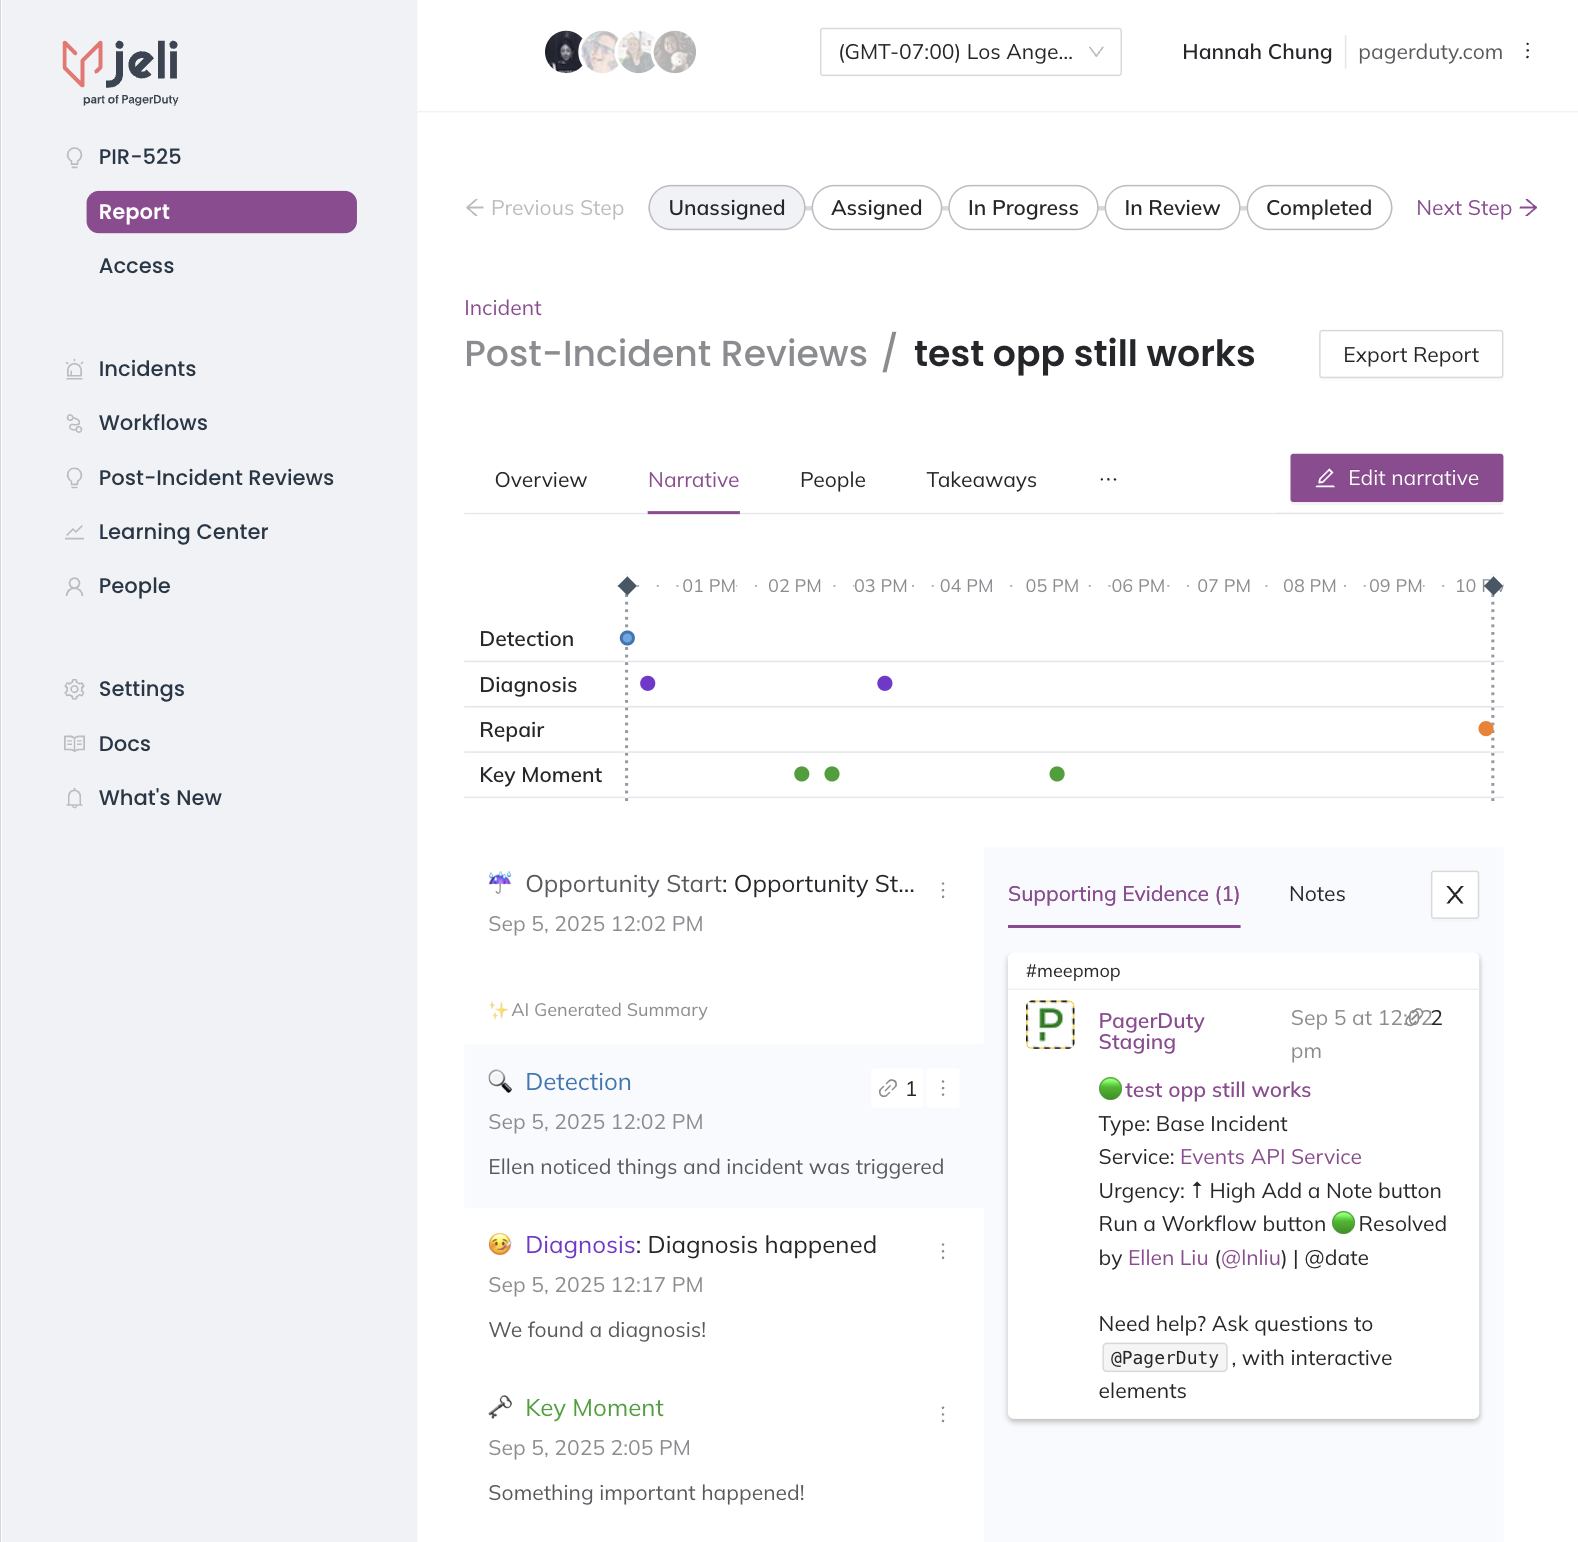 ### Timeline Zoom Click-and-drag over your desired timeframe to zoom in on a particular part of the timeline. This is helpful if you'd like take a closer look at a point in time that: - Was particularly interesting. - Presented a red herring. - A key moment occurred. - Is critical to understanding the Post-Incident ReviewPost-Incident Review. Click **Reset zoom** to go back to the default zoom level.  ## Present Using Narrative Builder The Narrative Builder makes it easy to run your post-incident meeting. By sharing your screen you can navigate the timeline view and talk through the markers that you've made, as well the supporting evidence. You can also see your notes that you've made as part of each marker and update them on the screen as you learn new information from attendees, or uncover new questions or insights. > **Edit Notes:** At this time, only one person can edit the notes section at a time. 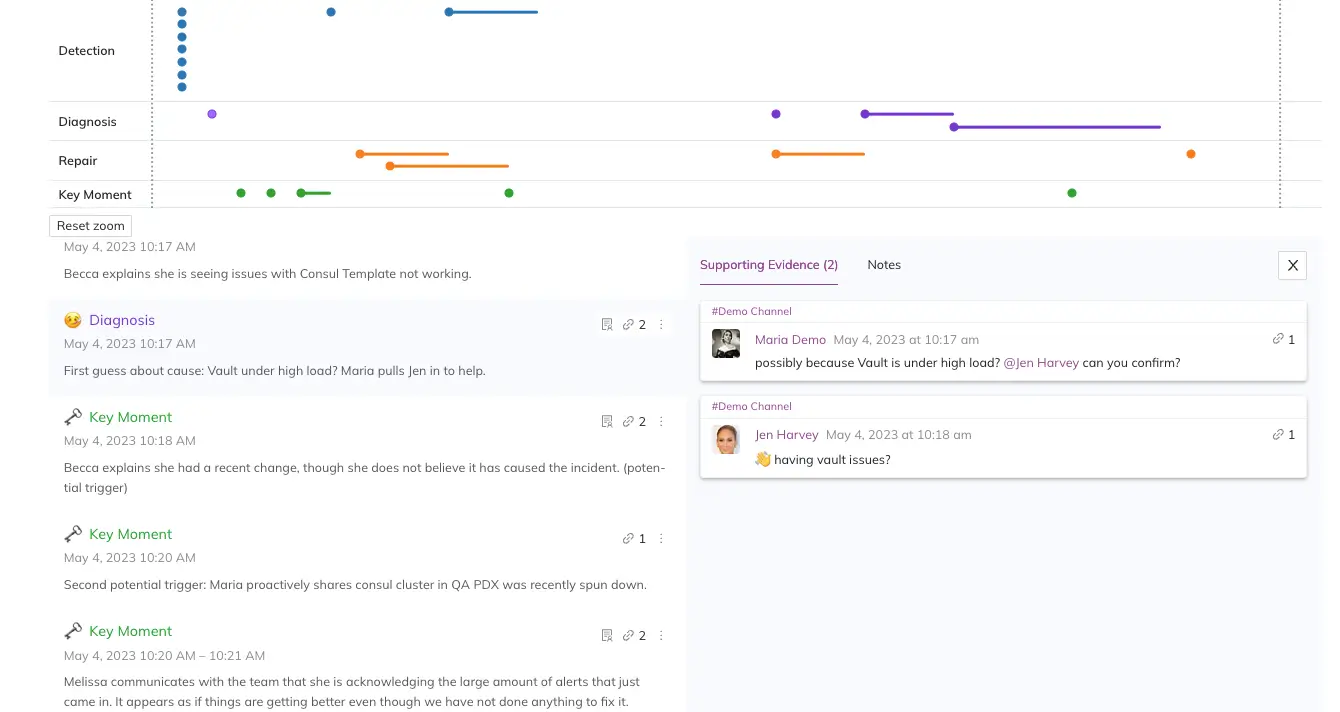 --- URL: https://docs.pagerduty.com/incident-management/after-incident/jeli-post-incident-reviews/post-incident-review-report/narrative-builder-tutorial # Narrative Builder Tutorial A 20-minute to 1-hour tutorial for turning a Slack incident transcript into a marker-based Narrative timeline ahead of a review meeting. ⏰ **Time required**: 20 mins to 1 hour In this tutorial, you will learn how to prepare for an incident review meeting using the Narrative Builder. You will review your Slack transcript to create a **Narrative** timeline of your incident and prepare questions to help direct an incident review. > **Import Data:** If you haven’t already, use Slack to import incident data into Jeli using the `/jeli import` command. You can also import data from additional Slack channels. Please read [Slack Integration | Jeli](/incident-management/after-incident/get-started-with-jeli-post-incident-reviews) for more information. ## Narrative Builder View Jeli’s Narrative Builder makes it easy to tell the story of how an incident happened, while taking into account multiple points of view. The Narrative Builder allows you to use primary data as evidence for the building blocks of your narrative. This allows for a blame-aware analysis of the incident that looks at what actually happened, rather than focusing on counterfactuals. > **Tip:** We recommend spending some time creating your Narrative before your incident review meeting. We have seen that spending some time prepping helps with making the (expensive) meeting a productive one. 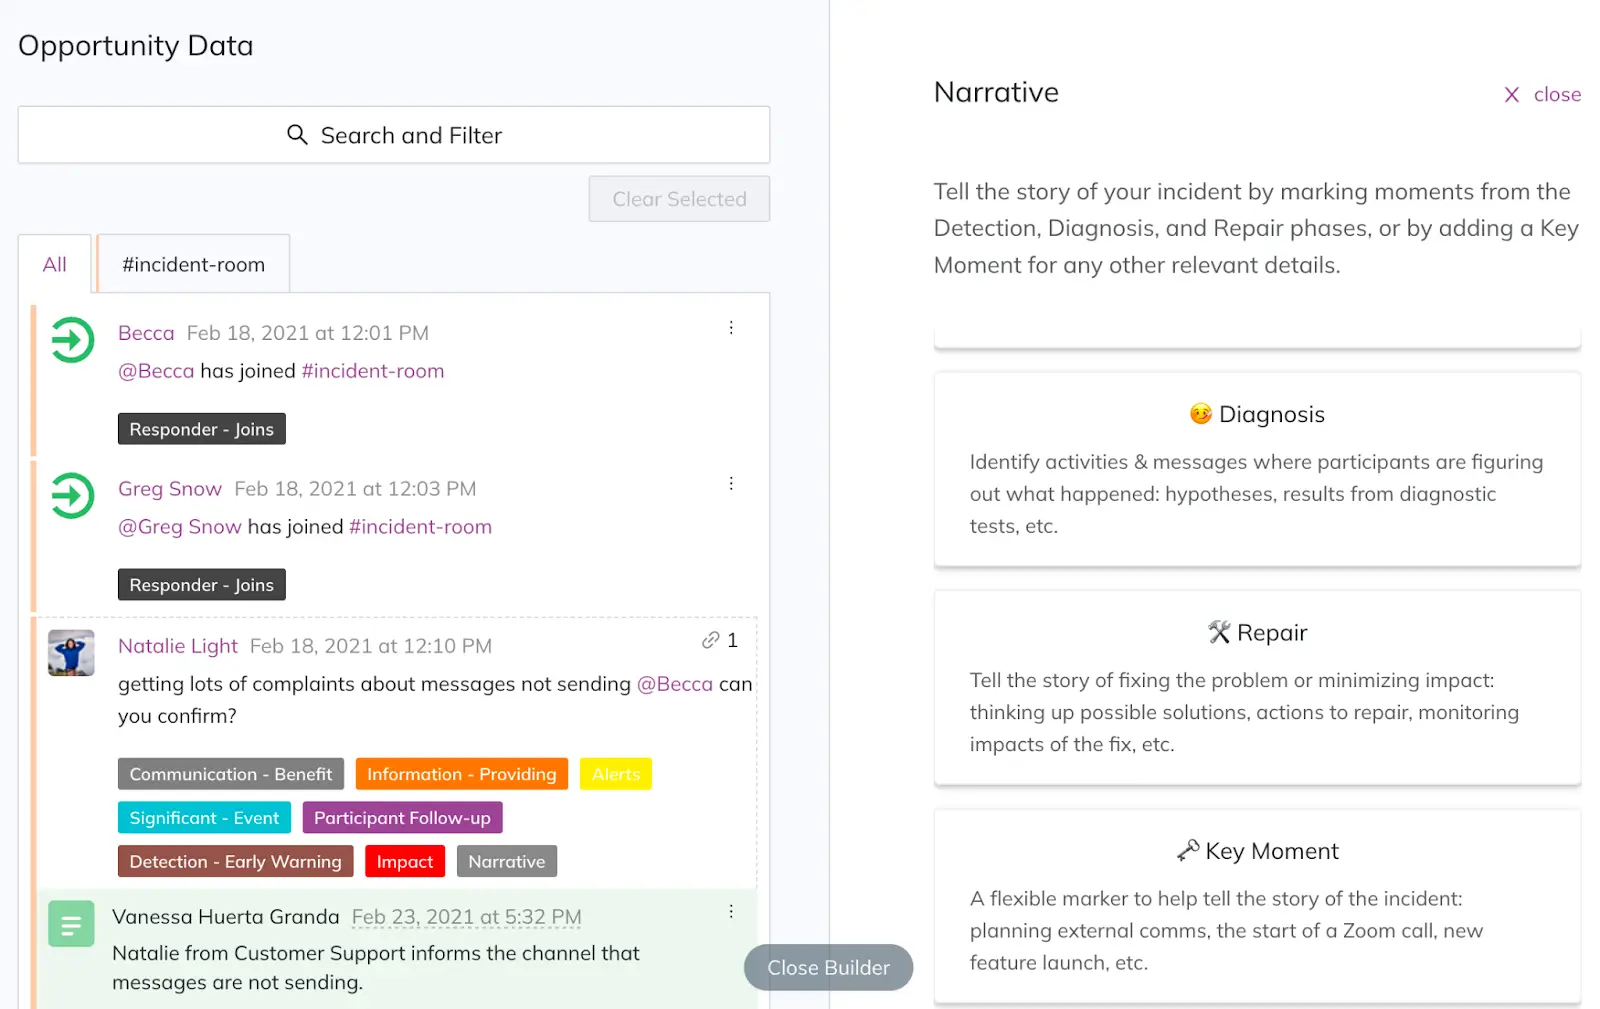 ## Choose Supporting Evidence ### Step 1: Evaluate Messages Review your transcript line-by-line and ask yourself if each message is important to tell the incident's story. You should also check to see if each message fits within one of the marker types: **Detection**, **Diagnosis**, **Repair**, and **Key Moment**. If so, choose the appropriate marker to categorize the message as **Supporting Evidence**. > **Recommended Questions:** Some example questions to ask depending on the marker type are: > > | Marker Type | Suggested Questions | > | :------------- | :--------------------------------------------------------------------------------------------------------------------------------------------------------------------------------------------------------------------------------------------------------------------------- | > | **Detection** | - How were we alerted? Where did we see this alerting and why was this brought to our attention? - Who knew at the beginning and how did they find out? - Who did they bring in and how did they know to do this? - What background information did they have on this topic? | > | **Diagnosis** | - What were responders looking at and why? - What did the problem mean? What was the impact? - What did people think was happening? - What did they try to do? What tools did they use for this? - How did they communicate this with each other? | > | **Repair** | - What were some possible solutions to the issue? - How did responders arrive at this solution? What constraints did they have? - How did they confirm if the solution worked or didn’t work? | > | **Key Moment** | - How did responders collaborate? - Was anything confusing? - Did the communication methods change? - Did they share information with outside parties? - Did people learn something new? | > > Please read [Event Markers](/incident-management/after-incident/jeli-post-incident-reviews/post-incident-review-report/narrative-builder#event-markers) for more information. ### Step 2: Organize Messages Under Narrative Markers You may include multiple pieces of evidence under the same marker if they all relate to the same point. > **Tip:** When choosing a narrative marker, read the messages around it. If multiple messages explain what is happening during that part of the story, they should be included as well. 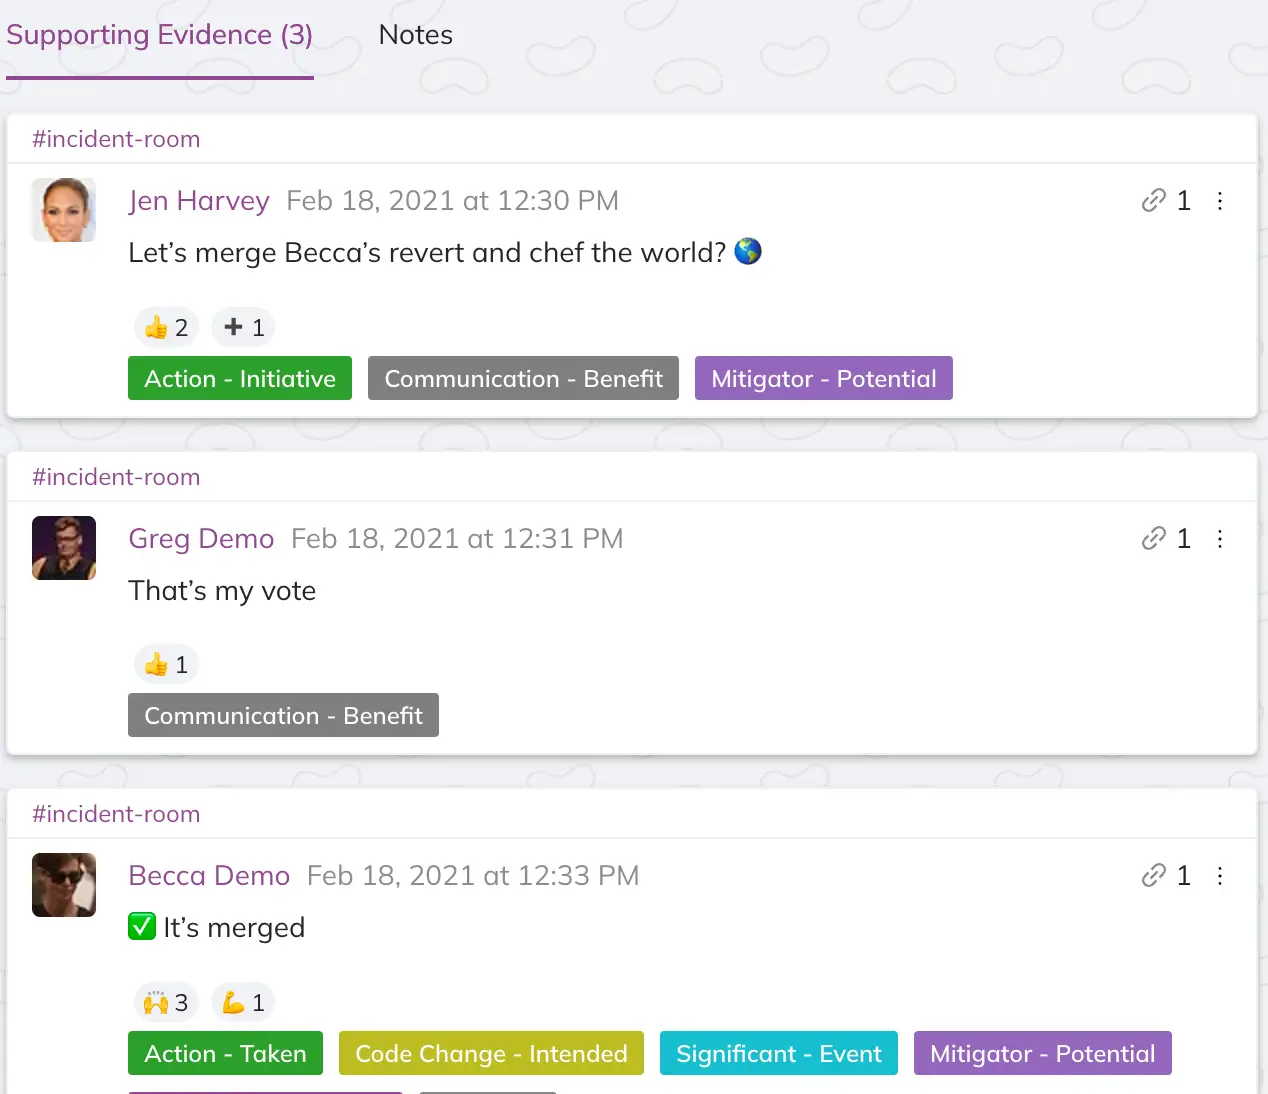 *Multiple messages under one narrative marker* ### Step 3: Add Supplemental Evidence You can also add evidence from outside of Slack messages by clicking **Add supplemental evidence** when entering a narrative marker's details. Here you can add images, links, or text to offer additional context to the incident's story. This might be screenshots of graphs, links to a specific query, or a copy-and-paste of relevant logs. 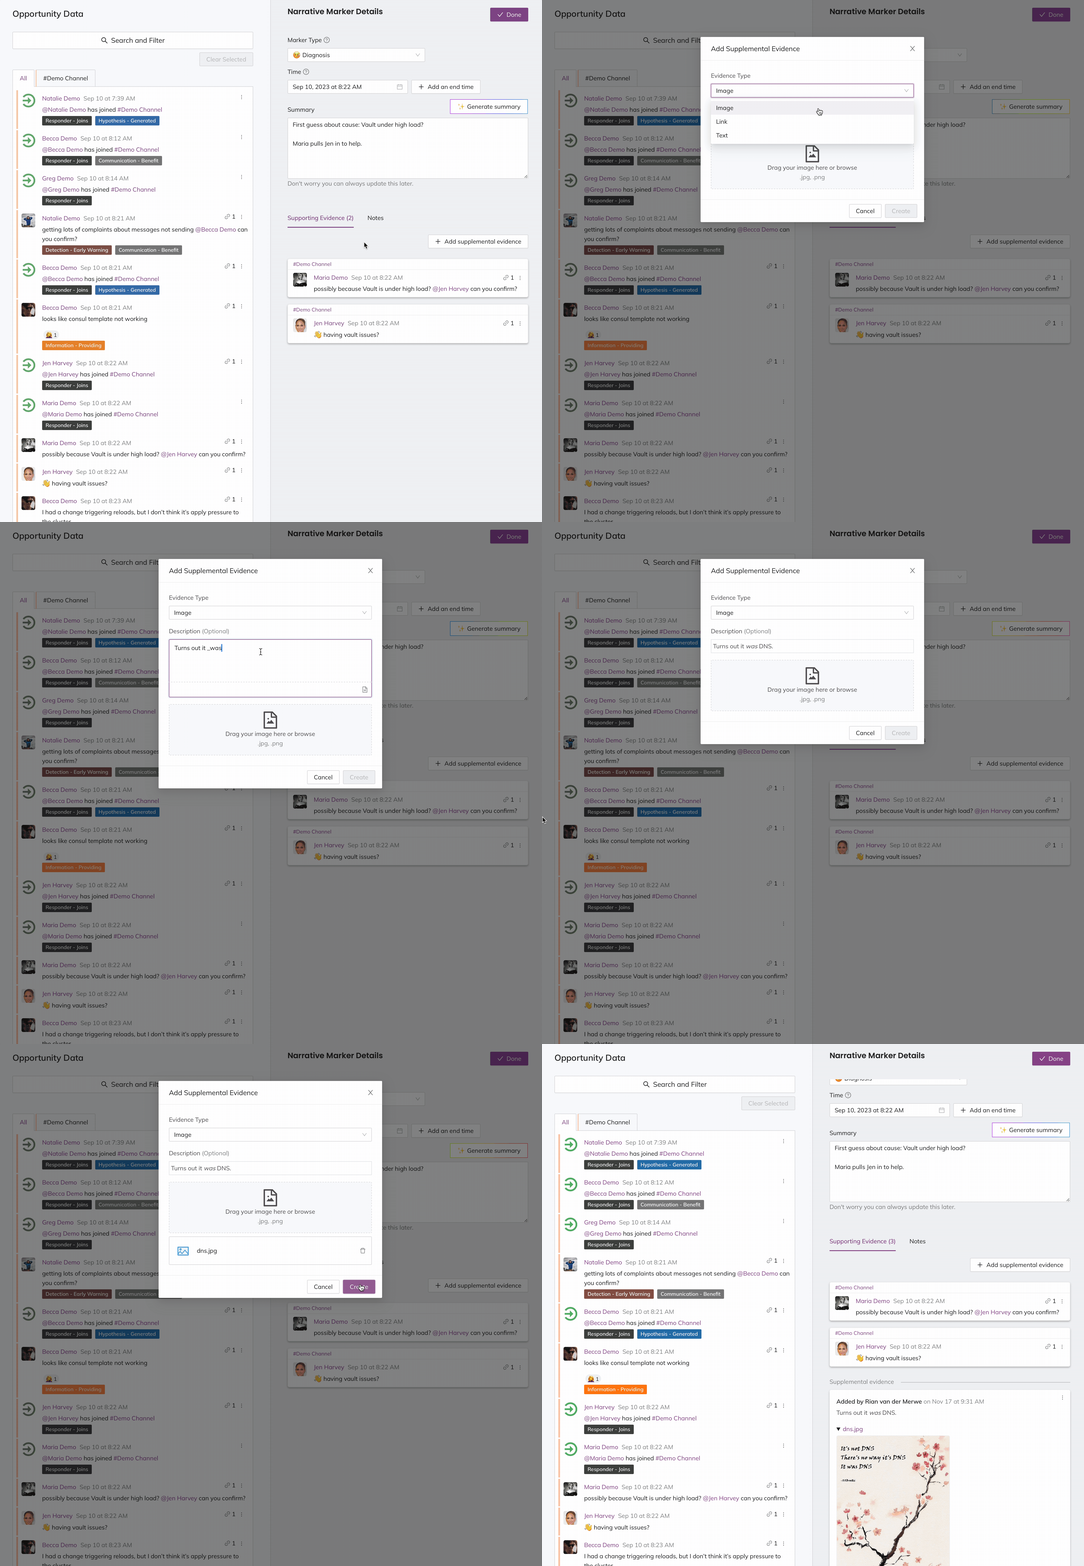 > **Tip:** As a general rule, we recommend using multiple pieces of evidence under a single marker if you can summarize what is happening within two sentences. Any more is a signal that you may want to break it out into separate markers. For example: _A conversation about a team deciding to revert a change may include multiple messages as supporting evidence under the same Repair Marker._ ## Update Marker Details ### Opportunity Start and End Time After you’ve [added supporting evidence](#choose-supporting-evidence) to the narrative, you may update the **Opportunity Start** and **End Times**. These are automatically generated based on the first channel ingested into the Post-Incident Review. To change this information, click , select a new date and time, and click **OK**. 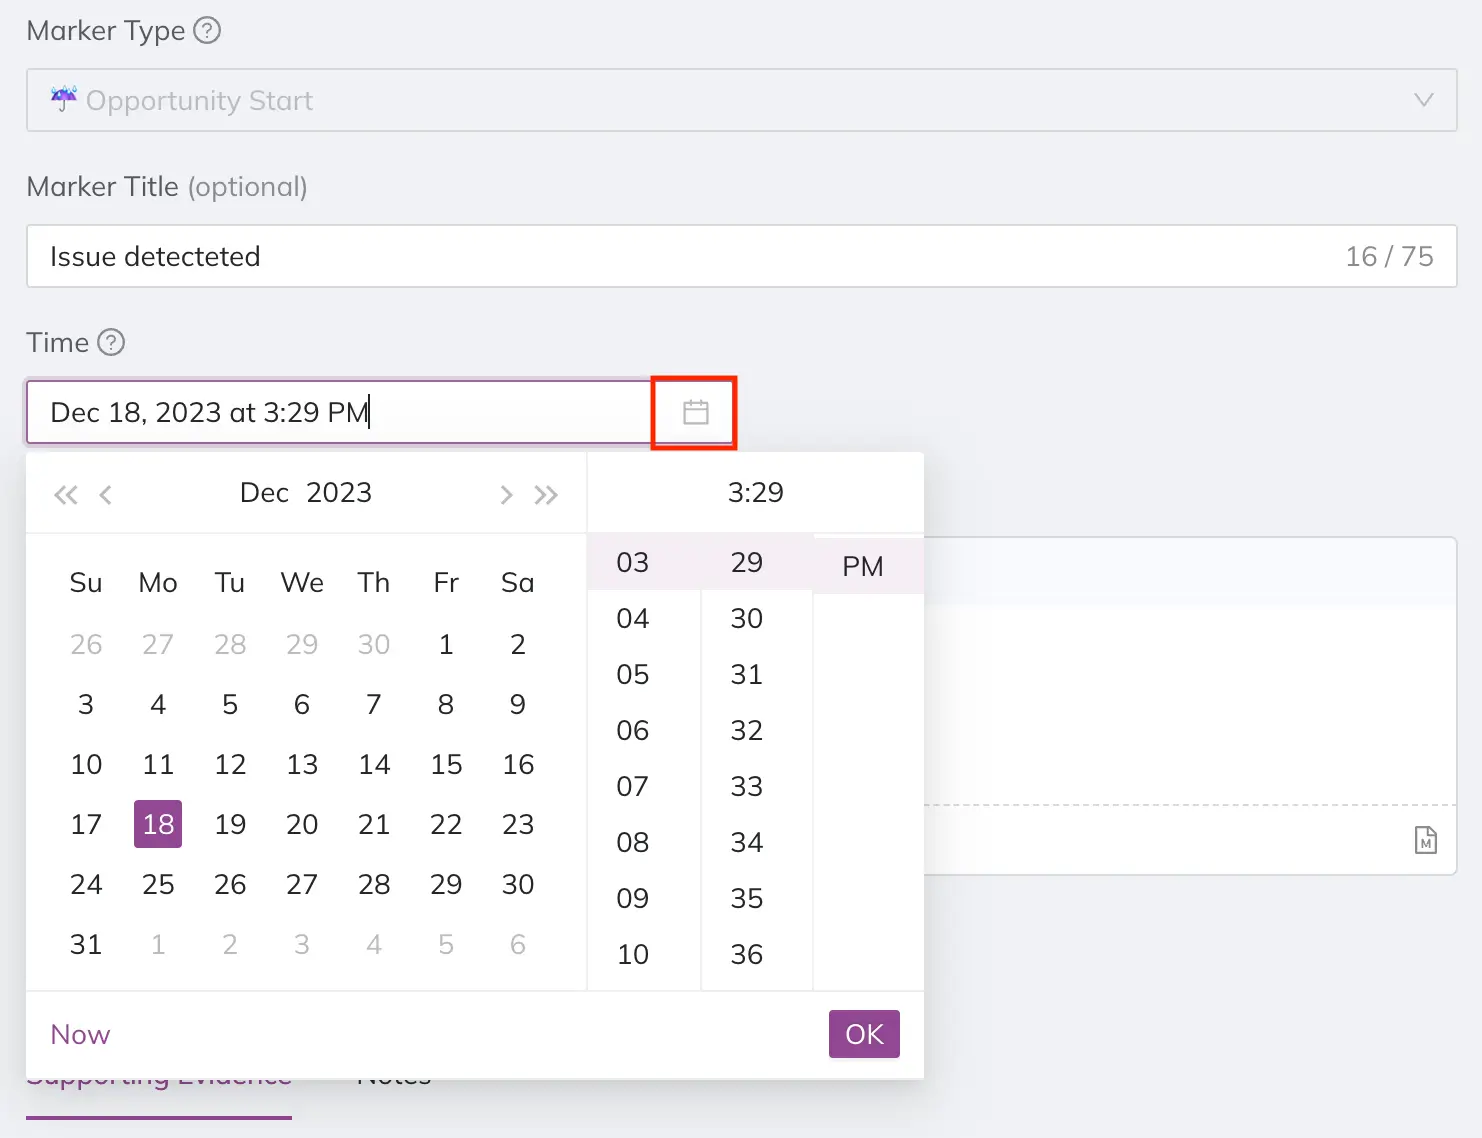 *Adjust a narrative marker's date and time* ### Write a Summary Update the **Summary** field with a few sentences describing what is happening in the supporting evidence. For example, _SREs and Software Engineers decide to move forward and revert the change made earlier in the day._ > **Tip:** We recommend using plain language, as if you are telling the story of what happened to a coworker or in an incident review meeting. 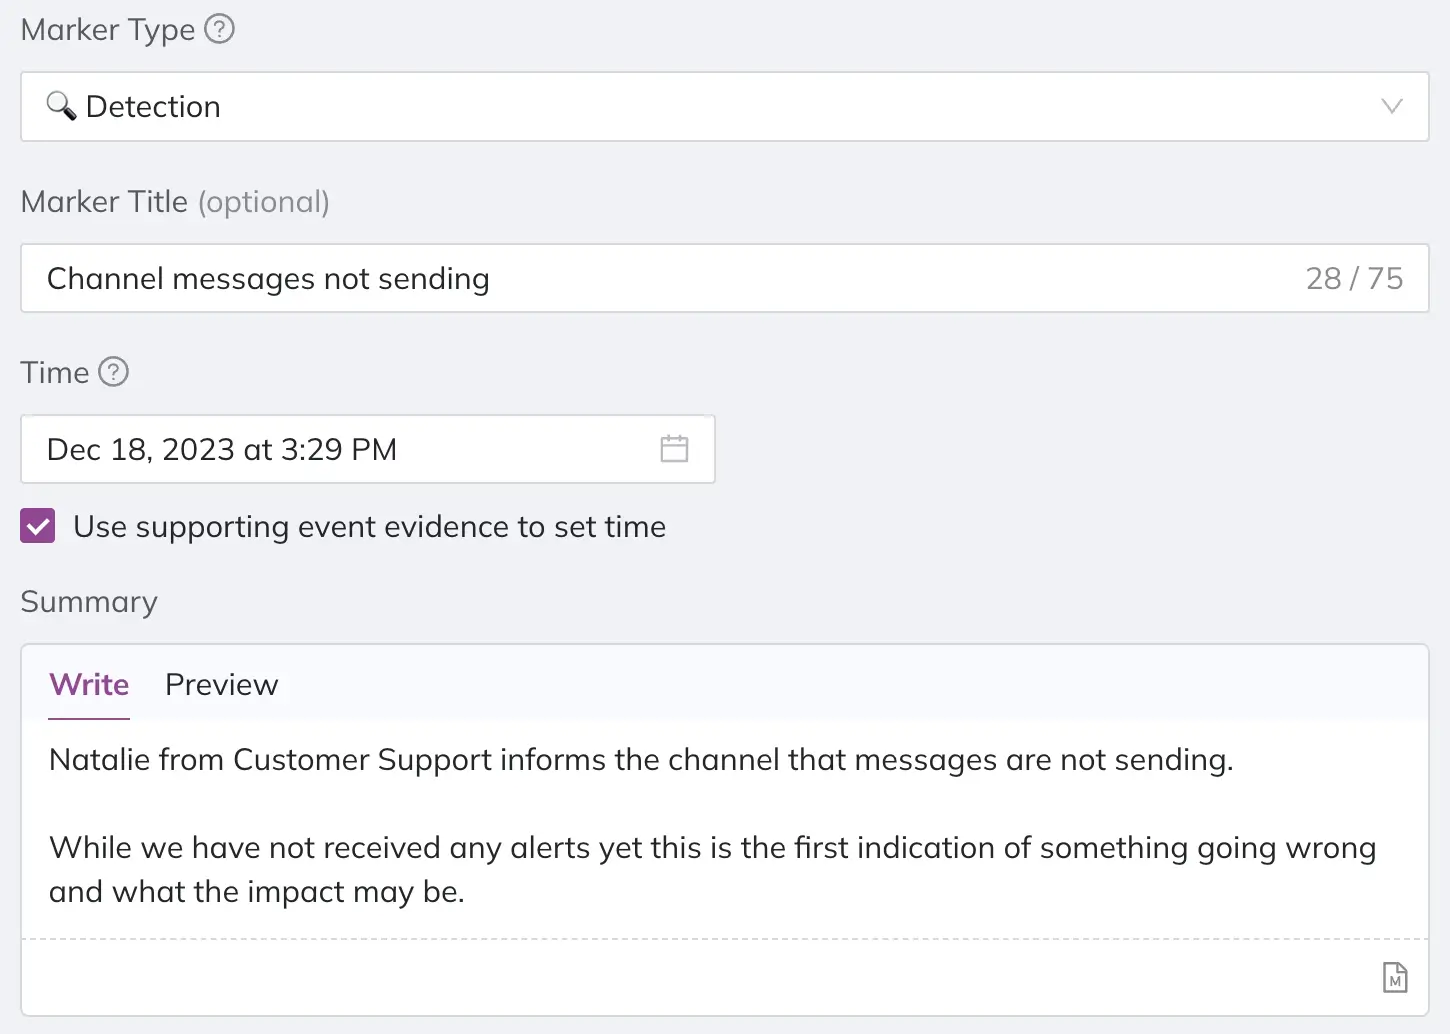 *Narrative marker details* ### Add Notes We recommend using the **Notes** section to ask any questions that arise based on the supporting evidence. Even if you think you know the answer, if something is unclear it is helpful to ask it during the review meeting so others can learn from it.  *Notes in a narrative marker* ### Edit or Delete a Narrative Marker While building your narrative, you may need to edit or delete a marker: - [Edit a Narrative Marker](#edit-a-narrative-marker) - [Delete a Narrative Marker](#delete-a-narrative-marker) #### Edit a Narrative Marker To edit an existing marker: 1. Navigate to your preferred Post-Incident Review, select the **Narrative** tab and click **Edit narrative**. 2. Hover over the menu next to a marker and select **Edit**. This will open the **Narrative Marker Details** modal. 3. Make your desired changes and click **Done**. 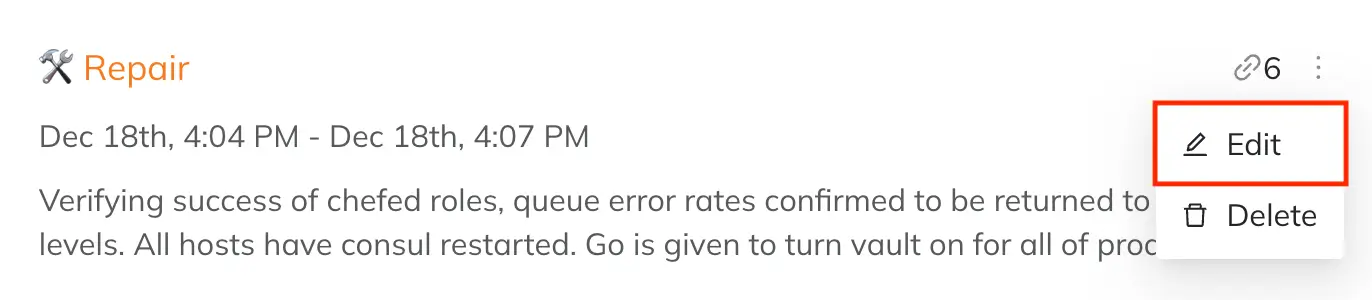 *Edit narrative marker* #### Delete a Narrative Marker 1. Navigate to your preferred Post-Incident Review, select the **Narrative** tab and click **Edit narrative**. 2. Hover over the menu next to a marker and select **Delete**. 3. In the confirmation modal, click **Delete marker**. 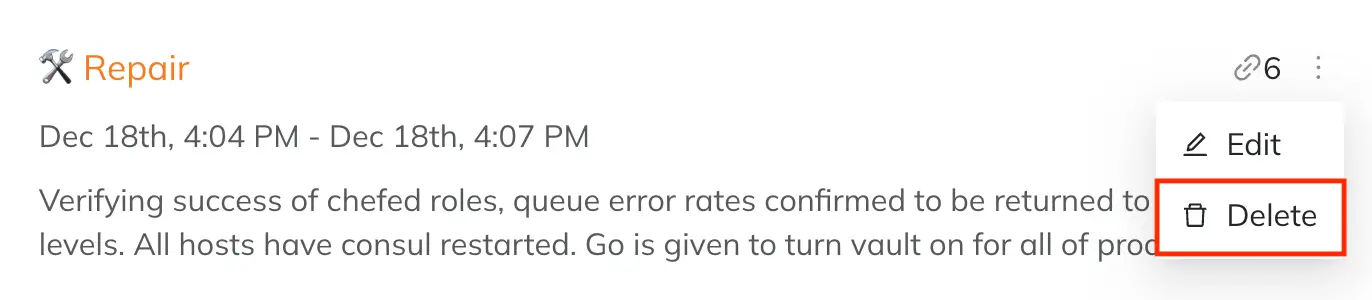 *Delete narrative marker* ### Add More Markers to Help Tell Your Story You can choose as many markers as you need to tell your story. You do not have to go in a linear detection-diagnosis-repair manner, either. Your focus may jump forward or backward as more information becomes available. For example, halfway through the repair phase you may discover that another component is impacted, and another team's expertise is needed to progress with the investigation. The following example highlights rich insights associated with each marker:  *Narrative view* ## Finish Your Narrative Once your Narrative is complete, you may use it in the next step of your incident analysis process. We recommend using it to set your incident review meeting's agenda. Please read [Basic Post-Incident Review Tutorial](/incident-management/after-incident/jeli-post-incident-reviews/basic-post-incident-review-tutorial) for more information.  *Narrative view* --- URL: https://docs.pagerduty.com/incident-management/after-incident/jeli-post-incident-reviews/post-incident-review-report/post-incident-review-tags # Post-Incident Review Tags Use tags to categorize Post-Incident Reviews and identify related incidents | Jeli Part of PagerDuty Post-Incident Review tags add contextual data to assist in identifying related Jeli Post-Incident Reviews. When viewing a [Post-Incident Review report](/incident-management/after-incident/jeli-post-incident-reviews/post-incident-review-report), the **Overview** tab will list the applied **Post-Incident Review Tags** and suggest [Related Post-Incident Reviews](/incident-management/after-incident/jeli-post-incident-reviews/post-incident-review-report/related-post-incident-reviews) based on the tags those incidents have in common. You can review these Post-Incident Reviews and find common themes in order to help you find process gaps, prioritize work and highlight organizational systems that work or need investment. For example: 1. **Not all incidents impacting your frontend service are the same, but looking across them you may notice that each Post-Incident Review involving frontend mentions**: a. Team members have difficulty understanding a specific alert. b. Your support team is struggling to find the right engineering team to page. c. An indication of technologies that could use more expertise-sharing (i.e., knowledge silos that might exist in your organization). 2. **You can compare incidents and see where they differ**: a. Process changes made in reaction to previous incidents made subsequent responses more difficult. b. Two incidents with the same impact to customers and underlying services had vastly different triggers, contributing factors and takeaways. You shouldn’t consider them as repeat incidents at all.  *View tags on the Post-Incident Review Report* > **Availability:** Post-Incident Review Tags are available with the Professional, Business, and Enterprise for Incident Management pricing plans. > > Please [contact our Sales Team](mailto:sales@pagerduty.com) if you would like to upgrade to a plan featuring Post-Incident Review Tags. ## Post-Incident Review Tag Types Post-Incident Review tag types are the broader categories to help organize your Post-Incident Review tags. Some examples include: - Service (default) - Technology (default) - Teams - Vendors - Severity - Impact Jeli starts with two Post-Incident Review tag types: - **Service**: Internal resources created within your company (e.g., things created and managed by your teams). They’re likely acronyms, named after the product they support, or have fun names. - **Examples**: `JSA`, `site-backend`, `Gandalf` - **Technology**: External resources shared between companies (e.g., code languages, data center or cloud provider regions and technology you’re using from vendors). - **Examples**: `python`, `us-east-1`, `consul` > **Tag Names:** Your organization may use **Service** and **Technology** to mean something else, or it may be inclined to interpret those words differently. You can define these two categories in whatever way will be the easiest for those within your organization to understand and adopt. ### Create a New Post-Incident Review Tag Type To create a new Post-Incident Review tag type: 1. Navigate to **Settings** → **Post-Incident Reviews** → **Tag Type**. 2. Click **Create tag type**. 3. Enter a **name** for the tag type. 4. Select **Auto-tag values?** if you want Jeli to [automatically add tag values](#auto-tagging) for this tag type. 5. Click **Create** to save your new tag type. ## Manage Post-Incident Review Tags > **Required User Permissions:** Anyone in your organization can create new tags, add or remove existing tags and delete tags. Post-Incident Review tags are the subcategories that apply at the Post-Incident Review level. An Post-Incident Review tag belongs to only one tag type. For example, within the **Technology** tag type you may have values similar to the following: - AWS - Slack - PagerDuty - Lodash ### Create a Tag > **Post-Incident Review Tag Parameters:** Post-Incident Review tags have the following restrictions: > > - Must be between 3–255 characters long > - Can contain only alphanumeric characters, periods `.`, dashes `-`, underscores `_`, slashes `/` and spaces ` ` > - Not case sensitive 1. Navigate to the **Post-Incident Review** where the new tag will apply. 2. In the **Post-Incident Review Tags** section, click (if the Post-Incident Review already has a tag) or **Add tag(s)** (if the Post-Incident Review does not have a tag). 3. Select the desired **tag type** for the new tag. 4. Click and enter the new tag’s name. If the tag does not exist, you’ll see **Create [tag name]** appear in the dropdown. 5. Click **Create [tag name]** to apply the new tag to the Post-Incident Review. If you’ve enabled [auto-tagging](#auto-tagging) for the tag type you selected, Jeli searches your existing Post-Incident Reviews for mentions of the new tag and applies it.  *Jeli can automatically apply new tags to existing Post-Incident Reviews* ### Add an Existing Tag to a Post-Incident Review 1. Navigate to the desired **Post-Incident Review**. 2. In the **Post-Incident Review Tags** section, click (if the Post-Incident Review already has a tag) or **Add tag(s)** (if the Post-Incident Review does not have a tag). 3. Select the desired **tag type**. 4. Select the **tag** from the dropdown list. You can also search by clicking . Adding a tag will update the **Related Post-Incident Reviews** list with other Post-Incident Reviews also using that tag. ### Remove a Tag from a Post-Incident Review 1. Navigate to the desired **Post-Incident Review**. 2. In the Post-Incident Review Tags section, click on the tag you want to remove. The **Related Post-Incident Reviews** list automatically updates. ### Delete a Tag 1. Navigate to an **Post-Incident Review**. 2. In the **Post-Incident Review Tags** section, click (if the Post-Incident Review has a tag) or **Add tag(s)** (if the Post-Incident Review does not have a tag). 3. Select the desired **tag type**. 4. Select the **tag** from the dropdown list. You can also search by clicking . - **Note**: ❗️If the tag you wish to delete applies to the Post-Incident Review you are viewing, it will not appear in the selectable tag list. You must [remove it](#remove-a-tag-from-a-post-incident-review) first and then delete it. 5. Hover over the **tag name** and click the icon. This will open a confirmation modal. 6. Enter the tag as prompted and click **Remove**. This automatically deletes the tag from all Post-Incident Reviews.  > **Updating Related Post-Incident Reviews:** When you add, remove, or delete a tag, the **Related Post-Incident Reviews** section will automatically update. You will briefly see a next to this section once this process has completed. ## Auto-Tagging Auto-tagging is an optional setting available for [tag types](#post-incident-review-tag-types). When you create a tag, Jeli automatically searches your Post-Incident Review's Slack messages and matches the tag to message contents. Jeli denotes auto-tags with sparkles (i.e., ✨). If you disable auto-tagging for an Post-Incident Review tag type, you can [manually](#add-an-existing-tag-to-a-post-incident-review) tag Post-Incident Reviews with that tag type. To enable or disable auto-tagging for a tag type: 1. Navigate to **Settings** → **Post-Incident Reviews** → **Tag Type**. 2. Locate your desired tag type and click the **Auto-tag values?** toggle to enable or disable auto-tag for that tag type. - When you disable auto-tagging, you’ll see a confirmation prompt informing you that all future Post-Incident Reviews ingested after disabling will cease auto-tagging with tags of the chosen tag type. > **Case Sensitivity and Special Characters:** The auto-tag search used to match tags with messages is not case sensitive. It returns approximate results when it comes to periods, dashes and underscores, but not for spaces between words. > > For example, a tag of **Node.js** will auto-tag an Post-Incident Review in the instance someone typed `Node-js` but not when they type `Node js`. A tag of **Elasticsearch** will not auto-tag an Post-Incident Review mentioning `Elastic search`, and vice versa. ## Recommendations We recommend defining your tags based on what is frequently used in your organization. After that, you should check a few incidents you’d expect to be automatically tagged with that service or technology. If the expected Post-Incident Review tag did not apply, check the phrasing of the service in the Slack messages across those incidents. We also recommend avoiding common words used frequently in response conversations (e.g., `time` or `update`). ## FAQ **Can I edit the name of an existing Post-Incident Review tag type or tag value?** No. Once a tag type or tag value has been created, the name cannot be changed. **Can I delete Post-Incident Review tag types?** No. At this time it is not possible to delete existing Post-Incident Review tag types. **If I enable auto-tagging on a tag type, will it auto-tag existing tags?** No. Auto-tagging only occurs when you create new tags. Existing tags will not apply to Post-Incident Reviews when you’ve enabled this setting. --- URL: https://docs.pagerduty.com/incident-management/after-incident/jeli-post-incident-reviews/post-incident-review-report/post-incident-review-templates # Post-Incident Review Templates Standardize your Post-Incident Reviews | Jeli Part of PagerDuty Post-Incident Review templates are helpful for organizations with specific requirements and unique needs for Post-Incident Review documentation. Templates give users a starting point for structuring an Post-Incident Review's [Summary](/incident-management/after-incident/jeli-post-incident-reviews/post-incident-review-report#summary) and [Key Takeaways](/incident-management/after-incident/jeli-post-incident-reviews#document-key-takeaways) sections. Creating templates can help you: - Keep all of your Post-Incident Review data in one place instead of across multiple docs. - Create consistency in reporting across multiple teams. - Streamline your processes and eliminate time spent writing boilerplate text. > **Availability:** Customers on the Enterprise for Incident Management pricing plan can create unlimited Post-Incident Review Templates. > > Customers on Professional and Business pricing plans can create up to five Post-Incident Review Templates. > > Please [contact our Sales Team](mailto:sales@pagerduty.com) if you would like to upgrade to a plan featuring Post-Incident Review Templates. > **Required User Permissions:** Jeli Admins can create, edit, and delete templates. Reach out to an Admin to make any changes to existing templates in your Jeli instance. ## Create a New Template 1. Navigate to your desired **Post-Incident Review**. 2. In the **Summary** or **Takeaways** section, click and then click **Choose a template** below the text field. 3. Select **Create template**. 4. Perform the following: | Field | Description | | --- | --- | | Name | Enter the name of your template (e.g., AwesomeCo Incident Report Template). | | Template | Enter the content of your template. Jeli supports GitHub flavored Markdown. | | Type | From the dropdown, select whether this template can apply to the Summary, Takeaways, or both. | | Set as default for Summary | Toggle on to populate the Summary field with this template for new Post-Incident Reviews by default. | | Set as default for Takeaways | Toggle on to populate the Takeaways field with this template for new Post-Incident Reviews by default. | Click **OK** to save the new template.  ## Use an Existing Template 1. Navigate to your desired **Post-Incident Review**. 2. In the **Summary** or **Takeaways** section, click and then click **Choose a template** below the text field. 3. Select your desired **template**. You will see a modal appear, informing you that applying a template will **overwrite** the current field content. 4. Click **Ok** to confirm you wish to overwrite the existing content with the template. Your template will populate the appropriate field. ## Edit a Template 1. Navigate to your desired **Post-Incident Review**. 2. In the **Summary** or **Takeaways** section, click and then click **Choose a template** below the text field. 3. Hover over next to the template you would like to edit, then select **Edit**. 4. Make your desired changes to the template. 5. Click **OK** to save. ## Delete a Template 1. Navigate to your desired **Post-Incident Review**. 2. In the **Summary** or **Takeaways** field, click and then click **Choose a template** below the text field. 3. Hover over next to the template you would like to delete, then select **Delete**. 4. In the modal, click **Remove** to confirm. --- URL: https://docs.pagerduty.com/incident-management/after-incident/jeli-post-incident-reviews/post-incident-review-report/related-post-incident-reviews # Related Post-Incident Reviews Jeli surfaces related Post-Incident Reviews sharing services, technologies, or tags, and lets you manually add or remove suggested connections. Jeli's Related Post-Incident Reviews feature surfaces interconnected Post-Incident Reviews as your system changes over time. That may include a specific service's impact as a contributing factor to incidents, technologies that share common participants, or an indication of your team’s ability to respond during off hours alerts. > **Availability:** Jeli is available to customers with a standalone Jeli plan, or the Enterprise plan for Incident Management. > > Please contact our [Sales Team](https://www.pagerduty.com/contact-us/#contact-sales) to upgrade to an account plan with Jeli. ## View Related Post-Incident Reviews You can view related Post-Incident Reviews in the Jeli web app by navigating to the **Overview** tab and scrolling to the **Related Post-Incident Reviews** section.  *Post-Incident Review overview* - The list of related Post-Incident Reviews will update as users add or remove Technologies or Services [Post-Incident Review Tags](/incident-management/after-incident/jeli-post-incident-reviews/post-incident-review-report/post-incident-review-tags) on other Post-Incident Reviews across the platform. - A sparkle icon (i.e., ✨) denotes an Post-Incident Review that Jeli automatically added. Auto-suggested Post-Incident Reviews may change over time if relationships become more evident. Post-Incident Reviews without a sparkle icon were manually added. ## Add Related Post-Incident Reviews Jeli will display up to three related Post-Incident Reviews. You can manually add more, if needed. To add Post-Incident Reviews to the Related Post-Incident Reviews list: 1. In the Jeli web app, select **Post-Incident Reviews** from the left navigation and click your preferred Post-Incident Review from the list. 2. With the **Overview** tab selected, scroll to the section **Related Post-Incident Reviews** and click **Add**. 3. Enter a keyword to search within the list of Post-Incident Reviews.  4. Click **Add** to the right of the Post-Incident Review you'd like to associate with the current Post-Incident Review. ## Remove Related Post-Incident Reviews To remove Post-Incident Reviews from the Related Post-Incident Reviews list: 1. In the Jeli web app, select **Post-Incident Reviews** from the left navigation and click your preferred Post-Incident Review from the list. 2. With the **Overview** tab selected, scroll to the section **Related Post-Incident Reviews** and click **remove** next to the Post-Incident Review you’d like to remove. 3. When prompted, click **Remove** again to confirm.  *Remove related Post-Incident Review* By removing the Post-Incident Review, it will no longer appear on either Post-Incident Review's details page, and Jeli will not suggest it as a related Post-Incident Review in the future. If you wish to relate the Post-Incident Reviews again, you can [manually add](#add-related-post-incident-reviews) the removed Post-Incident Review. ## Learning Algorithm Behavior When you add and remove [Post-Incident Review Tags](/incident-management/after-incident/jeli-post-incident-reviews/post-incident-review-report/post-incident-review-tags), Jeli recalculates the relationship between Post-Incident Reviews. With that in mind, you may notice that related Post-Incident Reviews change after applying Post-Incident Review tags. Since Jeli is designed as a learning system, the more information you add, the more insights it can surface. --- URL: https://docs.pagerduty.com/incident-management/after-incident/jeli-post-incident-reviews/post-incident-review-report/see-participant-information # View Review Participant Data The Post-Incident Review People tab shows each participant's role, time zone, on-call status, and how much they contributed to the response. View review participant data by navigating to the **Post-Incident Reviews** → **People** tab. This tab provides insights into participants’ involvement and roles.  *Post-Incident Review Participants* > **Availability:** Jeli is available to customers with a standalone Jeli plan, or the Enterprise plan for Incident Management. > > Please contact our [Sales Team](https://www.pagerduty.com/contact-us/#contact-sales) to upgrade to an account plan with Jeli. ## People Tab The **People** tab is available in the **Report** section of a Post-Incident Review. This tab shows how many people were involved in the Post-Incident Review, with a breakdown of how many people were on call, not on call, and those that were observers. You will also be able to view a map that shows which time zones participants were in during the response. > **Tip:** You can toggle on/off whether observers are shown in the **People** tab by using the toggle **Show Observers** in the upper right (shown below). We define observers as participants with no word or reaction count.  *Participant time zones* Within the **People** tab, you can also view what role each participant had in the response, along with how often they participated. Participation is defined as the percentage of words and reactions sent across all channels.  ## People Information Card When you hover over an incident participant's name, an information modal pops up. This card contains an overview of the responder's involvement in the investigation. Their people data will be visible anywhere in [Narrative Builder](/incident-management/after-incident/jeli-post-incident-reviews/post-incident-review-report/narrative-builder) when you hover over a participant's name in a Slack message.  From the information card, you can see an incident responder’s: - Name - Title - Tenure and start date - Location and time zone - On-call status during the incident and a link to their on-call schedule(s) - **Note**: Requires the [PagerDuty Integration | Jeli](/incident-management/after-incident/jeli-settings-and-integrations/pagerduty-integration-jeli) - Their first message in the incident This data is a helpful starting point as you begin to learn about an incident and who was involved. Understanding who the key responders are will help inform the questions you ask as you tag and annotate the incident. --- URL: https://docs.pagerduty.com/incident-management/after-incident/jeli-post-incident-reviews/post-incident-review-stages # Post-Incident Review Stages Track your Post-Incident Reviews' progress | Jeli Part of PagerDuty Post-Incident Review Stages provide quick visibility into an investigation’s current status. You can use Post-Incident Review Stages to easily track the progression of your incident review process. There are five Post-Incident Review Stages: 1. **Unassigned**: You have created a Jeli Post-Incident Review, but you have not assigned an investigator. This can indicate that no one is working on the incident review. 2. **Assigned**: You have assigned an investigator to an Post-Incident Review, showing who is accountable for its completion. Jeli automatically applies this stage once an investigator is assigned. 3. **In Progress**: The investigator has started working on the Post-Incident Review. This stage will be automatically recognized if the investigator has added a marker in the [Narrative Builder](/incident-management/after-incident/jeli-post-incident-reviews/post-incident-review-report/narrative-builder). 4. **In Review**: The investigator is seeking feedback on the Post-Incident Review from peers that participated in the incident. 5. **Completed**: Incident responders have reviewed the Post-Incident Review and are no longer working on it. > **Availability:** Post-Incident Review Stages are available with the Professional, Business, and Enterprise for Incident Management pricing plans. > > Please [contact our Sales Team](mailto:sales@pagerduty.com) if you would like to upgrade to a plan featuring Post-Incident Review Stages. > **Legacy Customers:** If you created Post-Incident Reviews before this feature existed, Jeli automatically applied either the **Assigned** or **Unassigned** stage to those Post-Incident Reviews.  *List of Post-Incident Reviews* ## Post-Incident Review Stages Timeline The Post-Incident Review Stages timeline provides an at-a-glance view of each Jeli Post-Incident Review's status. The timeline is displayed at the top of each Post-Incident Review page, highlighting the currently active stage. This can be particularly helpful for executives who want to quickly assess a Post-Incident Review's progress.  ## Manually Move Post-Incident Review Stages When viewing a Post-Incident Review, you can manually update the Post-Incident Review stage from the timeline. You can click **Previous Step**, **Next Step** or the name of the stage you want to move to. ## Filter by Post-Incident Review Stage You can use the filter on the **Post-Incident Reviews** page to select Post-Incident Reviews in a specific stage. This can help you see which Post-Incident Reviews may need additional attention or resources. 1. Navigate to **Post-Incident Reviews** and click **Add Filter**. 2. Select a **Dimension** to filter by: - Stage - Tags - Start date - Key role - Participants - Duration - Event or note content 3. Depending on the dimension you select, enter any additional required criteria. 4. Click **OK**. After you have created a filter, _optionally_ click to add more filters. Click **Clear all filters** to reset your view.  ## FAQ **Can I customize Post-Incident Review Stages?** No, Post-Incident Review Stages are not customizable. **Are there any restrictions when moving from one stage to another?** There are no restrictions when manually moving between stages and you may move to any stage at any time. --- URL: https://docs.pagerduty.com/incident-management/after-incident/jeli-settings-and-integrations # Jeli Settings and Integrations An overview of Jeli's admin settings, covering integrations, incident roles and severities, user access, API tokens, webhooks, and import logs. Jeli administrators can manage Jeli settings, integrations, and user permissions within the platform, ensuring your team has the necessary tools and access to manage incidents effectively and maintain a streamlined, secure operational environment. > **Availability:** Jeli is available to customers with a standalone Jeli plan, or the Enterprise plan for Incident Management. > > Please contact our [Sales Team](https://www.pagerduty.com/contact-us/#contact-sales) to upgrade to an account plan with Jeli. > **Required User Permissions:** **Admin** permissions are required to manage Jeli settings. To add someone as an admin, visit [User Access Management Settings](https://app.jeli.io/settings/users) in the Jeli App. ## View Jeli Settings To access Jeli settings, click **Settings** in the left navigation.  The following a settings are available: - [Integrations](#integrations) - [Incident Response](#incident-response) - [Post-Incident Reviews](#post-incident-reviews) - [User Management](#user-management) - [API Tokens](#api-tokens) - [Webhooks](#webhooks) - [Import Log](#import-log) ## Integrations The Integrations menu is where you can manage and connect integrations. For more information, please visit our integration articles: - [Slack Integration | Jeli](/incident-management/after-incident/get-started-with-jeli-post-incident-reviews) - [PagerDuty Integration | Jeli](/incident-management/after-incident/jeli-settings-and-integrations/pagerduty-integration-jeli) - [Opsgenie Integration | Jeli](/incident-management/after-incident/get-started-with-jeli-post-incident-reviews) - [Zoom Integration | Jeli](/incident-management/after-incident/jeli-settings-and-integrations/zoom-integration-jeli) - [Jira Integration | Jeli](/incident-management/after-incident/jeli-settings-and-integrations/jira-integration-jeli) - [Import HR Data](/incident-management/after-incident/jeli-settings-and-integrations/import-hr-data) - [Google Meet Integration | Jeli](/incident-management/after-incident/get-started-with-jeli-post-incident-reviews) - [Statuspage Integration | Jeli](/incident-management/after-incident/get-started-with-jeli-post-incident-reviews) - [Okta Integration | Jeli](/incident-management/after-incident/get-started-with-jeli-post-incident-reviews) - [Vanta Integration | Jeli](/incident-management/after-incident/get-started-with-jeli-post-incident-reviews) - [ServiceNow Integration | Jeli](/incident-management/after-incident/get-started-with-jeli-post-incident-reviews) - [Nobl9 Integration | Jeli](/incident-management/after-incident/get-started-with-jeli-post-incident-reviews) ## Incident Response The Incident Response menu allows you to configure settings related to your [Jeli Slackbot](/incident-management/after-incident/get-started-with-jeli-post-incident-reviews). Here you can configure: - [Incident Roles](#incident-roles) - [Broadcast Channels](#broadcast-channels) - [Severity](#severity) - [Status Reminders](#status-reminders) - [Types](#types) - [Primary Jira](#primary-jira) ### Incident Roles Select the **Incident Roles** tab to define which roles can be assigned in the the Jeli Slackbot. These roles can be assigned when an incident is started using `/jeli open` or updated during an active incident using `/jeli set-
--- URL: https://docs.pagerduty.com/incident-management/after-incident/view-people-in-jeli # View People in Jeli Explore the user list and individual profiles on the People page in Jeli | Jeli Part of PagerDuty The **People** page in the left menu provides a list of users in your Jeli account, along with access to their user profiles. > **Availability:** Accounts on Professional, Business and Enterprise for Incident Management plans can access the **People** page > > Please contact our [Sales Team](https://www.pagerduty.com/contact-us/#contact-sales) to upgrade to an account plan with this feature. > **View-Only Users List:** The **People** page provides a view-only users list. If you would like to add or manage users within your Jeli account, please see our article on [User Management](/incident-management/after-incident/jeli-settings-and-integrations#user-management). Users will only appear once they login with the PagerDuty account. ## People List The People list allows you to search for and filter all users in your account. - Use the **search bar** to search for users by their **names**. - Click the **Name** column to reorder the user list from A-Z or Z-A. - In the top right, you can use the toggle to **Show Deactivated Users**. - At the bottom of the page, you can select different **pages** of the user list, and use the **`#` / Page** dropdown to select how many results display per page. ## People Profile To view an individual user's profile, click their **Name**. You will see the following modules: - The user's **Name** and **Position** within your organization, along with their **Tenure**. - Their **Location** and **Time Zone**. - Their **Percentage of review participation**. - The **Days of the week** where they were involved in the most reviews. - Percentage of incidents that occurred during their **Workdays vs. off hours**. - Percentage of when they participated in incidents when they were **On vs. off-call**. - **Participated in reviews involving** specific tags. - A list of **Reviews participated in**, along with the time they **Occurred**, their role and other **Investigators**. - A list of **Reviews investigated**, along with the time they **Occurred**. All of this information can be filtered for a different **timeframe** by selecting from the **dropdown** at the upper right with the options: - Today - Since Yesterday - Last 7 days - Last 30 days - Last year - All time 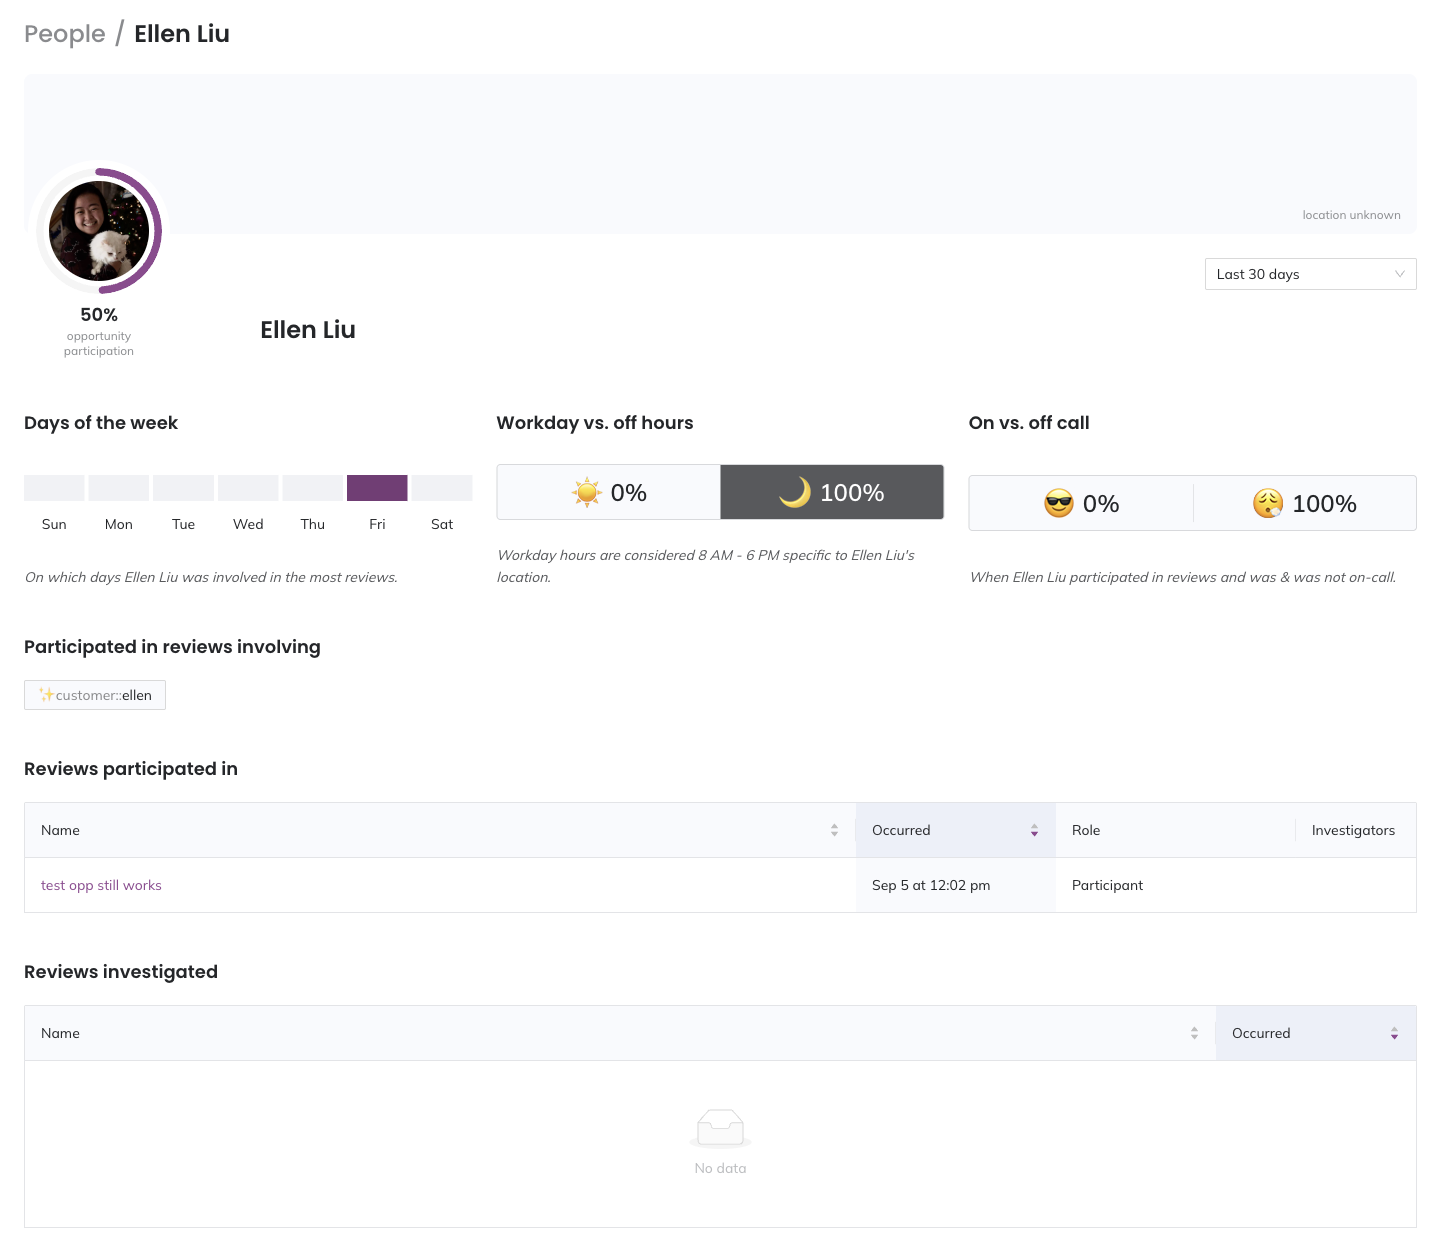 *User profile* --- URL: https://docs.pagerduty.com/incident-management/analytics # Analytics Dashboard Explore dashboards, Insights reports, and service recommendations that surface incident response trends across your account. The Analytics Dashboard provides an account-wide overview of historical data, helping you identify areas for improvement and achieve your digital operations goals. > **Availability:** The Analytics Dashboard is available on PD Reliability Platform plans. It's also available on the following pricing plans: > > - Professional > - Business > - Enterprise for Incident Management > - Digital Operations (legacy) > > [Contact the Sales team](https://www.pagerduty.com/contact-us/#contact-sales) to upgrade to a plan with this feature. ## View the Analytics Dashboard You can find the Analytics Dashboard in the web app's menu under **Analytics** → **Dashboard**. The Analytics Dashboard consists of the following sections: - [Over Time](#over-time) - [Services](#services) - [Escalation Policies](#escalation-policies) - [Teams](#teams) - [Responders](#responders) > **Data Update Schedule:** Data in the Analytics Dashboard updates once per day, and it may take up to 24 hours for new data to appear. A timestamp in the page's upper-right indicates the last update. ## Filters and Search The following filters are available to help you find the most relevant results: - **Team**: Click the **Team** dropdown and select the tab for **My Teams** or **All Teams**. Select the checkbox next your preferred Team(s) from the list and _optionally_ enter a search term to narrow results. Click **Apply** to update the data in the Analytics Dashboard. - **Escalation Policy**: Click the **Escalation Policy** dropdown and search or select one or more escalation policies. Click **Apply** to update the data in the Analytics Dashboard. - **Note**: If you have filtered by specific [Teams](/account-admin/teams), this filter automatically populates the escalation policies associated with the selected Team(s). - **Service**: Click the **Service** dropdown and search or select one or more services. Click **Apply** to update the data in the Analytics Dashboard. - **Note**: If you have filtered by specific services, this filter automatically populates services associated with the selected Team(s). - **Urgency**: Select from **All**, **High**, or **Low** to display incidents with the chosen urgency. - **Priority**: Select from **All** or any of your account's preconfigured [Incident Priority](/incident-management/incidents/incident-priority) level(s). - **Date Range**: Select from **Last 7 Days**, **Last 30 Days**, **Last Month**, **This Month**, or **Custom Range** (if you select **Custom Range**, use the calendar to choose your preferred start and end dates and click **Apply**). - **Note**: For custom ranges, you can select a start date up to three years in the past. A maximum duration of one year is allowed. ## Over Time The Over Time section offers a visualization of key incident metrics: Total Incidents, MTTA, MTTR, Interruptions, and Acknowledgement Rate %. 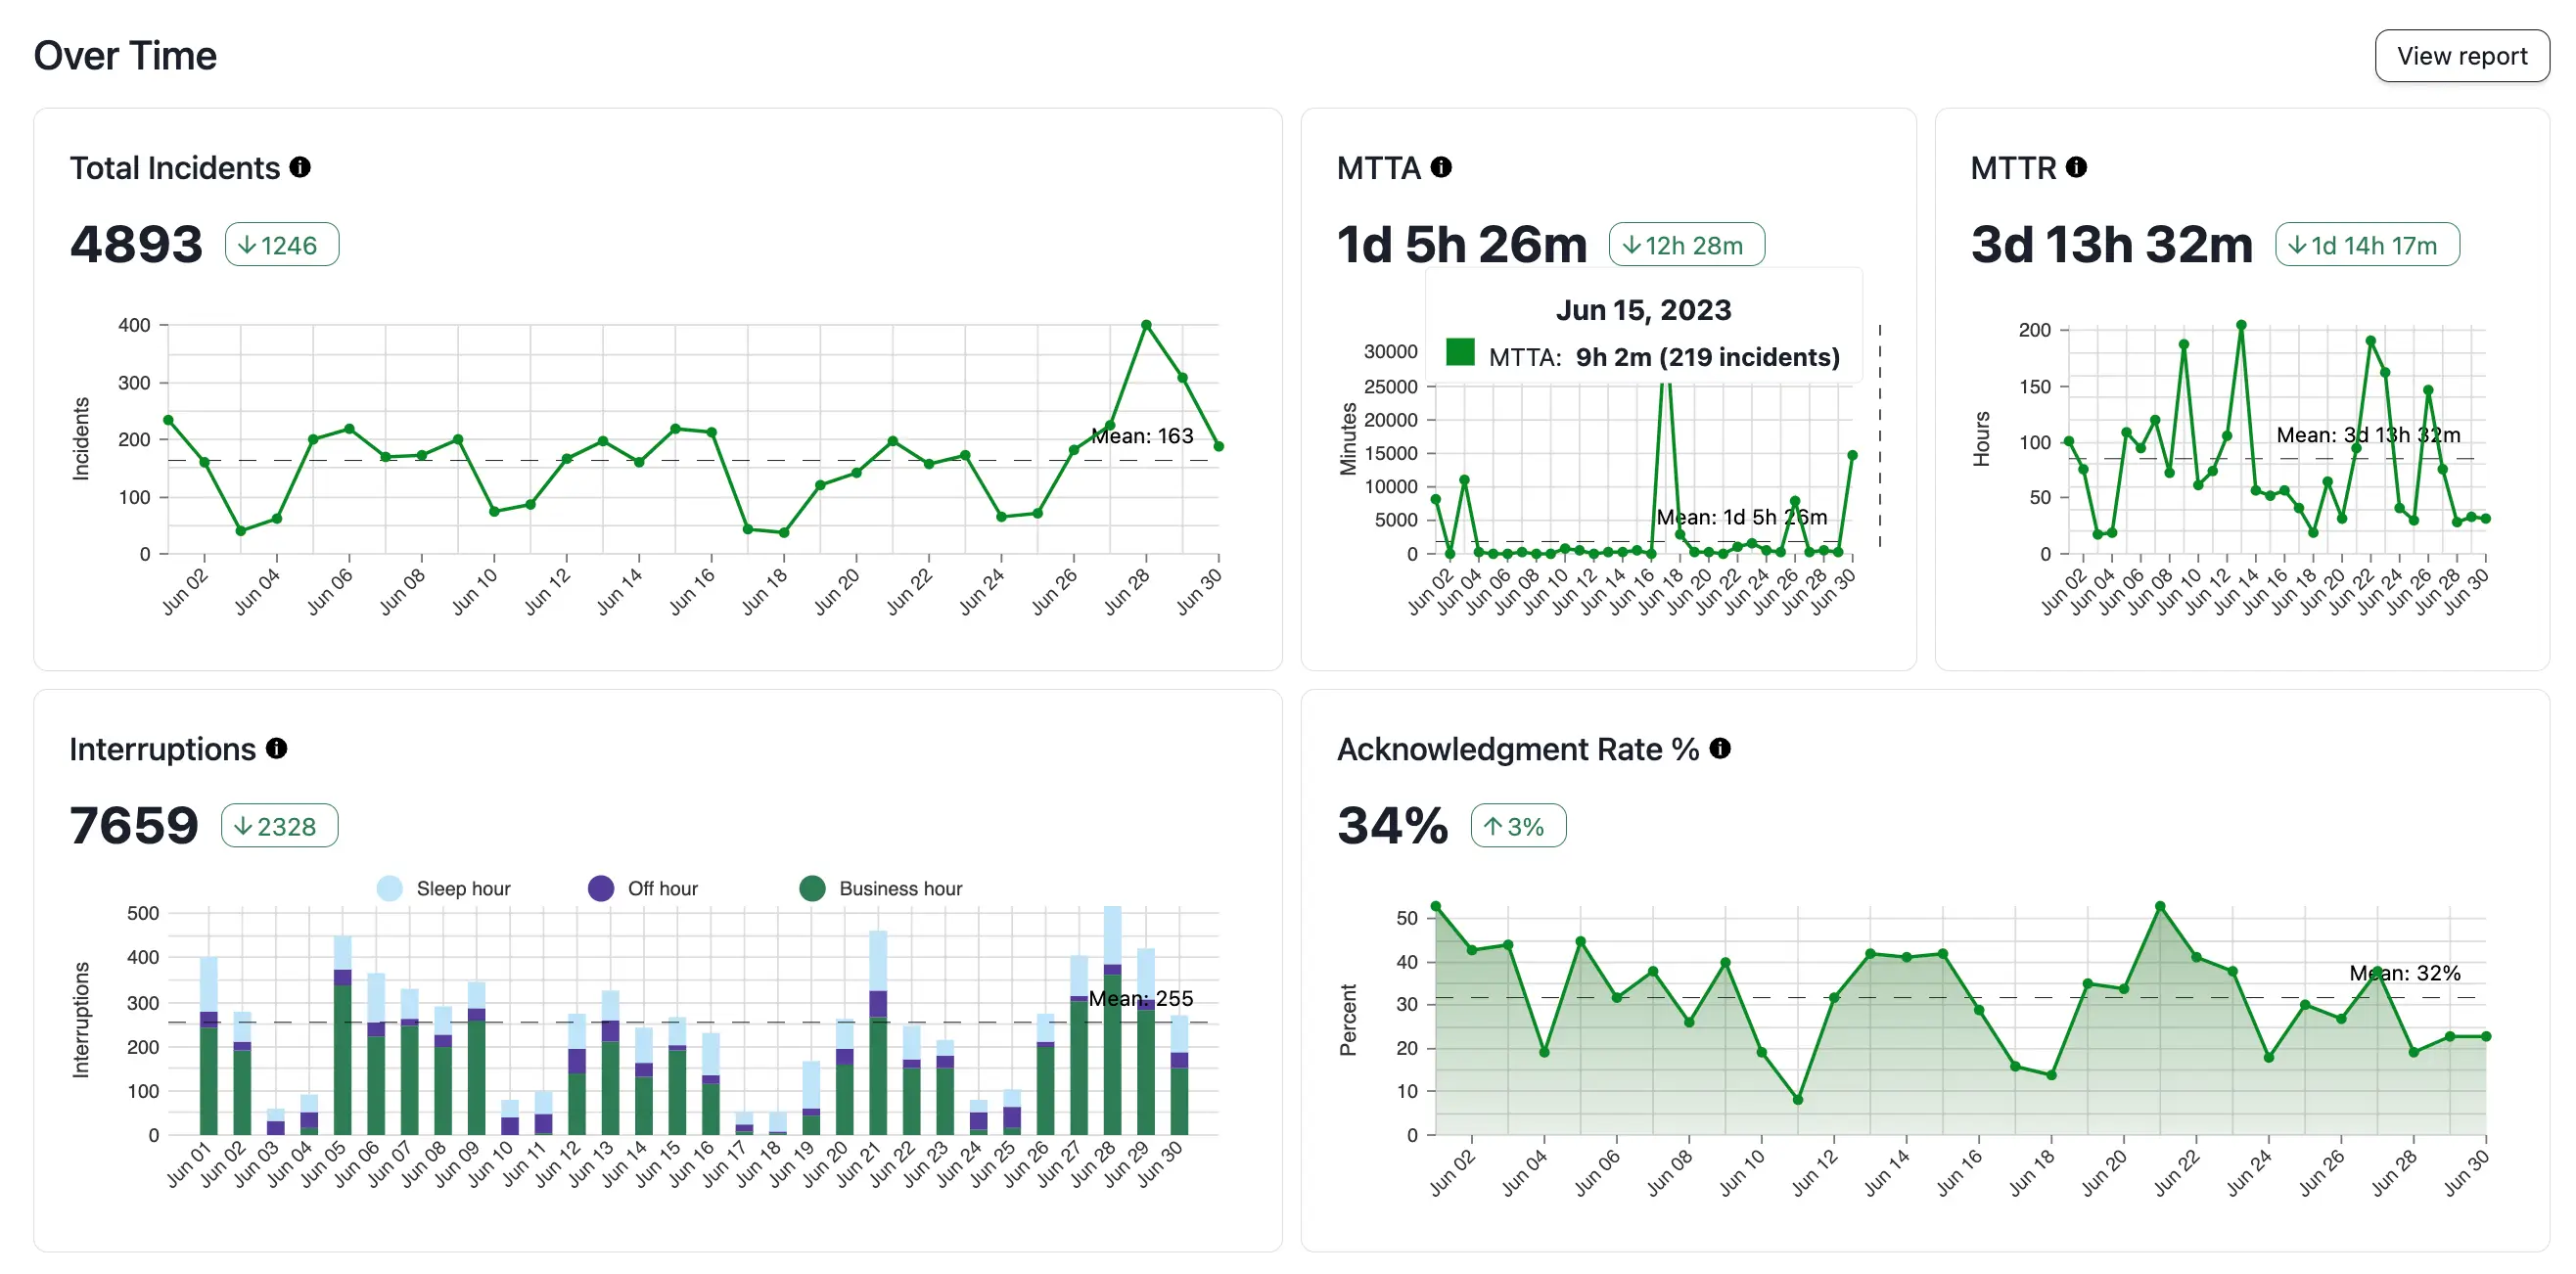 *Over Time analytics* | Metric | Definition | | :---------------------------- | :------------------------------------------------------------------------------------------------------------------------------------------------------------------------------------------------------------------ | | **Total Incidents** | Total count of incidents matching the active filters. | | **MTTA** | Mean time to acknowledge is the average amount of time from when an incident is created until the time the first responder acknowledges an incident. Excludes incidents that were not acknowledged. | | **MTTR** | Mean time to resolve is the average amount of time from when an incident was created until it was resolved. Excludes incidents that have not been resolved. | | **Interruptions** | Interruptions are when an on-call responder receives a mobile push, phone call notification, or SMS (text). Notifications sent from various channels (push, phone, SMS) to the same user count as one interruption. | | **Acknowledgement Rate %** | Percentage of the total number of incidents which were acknowledged. Only explicit incident acknowledgments count; reassign, resolve, and escalation actions do not imply acknowledgement. | Click **View Report** in this section to see the [Incident Activity](/incident-management/analytics/insights/incident-activity) report. ## Services The Services section offers a visualization of key metrics, sorted by services, such as the Incidents by Service, Uptime, Highest MTTA, Highest MTTR, and Escalations by Service. 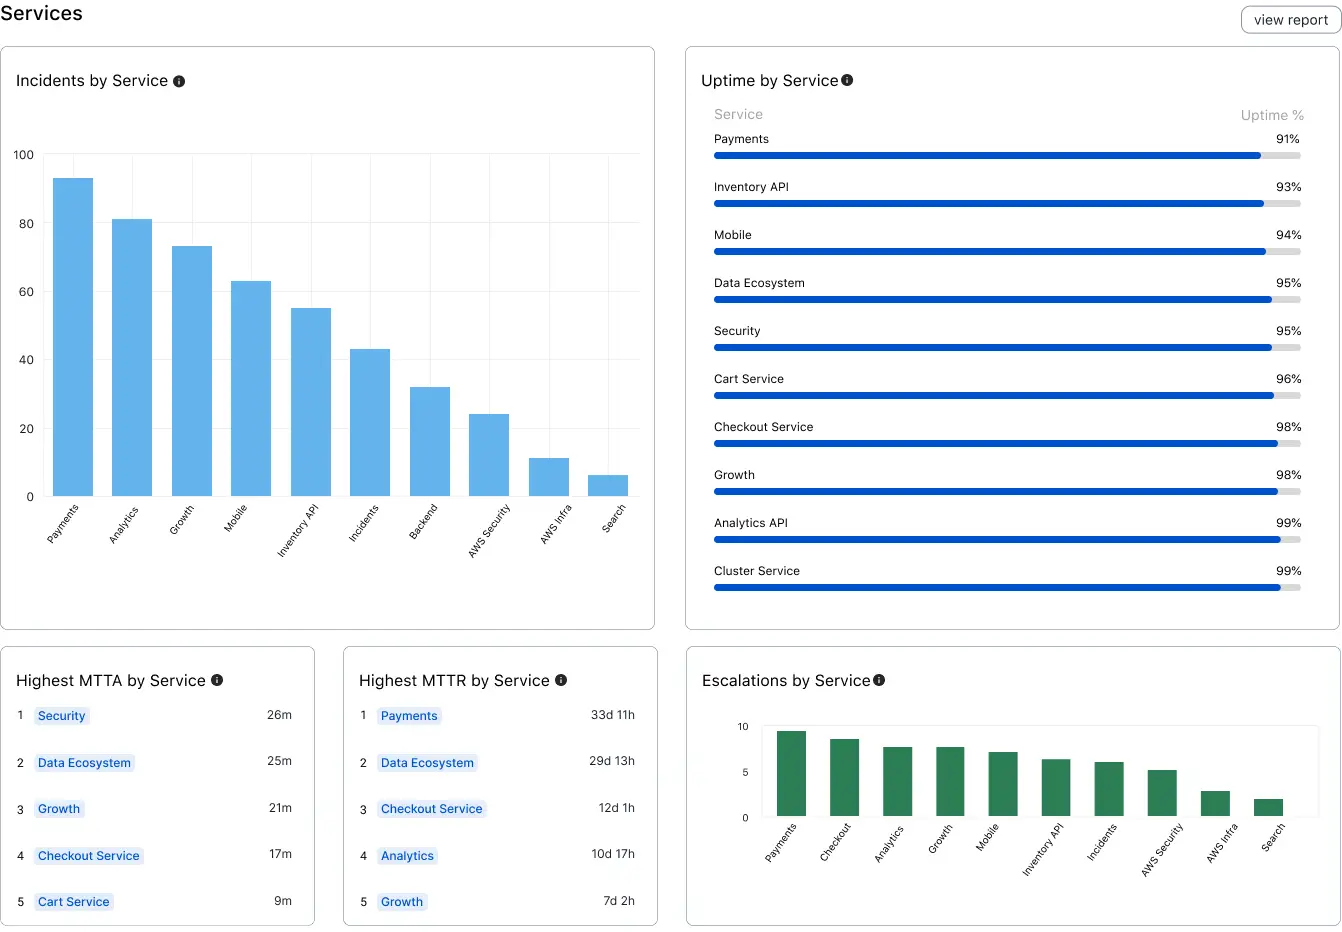 *Service analytics* | Metric | Definition | | :----------------------------------------------- | :------------------------------------------------------------------------------------------------------------------------------------------------------------------------------------------------------------------------------------------------------------------ | | **Incidents by Service** | Total count of incidents matching the provided filters, sorted by service. | | **Uptime by Service** | The inverse of the time (in %) during which the service had an active major incident, sorted by service. A major incident is defined as the top two levels of your priority settings, or if multiple responders are added and acknowledge. | | **Highest MTTA by Service** | Highest mean time to acknowledge matching the provided filters, sorted by Services. MTTA is the average amount of time from when an incident is created until the time the first responder acknowledges an incident. Excludes incidents that were not acknowledged. | | **Highest MTTR by Service** | Highest mean time to resolve matching the provided filters, sorted by Services. MTTR is the average amount of time from when an incident was created until it was resolved. Excludes incidents that have not been resolved. | | **Escalations by Service** | Total count of escalations that occurred for incidents on this service. | Click **View Report** in this section to see the [Service Performance](/incident-management/analytics/insights/service-performance) report. ## Escalation Policies The Escalation Policies section offers a visualization of key metrics, sorted by escalation policies, such as Interruptions, Highest MTTA, Highest MTTR, and Incidents by Escalation Policy. 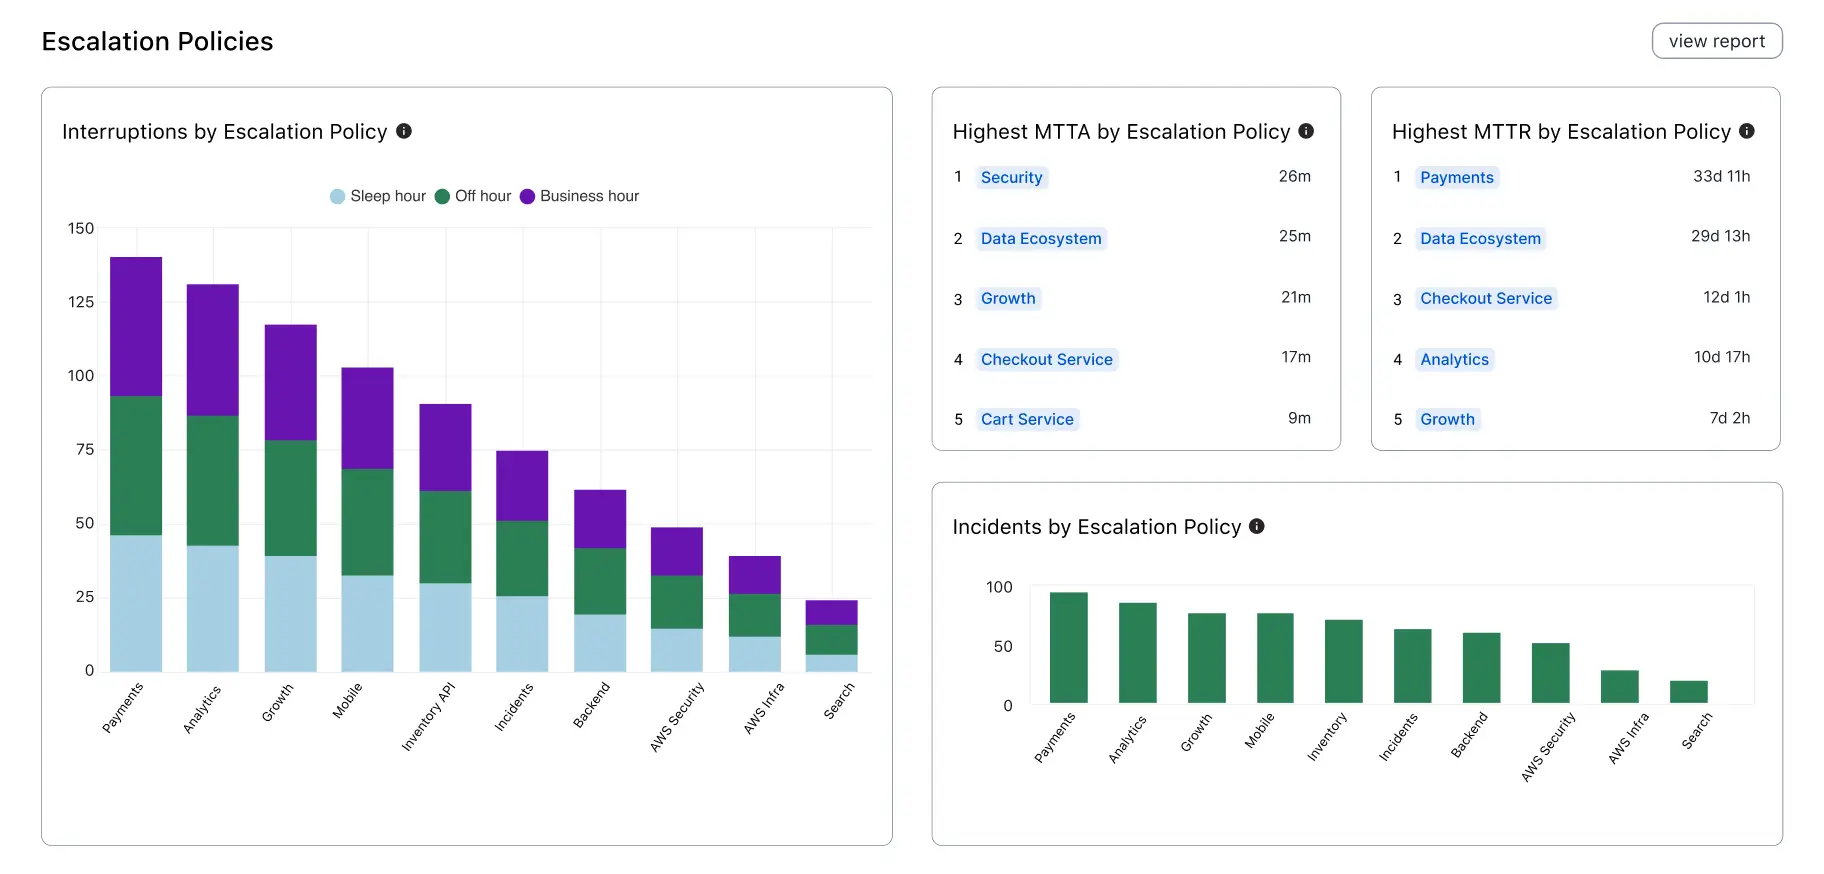 *Escalation Policy analytics* | Metric | Definition | | :--------------------------------------------------------- | :----------------------------------------------------------------------------------------------------------------------------------------------------------------------------------------------------------------------------------------------------------------------------- | | **Interruptions by Escalation Policy** | Total count of interruptions, sorted by Escalation Policies. Interruptions are when an on-call responder receives a mobile push, phone call, or SMS (text). Notifications sent from various channels (push, phone, SMS) to the same user count as one interruption. | | **Highest MTTA by Escalation Policy** | Highest mean time to acknowledge matching the provided filters, sorted by Escalation Policies. MTTA is the average amount of time from when an incident is created until the time the first responder acknowledges an incident. Excludes incidents that were not acknowledged. | | **Highest MTTR by Escalation Policy** | Highest mean time to resolve matching the provided filters, sorted by escalation policy. MTTR is the average amount of time from when an incident was created until it was resolved. Excludes incidents that have not been resolved. | | **Incidents by Escalation Policy** | Total count of incidents matching the active filters, sorted by escalation policy. | Click **View Report** in this section to see the [Escalation Policy](/incident-management/analytics/insights/escalation-policy-insights) report. ## Teams The Teams section offers a visualization of key metrics, sorted by [Teams](/account-admin/teams), such as the Interruptions, Highest MTTA, Highest MTTR, and Incidents by Team. 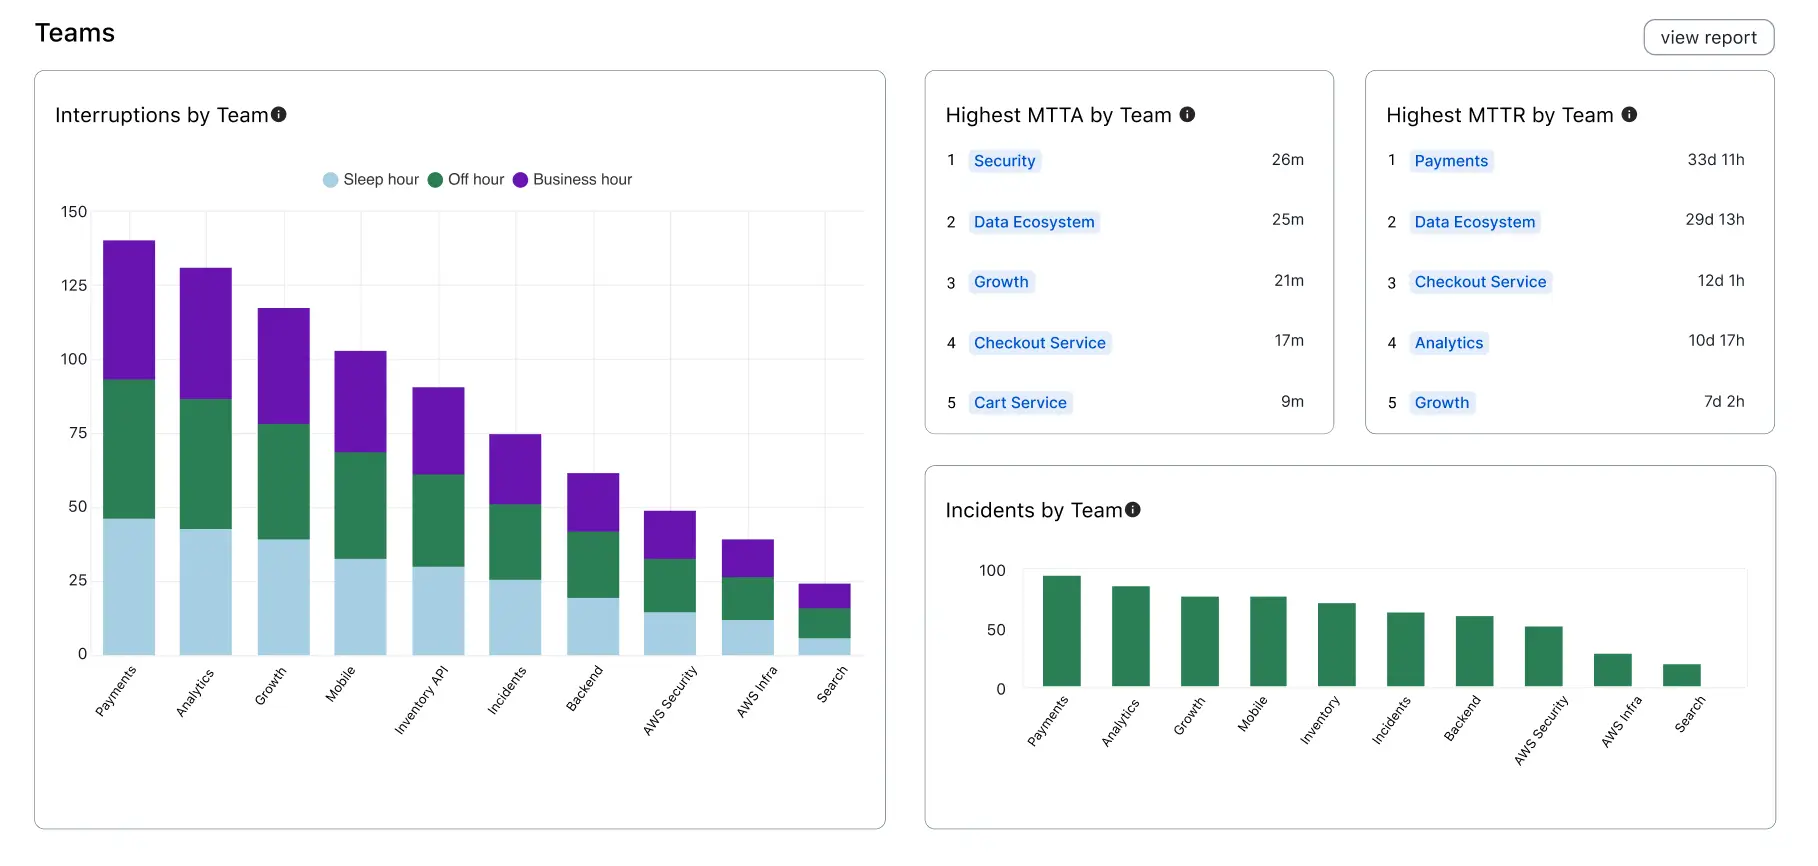 *Team analytics* | Metric | Definition | | :-------------------------------------------- | :----------------------------------------------------------------------------------------------------------------------------------------------------------------------------------------------------------------------------------------------------------------- | | **Interruptions by Team** | Total count of interruptions, sorted by Teams. Interruptions are when an on-call responder receives a mobile push, phone call, or SMS (text) notification. Notifications sent from various channels (push, phone, SMS) to the same user count as one interruption. | | **Highest MTTA by Team** | Highest mean time to acknowledge matching the provided filters, sorted by Teams. MTTA is the average amount of time from when an incident is created until the time the first responder acknowledges an incident. Excludes incidents that were not acknowledged. | | **Highest MTTR by Team** | Highest mean time to resolve matching the provided filters, sorted by Teams. MTTR is the average amount of time from when an incident was created until it was resolved. Excludes incidents that have not been resolved. | | **Incidents by Team** | Total count of incidents matching the active filters, sorted by Teams. | Click **View Report** in this section to see the [Team](/incident-management/analytics/insights/team) report. ## Responders The Responders section offers a visualization of key metrics, sorted by responders, such as the Response Effort and Incidents by Responder. 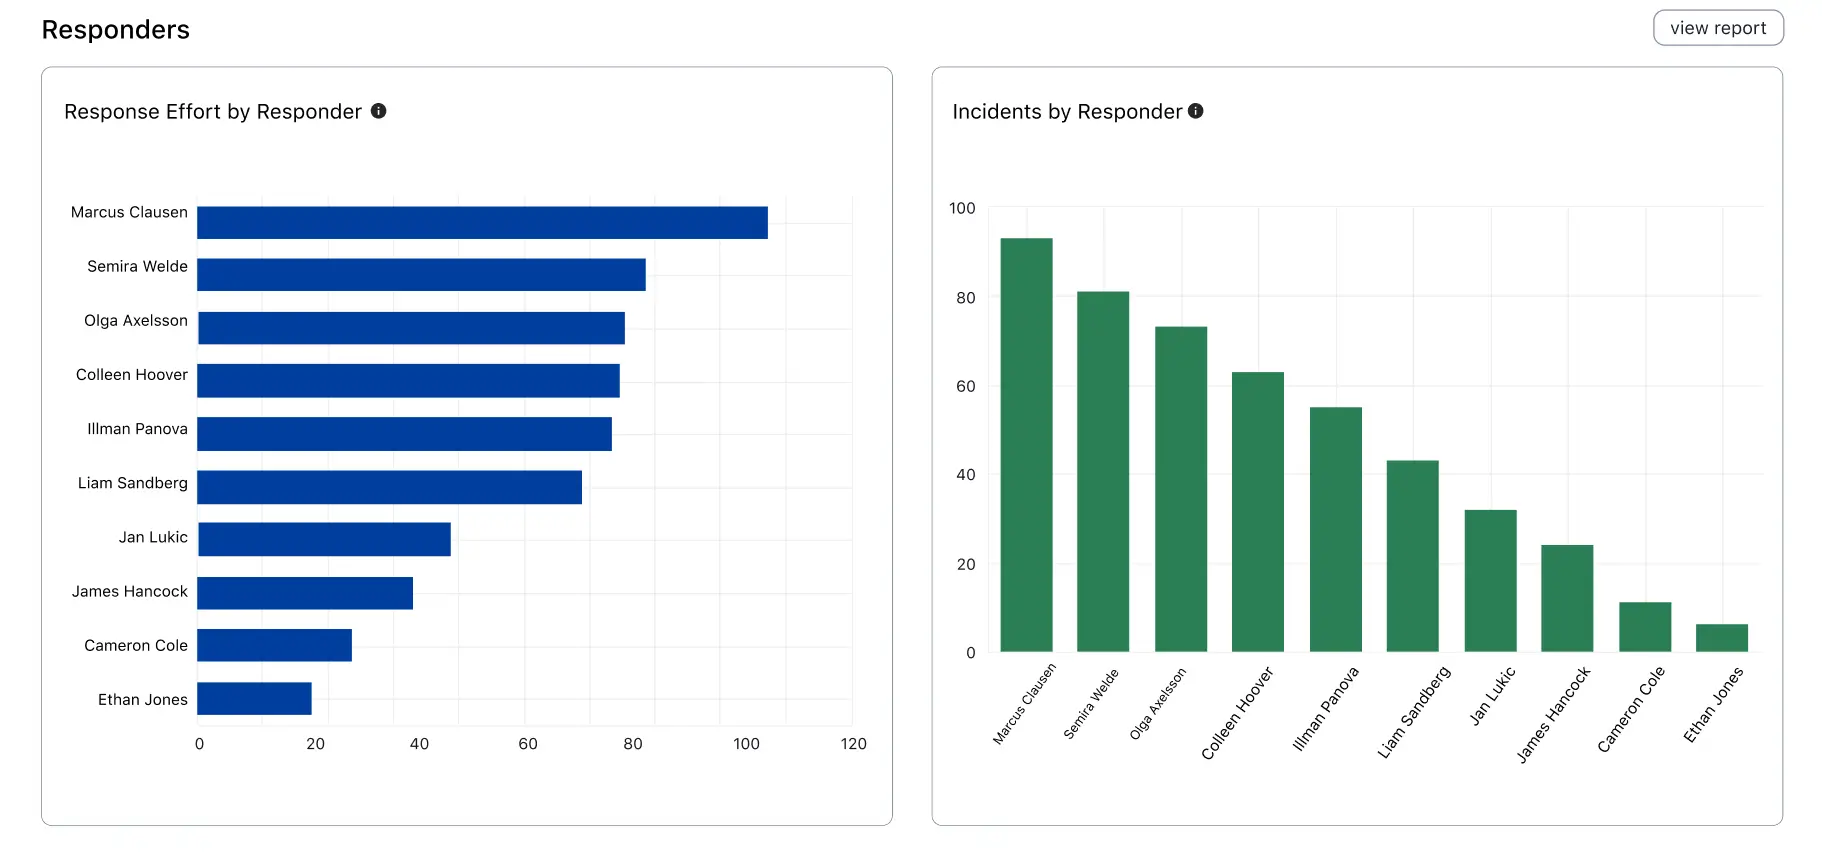 *Responder analytics* | Metric | Definition | | :------------------------------- | :--------------------------------------------------------------------------------------------------------------------------------------------------------- | | **Response Effort by Responder** | The total engaged time of the responder, measured from the time the responder acknowledges or accepts a responder request, until the incident is resolved. | | **Incidents by Responder** | Total count of incidents matching the active filters, sorted by responders. | Click **View Report** in this section to see the [Responder](/incident-management/analytics/insights/responder) report. ## Share the Analytics Dashboard Click **Share** → **Copy Link** to copy the dashboard's unique URL to your clipboard, which you can share with others. Signed-in users who visit the link see the same filters applied in their dashboard.  *Share a dashboard's URL*
--- URL: https://docs.pagerduty.com/incident-management/analytics/advance-analytics # PagerDuty AI Analytics View MTTA, MTTR, credit usage, and time-saved metrics for incidents where your team interacted with PagerDuty AI. PagerDuty AI Analytics is designed for teams using [PagerDuty AI](/ai-automation/advance) that are looking to leverage data-driven insights to streamline incident response and improve efficiency. By visualizing key metrics like Mean Time to Acknowledge (MTTA) and Mean Time to Resolve (MTTR), along with usage breakdowns and time saved through automation, PagerDuty AI Analytics helps teams identify trends, optimize response efforts, and maximize the impact of automation. It is an essential tool for any organization that wants to enhance operational resilience, reduce manual workloads, and harness the power of AI-driven insights to improve incident management outcomes. > **Availability:** PagerDuty AI Analytics is available on PD Reliability Platform plans. It's also available on the following pricing plans: Professional, Business, Digital Operations (legacy), and Enterprise for Incident Management. Contact the [Sales Team](https://www.pagerduty.com/contact-us/#contact-sales) to upgrade to an account plan with this feature. > **Required Permissions:** All user roles have access to PagerDuty Analytics. ## View PagerDuty AI Analytics You can view PagerDuty AI Analytics in the PagerDuty web app by navigating to either **Analytics** → **PagerDuty Advance** or **AI** → **Usage Analytics**. Data in the Analytics Dashboard updates once per day. It may take up to 24 hours for new data to appear. A timestamp in the page's top-right indicates the last update. > **Data Availability:** Data for PagerDuty AI Analytics is available starting September 16, 2024. ## Key Features PagerDuty AI Analytics consists of the following sections: | Section | Description | | :-------------------------------------------------- | :------------------------------------------------------------------------------------------------------------------------------------------------------------------------------------------------------------------------------------------------------------------------------------------------------------------------------ | | **Advance usage** | Number of incidents where teams interacted with Advance. | | **Total Incidents using Advance** | Number of incidents where teams interacted with Advance. | | **MTTA for Incidents using Advance** | Mean time to acknowledge where teams interacted with Advance. | | **MTTR for Incidents using Advance** | Mean time to resolve where teams interacted with Advance. | | **Total time saved** | Total time saved through the combined usage of Advance Actions. | | **Average time saved per Advance action** | [See how PagerDuty estimates time saved](/ai-automation/advance#how-many-ai-actions-does-each-action-type-cost). | | **Total credits usage breakdown by Advance action** | Total credits usage breakdown by Advance Action. [See how credits work](/ai-automation/advance#how-many-ai-actions-does-each-action-type-cost). | | **Usage breakdown by Action** | The actions table can be found in [PagerDuty AI](/ai-automation/advance#how-many-ai-actions-does-each-action-type-cost). A promoted action is when the user requests an action by either typing or clicking on a button. The proactive message is when PagerDuty AI proactively shows insights without the user requesting it. | > **Insights and Shift Agent AI Actions:** Effective April 2026, Insights and Shift agents will no longer consume AI Actions. However, historical AI Action consumption (formerly known as PD Advance credits) will continue to be displayed in the dashboard for reference. Refer to [How many AI Actions does each action cost](/ai-automation/advance#how-many-ai-actions-does-each-action-type-cost) for more information. ## Filter and Search To help you find the most relevant results, the following filters are available: - **Team**: Filter by specific teams or view all teams. - **Escalation Policy**: Select one or more escalation policies. - **Service**: Choose specific services to analyze. - **Urgency**: Filter by All, High, or Low-urgency incidents. - **Priority**: Select from All or any of your account's preconfigured incident priority levels. - **Date Range**: Choose from preset options or select a custom date range. Custom date ranges can span up to one year. ## Share the PagerDuty AI Analytics Dashboard To share the PagerDuty AI Analytics dashboard: 1. Navigate to **Analytics** → **PagerDuty Advance**. 2. Click **Share** in the top-right corner of the dashboard. 3. Click **Copy Link** to copy the dashboard's unique URL to your clipboard. You can share this link with colleagues who have access to PagerDuty AI. Users who visit the shared link see the same filters applied in their dashboard view. --- URL: https://docs.pagerduty.com/incident-management/analytics/audit-trail # Audit Trail Reporting Track and report on changes to PagerDuty account objects With Audit Trail Reporting, most changes to the configuration of PagerDuty account objects are tracked, attributed, and available for review and reporting. Audit Trail information helps prevent missed incidents and allows auditors to maintain internal compliance. Users have Audit Trail Reporting information available to review both at the object level and through our API. Audit Trail Reporting is available on the following PagerDuty objects: - [User](#user-audit-trail-reporting) - [Team](#team-audit-trail-reporting) - [Escalation Policy](#escalation-policy-audit-trail-reporting) - [Schedule](#schedule-audit-trail-reporting) - [Service](#service-audit-trail-reporting) - [Incident Workflow](#incident-workflow-audit-trail-reporting) > **Requirements:** - Audit Trail Reporting is available on the following pricing plans: > - Business > - Enterprise for Incident Management. > - Digital Operations (legacy) > - All users, with the exception of Limited Stakeholders, can view Audit Trail reports. Restricted Access users will only be able to view User reports and reports for objects they have been given access to. ## Audit Trail Data All Audit Trail reports will have an audit history page with the following parameters: - **Date**: Date of the change. - **Actor**: User who made the change. - **Object**: Account object type. - **Action**: Create, update or delete. - **Method**: Browser, API or OAuth (mobile). - You can view the change's full **details** by clicking the dropdown to the right. You may filter these results by **Last 24 Hours**, **Past Week**, **Past Month** or **Custom** date range. Users can access audit records from the last 12 months, on-demand, and at any frequency. The maximum duration you can view at once is 31 days. 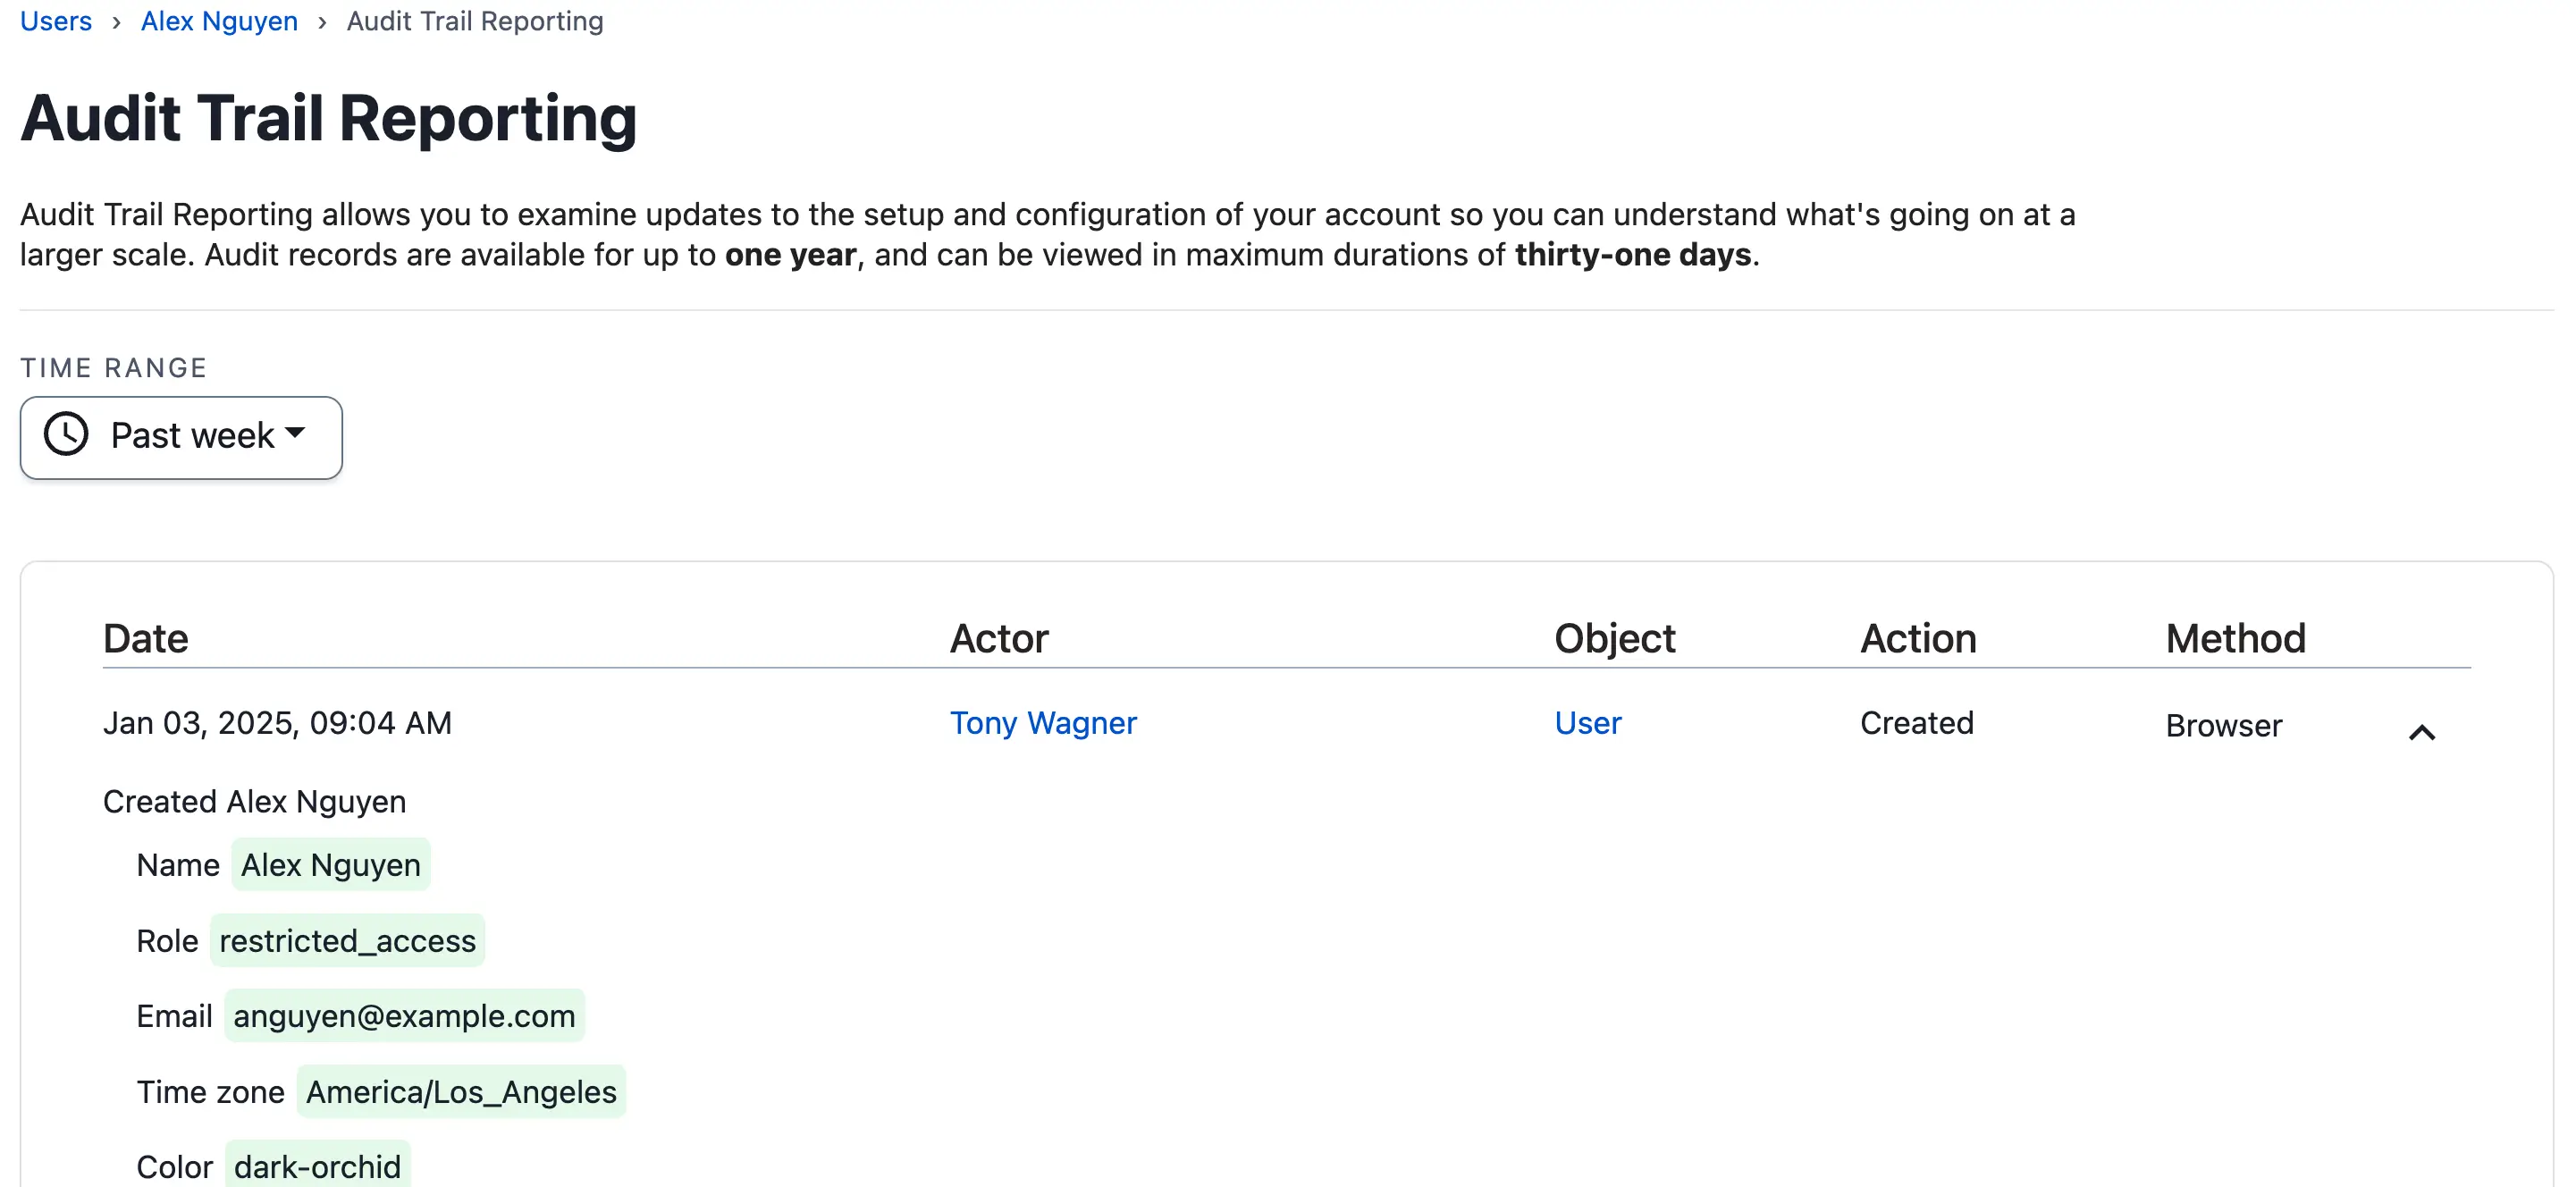 ### User Audit Trail Reporting In the PagerDuty web app, navigate **People** → **Users** and select your desired user. On their **user profile**, click **View Audit Trail Reporting** on the right of the screen.  *View User Audit Trail Reporting* ### Team Audit Trail Reporting In the PagerDuty web app, navigate to **People** → **Teams** and select your desired **Team**. Click **View Audit Trail Reporting** on the right of the screen.  ### Escalation Policy Audit Trail Reporting In the PagerDuty web app, navigate to **People** → **Escalation Policies** and select your desired **Escalation Policy**. Click → **View Audit Report** on the right of the screen. At this time, this feature does not include changes to users or levels on escalation policies. 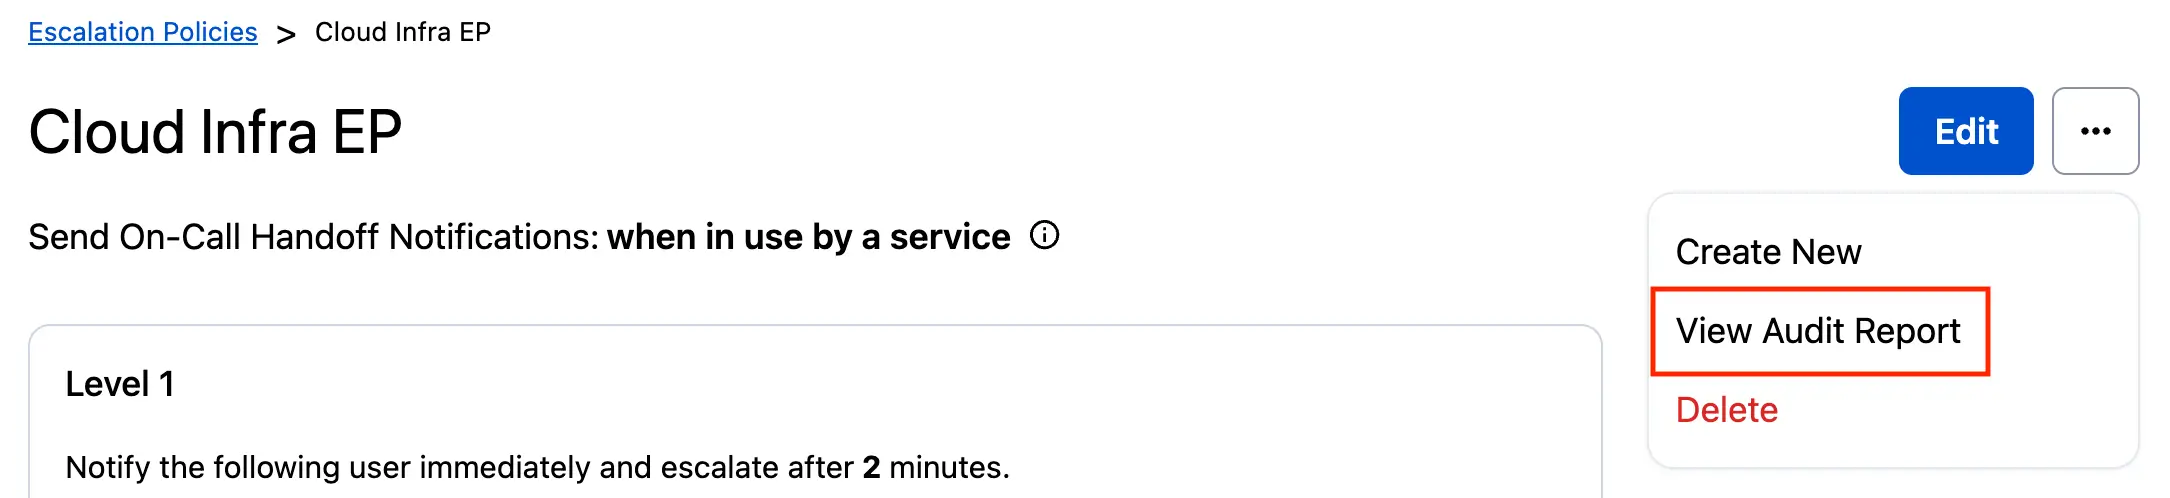 ### Schedule Audit Trail Reporting In the PagerDuty web app, navigate to **People** → **Schedules** and select your desired **Schedule**. Click **View Audit Trail Reporting** on the right of the screen. At this time, this feature does not include details about overrides or users being added or removed from schedules. For a closer look at the before and after versions of a schedule, please refer to our documentation on our [revert schedule](/incident-management/schedules/edit-schedules#restore-a-schedule-to-a-previous-version) feature. 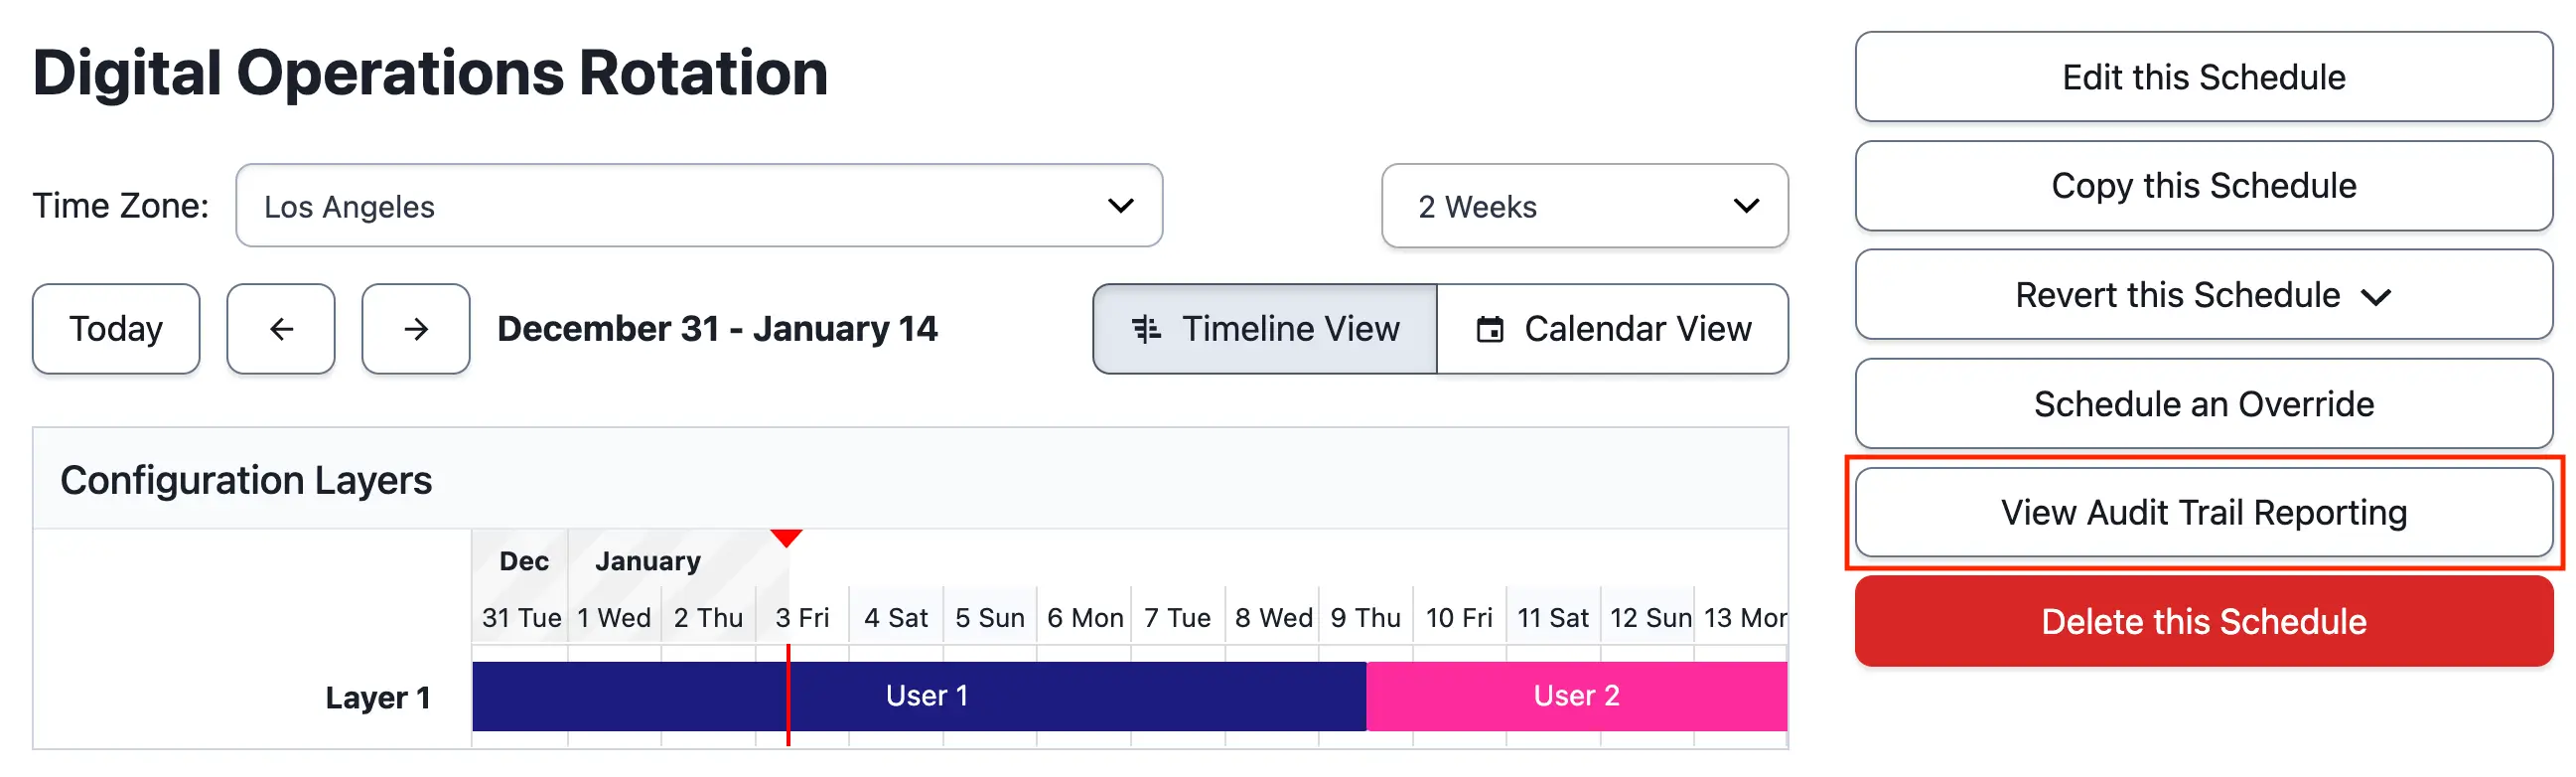 ### Service Audit Trail Reporting In the PagerDuty web app, navigate to **Services** → **Service Directory** and select your desired **Service**. Click **More** on the right of the screen and select **View Audit Trail Reporting**.  > **Limitations:** Audit Trail Reporting does not capture the following actions related to services: > > - Adding and removing extensions and integrations > - Disabling services > - [Maintenance Windows](/incident-management/services/maintenance-windows) ### Incident Workflow Audit Trail Reporting In the PagerDuty web app, navigate to **Automation** → **Incident Workflows**, click the dropdown to the right of your preferred Workflow, and select **View Audit Trail Reporting**. 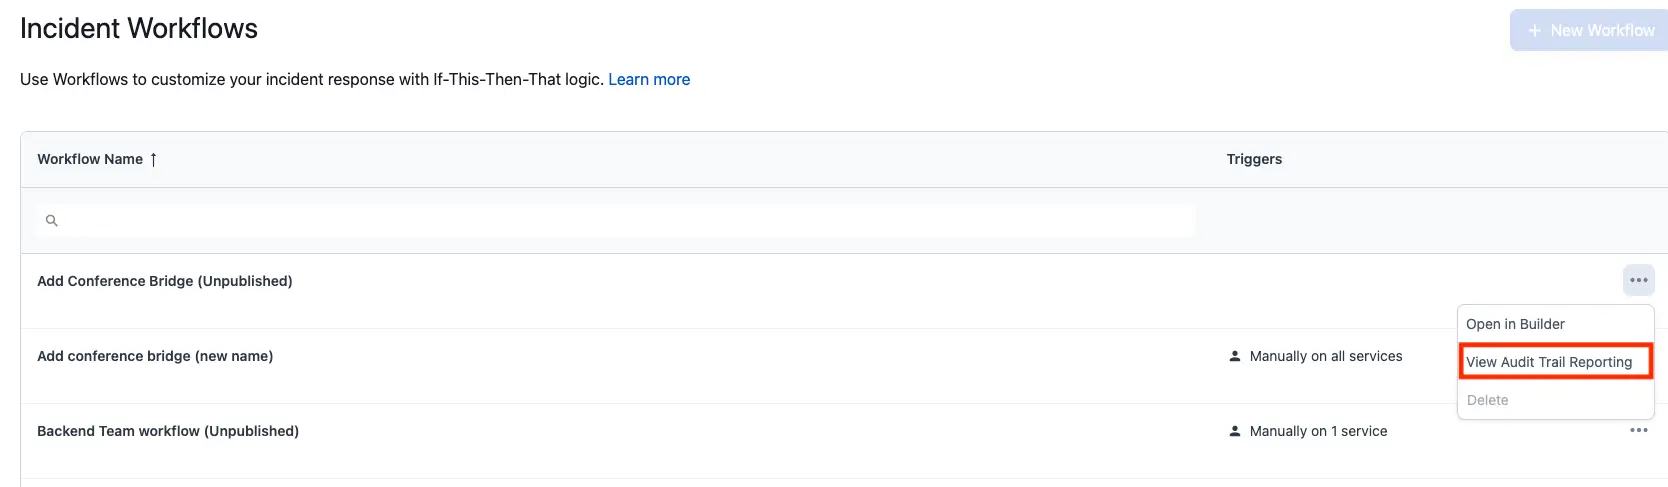 ## Audit Trail Reporting API For more information on advanced usage of Audit Trail Reporting, please visit our developer documentation, [List audit records](/developer/api/reference/rest/audit/list-audit-records). --- URL: https://docs.pagerduty.com/incident-management/analytics/dashboard # Analytics Dashboard See account-wide MTTA, MTTR, and interruption trends broken out by service, escalation policy, team, and responder metrics. The Analytics Dashboard provides an account-wide overview of historical data, helping you identify areas for improvement and achieve your digital operations goals. > **Availability:** The Analytics Dashboard is available on PD Reliability Platform plans. It's also available on the following pricing plans: > > - Professional > - Business > - Enterprise for Incident Management > - Digital Operations (legacy) > > Please [contact our Sales team](https://www.pagerduty.com/contact-us/#contact-sales) to upgrade to a plan with this feature. ## View the Analytics Dashboard You can find the Analytics Dashboard in the web app's menu under **Analytics** → **Dashboard**. The Analytics Dashboard consists of the following sections: - [Over Time](#over-time) - [Services](#services) - [Escalation Policies](#escalation-policies) - [Teams](#teams) - [Responders](#responders) > **Data Update Schedule:** Data in the Analytics Dashboard updates once per day, and it may take up to 24 hours for new data to appear. A timestamp in the page's upper-right indicates the last update. ## Filters and Search The following filters are available to help you find the most relevant results: - **Team**: Click the **Team** dropdown and select the tab for **My Teams** or **All Teams**. Select the checkbox next your preferred Team(s) from the list and _optionally_ enter a search term to narrow results. Click **Apply** to update the data in the Analytics Dashboard. - **Escalation Policy**: Click the **Escalation Policy** dropdown and search or select one or more escalation policies. Click **Apply** to update the data in the Analytics Dashboard. - **Note**: If you have filtered by specific [Teams](/account-admin/teams), this filter will automatically populate the escalation policies associated with by the selected Team(s). - **Service**: Click the **Service** dropdown and search or select one or more services. Click **Apply** to update the data in the Analytics Dashboard. - **Note**: If you have filtered by specific services, this filter will automatically populate services associated with the selected Team(s). - **Urgency**: Select from **All**, **High** or **Low** to display incidents with the chosen urgency. - **Priority**: Select from **All** or any of your account’s preconfigured [Incident Priority](/incident-management/incidents/incident-priority) level(s). - **Date Range**: Select from **Last 7 Days**, **Last 30 Days**, **Last Month**, **This Month**, or **Custom Range** (if you select **Custom Range**, use the calendar to choose your preferred start and end dates and click **Apply**). - **Note**: For custom ranges, you can select a start date up to three years in the past. A maximum duration of one year is allowed. ## Over Time The Over Time section offers a visualization of key incident metrics: Total Incidents, MTTA, MTTR, Interruptions, and Acknowledgement Rate %.  | Metric | Definition | | :------------------------- | :----------------------------------------------------------------------------------------------------------------------------------------------------------------------------------------------------------------- | | **Total Incidents** | Total count of incidents matching the active filters. | | **MTTA** | Mean time to acknowledge is the average amount of time from when an incident is created until the time the first responder acknowledges an incident. Excludes incidents that were not acknowledged. | | **MTTR** | Mean time to resolve is the average amount of time from when an incident was created until it was resolved. Excludes incidents that have not been resolved. | | **Interruptions** | Interruptions are when an on-call responder receives a mobile push, phone call notification or SMS (text). Notifications sent from various channels (push, phone, SMS) to the same user count as one interruption. | | **Acknowledgement Rate %** | Percentage of the total number of incidents which were acknowledged. Only explicit incident acknowledgments count; reassign, resolve, and escalation actions do not imply acknowledgement. | Click **View Report** in this section to see the [Incident Activity](/incident-management/analytics/insights/incident-activity) report. ## Services The Services section offers a visualization of key metrics, sorted by services, such as the Incidents by Service, Uptime, Highest MTTA, Highest MTTR, and Escalations by Service.  | Metric | Definition | | :--------------------------------------- | :------------------------------------------------------------------------------------------------------------------------------------------------------------------------------------------------------------------------------------------------------------------ | | **Incidents by Service** | Total count of incidents matching the provided filters, sorted by service. | | **Uptime by Service** | The inverse of the time (in %) during which the service had an active major incident, sorted by service. A major incident is defined as the top two levels of your priority settings, or if multiple responders are added and acknowledge. | | **Highest MTTA by Service** | Highest mean time to acknowledge matching the provided filters, sorted by Services. MTTA is the average amount of time from when an incident is created until the time the first responder acknowledges an incident. Excludes incidents that were not acknowledged. | | **Highest MTTR by Service** | Highest mean time to resolve matching the provided filters, sorted by Services. MTTR is the average amount of time from when an incident was created until it was resolved. Excludes incidents that have not been resolved. | | **Escalations by Service** | Total count of escalations that occurred for incidents on this service | Click **View Report** in this section to see the [Service Performance](/incident-management/analytics/insights/service-performance) report. ## Escalation Policies The Escalation Policies section offers a visualization of key metrics, sorted by escalation policies, such as Interruptions, Highest MTTA, Highest MTTR, and Incidents by Escalation Policy.  *Escalation Policy analytics* | Metric | Definition | | :------------------------------------------------- | :----------------------------------------------------------------------------------------------------------------------------------------------------------------------------------------------------------------------------------------------------------------------------- | | **Interruptions by Escalation Policy** | Total count of interruptions, sorted by Escalation Policies. Interruptions are when an on-call responder receives a mobile push, phone call or SMS (text). Notifications sent from various channels (push, phone, SMS) to the same user count as one interruption. | | **Highest MTTA by Escalation Policy** | Highest mean time to acknowledge matching the provided filters, sorted by Escalation Policies. MTTA is the average amount of time from when an incident is created until the time the first responder acknowledges an incident. Excludes incidents that were not acknowledged. | | **Highest MTTR by Escalation Policy** | Highest mean time to resolve matching the provided filters, sorted by escalation policy. MTTR is the average amount of time from when an incident was created until it was resolved. Excludes incidents that have not been resolved. | | **Incidents by Escalation Policy** | Total count of incidents matching the active filters, sorted by escalation policy. | Click **View Report** button in this section to see the [Escalation Policy](/incident-management/analytics/insights/escalation-policy-insights) report. ## Teams The Teams section offers a visualization of key metrics, sorted by [Teams](/account-admin/teams), such as the Interruptions, Highest MTTA, Highest MTTR, and Incidents by Team.  | Metric | Definition | | :------------------------------------ | :----------------------------------------------------------------------------------------------------------------------------------------------------------------------------------------------------------------------------------------------------------------- | | **Interruptions by Team** | Total count of interruptions, sorted by Teams. Interruptions are when an on-call responder receives a mobile push, phone call, or SMS (text) notification. Notifications sent from various channels (push, phone, SMS) to the same user count as one interruption. | | **Highest MTTA by Team** | Highest mean time to acknowledge matching the provided filters, sorted by Teams. MTTA is the average amount of time from when an incident is created until the time the first responder acknowledges an incident. Excludes incidents that were not acknowledged. | | **Highest MTTR by Team** | Highest mean time to resolve matching the provided filters, sorted by Teams. MTTR is the average amount of time from when an incident was created until it was resolved. Excludes incidents that have not been resolved. | | **Incidents by Team** | Total count of incidents matching the active filters, sorted by Teams. | Click **View Report** in this section to see the [Team](/incident-management/analytics/insights/team) report. ## Responders The Responders section offers a visualization of key metrics, sorted by responders, such as the Response Effort and Incidents by Responder.  | Metric | Definition | | :------------------------------- | :--------------------------------------------------------------------------------------------------------------------------------------------------------- | | **Response Effort by Responder** | The total engaged time of the responder, measured from the time the responder acknowledges or accepts a responder request, until the incident is resolved. | | **Incidents by Responder** | Total count of incidents matching the active filters, sorted by responders. | Click **View Report** in this section to see the [Responder](/incident-management/analytics/insights/responder) report. ## Share the Analytics Dashboard Click **Share** → **Copy Link** to copy the dashboard's unique URL to your clipboard, which you can share with others. Signed in users who visit the link will see the same filters applied in their dashboard.  *Share a dashboard's URL* --- URL: https://docs.pagerduty.com/incident-management/analytics/event-analytics # Event Analytics View historical accepted events to monitor event volume and consumption ## Event Analytics The Event Analytics Dashboard allows you to view historical [accepted events](#accepted-events) to identify past trends in volume. This information can help pinpoint times of peak load, or troubleshoot greater-than-expected volumes. For [consumption-based billing accounts](/ai-automation/aiops/overview), this is the "billable accepted events" under your pricing plan. This data can help you anticipate yearly event volumes and monitor your event consumption relative to your yearly budget. *Available on the PD Reliability Platform, Professional, Business, and Enterprise for Incident Management plans.* ## Accepted Events Accepted events are any valid events that are sent to and processed by PagerDuty via email integration or API with a successful `2XX` response. The number of events should correlate with the number of `2XX` responses you receive from the Events API. This means that all accepted events are counted, including: - Events sent to Events API v1, Events API v2, x-ere, etc. - API events sent to a service key or a Global Orchestration - Email events - Trigger, resolve, and acknowledge event actions - Deduplicated or suppressed events - Events sent to a service in maintenance mode - Events sent to a disabled service - Redundant resolves where a service continues to send resolves on the same incident - Events that are later dropped due to rules or event transformations Events that are _not_ counted include: - Events rejected at the API due to rate limiting, throttling, or an error - Events sent to deleted routing keys (integrations or orchestrations) — these do receive a `2XX` response for security reasons - Change events - REST API calls - Incidents created through the REST API, including manually created incidents in the [web app](/incident-management/incidents/overview#triggerdeclare-an-incident) or [mobile app](/get-started/mobile-app#trigger-or-declare-an-incident) The Event Analytics Dashboard provides a comprehensive view of your event journey. It expands beyond simple volume reporting to help Admins and Account Owners understand exactly what happens to events as they flow through PagerDuty — from the moment they are received to their final outcome. ## View the Event Analytics Dashboard 1. Navigate to **Analytics** → **Insights** → **Events**. 2. Select the date picker to choose a date range, then click **Apply**. 3. Select the icon to access the following filters: - Team - Routing key - Integration - Service 4. When finished, click **Apply filters**. ## Dashboard Components The dashboard is laid out in three zones: - **Total Events**: Shows Total Events and AIOps Events for the selected range. Each metric includes a period-over-period delta (up/down arrow and absolute change). Invalid or failed events are excluded. - **Events & Incidents Chart**: A stacked bar chart showing daily volume across three series: Incidents, AIOps Events, and Non-AIOps Events. - **Events Breakdown Charts**: Two stacked bar charts showing volume by Outcome and Sub-outcome over time. ### Total Events Shows total events for the selected range, alongside an AIOps Events sub-total. Each metric is paired with a period-over-period delta indicator (up/down arrow and absolute change vs. the prior comparable range, e.g., "compared to Mar 1 – Mar 31, 2026"). ### Events & Incidents Chart A stacked bar chart showing daily volume across three series: Incidents, AIOps Events, and Non-AIOps Events. AIOps events are sent to AIOps services. Incidents represent all incidents triggered by events. ### Events Breakdown Charts Two stacked bar charts showing a breakdown of the **Outcome** and **Sub-outcome** of events over time. #### Events by Outcome (What Happened) Outcomes represent the final state of an event in the PagerDuty workflow. These include: - **Triggered**: The event resulted in a new triggered incident. - **Triggered Deduped**: The event was deduplicated onto an existing open incident. - **Suppressed**: The event was silenced by an event rule or service setting. - **Suspended**: The event was held pending further evaluation (e.g., Auto-Pause). - **Suspended Deduped**: Suspended event that matched an existing suspended event. - **Acknowledged**: Event was acknowledged on arrival. - **Resolved**: The event resolved an existing incident. - **Dropped**: The event was permanently discarded and did not create, update, or resolve an alert or incident. An orchestration rule can drop an event, and events can also be dropped for other reasons — for example, a `resolve` event that does not match an open alert. 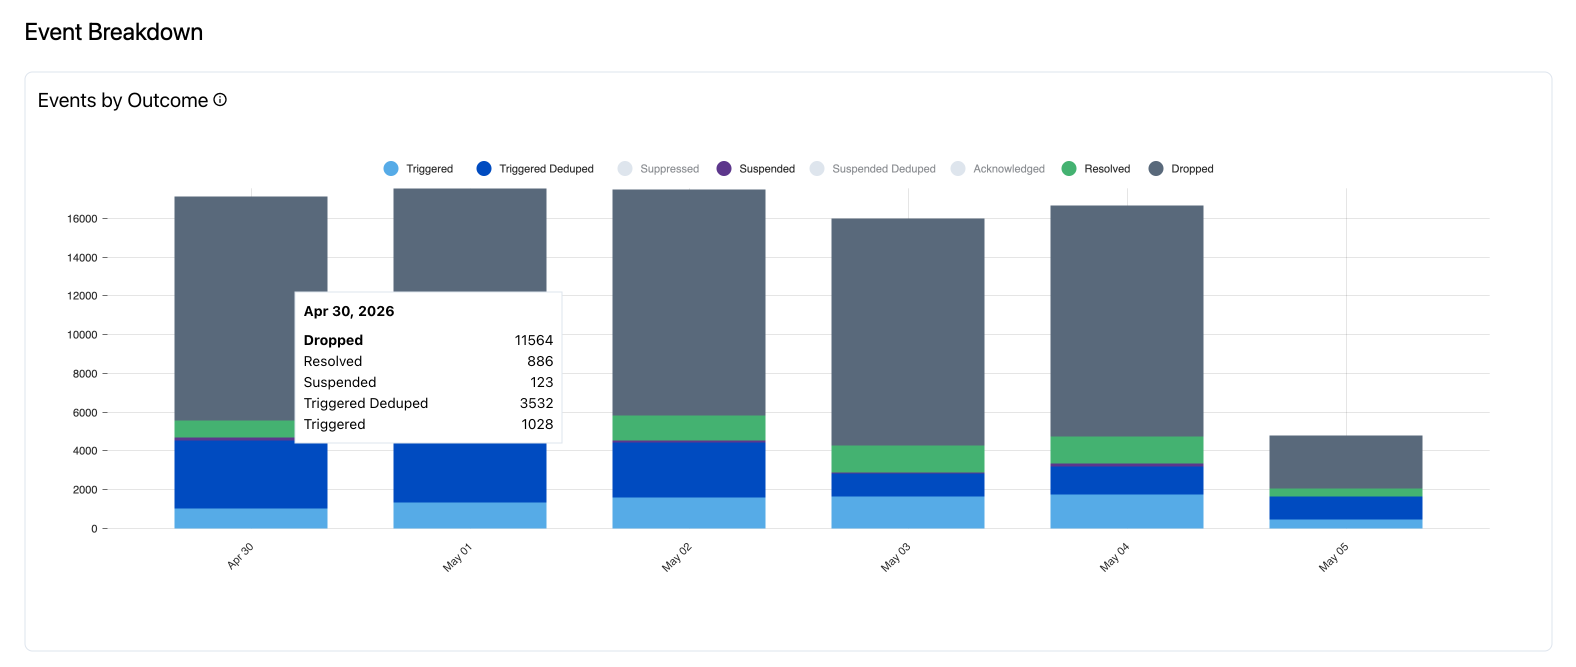 *Events by Outcome* #### Events by Sub-outcome (Why It Happened) Sub-outcomes provide granular diagnostic signals. Sub-outcomes include: - **Alert**: Event acted on an alert object (trigger, dedup, acknowledge, or resolve on an alert, not an incident). - **Alert and Incident**: Trigger created a new alert and a new incident simultaneously. - **Incident**: Event acted on an incident object (acknowledge or resolve on an incident, not an alert). - **Email Filters**: Incoming email matched no configured filter rules on the email integration (evaluated in EFS). - **Event Orchestration**: A Global Orchestration rule with a "Drop Event" action matched the event. - **Recent Event found**: The event ID was already processed within the past four hours; the duplicate was dropped. - **Unable to assign Incident**: No on-call users were reachable at the first escalation step, so the new incident could not be assigned. - **Incident not found**: An acknowledge or resolve request arrived with no matching open incident or alert (for example, repeated resolves after close). - **Disabled Service**: The target service is in an active maintenance window. - **Other**: No specific sub-outcome was recorded (errors, rare paths, or events rejected with a 4xx response). Identifying sub-outcomes like "Incident not found" or "Disabled Service" can help you quickly find and fix misconfigurations. 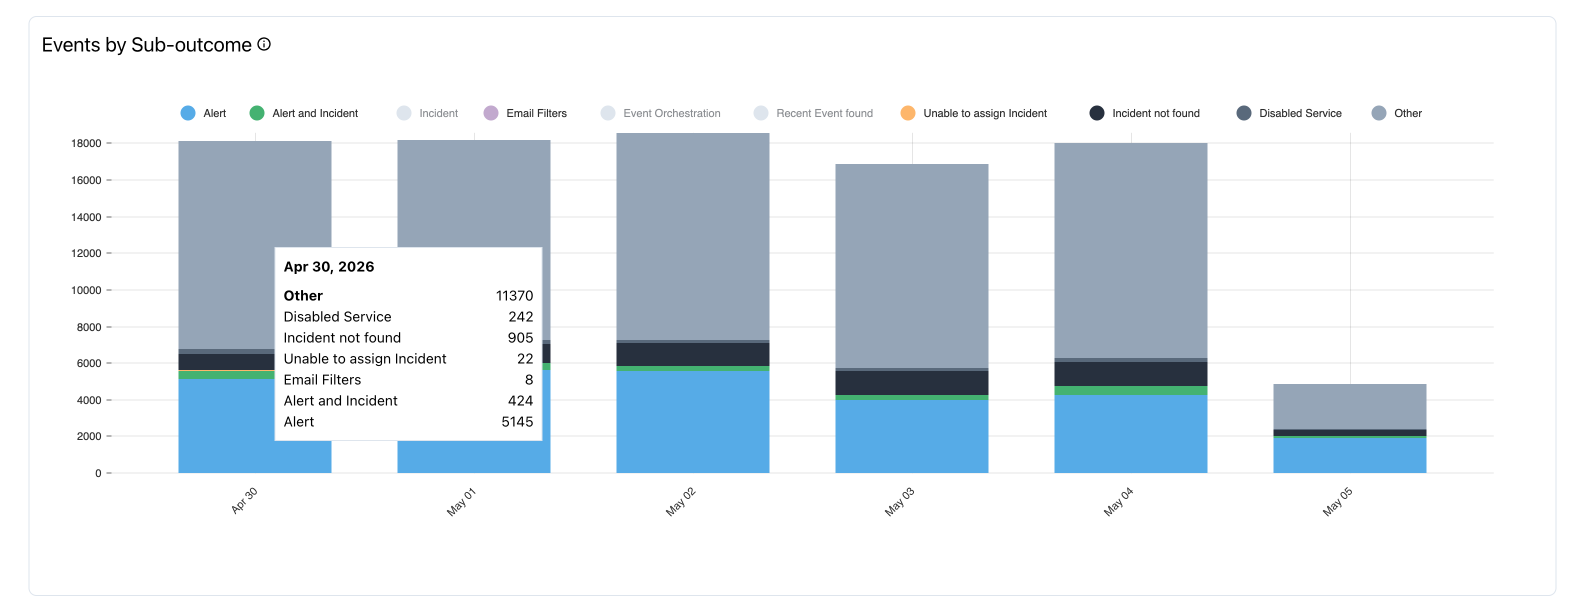 *Events by Sub-outcome* ## Events Breakdown Table The Events Breakdown table identifies the specific integrations and services driving event volume. It supports search, sorting (Total Events sorts descending by default), pagination, and CSV export. 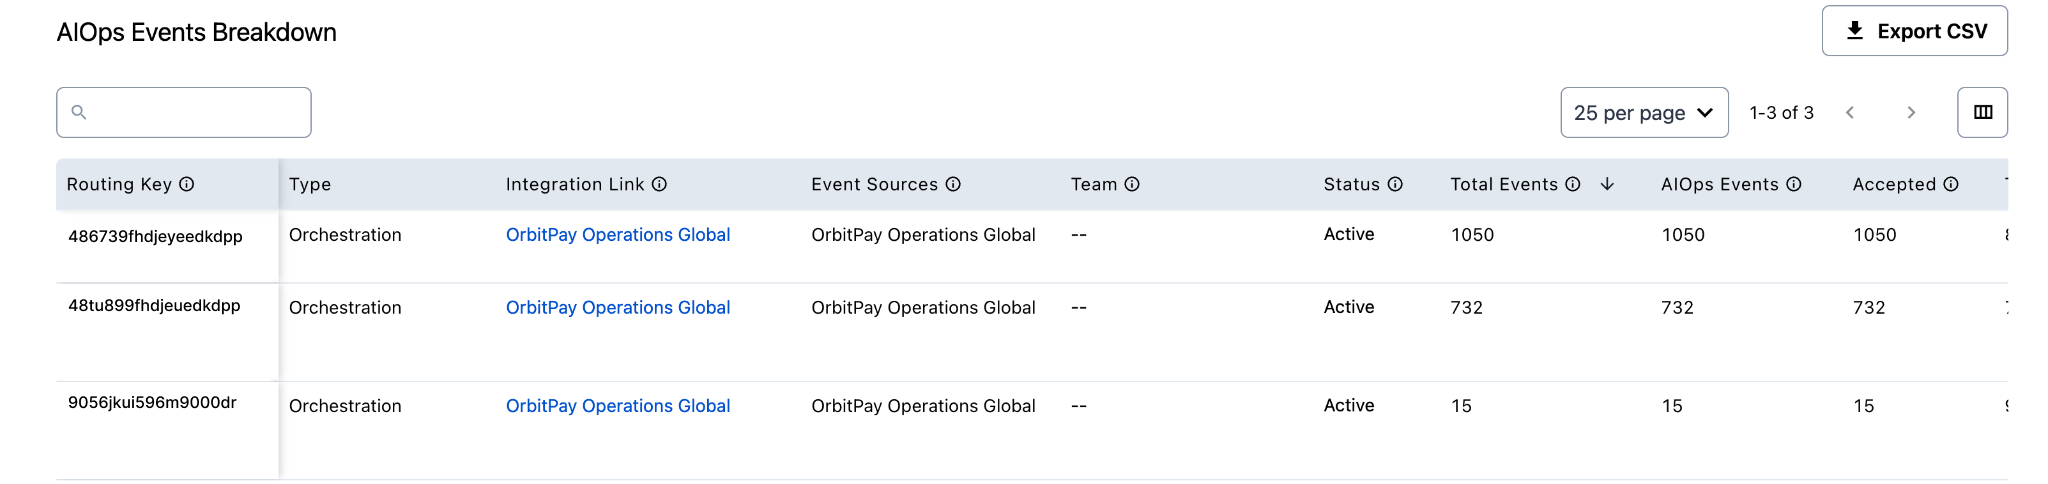 *Events breakdown table* > **CSV Export Limit:** CSV exports from the Events Breakdown table are limited to 1,000 rows. For larger export needs, use the Event Analytics API (currently in Early Access). ### Table Columns - **Routing Key**: The unique identifier for the integration. Full keys are visible to Admins only. - **Type**: e.g., Orchestration, Service, etc. - **Integration Link**: Clickable link to navigate directly to the ruleset, service, or orchestration associated with the key. - **Event Sources**: Source of event (e.g., Datadog, AWS, Events API v2). - **Team**: Team listed as owning the ruleset, service, or orchestration. - **Status**: Active, etc. - **Total Events**: The gross volume of events received. Total accepted events can be events sent via email integration or the Events API. This does not include rejected, rate-limited, or invalid events. - **AIOps Events**: Event sources processed with services or orchestrations that have AIOps enabled. ## Typical Workflows - **Check the headline**: Review Total Events and the period-over-period delta to confirm whether volume is trending up or down. - **Spot the spike**: Use the Events & Incidents chart to identify days with abnormal volume. - **Diagnose what happened to the events**: Use the Events by Outcome chart to see whether the volume turned into incidents, was suppressed, or was dropped. - **Diagnose why**: Use the Events by Sub-outcome chart to see which sub-outcome (e.g., Event Orchestration, Disabled Service) is driving the pattern. - **Find the source**: Use the Events Breakdown table — sorted by Total Events descending — to identify the specific routing keys, integrations, and services contributing the most volume. - **Drill in**: Click the Integration Link in the table to navigate directly to the integration. From there, you can tune the monitor, update the event rule, or re-enable a misconfigured service. - **Export for further analysis**: Use Export CSV to pull the table into a spreadsheet or BI tool.
--- URL: https://docs.pagerduty.com/incident-management/analytics/insights # Insights Analyze incident metrics, track team performance, and optimize operational efficiency Insights provide leadership teams with powerful analytics capabilities to measure and improve operational performance across their organization. Through comprehensive dashboards showing historical incident data, response metrics, and team performance indicators, leaders can identify trends, optimize processes, and make data-driven decisions to enhance service reliability. > **Availability:** The following Insights reports are available on PD Reliability Platform plans. They're also available on these pricing plans: Professional, Business, Digital Operations (legacy), and Enterprise for Incident Management. > > - [Incident Activity](/incident-management/analytics/insights/incident-activity) > - [Service Performance](/incident-management/analytics/insights/service-performance) > - [Responder](/incident-management/analytics/insights/responder) > - [Team](/incident-management/analytics/insights/team) > - [Escalation Policy](/incident-management/analytics/insights/escalation-policy-insights) > > The [Business Impact](/incident-management/analytics/insights/business-impact) report is available on the following pricing plans: Digital Operations (legacy) and Enterprise for Incident Management. > > Contact the [Sales team](https://www.pagerduty.com/contact-us/#contact-sales) to upgrade your pricing plan. ## View Insights You can find Insights in the PagerDuty web app's menu under **Analytics** → **Insights**. Insights includes the following reports: - [Incident Activity](/incident-management/analytics/insights/incident-activity) - [Service Performance](/incident-management/analytics/insights/service-performance) - [Responder](/incident-management/analytics/insights/responder) - [Team](/incident-management/analytics/insights/team) - [Escalation Policy](/incident-management/analytics/insights/escalation-policy-insights) - [Business Impact](/incident-management/analytics/insights/business-impact) - [Insights Filters](/incident-management/analytics/insights/insights-filters) > **Data Update Schedule:** Data is updated according to pipeline processing cycles and is typically available within 24 hours. Check the timestamp in the upper-right corner of the page to see when the report was last updated.
--- URL: https://docs.pagerduty.com/incident-management/analytics/insights/business-impact # Business Impact Insights See estimated response costs per service alongside uptime, MTTR, and MTTA data to gauge the business impact of incidents. The Business Impact report provides insights into how much services cost over time. It also includes a Services List with metrics such as response effort (incident duration), uptime percentage, MTTR, and MTTA. To view the Business Impact report, navigate to **Analytics** → **Insights** → **Business Impact** tab. 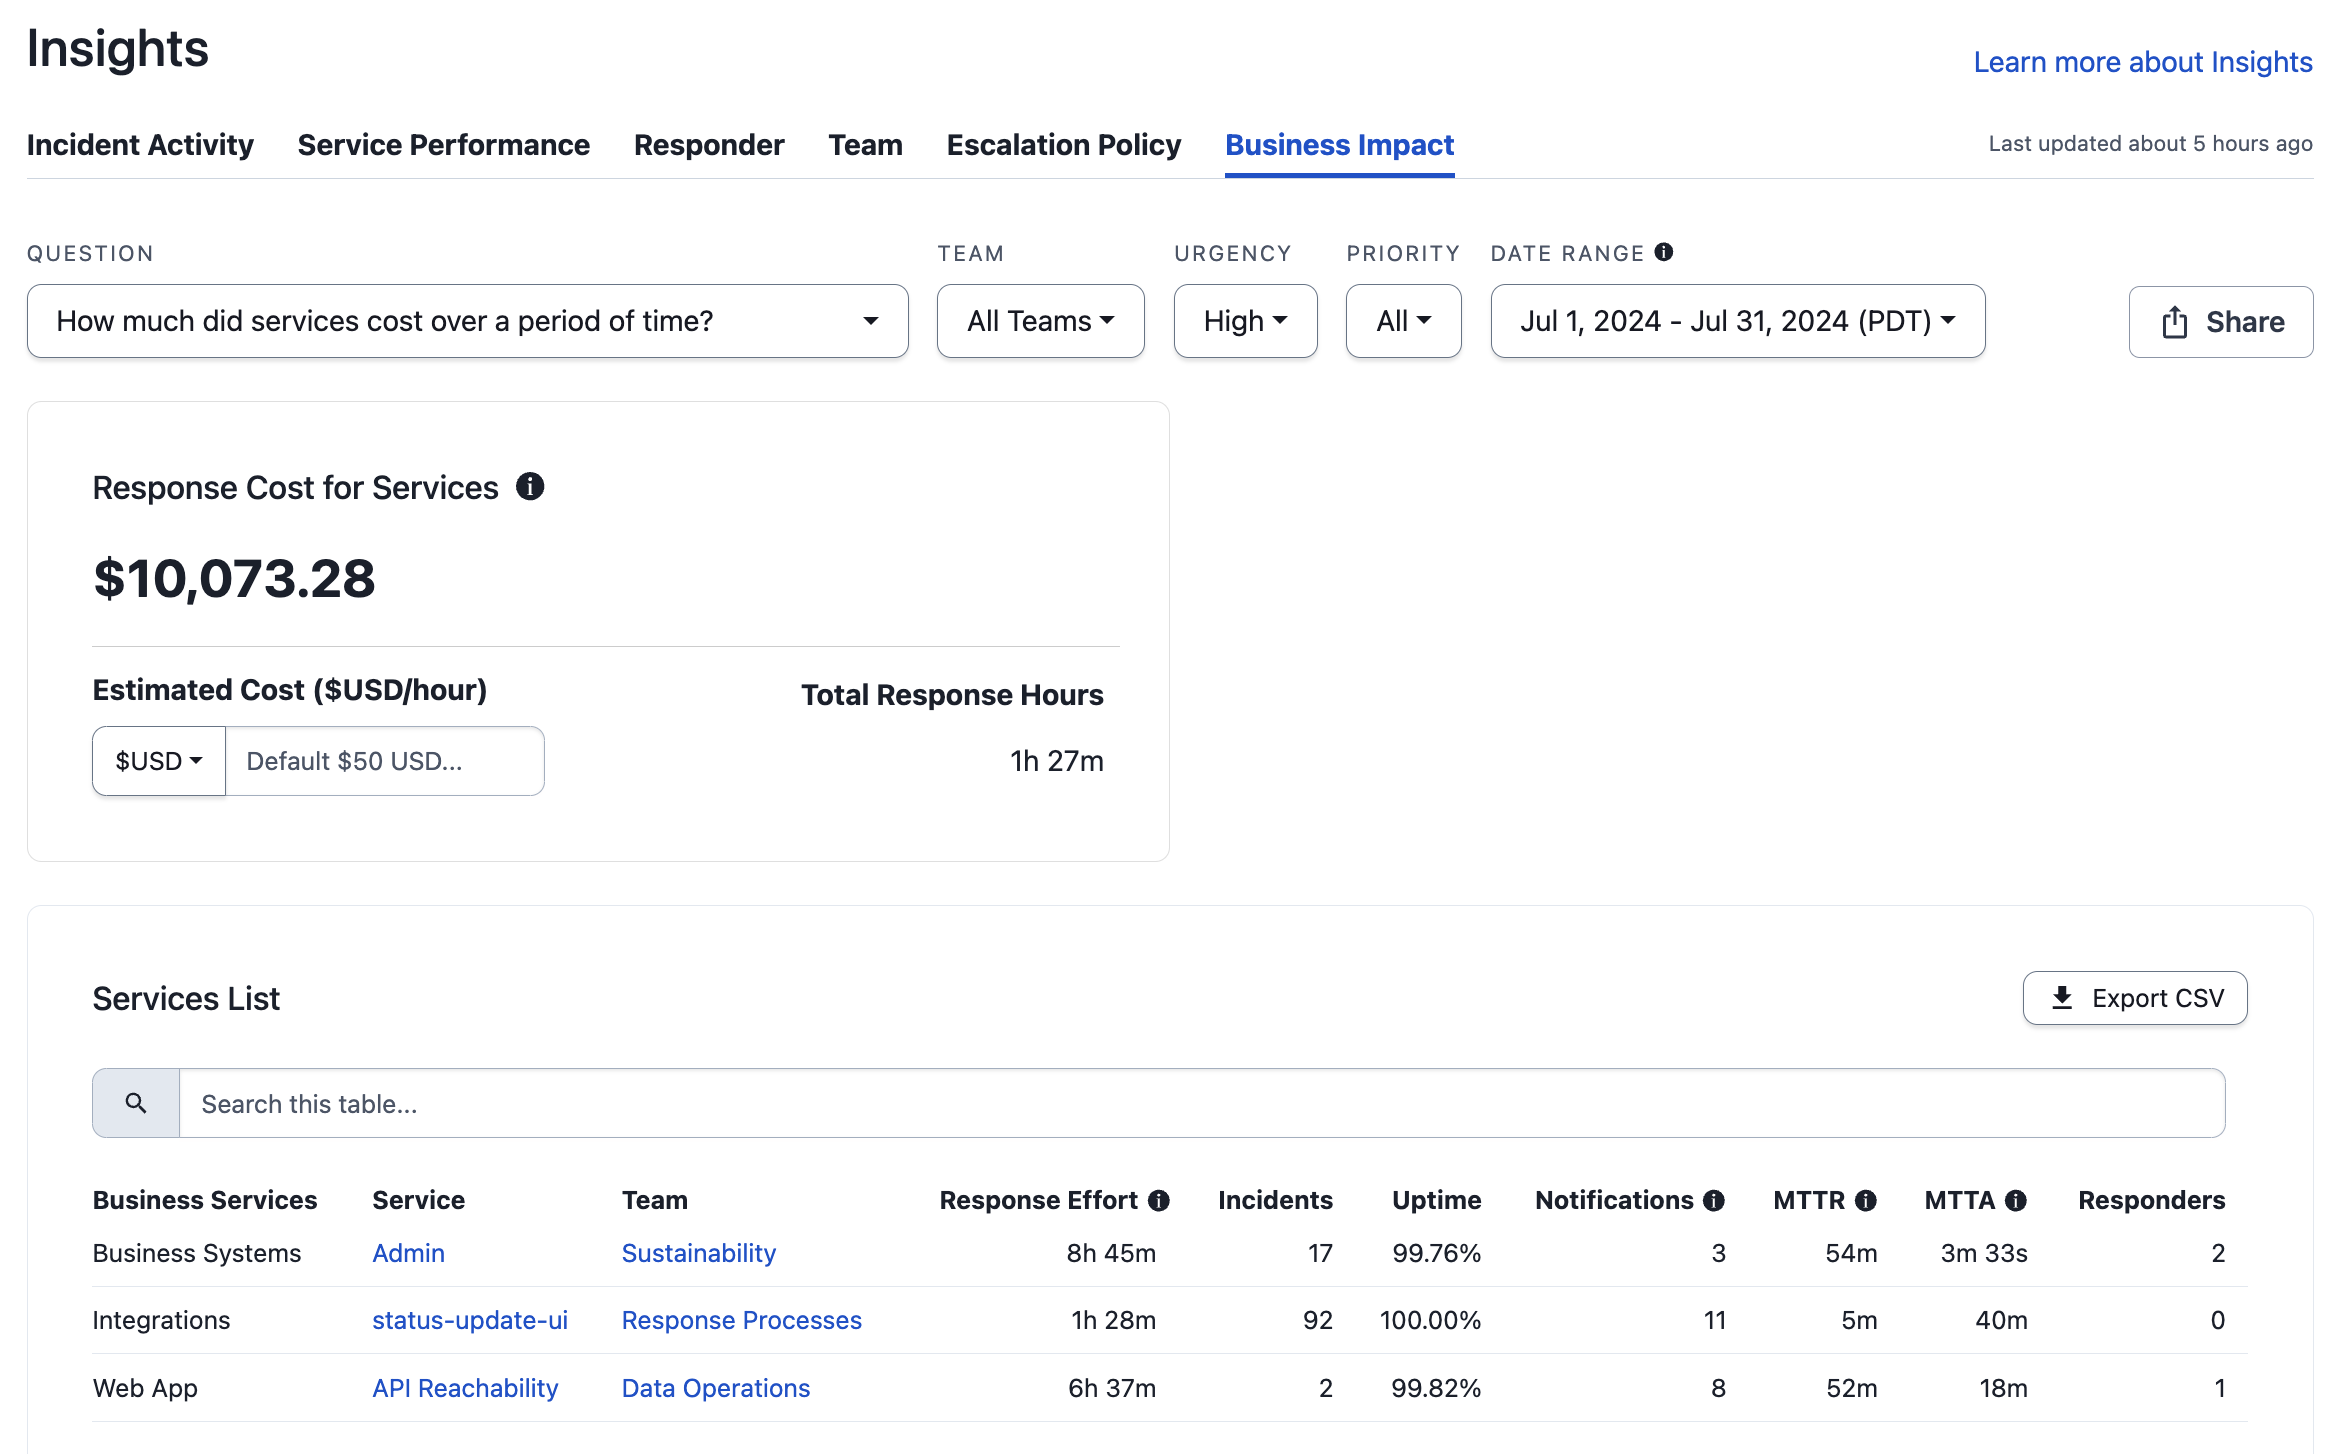 *Business Impact Report* ## Filter and Search Business Impact > **Filter Options and Limits:** Each report has the following filter limits: > > - Service, Responder, and Escalation Policy Filters: 1000 > - Team Filter: 200 ## Response Cost for Services The Business Impact tab provides you with insights on the estimated response cost for your selected Teams and services. By default, the estimated cost per responder hour is set to $50. If you would like to change your estimated cost per responder hour, you can enter that in the **Estimated Cost ($/hour)** field and a new total value is calculated based on that cost and the **Total Response Hours**.  *Response Cost for Services Estimate* ## Services List Table Below the Response Cost for Services table you see the **Services List** data specific to the filters you have selected. You may perform the following actions with this table: - **Search**: Use the search field to search for specific data. - **Sort**: Click on a column header to sort results. You can also sort with multiple columns by holding down the shift key while clicking on both of the columns. - **Drill Down**: Click a service or a Team in the **Service** or **Team** columns to view more information about each. The available Services List columns are: | Column Name | Description | | :----------------------------- | :---------------------------------------------------------------------------------------------------------------------------------------------------------------------------------------------------------------------------------------------------------------------------------------------------------------------------------------------- | | **Business Services** | The Business Service(s) mapped to each service. | | **Service** | The service name. | | **Team** | The Team each service belongs to. Teams allow users to group and control user access to associated PagerDuty objects, such as escalation policies, users, schedules, and services. | | **Response Effort** | The total engaged time across all responders, measured from the time a responder acknowledges or accepts a responder request until the incident is resolved. | | **Incidents** | The total count of incidents that occurred on the service within the specified time period. | | **Uptime** | The inverse of the time (in %) during which the service had an active [major incident](/incident-management/analytics/operational-reviews#major-incidents). A major incident is defined as the top two levels of your [priority](/incident-management/incidents/incident-priority) settings, or if [multiple responders are added](/incident-management/incidents/add-responders#add-responders-to-an-incident) and acknowledge. | | **Notifications** | The total count of incident notifications sent via push, email, phone call, and SMS. | | **MTTR** | The average time from when an incident was created until it was resolved. | | **MTTA** | The average time between when an incident is first assigned to a user and when the incident is first acknowledged by that user. Reassign, resolve, and escalation actions do not imply acknowledgement. | | **Average Engaged Responders** | The average number of responders engaged in an incident. | By default, the Services List displays 10 results at a time. Use the dropdown below the table to select from 10, 20, 30, 40, or 50 results per page. If there are more results than the selected dropdown value, you can use the arrows (i.e., , , , ) to navigate through results. ### Share the Business Impact Report Read [Share a Report](/incident-management/analytics/insights/insights-filters#share-a-report) below for more information on sharing or exporting the report. --- URL: https://docs.pagerduty.com/incident-management/analytics/insights/escalation-policy-insights # Escalation Policy Insights Compare incident volume, escalation counts, MTTA, and MTTR across your escalation policies to spot response handling issues. The Escalation Policy report allows teams to view the complexity of an incident through the history of its escalation policy, providing a deeper understanding of how incidents are handled. Users are more equipped to make Escalation Policies and Schedule changes by understanding the performance of their Escalation Policies. It also includes an Escalation Policy List with metrics such as Incidents, MTTA, MTTR, and Escalated Incidents. To view the Escalation Policy report, navigate to **Analytics** → **Insights** and select the **Escalation Policy** tab.  *Escalation Policy report* ## Filter and Search Escalation Policy > **Filter Options and Limits:** Each report has the following filter limits: > > - Service, Responder, and Escalation Policy Filters: 1000 > - Team Filter: 200 ## Summary Metric Cards Each card includes a comparison time period. For example, if you select the time period **Last 7 Days**, the cards show you the change in each metric compared to the week prior. | Metric | Description | | :------------------------- | :---------------------------------------------------------------------------------------------------------------------------------------------------------------------------------------------------------------------------- | | **Total Incidents** | Total count of incidents matching the provided filters. | | **Total Escalations** | Total number of escalations on all incidents. | | **Escalation Policy MTTA** | Mean Time to Acknowledge across escalation policies — the average amount of time from when an incident is created until the time the first responder acknowledges an incident. Excludes incidents that were not acknowledged. | | **Escalation Policy MTTR** | Mean time to resolve across escalation policies — the average amount of time from when an incident was created until it was resolved. Excludes incidents that have not been resolved. | ## Data Visualizations You can change the dropdown at the top left to select one of following visualizations: | Visualization | Description | | :-------------------- | :--------------------------------------------------------- | | **Incident Volume** | Number of incidents per escalation policy. | | **Escalation Volume** | Number of escalations per escalation policy. | | **MTTA** | Mean time to acknowledge in seconds per escalation policy. | | **MTTR** | Mean time to resolve in hours per escalation policy. | ## Escalation Policy List Below the data visualization you see the Escalation Policy List data specific to the filters you have selected. You may perform the following actions with this table: - **Search**: Use the search field to search for specific data. - **Sort**: Click on a column header to sort results. You can also sort with multiple columns by holding down the shift key while clicking on both of the columns. The graph above does not change if you sort the data. - **Drill Down**: Click an Escalation Policy, incident count, or acknowledged count in the Escalation Policy, Incidents, or Acknowledged columns to view more information about each. To customize the columns you would like to view, click the **Columns** icon and select your preferred data. The available Escalation Policy List columns are: | Column Name | Description | | :------------------------------- | :---------------------------------------------------------------------------------------------------------------------------------------------------------------------------------------------------------------------------------------------------------------------------------------------------------------------------------------------------------------------------------- | | **Escalation Policy** | The escalation policy name. | | **Team** | The Team name. | | **Incidents** | The total count of incidents that the Escalation Policy experienced with the specified time period. | | **Acknowledged Incidents** | The total count of assigned incidents acknowledged by the Team. Only explicit incident acknowledgment counts; reassign, resolve, and escalation actions do not imply acknowledgement. Acknowledgements by added responders are excluded from this metric. | | **MTTA** | The average time for the first assigned user to acknowledge an incident. Reassign, resolve, and escalation actions do not imply acknowledgement. | | **MTTR** | The average time from when an incident was created until it was resolved. | | **Response Effort** | The total engaged time across all responders, measured from the time a responder acknowledges or accepts a responder request until the incident is resolved. Response Effort of resolved incidents can be [edited on an incident's details page](/incident-management/incidents/edit-incidents#edit-incident-duration). Edited values are marked with an asterisk (`*`). | | **Total Escalations** | The total amount of escalations that occurred for the incidents on this escalation policy. | | **Escalated Incidents** | The total number of incidents that were escalated. | | **Escalation Policy ID** | The escalation policy ID (e.g., `PXXXXXX`). | | **Auto Resolved Incidents** | Total count of incidents that resolved automatically (i.e., not by a human). | | **MTTE** | The average time for assigned second, third, and nth responders to acknowledge an incident. It is similar to MTTA, but used only for subsequent escalations after the first assigned user does not respond. | | **MTTM** | The time between start of an incident, and the last additional responder to acknowledge. | | **Average Engaged Responders** | The average number of responders who engaged with incidents on this escalation policy. | | **Total Engaged Responders** | The total number of responders who engaged with incidents on the escalation policy. | | **Timeout Escalated Incidents** | Total count of incidents that had timeout escalations that occurred on this escalation policy. | | **Manually Escalated Incidents** | Total count of incidents that had manual escalations on this escalation policy. | | **Reassigned Incidents** | The total count of a user's assigned incidents that were manually reassigned to a user who is not on the original escalation policy, or to another escalation policy. | | **Interruptions** | Interruptions are when an on-call responder receives a mobile push, phone call, or SMS (text) notification. Notifications sent from various channels (push, phone, SMS) to the same destination are counted as one interruption. Notifications that arrive within 60 seconds of each other are counted as a single interruption. Email notifications are excluded from this metric. | | **Business Hour Interruptions** | Interruptions that happened on weekdays between 8 a.m. and 6 p.m.\* | | **Off Hour Interruptions** | Interruptions that happened on weekdays between 6 p.m. and 10 p.m., or on a weekend between 8 a.m. and 10 p.m.\* | | **Sleep Hour Interruptions** | Interruptions that happened any day of the week between 9 p.m. and 8 a.m.\* | | **Total Snoozed Seconds** | Total seconds the incident was [snoozed](/incident-management/incidents/edit-incidents#snooze-an-incident). | \* _Times are given in the [user's configured timezone](/account-admin/time-zone-settings#change-the-user-level-time-zone). If they have not configured a time zone, the report uses the [account's time zone](/account-admin/time-zone-settings#change-the-account-level-time-zone)._ By default, the Escalation Policy List displays 10 results at a time. Use the dropdown below the table to select from 10, 20, 30, 40, or 50 results per page. If there are more results than the selected dropdown value, you can use the arrows (i.e., , , , ) to navigate through results. ### Share the Escalation Policy Report Read [Share a Report](/incident-management/analytics/insights/insights-filters#share-a-report) for more information on sharing or exporting the report. --- URL: https://docs.pagerduty.com/incident-management/analytics/insights/incident-activity # Incident Activity Insights Review response effort, time to acknowledge, time to resolve, and escalation counts for individual incidents in a filterable, exportable list. The Incident Activity insights report offers a visualization of response effort over time. It also includes an Incidents List with metrics including TTA, responder count, TTE, response effort, TTR, and escalation count. > **Deleted Services:** Incidents that belong to a deleted service will not appear in the Incident Activity insights report. ## View Incident Activity Insights To view the Incident Activity insights report, navigate to **Analytics** → **Insights** and select the **Incident Activity** tab.  *Incident Activity report* ### Filter Insights You can apply filters to each insights report by clicking at the top of the page next to the date range dropdown. This will open an editor where you can add, edit and remove filters. > **Team Filtering Behavior:** Team filter results may vary between the Incidents list and Insights reports because each view evaluates Team associations differently. The Incidents list tracks every Team an incident has been associated with throughout its lifecycle; Insights and Analytics filter strictly by the Team currently associated with the incident’s service at report time. If a service was reassigned to a different Team after an incident triggered, the incident may appear under its original Team in the Incidents list but under the new Team in Insights. This is expected behavior. ### Add Filters 1. Select a **Date Range** from the dropdown at the top of the page. 2. Click the icon to the right of the date range dropdown. 3. Click **Add**.
| Filter Condition Type | Operators | Value Instructions |
|---|---|---|
| Escalation Policies | - is in | Select **escalation policy(ies)** |
| Incident ID |
- is in - is not in |
Enter an **incident ID** |
| Priority | - is in | Select the **priority level(s)** |
| Services | - is in | Select **service(s)** |
| Status |
- is in - is not in |
Select the **incident status(es)** |
| Teams | - is in | Select the **My Teams** tab to only see your Teams, or the **Teams** tab to see all Teams. Then select **Team(s)**. See the note about **Teams Filter Behavior** above for more information. |
| Urgency | - equals | Select the **urgency level** |
|
**If you have configured [Custom Fields](/incident-management/incidents/custom-fields-on-incidents)**: `CUSTOM-FIELD-DISPLAY-NAME` (Incident Custom Fields) |
**Varies based on [custom field type](/incident-management/incidents/custom-fields-on-incidents#field-types)**: **Text**: equals; does not equal; contains **Single Select**: is in; is not in **Multiple Select**: equals; does not equal; contains **Tag**: equals; does not equal; contains **URL**: equals; does not equal; contains **Checkbox**: equals; does not equal **Date Time**: is greater than; is less than; is greater than or equals; is less than or equals **Decimal**: equal; does not equal; is greater than; is less than; is greater than or equals; is less than or equals **Integer**: equals; does not equal; is greater than; is less than; is greater than or equals; is less than or equals |
**Varies based on [custom field type](/incident-management/incidents/custom-fields-on-incidents#field-types)**: **Text**: Enter a text value. **Single Select**: Select a single value. **Multiple Select**: Enter multiple values. **Tag**: Enter a tag name value. **URL**: Enter a URL value. **Checkbox**: Select a True or False value for the checkbox. **Date Time**: Select date and time values. **Decimal**: Enter a decimal value. **Integer**: Enter an integer value. |
## Summary Metric Cards Each card includes a comparison time period. For example, if your selected time period is the last week, the cards show you the change in each metric compared to the week prior. | Metric | Description | | :------------------------ | :-------------------------------------------------------------------------------------------------------------------------------------------------------------------------------------------------------------------------------------------------------------------------------------------------------------------------------------------------------- | | **Total Incidents** | Total count of incidents matching the active filters. | | **Total Response Effort** | Total time responders spent engaged in resolving incidents. Measured from the time a responder acknowledges or accepts a responder request until the incident is resolved. The user-defined incident duration, if it exists, is used for this calculation. Read [Edit Incident Duration](/incident-management/incidents/edit-incidents#edit-incident-duration) for more information. | | **MTTA** | MTTA is the average amount of time from when an incident is created until the time the first responder acknowledges an incident. Excludes incidents that were not acknowledged. | | **MTTR** | MTTR is the average amount of time from when an incident was created until it was resolved. Excludes incidents that have not been resolved. | > **Percentiles:** By default, the MTTA and MTTR graphs display the **Overall Mean** value. For a more granular look at your incident data, you can select **95th Percentile**, **90th Percentile**, **75th Percentile**, and **Median**. > >  *Percentiles in the MTTA graph* ## Data Visualizations You can change the dropdown at the top left to select one of following visualizations: | Visualization | Description | | :------------------ | :---------------------------------------------------------------------------------------------------------------------------------------------------------------------------------------------- | | **Incident Volume** | Number of incidents. | | **Response Effort** | Number of hours. The user-defined incident duration, if it exists, is used for this calculation. Read [Edit Incident Duration](/incident-management/incidents/edit-incidents#edit-incident-duration) for more information. | | **MTTA** | Mean time to acknowledge in seconds. | | **MTTR** | Mean time to resolve in hours. | ## Incidents List Below the data visualization you see the Incidents List data specific to the filters you have selected. You may perform the following actions with this table: - **Search**: Use the search field to search for specific data. - **Sort**: Click on a column header to sort results. You can also sort with multiple columns by holding down the shift key while clicking on both of the columns. The graph above does not change if you sort the data. - **Drill Down**: Click to the left of an incident number to drill down into responder details such as responder status, type of assignment, request and response timestamps, and time to respond. Click an incident number or service name in the Number and Service columns to view more information about those incidents or services. To customize the columns you would like to view, click the **Columns** icon and select your preferred data. The available Incidents List columns are: | Column Name | Description | | :------------------------------- | :---------------------------------------------------------------------------------------------------------------------------------------------------------------------------------------------------------------------------------------------------------------------------------------------------------------------------------------------------------------------------------- | | **Number** | Incident number. | | **Incident Type** | An incident's [Incident Type](/incident-management/incidents/incident-types). | | **Title** | Incident title. | | **Urgency** | An incident's [urgency](/incident-management/services/configurable-service-settings#notification-urgency) level. | | **Priority** | An incident's [priority](/incident-management/incidents/incident-priority) level. | | **Service** | The service where the incident triggered. | | **Created at** | The date and timestamp when the incident was triggered. | | **Resolved by** | The responder who resolved the incident. | | **Auto Resolved** | Whether or not the incident [resolved automatically](/incident-management/services/configurable-service-settings#auto-resolution), either via an integration or in PagerDuty. | | **Responders** | The total number of responders who engaged with the incident. | | **TTA** | The amount of time between incident creation and when the first responder acknowledged the incident. | | **TTR** | The time from incident creation to when it was resolved. | | **Response Effort** | The total engaged time across all responders, measured from the time a responder acknowledges or accepts a responder request until the incident is resolved. Response Effort of resolved incidents can be [edited on an incident's details page](/incident-management/incidents/edit-incidents#edit-incident-duration). Edited values are marked with an asterisk (`*`). | | **Escalations** | The total count of escalations. | | **Incident ID** | Incident ID (e.g., `PXXXXXX`). | | **Status** | The incident's status: **Triggered**, **Acknowledged**, or **Resolved**. | | **Service ID** | The service's ID (e.g., `PXXXXXX`). | | **Team** | The name of the [Team](/account-admin/teams) associated with an incident.
This may differ from the team shown in the main Incidents list if the incident's service or escalation policy has been reassigned to a different team since the incident was triggered. | | **Team ID** | The Team's ID (e.g., `PXXXXXX`). | | **Escalation Policy** | The escalation policy's name. | | **Escalation Policy ID** | The escalation policy's ID (e.g., `PXXXXXX`). | | **Assigned User IDs** | The User IDs of the users assigned to the incident. | | **Assigned Users** | The users who were assigned to the incident, including through reassignment or escalation. This list is not in the order of assignments. | | **Acknowledged User IDs** | The User IDs of the users who acknowledged the incident. | | **Acknowledged Users** | Users who acknowledged the incident. This list is not in the order of assignments. | | **Joined User IDs** | The User IDs of the users who joined the incident. | | **Joined Users** | Users who joined the incident, either by acknowledging it or accepting a responder request. | | **Resolved at** | The date and timestamp when the incident was resolved. | | **Resolved by User ID** | The User ID of the user who resolved the incident. | | **Active Responders** | The total number of users who either acknowledged the incident or accepted a responder request in it. | | **TTE** | The time from first responder engagement to last responder engagement. | | **TTM** | The time between the start of an incident and the time the last additional responder acknowledges. For incidents with one or no engaged users, this value is `null`. | | **User Defined Response Effort** | The total engaged time across all responders, as edited by the user in the [incident details page](/incident-management/incidents/edit-incidents#edit-incident-duration). | | **Assignments** | The number of times the incident was assigned. | | **Reassignments** | The number of times the incident was reassigned to another user. | | **Acknowledgements** | The total number of acknowledgements in the incident. | | **Timeout Escalations** | Count of escalations as a result of no acknowledgement from the primary on-call responder. | | **Manual Escalations** | Count of manual triggered escalations. | | **Notifications** | The total count of incident notifications sent via push, phone call, email, and SMS. | | **Interruptions** | Interruptions are when an on-call responder receives a mobile push, phone call, or SMS (text) notification. Notifications sent from various channels (push, phone, SMS) to the same destination are counted as one interruption. Notifications that arrive within 60 seconds of each other are counted as a single interruption. Email notifications are excluded from this metric. | | **Business Hour Interruptions** | Interruptions that happened on weekdays between 8 a.m. and 6 p.m.\* | | **Off Hour Interruptions** | Interruptions that happened on weekdays between 6 p.m. and 10 p.m., or on a weekend between 8 a.m. and 10 p.m.\* | | **Sleep Hour Interruptions** | Interruptions that happened any day of the week between 9 p.m. and 8 a.m.\* | | **Total Snoozed Seconds** | Total seconds the incident was [snoozed](/incident-management/incidents/edit-incidents#snooze-an-incident). | | **Custom Fields** | You can add any of your [Custom Fields](/incident-management/incidents/custom-fields-on-incidents) as a column. | \* _Times are given in the [user's configured timezone](/account-admin/time-zone-settings#change-the-user-level-time-zone). If they have not configured a time zone, the report uses the [account's time zone](/account-admin/time-zone-settings#change-the-account-level-time-zone)._ By default, the Incidents List displays 10 results at a time. Use the dropdown below the table to select from 10, 20, 30, 40, or 50 results per page. If there are more results than the selected dropdown value, you can use the arrows (i.e., , , , ) to navigate through results. > **Analytics Email Settings:** Please see our [Account Settings](/account-admin/account-settings) article for more information on how Admins can configure who receives weekly Analytics emails.
--- URL: https://docs.pagerduty.com/incident-management/analytics/insights/insights-filters # Insights Filters Configure, save, and share the filters that narrow Insights reports by team, service, priority, status, and custom field. Filters allow you to refine Insights data about incidents, services, escalation policies, teams, and custom fields. Apply filters to each report by clicking at the top of the page next to the date range dropdown. This opens an editor where you can add, edit, and remove filters. > **Note:** Insights filters do not support Unicode characters. ## Add Filters > **Filtering Teams:** - When you add a Teams filter, results for subsequently added filter values change to reflect objects associated with the selected team or teams. **Example**: If you add a Teams filter to return results for Team A and then add a Services filter, you can only select services associated with Team A. > - If you add a Teams filter after adding another filter with a value not associated with that team, the Teams filter removes the value for the previous filter. **Example**: If you add a Services filter for Service B and then add a Teams filter for Team A (not associated with Service B), it removes Service B from the Services filter value.  *Example of service filter removed by team selection* To add filters: 1. Select a **Date Range** from the dropdown at the top of the page. 2. Click to the right of the date range dropdown. 3. Click **Add**. The following filters are available per report: - [Incident Activity Filters](#incident-activity-filters) - [Service Performance Filters](#service-performance-filters) - [Responder Filters](#responder-filters) - [Team Filters](#team-filters) - [Escalation Policy Filters](#escalation-policy-filters) - [Business Impact Filters](#business-impact-filters) 4. Click **Apply Filters** in the bottom right of the editor. ### Incident Activity Filters | Filter Condition Type | Operators | Value Instructions | | :----------------------------------------------------------------------------------------------------------------------------------- | :------------------------------------------------------------------------------------------------------------------------------------------------------------------------------------------------------------------------------------------------------------------------------------------------------------------------------------------------------------------------------------------------------------------------------------------------------------------------------------------------------------------------------------------------------------------------------------------------------------------------------------------------------------------------------------------------------------------------------------------------------------------------------------------------------------------------------------------------------------ | :------------------------------------------------------------------------------------------------------------------------------------------------------------------------------------------------------------------------------------------------------------------------------------------------------------------------------------------------------------------------------------------------------------------------------------------------ | | Escalation Policies | - is in | Select **escalation policy(ies)**. | | Incident ID | - is in
- is not in | Enter an **incident ID**. | | Priority | - is in | Select the **priority level(s)**. | | Services | - is in | Select **service(s)**. | | Status | - is in
- is not in | Select the **incident status(es)**. | | Teams | - is in | Select the **My Teams** tab to see only your teams, or the **Teams** tab to see all teams. Then select the desired **team(s)**. See [Filtering Teams](#add-filters) for more information. | | Urgency | - equals | Select the **urgency level**. | | `CUSTOM-FIELD-DISPLAY-NAME-HERE` _(Incident Custom Fields — if you have configured [Custom Fields](/incident-management/incidents/custom-fields-on-incidents))_ | **Text**: - equals
- does not equal
- contains
**Single Select**: - is in
- is not in
**Multiple Select**: - equals
- does not equal
- contains
**Tag**: - equals
- does not equal
- contains
**URL**: - equals
- does not equal
- contains
**Checkbox**: - equals
- does not equal
**Date Time**: - is greater than
- is less than
- is greater than or equals
- is less than or equals
**Decimal**: - equals
- does not equal
- is greater than
- is less than
- is greater than or equals
- is less than or equals
**Integer**: - equals
- does not equal
- is greater than
- is less than
- is greater than or equals
- is less than or equals | **Text**: Enter a text value.
**Single Select**: Select a single value.
**Multiple Select**: Enter multiple values.
**Tag**: Enter a tag name value.
**URL**: Enter a URL value.
**Checkbox**: Select a **True** or **False** value.
**Date Time**: Select date and time values.
**Decimal**: Enter a decimal value.
**Integer**: Enter an integer value. | ### Service Performance Filters | Filter Condition Type | Operators | Value Instructions | | :-------------------- | :-------- | :---------------------------------------------------------------------------------------------------------------------------------------------------------------------------------------- | | Priority | - is in | Select the **priority level(s)**. | | Services | - is in | Select **service(s)**. | | Teams | - is in | Select the **My Teams** tab to see only your teams, or the **Teams** tab to see all teams. Then select the desired **team(s)**. See [Filtering Teams](#add-filters) for more information. | | Urgency | - equals | Select the **urgency level**. | ### Responder Filters | Filter Condition Type | Operators | Value Instructions | | :-------------------- | :-------- | :---------------------------------------------------------------------------------------------------------------------------------------------------------------------------------------- | | Priority | - is in | Select the **priority level(s)**. | | Responder | - is in | Select **responder(s)**. | | Teams | - is in | Select the **My Teams** tab to see only your teams, or the **Teams** tab to see all teams. Then select the desired **team(s)**. See [Filtering Teams](#add-filters) for more information. | | Urgency | - equals | Select the **urgency level**. | ### Team Filters | Filter Condition Type | Operators | Value Instructions | | :-------------------- | :-------- | :---------------------------------------------------------------------------------------------------------------------------------------------------------------------------------------- | | Priority | - is in | Select the **priority level(s)**. | | Teams | - is in | Select the **My Teams** tab to see only your teams, or the **Teams** tab to see all teams. Then select the desired **team(s)**. See [Filtering Teams](#add-filters) for more information. | | Urgency | - equals | Select the **urgency level**. | ### Escalation Policy Filters | Filter Condition Type | Operators | Value Instructions | | :-------------------- | :-------- | :---------------------------------------------------------------------------------------------------------------------------------------------------------------------------------------- | | Escalation Policies | - is in | Select **escalation policy(ies)**. | | Priority | - is in | Select the **priority level(s)**. | | Teams | - is in | Select the **My Teams** tab to see only your teams, or the **Teams** tab to see all teams. Then select the desired **team(s)**. See [Filtering Teams](#add-filters) for more information. | | Urgency | - equals | Select the **urgency level**. | ### Business Impact Filters | Filter Condition Type | Operators | Value Instructions | | :-------------------- | :-------- | :---------------------------------------------------------------------------------------------------------------------------------------------------------------------------------------- | | Priority | - is in | Select the **priority level(s)**. | | Teams | - is in | Select the **My Teams** tab to see only your teams, or the **Teams** tab to see all teams. Then select the desired **team(s)**. See [Filtering Teams](#add-filters) for more information. | | Urgency | - equals | Select the **urgency level**. | ## Edit or Remove Filters 1. Click under the date range dropdown at the top of the page. 2. Edit the available filters, or click to the right of a filter to remove it. 3. Click **Apply Filters** in the bottom right of the editor. ## Saved Filters Saved Filters lets you save, name, and instantly reapply any filter configuration in your Insights **Incident Activity** dashboard. Instead of rebuilding filter states from scratch each time, you can store your most-used views, including smart relative date ranges like "last 30 days", and return to them in one click. > **Availability and Limits:** Saved Filters are available on legacy and PD Reliability Platform plans. This feature is only available in the Incident Activity section of Insights. > > - You can create up to 25 saved filters per user per report type. > - Saved filters are private by default and are visible only to the user who created them. ### Access Saved Filters Navigate to **Analytics** → **Insights** → **Incident Activity**. ### Save a Filter Configuration 1. Navigate to **Analytics** → **Insights** → **Incident Activity** and [add a filter](#add-filters). 2. Click **Apply Filters**. 3. Click **Save Filters**. 4. In the modal, enter the following details: | Field | Value | | :---------- | :-------------------------------------------------- | | Name | Enter a name for the saved filter. (Required) | | Description | Enter an optional description for the saved filter. | 5. Click **Save**. The saved filter appears in your filters list.  *Save filter modal* ### Apply a Saved Filter 1. Navigate to **Analytics** → **Insights** → **Incident Activity** and open the filters panel. 2. Click the **Saved Filters** dropdown and select a filter.  *Saved filters list* ### Manage Saved Filters #### Edit a Saved Filter 1. Click the **Saved Filters** dropdown and click next to the filter you want to update. 2. Click **Edit Saved Filter**. 3. Modify the name, description, or filter state, then click **Save** to overwrite the existing configuration. #### Delete a Saved Filter > **Deletion Is Permanent:** Deleting a saved filter cannot be undone. 1. Click the **Saved Filters** dropdown and click next to the filter you want to delete. 2. Click **Delete**. 3. Confirm the deletion when prompted. #### Share a Saved Filter via URL 1. Apply a saved filter to the dashboard. 2. Copy the URL from your browser. The URL encodes the full filter state and can be shared directly with others. ### Typical Workflows You can use saved filters to support the following workflows: - **Weekly Team Reviews**: Save a filter scoped to your team with a relative "last seven days" date range to open the data in one click without reconfiguring filters. - **Service Owner Deep Dives**: Create a saved filter per service to switch between ownership views. - **Migration Baseline**: Save filters that replicate your existing reporting views to establish parity from day one when migrating from other tools. - **Organization Reporting Preparation**: Save a broader organization-level filter used for weekly operations reviews so anyone preparing the report starts from a consistent state. ## Filter Limits Each report has the following filter limits: - **Service, Responder, and Escalation Policy Filters**: 1,000 - **Team Filter**: 200 When the count of filtered objects exceeds the limit, the list greys out and you can no longer select or deselect individual objects. Click **Clear** at the top of the filter list to reset your selections. If you expect to exceed the limit: 1. Use the **Team** filter first to reduce the number of escalation policies, services, or responders. 2. Once the list is below 1,000, deselect from there. ## Share a Report There are two ways to share Insights reports: - [Share Button](#share-button) - [Export CSV](#export-csv) ### Share Button To share a report or save a filter set, click **Share** → **Copy Link**. Send the URL to others or save it as a bookmark for your own reference. The link is unique, and signed-in users who visit it see the same report and filters applied.  *Share a report* ### Export CSV > **Export Size Limit:** Depending on your pricing plan, there is a limit to the number of rows you can export. > > If your exported report exactly matches the limit, your data has likely been truncated. Reference your report in the PagerDuty web app to see the total count (e.g., **Total Incidents**). Add filters or adjust the date range to reduce results, and export in batches as needed. > > | Pricing Plan | Export Limit | > | :------------------------------------------------------------------ | :----------- | > | **Professional**, **Business** | 100,000 rows | > | **Enterprise Incident Management**, **Digital Operations** (legacy) | 250,000 rows | To export a report as a `.csv` file, click **Export CSV**. The file retains the view and results based on your search and filter selections.  *Export CSV* Large reports — such as the Incident Activity Report, which can contain more than 10,000 rows — are fetched in the background and sent to you via email.  *Generating report* If you remain on the Insights page until the report is delivered, a success banner appears.  *Report generated* You can navigate away from the page while waiting, but no success banner appears in the PagerDuty web app when delivery is complete. Check your email to confirm receipt. Click the link in the success banner or email to view your report in `.csv` format. ## Analytics Email Settings Read the [Account Settings](/account-admin/account-settings#analytics-email-settings) article for more information on how Admins can configure who receives weekly Analytics emails. --- URL: https://docs.pagerduty.com/incident-management/analytics/insights/responder # Responder Insights Compare interruption counts, MTTA, and response effort across individual responders to spot on-call workload imbalances. The Responder report provides insights into incident impact on individual responders. It also includes a Responders List with metrics such as interruptions count, MTTA, and response effort (incident duration). To view the Responder report, navigate to **Analytics** → **Insights** and select the **Responder** tab.  *Responder report* > **Deleted Users:** Note that information related to deleted users will not appear in the Responder report. ## Filter and Search the Responder Report > **Filter Options and Limits:** Each report has the following filter limits: > > - Service, Responder, and Escalation Policy Filters: 1000 > - Team Filter: 200 ## Summary Metric Cards Each card includes a comparison time period. For example, if your selected time period is the last week, the cards show you the change in each metric compared to the week prior. | Metric | Description | | :-------------------------- | :---------------------------------------------------------------------------------------------------------------------------------------------------------------------------------------------------------------------------------------------------------------------------------------------------------------------------------------------------------------------------------- | | **Responder Incidents** | Total count of incidents that the selected responders were engaged in. Excludes incidents where deleted users were the only responders. | | **Responder Interruptions** | Interruptions are when an on-call responder receives a mobile push, phone call, or SMS (text) notification. Notifications sent from various channels (push, phone, SMS) to the same destination are counted as one interruption. Notifications that arrive within 60 seconds of each other are counted as a single interruption. Email notifications are excluded from this metric. | | **Total Response Effort** | Total time responders spent engaged in resolving incidents. Measured from the time a responder acknowledges or accepts a responder request until the incident is resolved. Excludes incidents where deleted users were the only responder. | | **Responder MTTA** | The average Mean Time to Acknowledge per active responder. Excludes incidents that were not acknowledged. | ## Data Visualizations You can change the dropdown at the top left to select one of following visualizations: | Visualization | Description | | :---------------------- | :------------------------------------------------- | | **Incident Volume** | Number of incidents per responder. | | **Interruption Volume** | Number of interruptions per responder. | | **Response Effort** | Number of hours per responder. | | **MTTA** | Mean time to acknowledge in minutes per responder. | ## Responders List Below the data visualization you see the Responders List data specific to the filters you have selected. You may perform the following actions with this table: - **Search**: Use the search field to search for a specific responder. - **Sort**: Click on a column header to sort results. You can also sort with multiple columns by holding down the shift key while clicking on both of the columns. The graph above does not change if you sort the data. - **Drill Down**: Click a responder, incident count, or acknowledged count in the Responder, Incidents, or Acknowledged columns to view more information about each. To customize the columns you would like to view, click the **Columns** icon and select your preferred data. The available Responders List columns are: | Column Name | Description | | :------------------------------- | :---------------------------------------------------------------------------------------------------------------------------------------------------------------------------------------------------------------------------------------------------------------------------------------------------------------------------------------------------------------------------------- | | **Responder** | Details the responder's name. | | **Incidents** | The total count of incidents that the responder was assigned to within the specified time period. | | **Acknowledged Incidents** | The percentage and the total number of incidents that were acknowledged on the service. Only explicit incident acknowledgments count; reassign, resolve, and escalation actions do not imply acknowledgement. Acknowledgements by added responders are excluded from this metric. | | **Interruptions** | Interruptions are when an on-call responder receives a mobile push, phone call, or SMS (text) notification. Notifications sent from various channels (push, phone, SMS) to the same destination are counted as one interruption. Notifications that arrive within 60 seconds of each other are counted as a single interruption. Email notifications are excluded from this metric. | | **Notifications** | The total count of incident notifications sent via push, phone call, email, and SMS. | | **MTTA** | The average time between when an incident is first assigned to a user and when the user first acknowledges the incident. Reassign, resolve, and escalation actions do not imply acknowledgement. | | **Response Effort** | The total engaged time of the responder, measured from the time a responder acknowledges or accepts a responder request, until the incident is resolved. | | **Timeout Escalated Incidents** | The total count of the user's assigned incidents that were escalated due to timeouts. | | **Manually Escalated Incidents** | The total count of the user's assigned incidents that were manually escalated away from a user without acknowledgement. | | **Responder ID** | The responder's User ID (e.g., `PXXXXXX`). | | **Team** | The Team each responder belongs to. [Teams](/account-admin/teams) allow users to group and control user access to associated PagerDuty objects, such as escalation policies, users, schedules, and services. | | **Time On-Call** | The total time that the responder was on any escalation policy. | | **Time On-Call EP Level 1** | The total time that the responder was on level 1 of any escalation policy. | | **Time On-Call EP Level 2+** | The total time that the responder was on levels 2 or higher of any escalation policy. | | **Business Hour Interruptions** | Interruptions that happened on weekdays between 8 a.m. and 6 p.m.\* | | **Off Hour Interruptions** | Interruptions that happened on weekdays between 6 p.m. and 10 p.m., or on a weekend between 8 a.m. and 10 p.m.\* | | **Sleep Hour Interruptions** | Interruptions that happened any day of the week between 9 p.m. and 8 a.m.\* | | **Reassigned Incidents** | The total count of a user's assigned incidents that were reassigned away from the user to another user or escalation policy. | \* _Times are given in the [user's configured timezone](/account-admin/time-zone-settings#change-the-user-level-time-zone). If they have not configured a time zone, the report uses the [account's time zone](/account-admin/time-zone-settings#change-the-account-level-time-zone)._ By default, the Responders List displays 10 results at a time. Use the dropdown below the table to select from 10, 20, 30, 40, or 50 results per page. If there are more results than the selected dropdown value, you can use the arrows (i.e., , , , ) to navigate through results. ### Share the Responder Report Read [Share a Report](/incident-management/analytics/insights/insights-filters#share-a-report) for more information on sharing or exporting the report. --- URL: https://docs.pagerduty.com/incident-management/analytics/insights/service-performance # Service Performance Insights Track incident volume, acknowledgement rate, MTTA, MTTR, and escalation counts broken down by individual service, sorted and filtered. The Service Performance Report offers a visualization of incident volume by service. It also includes a Services List with metrics including incident count, MTTA, acknowledgement rate, MTTR, response effort (incident duration), and escalation count. To view the Service Performance report, navigate to **Analytics** → **Insights** and select the **Service Performance** tab. 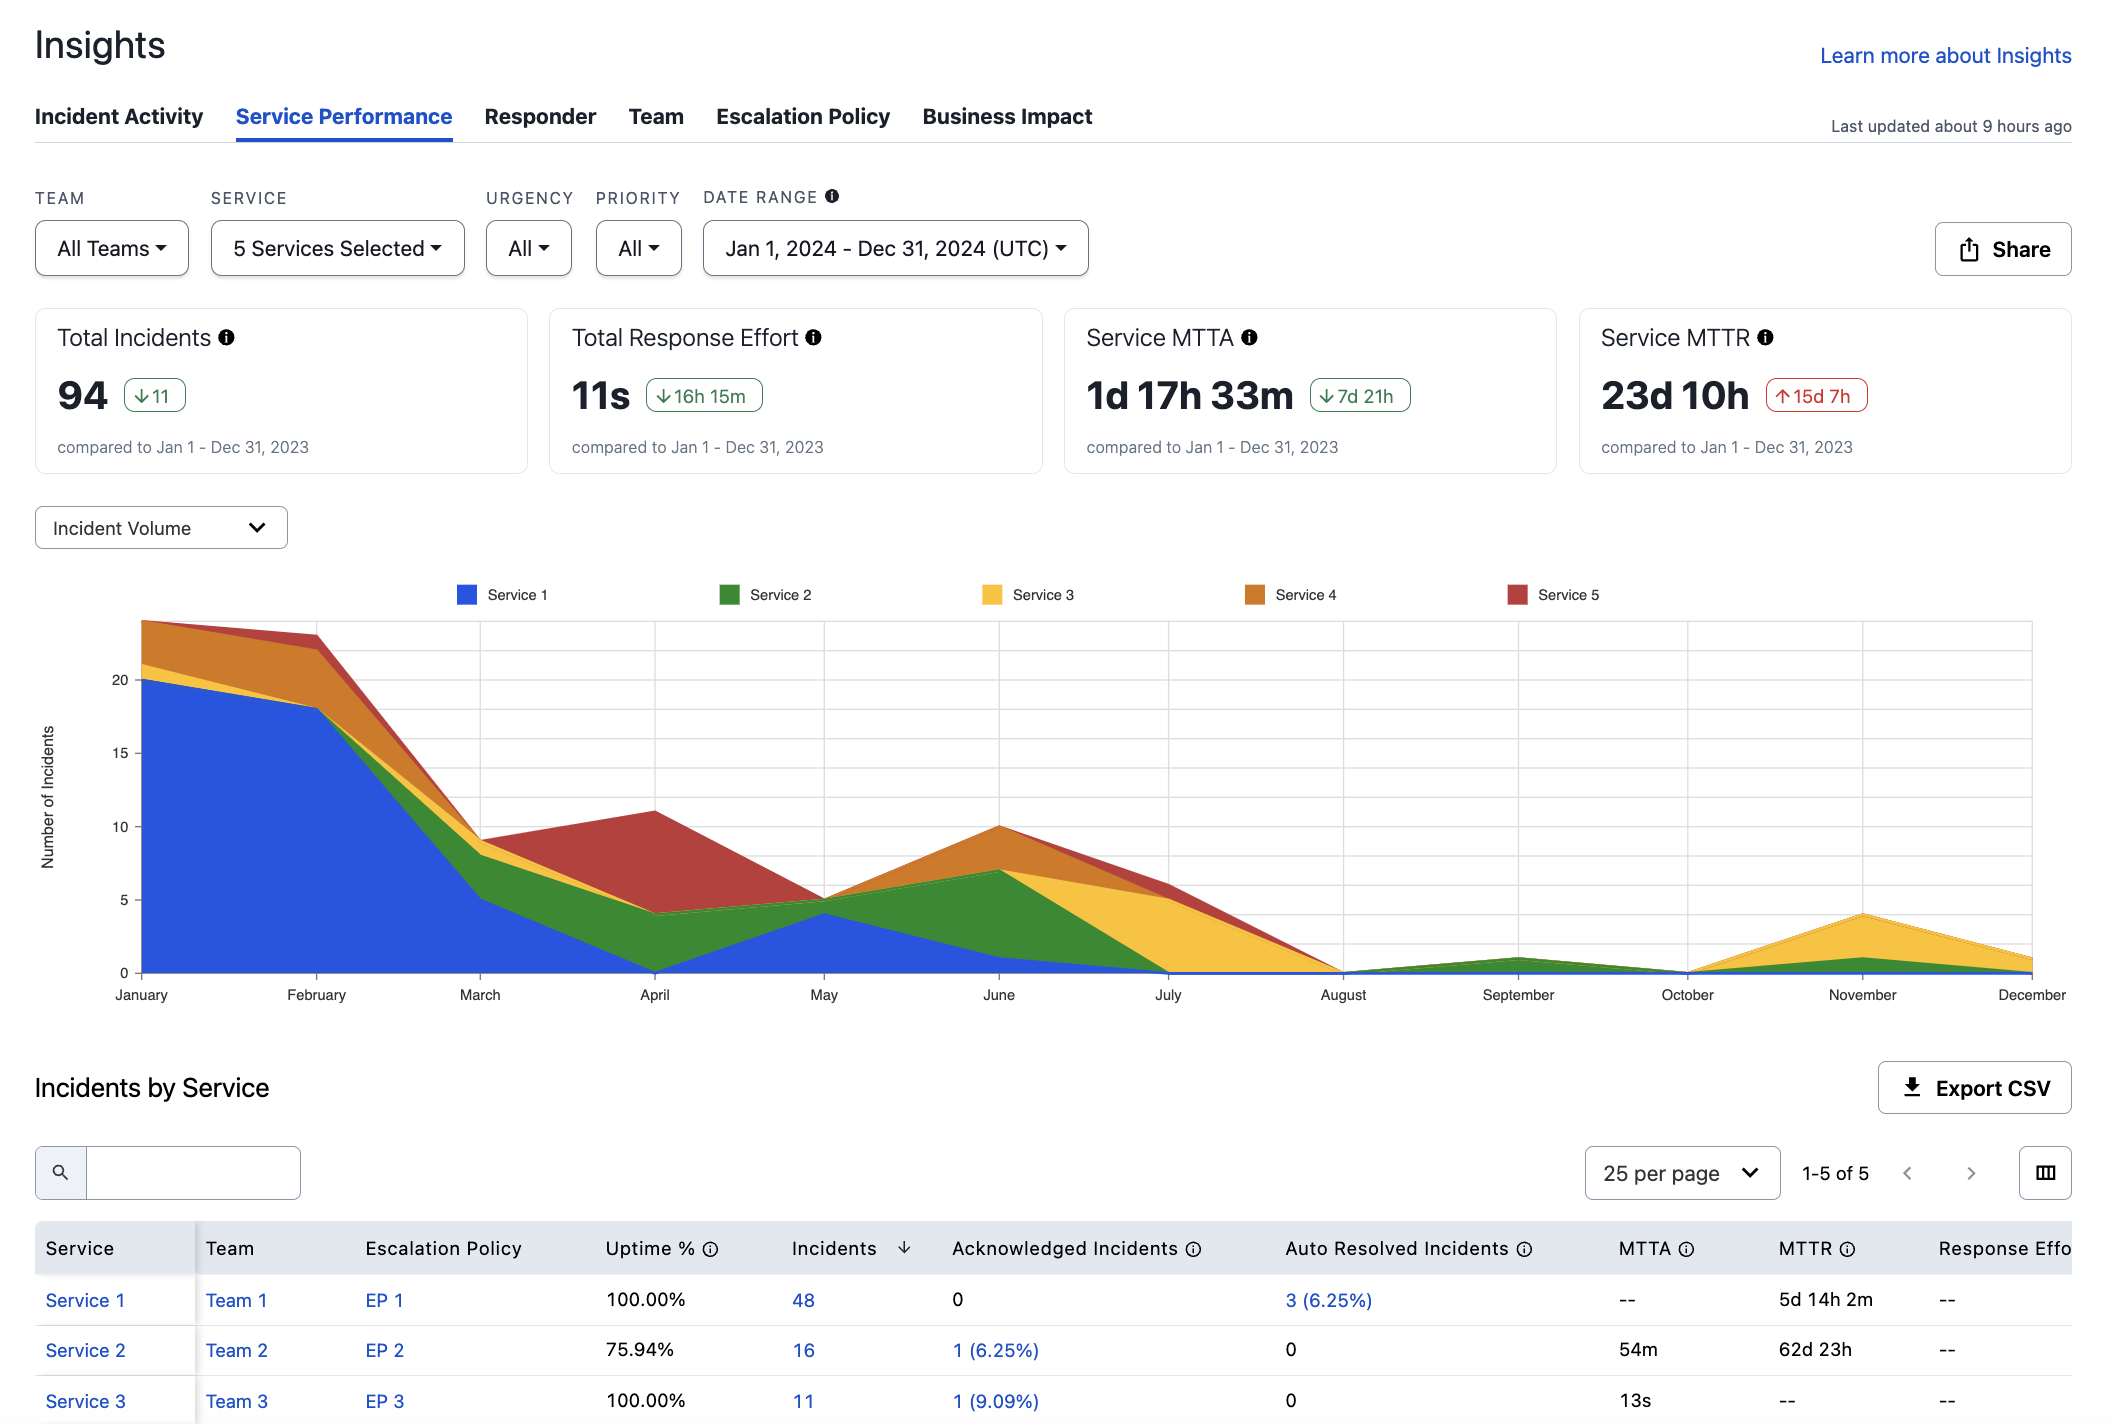 *Service Performance report* ## Filter and Search Service Performance > **Tip:** You can view up to ten services in the data visualization. If you select more than ten services, the extra services are collapsed into a single **+n more** line with a corresponding legend. > > If a selected service does not have any incidents in the selected date range, it does not appear in the data visualization or in the Services List. > **Filter Options and Limits:** Each report has the following filter limits: > > - Service, Responder, and Escalation Policy Filters: 1000 > - Team Filter: 200 ## Summary Metric Cards Each card includes a comparison time period. For example, if your selected time period is the last week, the cards show you the change in each metric compared to the week prior. | Metric | Description | | :------------------------ | :-------------------------------------------------------------------------------------------------------------------------------------------------------------------------------------------------------------------------------------------------------------------------------------------------------------------------------------------------------- | | **Total Incidents** | Total count of incidents matching the provided filters. | | **Total Response Effort** | Total time responders spent engaged in resolving incidents. Measured from the time a responder acknowledges or accepts a responder request until the incident is resolved. The user-defined incident duration, if it exists, is used for this calculation. Read [Edit Incident Duration](/incident-management/incidents/edit-incidents#edit-incident-duration) for more information. | | **Service MTTA** | Mean time to acknowledge across services: the average amount of time from when an incident is created until the time the first responder acknowledges an incident. Excludes incidents that were not acknowledged. | | **Service MTTR** | Mean time to resolve across services: the average amount of time from when an incident was created until it was resolved. Excludes incidents that have not been resolved. | ## Data Visualizations You can change the dropdown at the top left to select one of following visualizations: | Visualization | Description | | :------------------ | :------------------------------------------------------------------------------------------------------------------------------------------------------------------------------------------------------------------ | | **Incident Volume** | Incident count by service. | | **Response Effort** | Response effort in hours by service. The user-defined incident duration, if it exists, is used for this calculation. Read [Edit Incident Duration](/incident-management/incidents/edit-incidents#edit-incident-duration) for more information. | | **MTTA** | Mean time to acknowledge in seconds by service. | | **MTTR** | Mean time to resolve in hours by service. | ## Services List Below the data visualization you see the Services List data specific to the filters you have selected. You may perform the following actions with this table: - **Search**: Use the search field to search for specific data. - **Sort**: Click on a column header to sort results. You can also sort with multiple columns by holding down the shift key while clicking on both of the columns. The graph above does not change if you sort the data. - **Drill Down**: Click a service, Team, or incident count in the Service, Team, or Incidents columns to view more information about each. > **Service Display Order:** Services with data that match the given filters and date range are shown, and they are sorted by the count of incidents each service has had. If a service does not have any data that matches the filters within the given date range, it does not appear in the Services List. The available Services List columns are: | Column Name | Description | | :------------------------------- | :---------------------------------------------------------------------------------------------------------------------------------------------------------------------------------------------------------------------------------------------------------------------------------------------------------------------------------------------------------------------------------- | | **Service** | The service's name. | | **Team** | The Team each service belongs to. [Teams](/account-admin/teams) allow users to group and control user access to associated PagerDuty objects, such as escalation policies, users, schedules, and services. | | **Escalation Policy** | The escalation policy name. | | **Uptime %** | The percentage of time in the defined date range that the service was not interrupted by a major incident. | | **Incidents** | The total count of incidents that occurred on the service within the specified time period. | | **Acknowledged Incidents** | The percentage and the total number of incidents that were acknowledged on the service. Only explicit incident acknowledgments count; reassign, resolve, and escalation actions do not imply acknowledgement. Acknowledgements by added responders are excluded from this metric. | | **Auto Resolved Incidents** | Total count of incidents that resolved automatically (i.e., not by a human). | | **MTTA** | The average time for the first assigned user to acknowledge an incident. Reassign, resolve, and escalation actions do not imply acknowledgement. | | **MTTR** | The average time from when an incident was created until it was resolved. | | **Response Effort** | The total engaged time across all responders, measured from the time a responder acknowledges or accepts a responder request until the incident is resolved. Response Effort of resolved incidents can be [edited on an incident's details page](/incident-management/incidents/edit-incidents#edit-incident-duration). Edited values are marked with an asterisk (`*`). | | **Total Escalations** | The total number of escalations that occurred for these incidents. | | **Service ID** | The service's ID (e.g., `PXXXXXX`). | | **MTTE** | A measure of people's response time. This metric measures the time from the first user engagement (acknowledge or responder accept) to the last. This metric is only used for incidents with multiple responders; for incidents with one or no engaged users, this value is `null`. | | **MTTM** | The time between start of an incident, and the last additional responder to acknowledge. For incidents with one or no engaged users, this value is `null`. | | **Average Assigned Responders** | The average number of responders assigned to an incident. | | **Total Engaged Responders** | The total number of responders engaged in an incident. | | **Timeout Escalated Incidents** | Total count of timeout escalations that occurred for incidents on this service. | | **Manually Escalated Incidents** | Total count of manual escalated incidents that occurred for incidents on this service. | | **Total Reassignments** | The total count of incident reassignments from one responder to another across all incidents. | | **Reassigned Incidents** | Total count of incidents that had at least one reassignment on this service. | | **Interruptions** | Interruptions are when an on-call responder receives a mobile push, phone call, or SMS (text) notification. Notifications sent from various channels (push, phone, SMS) to the same destination are counted as one interruption. Notifications that arrive within 60 seconds of each other are counted as a single interruption. Email notifications are excluded from this metric. | | **Business Hour Interruptions** | Interruptions that happened on weekdays between 8 a.m. and 6 p.m.\* | | **Off Hour Interruptions** | Interruptions that happened on weekdays between 6 p.m. and 10 p.m., or on a weekend between 8 a.m. and 10 p.m.\* | | **Sleep Hour Interruptions** | Interruptions that happened any day of the week between 9 p.m. and 8 a.m.\* | | **Total Snoozed Seconds** | Total seconds the incident was [snoozed](/incident-management/incidents/edit-incidents#snooze-an-incident). | \* _Times are given in the [user's configured timezone](/account-admin/time-zone-settings#change-the-user-level-time-zone). If they have not configured a time zone, the report uses the [account's time zone](/account-admin/time-zone-settings#change-the-account-level-time-zone)._ By default, the Services List displays 10 results at a time. Use the dropdown below the table to select from 10, 20, 30, 40, or 50 results per page. If there are more results than the selected dropdown value, you can use the arrows (i.e., , , , ) to navigate through results. ### Share the Service Performance Report Read [Share a Report](/incident-management/analytics/insights/insights-filters#share-a-report) for more information on sharing or exporting the report. --- URL: https://docs.pagerduty.com/incident-management/analytics/insights/team # Team Insights Compare interruption counts, response effort, and MTTA across teams to see which teams carry the heaviest incident load. The Team report provides insights into the incident impact on Teams. It also includes a Teams List with metrics such as interruptions count, MTTA, MTTR, and response effort (incident duration). To view the Team report, navigate to **Analytics** → **Insights** and select the **Team** tab. 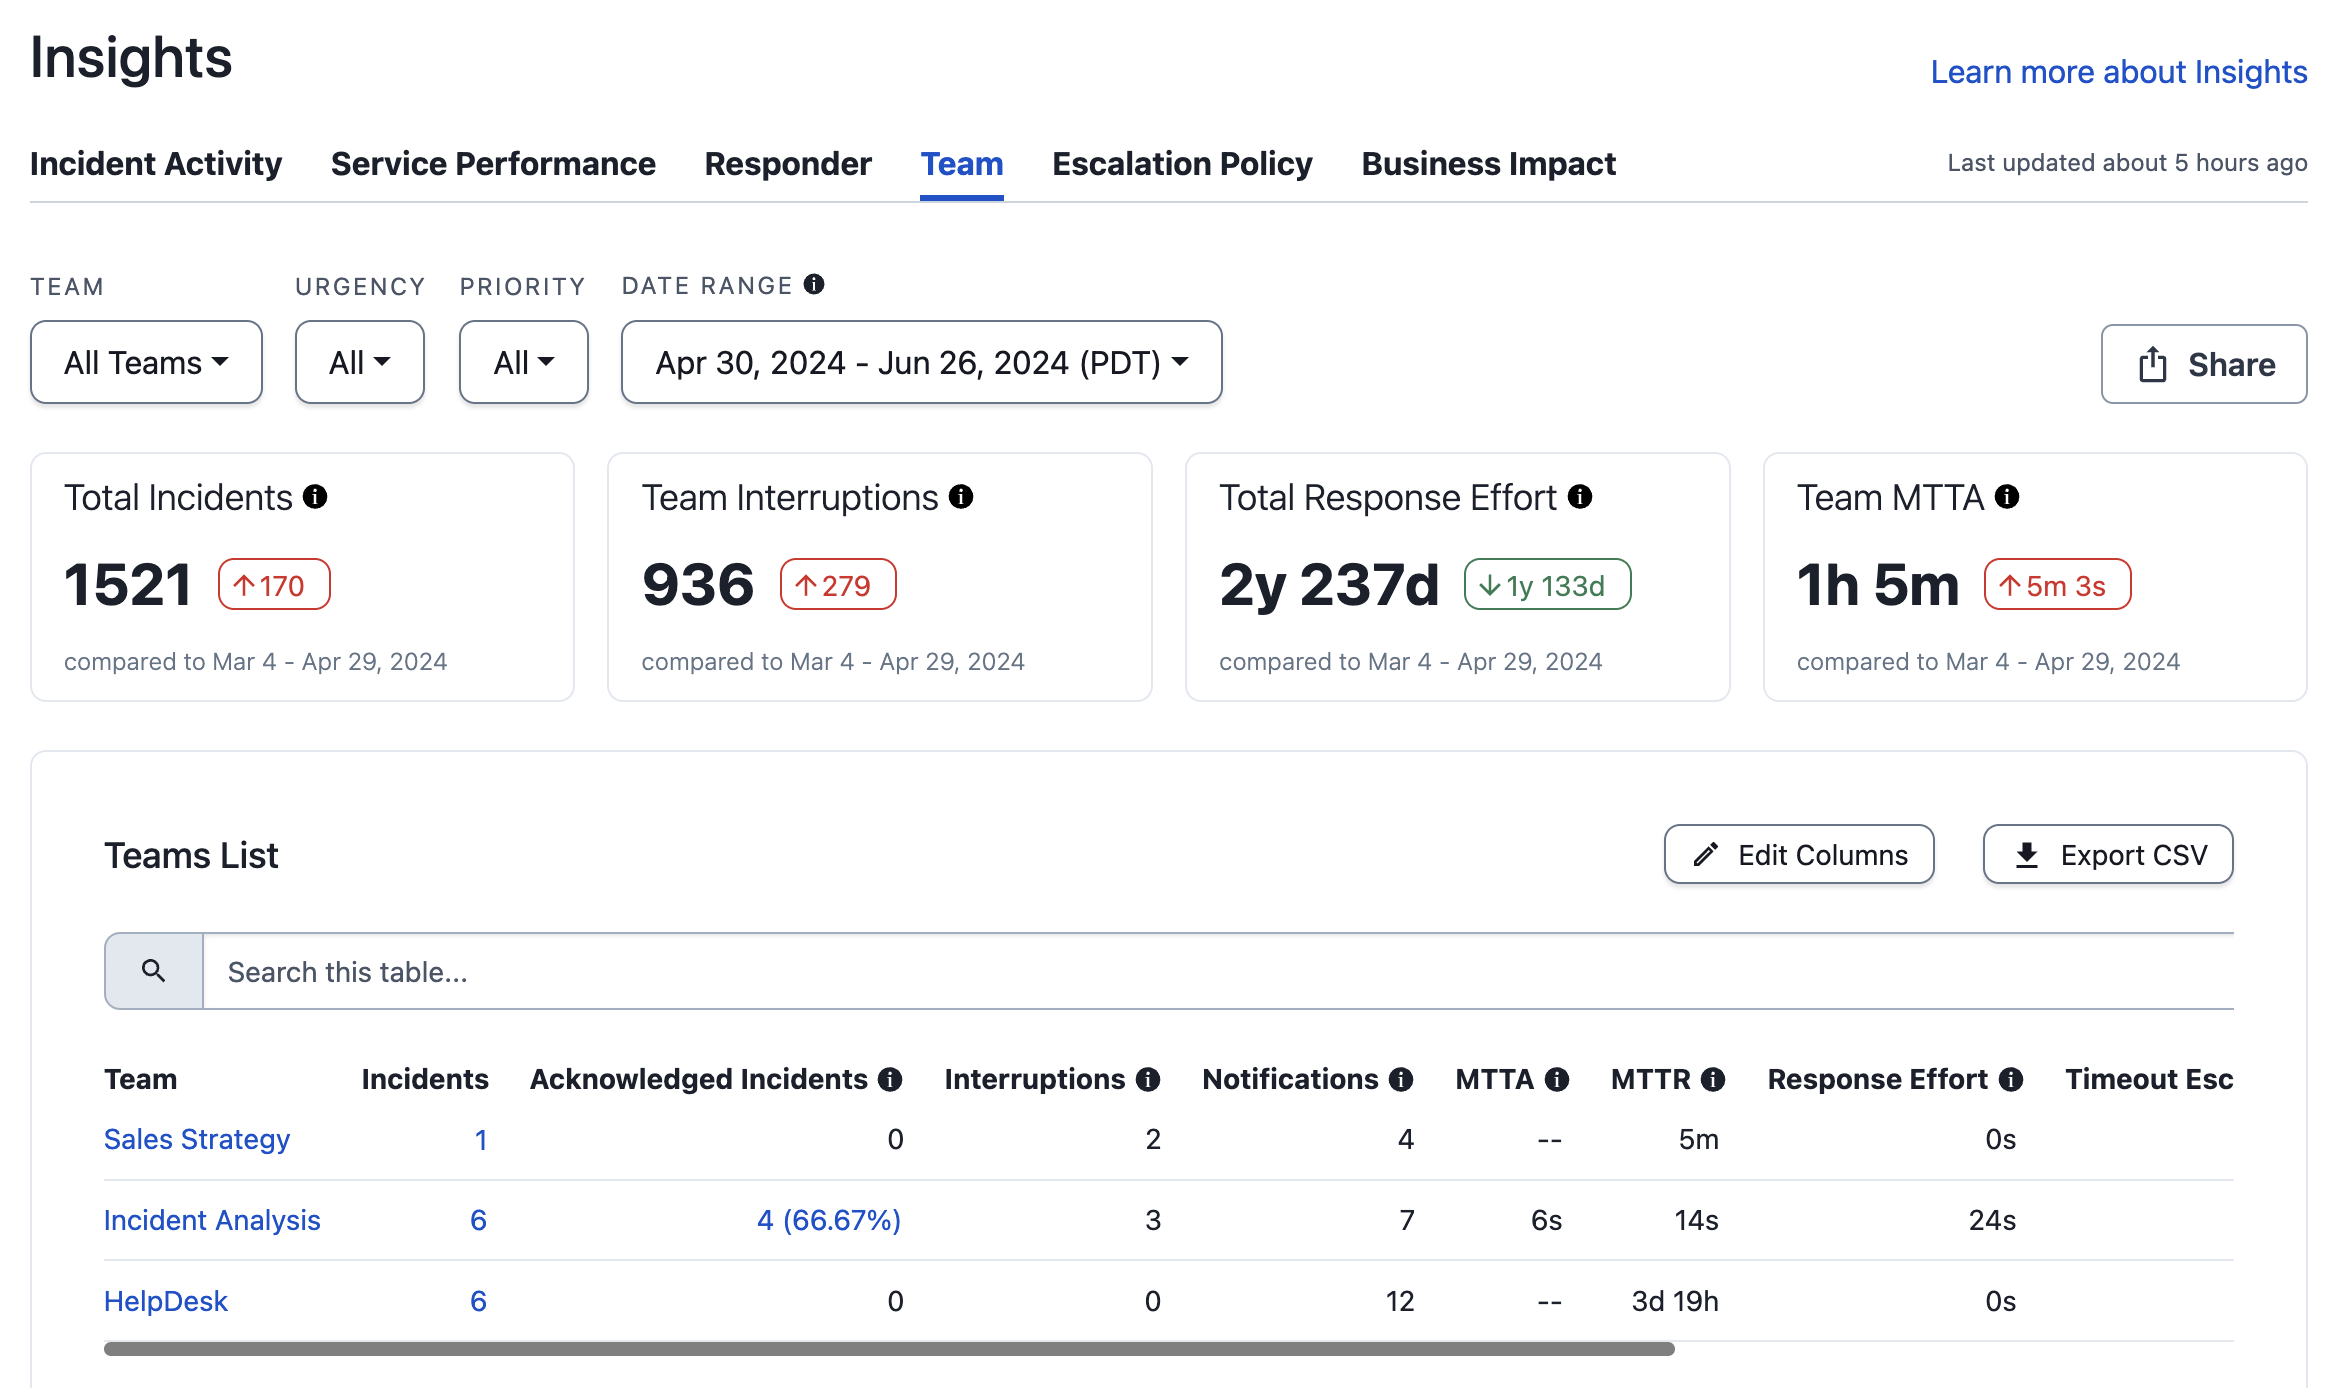 *Team report* ## Filter and Search Team > **Filter Options and Limits:** Each report has the following filter limits: > > - Service, Responder, and Escalation Policy Filters: 1000 > - Team Filter: 200 ## Summary Metric Cards Each card includes a comparison time period. For example, if you select the time period **Last 7 Days**, the cards show you the change in each metric compared to the week prior. | Metric | Description | | :------------------------ | :------------------------------------------------------------------------------------------------------------------------------------------------------------------------------------------------------------------------------------------------------------------------------------------------------------------------------------------------------------------------------------------------------------------------------------------------------------------------------------------------------- | | **Total Incidents** | The total count of incidents that all selected teams were engaged in across the specified date range. | | **Team Interruptions** | The total count of interruptions for all selected teams that occurred across the specified date range. Interruptions are when an on-call responder receives a mobile push, phone call, or SMS (i.e., text message) notification. Notifications sent from various channels (push, phone, SMS) to the same destination are counted as one interruption. Notifications that arrive within 60 seconds of each other are counted as a single interruption. Email notifications are excluded from this metric. | | **Total Response Effort** | Total time responders spent engaged in resolving incidents. Measured from the time a responder acknowledges or accepts a responder request until the incident is resolved. The user-defined incident duration, if it exists, is used for this calculation. Read [Edit Incident Duration](/incident-management/incidents/edit-incidents#edit-incident-duration) for more information. | | **Team MTTA** | The Mean Time to Acknowledge is the average amount of time from when an incident is created until the time the first responder acknowledges an incident. Excludes incidents that were not acknowledged. | ## Data Visualizations You can change the dropdown at the top left to select one of following visualizations: | Visualization | Description | | :---------------------- | :------------------------------------------------------------------------------------------------------------------------------------------------------------------------------------------------------- | | **Incident Volume** | Number of incidents per team. | | **Interruption Volume** | Number of interruptions per team. | | **Response Effort** | Number of hours per team. The user-defined incident duration, if it exists, is used for this calculation. Read [Edit Incident Duration](/incident-management/incidents/edit-incidents#edit-incident-duration) for more information. | | **MTTA** | Mean time to acknowledge in seconds per team. | ## Teams List Below the data visualization you see the Teams List data specific to the filters you have selected. You may perform the following actions with this table: - **Search**: Use the search field to search for specific data. - **Sort**: Click on a column header to sort results. You can also sort with multiple columns by holding down the shift key while clicking on both of the columns. The graph above does not change if you sort the data. - **Drill Down**: Click a Team, incident count, or acknowledged count in the Team, Incidents, or Acknowledged columns to view more information about each. To customize the columns you would like to view, click the **Columns** icon and select your preferred data. The available Teams List columns are: | Column Name | Description | | :------------------------------- | :---------------------------------------------------------------------------------------------------------------------------------------------------------------------------------------------------------------------------------------------------------------------------------------------------------------------------------------------------------------------------------- | | **Team** | The Team name. | | **Incidents** | The total count of incidents that the Team experienced within the specified time period. | | **Acknowledged Incidents** | The total count of assigned incidents the Team acknowledged. Only explicit incident acknowledgment counts; reassign, resolve, and escalation actions do not imply acknowledgement. Acknowledgements by added responders are excluded from this metric. | | **Interruptions** | Interruptions are when an on-call responder receives a mobile push, phone call, or SMS (text) notification. Notifications sent from various channels (push, phone, SMS) to the same destination are counted as one interruption. Notifications that arrive within 60 seconds of each other are counted as a single interruption. Email notifications are excluded from this metric. | | **Notifications** | The total count of incident notifications sent via push, phone call, email, and SMS. | | **MTTA** | The average time for the first assigned user to acknowledge an incident. Reassign, resolve, and escalation actions do not imply acknowledgement. | | **MTTR** | The average time from when an incident was created until it was resolved. | | **Response Effort** | The total engaged time across all responders, measured from the time a responder acknowledges or accepts a responder request until the incident is resolved. Response Effort of resolved incidents can be [edited on an incident's details page](/incident-management/incidents/edit-incidents#edit-incident-duration). Edited values are marked with an asterisk (`*`). | | **Timeout Escalated Incidents** | The total count of the user's assigned incidents that were escalated due to timeouts. | | **Manually Escalated Incidents** | The total count of the user's assigned incidents that were manually escalated away from a user without acknowledgement. | | **Team ID** | The Team ID (e.g., `PXXXXXX`). | | **MTTE** | The average time for assigned second, third, and nth responders to acknowledge an incident. It is similar to MTTA, but used only for subsequent escalations after the first assigned user does not respond. | | **Reassigned Incidents** | The total count of a user's assigned incidents that were manually reassigned to a user who is not on the original escalation policy, or to another escalation policy. | | **MTTM** | The time between start of an incident, and the last additional responder to acknowledge. | | **Business Hour Interruptions** | Interruptions that happened on weekdays between 8 a.m. and 6 p.m.\* | | **Off Hour Interruptions** | Interruptions that happened on weekdays between 6 p.m. and 10 p.m., or on a weekend between 8 a.m. and 10 p.m.\* | | **Sleep Hour Interruptions** | Interruptions that happened any day of the week between 9 p.m. and 8 a.m.\* | | **Total Snoozed Seconds** | Total seconds the incident was [snoozed](/incident-management/incidents/edit-incidents#snooze-an-incident). | \* _Times are given in the [user's configured timezone](/account-admin/time-zone-settings#change-the-user-level-time-zone). If they have not configured a time zone, the report uses the [account's time zone](/account-admin/time-zone-settings#change-the-account-level-time-zone)._ By default, the Teams List displays 10 results at a time. Use the dropdown below the table to select from 10, 20, 30, 40, or 50 results per page. If there are more results than the selected dropdown value, you can use the arrows (i.e., , , , ) to navigate through results. ### Share the Team Report Read [Share a Report](/incident-management/analytics/insights/insights-filters#share-a-report) for more information on sharing or exporting the report. --- URL: https://docs.pagerduty.com/incident-management/analytics/operational-maturity # Operational Maturity Optimize performance by following recommendations across maturity levels The Operational Maturity report displays the calculated maturity status of an account, allowing all users to ensure their account is optimized for their goals. To view the Operational Maturity report, navigate to **Analytics** → **Operational Maturity**. 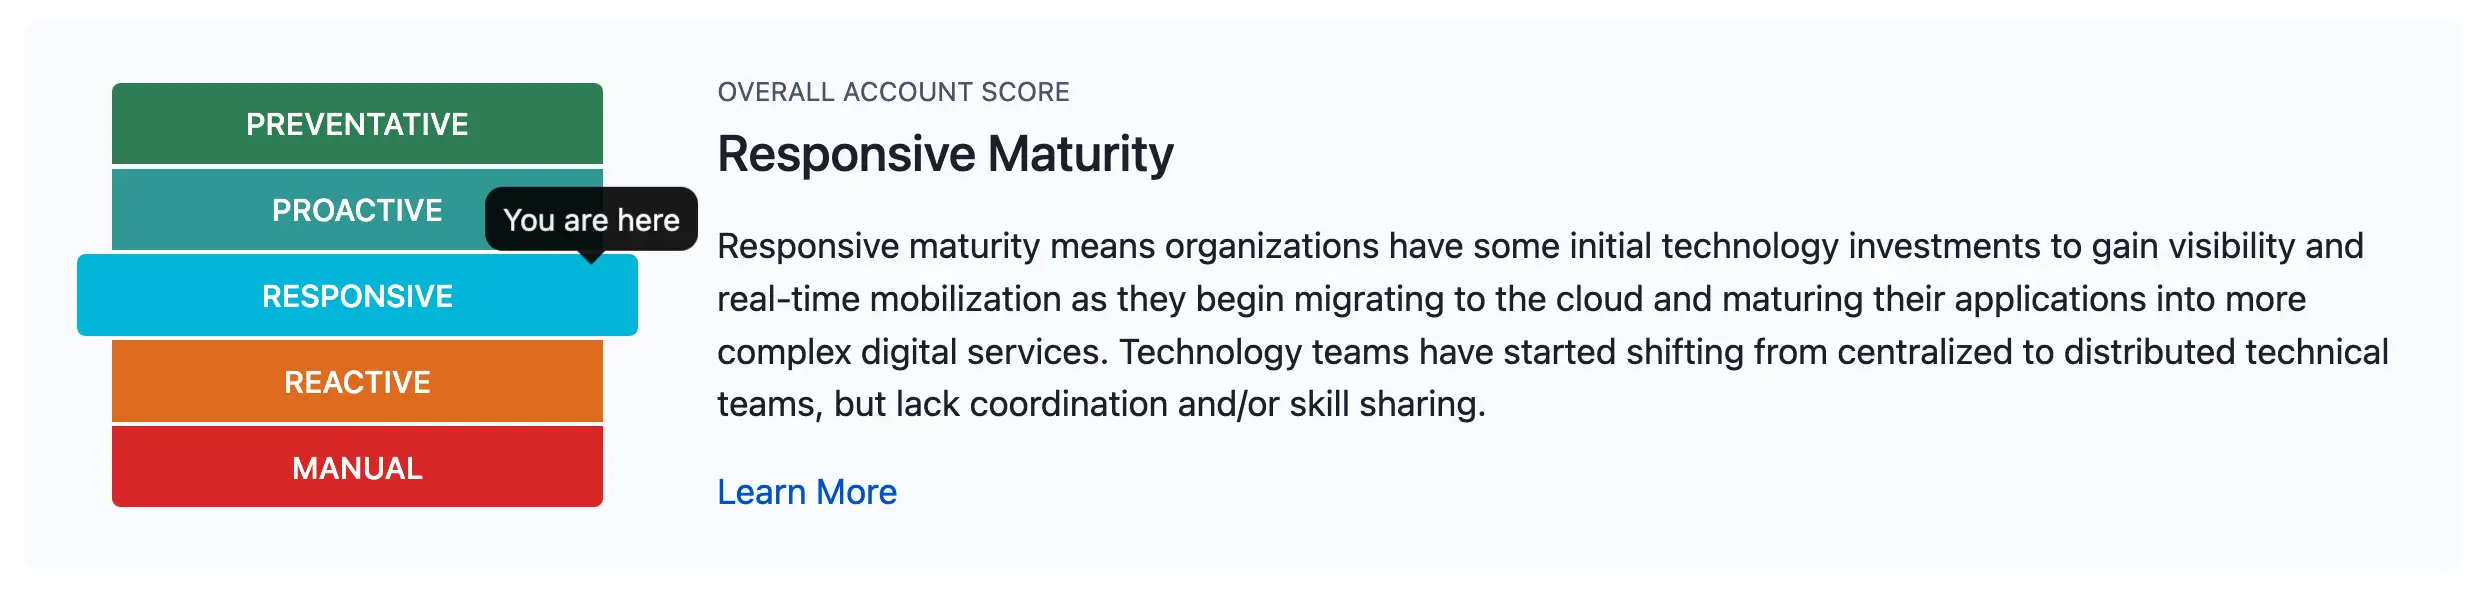 *Operational Maturity* > **Availability:** The Operational Maturity report is included on all PagerDuty pricing plans. > **Required User Permissions:** All user roles can view the Operational Maturity report. ## Overall Maturity Score Operational Maturity is measured using incident data from escalation policies, and the overall account score is created by taking a weighted average of escalation policies by incident volume. Escalation policies without incidents are not included in the calculation. You can complete the listed [recommendations](#recommendations) to progress from one maturity level to the next. If an escalation policy is not connected to a [service](/incident-management/services/services-and-integrations#create-a-service), it does not appear in the report. | Maturity Level | Definition | | :--------------- | :------------------------------------------------------------------------------------------------------------------------------------------------------------------------------------------------------------------------------------------------------------------------------------------------------------------------------------------------------------------------------------------------------------------------------------------------------------------------------------------------------------------------------ | | **Preventative** | Preventative teams are ahead of issues before they start. Superb customer experience is consistently the norm. Predictive issue remediation occurs based on machine learning insights. Consistent best practices occur across the organization. Highly automated processes eliminate toil and escalations. Continuous learning, improvement, and prevention are woven throughout the organization, including to non-technical stakeholders. Teams can predict the future impact of changes. | | **Proactive** | Proactive teams share seamless, coordinated issue management. Issues are detected and fixed by technical teams before customers are aware. Relevant information about issues is delivered in a timely manner to the right people, including business stakeholders. Organizations have seamless cross-role response and action. Programmatic learning and identification of optimization opportunities are prevalent. Distributed teams relate service changes with impacts and are fully accountable to production operability. | | **Responsive** | Responsive teams resolve issues as they occur. Teams have better visibility into customer-impacting issues and respond as quickly as possible. Machine learning is used to identify potential issues, reduce false positives, and reduce noise. Issues are automatically identified and actioned by subject matter experts, but assembling the right team is still a challenge. Distributed teams begin to take full ownership of microservices. Ad hoc knowledge sharing continues, but is not formalized. | | **Reactive** | Reactive teams are always in firefighting mode. Initial technology investments bring visibility and real time mobilization as your hosting methods (e.g., cloud) and applications mature to more complex digital services. Distributed teams approach the surface, but skills are in silos. Defined processes for managing issues do not exist. | | **Manual** | Manual maturity means customers identify issues, not internal teams. Operations processes are engineered for legacy environments, with incidents initiated manually and entirely by humans using queued workflows, such as tickets. A central team manually escalates urgent issues by adjusting ticket priorities. Little to no mechanisms to reach experts in an urgent and timely manner exist. | ## Highest Impact Actions PagerDuty recommends the top three actions to improve your organization's maturity rating in the operations cloud. Recommendations are generated based on your current maturity rating, previous actions, and peer-based benchmarking. Recommendations are grouped by escalation policy, and show the percentage of escalation policies that meet the goal. Click **View details** to see more information about a specific recommendation. 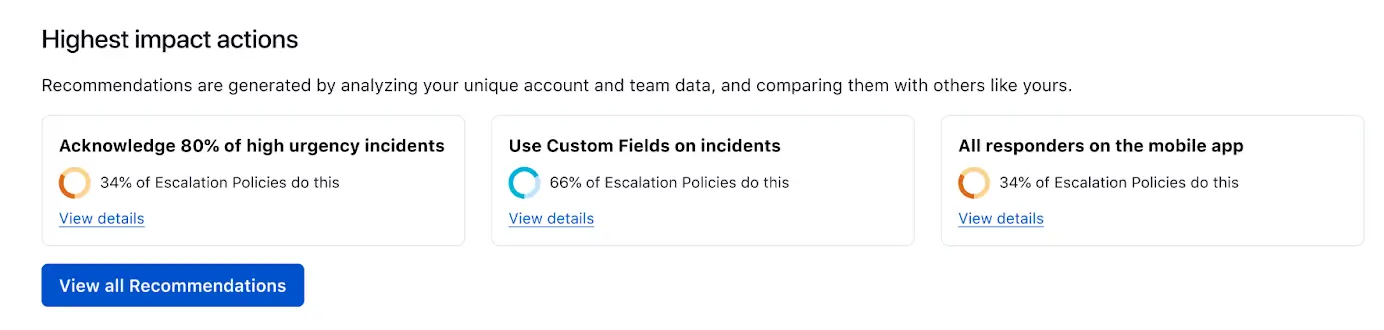 *Highest impact actions* ## Recommendations Click **View all Recommendations** to review the Maturity Scorecard, which organizes recommendation steps into six broad categories that relate to specific focus areas. This allows you to easily approach recommendations that align with your priorities. The steps outlined are not necessarily sequential and they are also not required, since all steps may not align with your use case. You are not required to complete all steps to progress to higher maturity levels. The recommendations are broken down into the following categories: - **People Management** - **Integrations** - **Automation** - **Noise Reduction** - **Team Collaboration** - **Continuous Learning** For each recommendation, you can see what percentage of escalation policies have completed it. ### Step Completion by Escalation Policy Click **View Details** to see a report that outlines the recommendation status for each escalation policy.  *View Details* The available columns are: - **Completion**: The completion status for this escalation policy for this recommendation. The value is either **Complete** or **Incomplete**. - **Incident Volume**: The number of incidents per week for this escalation policy. - **Next Step**: If the completion status for the escalation policy is **Incomplete**, this column contains details on what action(s) should be taken to complete the recommendation for that escalation policy. ## Filter and Search You have the option to filter with the following parameters: - **Team**: You can filter by selecting the **My Teams** tab, **All Teams** tab, or enter a term in the search box to find your preferred [Teams](/account-admin/teams). Select the checkbox next to your preferred Team(s) and click **Apply**. - **Escalation Policy**: You may search and/or select specific escalation policies, or **Select All** escalation policies, and then click **Apply**. - **Note**: If you have filtered by specific Teams, this filter automatically populates escalation policies owned by the selected Team(s). ## Share Report You can share a direct link to the Operational Maturity report as well as the Step Completion by Escalation Policy report. To share a report, click **Share** → **Copy Link** to save the URL to your clipboard and share the link with others.  *Share a report*
--- URL: https://docs.pagerduty.com/incident-management/analytics/operational-reviews # Operational Reviews Facilitate operational review meetings with team, service and company operation metrics ## Operational Reviews The Operational Reviews feature offers metrics for three types of reviews, each targeted at different levels of leadership in a digital business. These review types facilitate weekly, monthly, and quarterly operational review meetings: - [Team On-Call Handoff Reviews](/incident-management/analytics/operational-reviews#team-on-call-handoff-reviews) - [Service Performance Reviews](/incident-management/analytics/operational-reviews#service-performance-reviews) - [Business Performance Reviews](/incident-management/analytics/operational-reviews#business-performance-reviews) These reviews analyze past performance and are not designed for ad-hoc or real-time analytics needs. For in-depth background information on Operational Reviews, read the [Reviews Guide](/ops-guides/operational-reviews-guide). Navigate to Operational Reviews in the web app at **Analytics** → **Operational Reviews**. 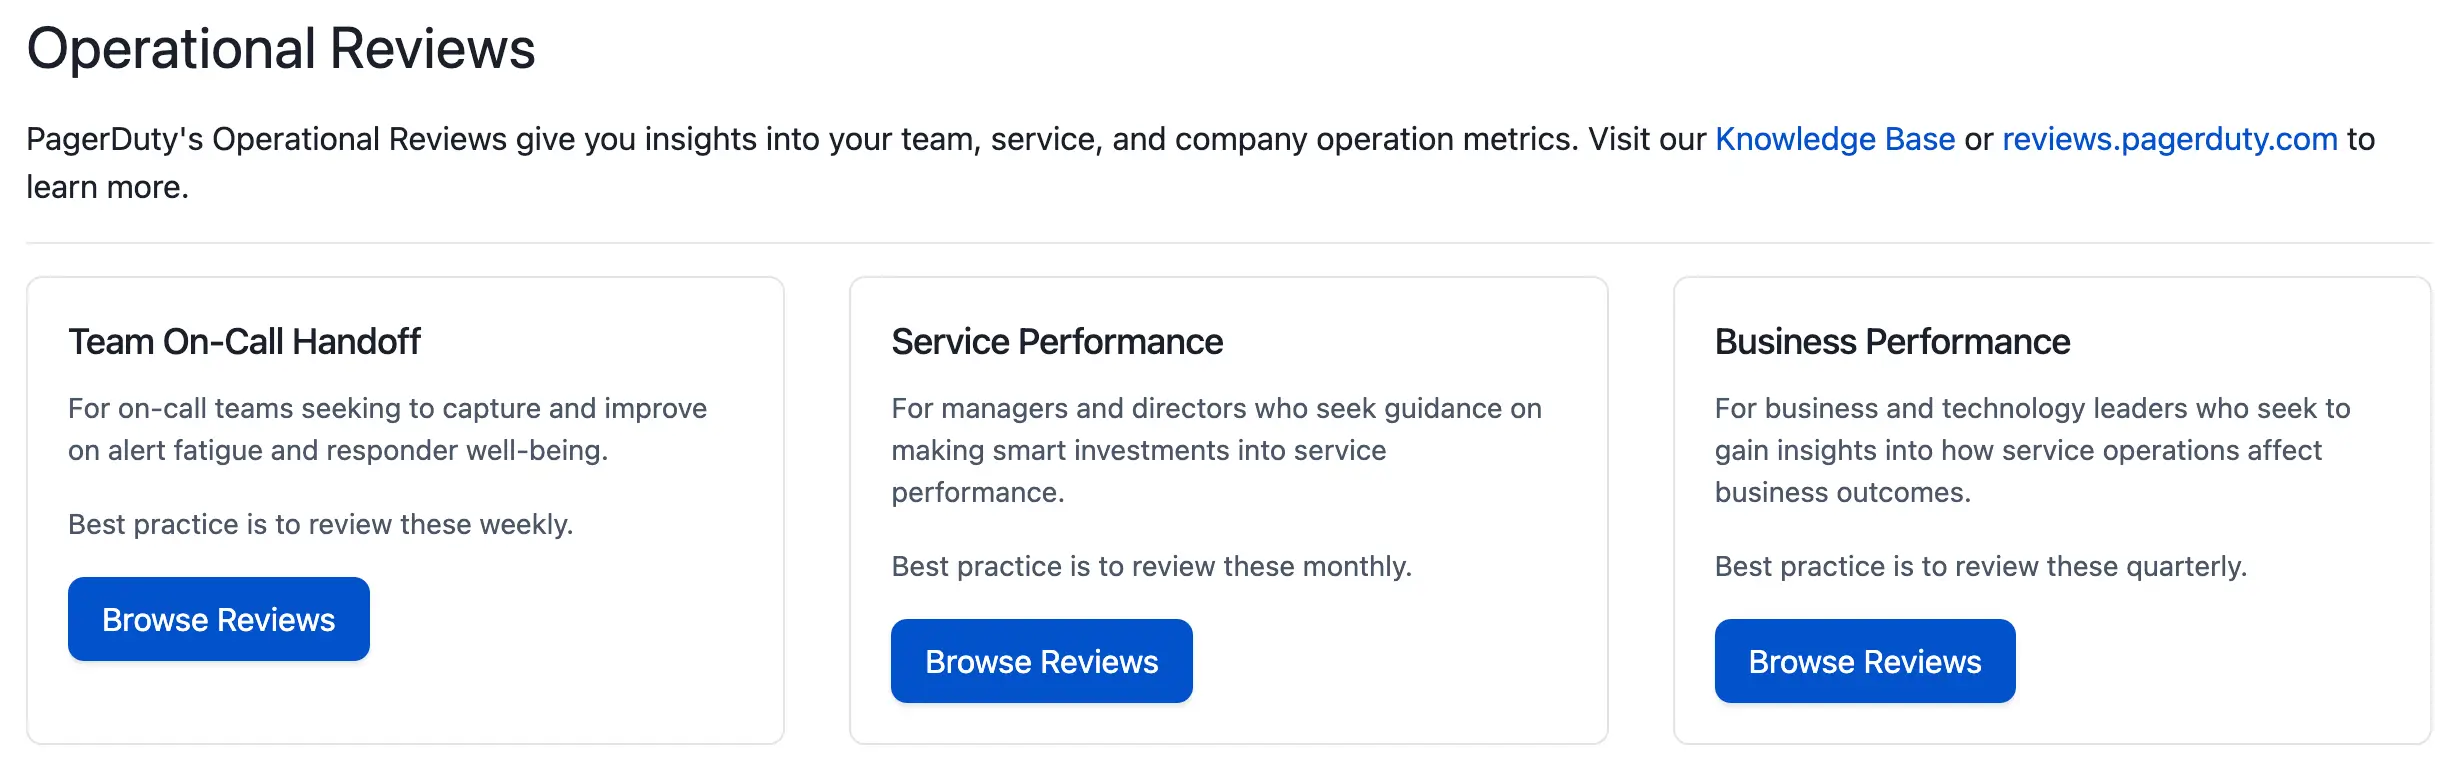 *Operational Reviews menu* > **Info:** The Operational Reviews feature is included on the following pricing plans: > > - Business > - Digital Operations (legacy) > - Enterprise for Incident Management > > Contact the [Sales Team](https://www.pagerduty.com/contact-sales/) to upgrade your plan and access this feature. > **Warning:** All users, except those with Restricted Access and Limited Stakeholder roles, can view and manage Operational Reviews. ## Foundational Concepts Each review incorporates interruptions and major incidents. ### Interruptions Interruptions occur when an on-call responder receives an SMS (text), mobile push, or phone call notification, and when an incident sends out a unique count of notifications. The same type of notification sent from various channels (SMS, push, phone call) to the same destination counts as one interruption. Email notifications are excluded, as email is not considered an interrupting channel. - **Business Hours Interruptions (Color Signifier: Yellow)**: The count of interrupting notifications sent between 8am and 6pm Monday to Friday, in the user's local time. - **Off Hours Interruptions (Color Signifier: Orange)**: The count of interrupting notifications sent between 6pm and 10pm Monday to Friday, or all day over the weekend, in the user's local time. - **Sleep Hours Interruptions (Color Signifier: Red)**: The count of interrupting notifications sent between 10pm and 8am, in the user's local time. ### Major Incidents A major incident is any high-priority incident that requires a [coordinated response](/incident-management/incidents/add-responders), often across multiple teams. Major incidents are typically highly visible to customers, making resolution the highest priority. Most organizations refer to major incidents as [P1, P2](/incident-management/incidents/incident-priority), or SEV-1, SEV-2. In PagerDuty Analytics, major incidents are defined as the top two levels of your priority settings, or incidents where [multiple responders](/incident-management/incidents/add-responders) have been added and have acknowledged the incident. Anyone who accepts a request to join the incident, acknowledges the incident, or reopens it is included in this count. In the Business Performance Review under **Major Incident Details**, these designations appear in the upper left as pills labeled P1, P2, SEV-1, SEV-2, or MRI for Multiple Responders Involved. ## Review Configuration When you first enable the Operational Reviews feature, reviews automatically generate based on your account's team data — you do not need to manually create them. If the feature was just enabled, reviews may not appear until PagerDuty has analyzed your account's performance data, which can take approximately one hour. If no reviews appear, ensure you are a member of at least one [Team](/account-admin/teams) so they can generate. > **Info:** Operational Reviews data only creates reviews for teams that were present in the account at the time of enablement. Teams created after enablement do not generate reviews automatically. Each user has a unique default review based on their team membership, and you can subscribe or unsubscribe from reviews assigned to you. To view reviews for a team you are not on, you must join that team or create a custom review that covers the team with your desired data. Default reviews generate on the following schedule: - **Team On-Call Handoff Reviews** generate every Monday morning. - **Service Performance Reviews** generate on the first of every month. - **Business Performance Reviews** generate on the first of every calendar quarter. - **Custom reviews** generate on the cadence set when they were created. ### Show All Reviews 1. Navigate to **Analytics** → **Operational Reviews** and click **Browse Reviews** under your desired review type. 2. Check the **Show all reviews (including unsubscribed and archived)** checkbox to view reviews you are not currently subscribed to.  *Show all reviews checkbox* ### Subscribe or Unsubscribe From a Review 1. Navigate to **Analytics** → **Operational Reviews** and click **Browse Reviews** under your desired review type. 2. Complete one of the following: - **To subscribe to a review**: Check the **Show all reviews (including unsubscribed and archived)** checkbox, search for the desired review, and click **Subscribe** on the right side. 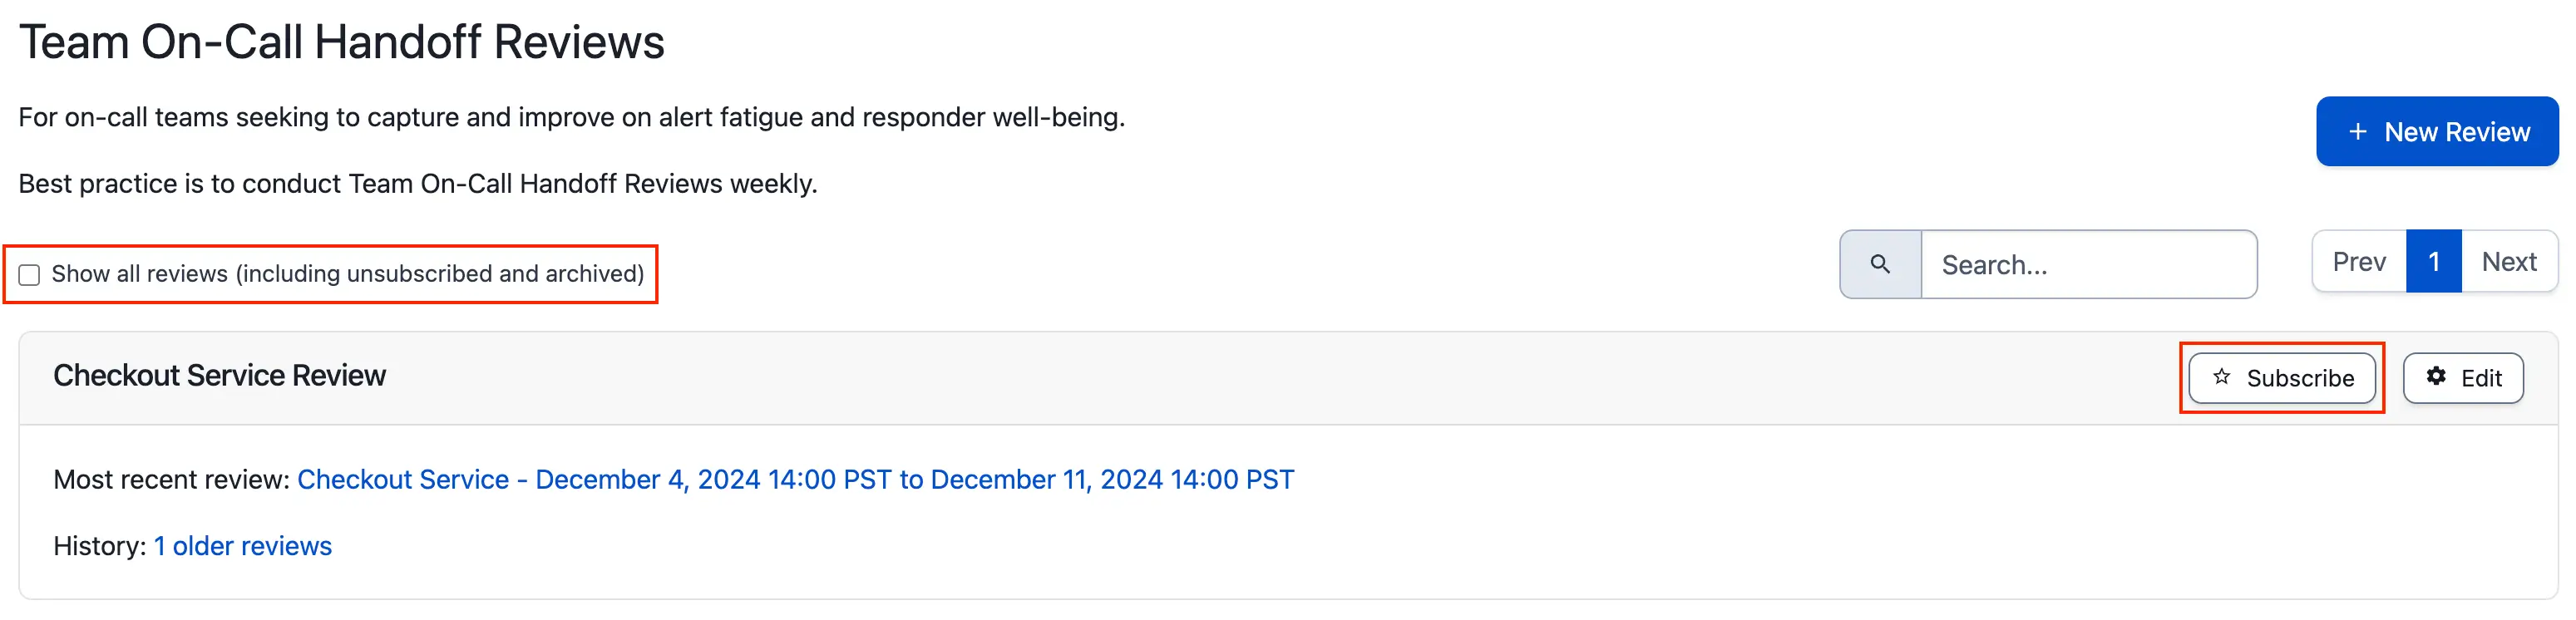 *Subscribe to a review* - **To unsubscribe from a review**: Search for the review and click **Unsubscribe** on the right side. 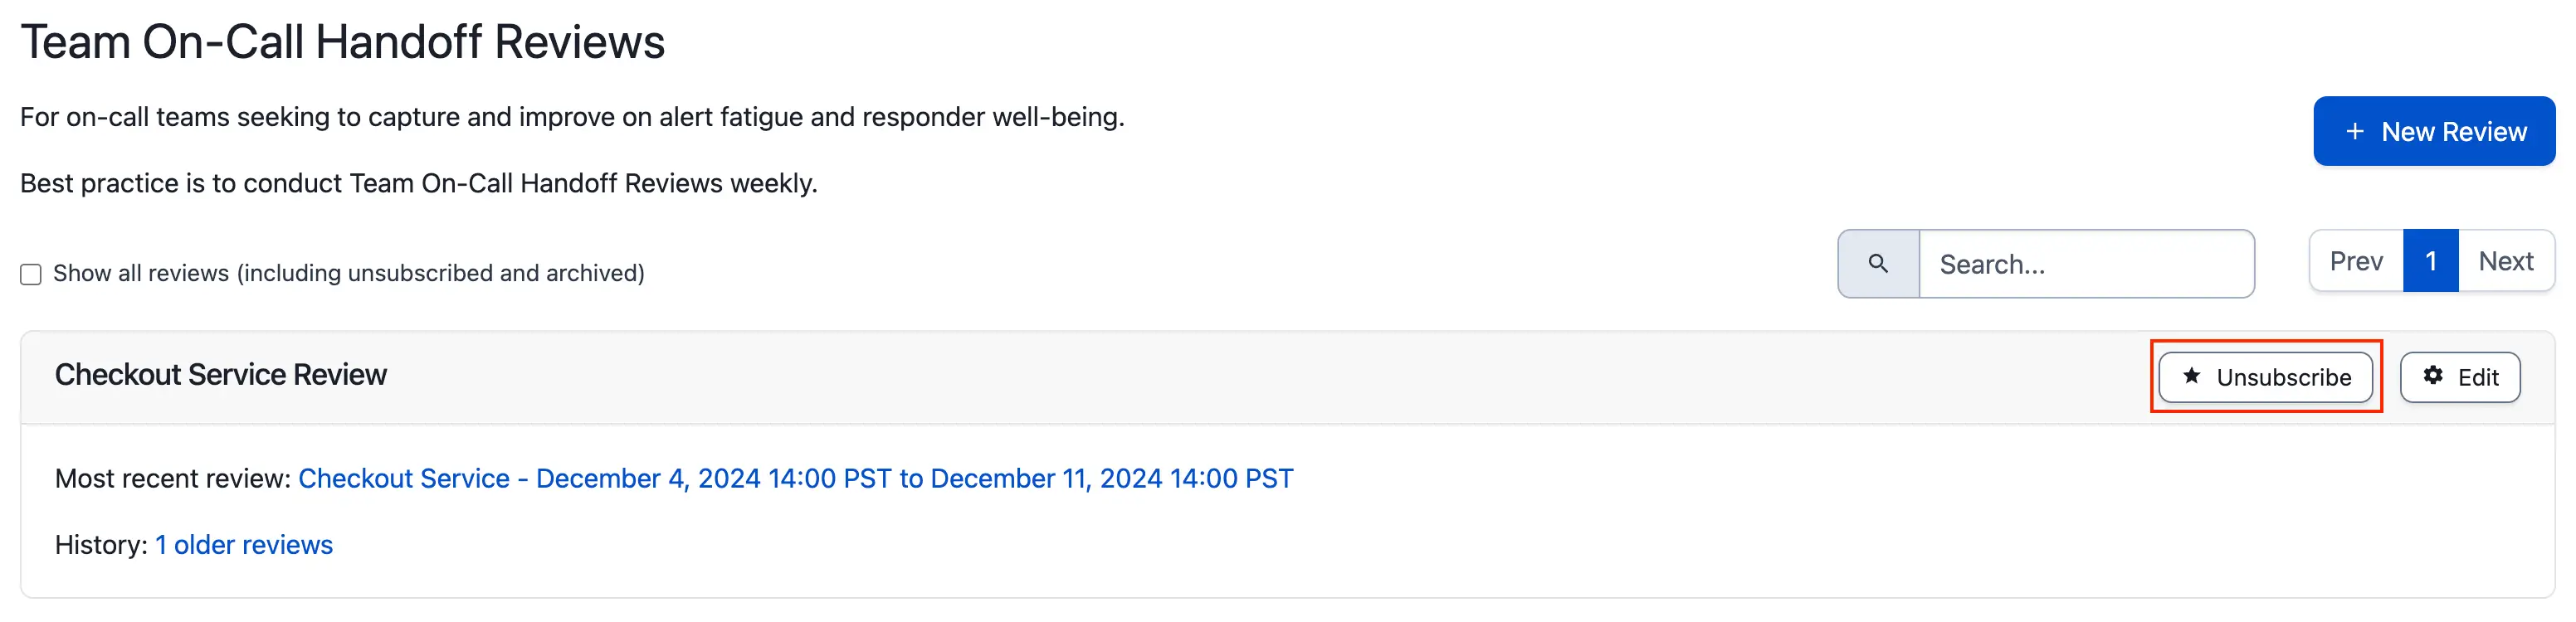 *Unsubscribe from a review* ### Create a Custom Review Custom reviews allow you to generate reviews across multiple, often unrelated teams. A custom review generates for the first time at the end of the time period set during creation. For example, if you create a review on Tuesday that spans Monday 8:00am through Monday 7:59am, the first review appears on the following Monday. 1. Navigate to **Analytics** → **Operational Reviews**, click **Browse Reviews** under the desired review type, and click **New Review**. 2. On the next screen, enter the following: | Field | Value | | :-------------------------------------------------- | :----------------------------------------------------------------------------------------------------------------------------------------------------- | | **Review Name** | A meaningful name that reflects the intended purpose of the review meeting (e.g., "Customer Support, Data, Web Triage - Team On Call Handoff Review"). | | **Team** | Search and select the team or teams you would like to review. | | **Frequency** _(Team On-Call Handoff Reviews only)_ | Select the number of **weeks** between reviews, and the **date and time** when you would like the review to generate. | 3. Click **Save** to create your custom review. ### Edit Reviews Default Team On-Call Handoff Reviews allow you to edit the number of weeks, days of the week, and hour of day that they generate. Custom reviews of any type allow you to edit any aspect that was configurable at creation. Default Service Performance Reviews and Business Performance Reviews are not currently editable. To edit a review: 1. Navigate to **Analytics** → **Operational Reviews** and click **Browse Reviews** under your desired review type. 2. Search for the desired review and click **Edit** on the right side. 3. Edit the available details and click **Save**. ### Delete Team On-Call Handoff Reviews You can only delete Team On-Call Handoff reviews. > **Info:** You cannot delete Service Performance and Business Performance reviews. Clicking **Unsubscribe** hides unwanted reviews from your list. To delete a Team On-Call Handoff review: 1. Navigate to **Analytics** → **Operational Reviews** and click **Browse Reviews** under the **Team On-Call Handoff** review type. 2. Search for the desired review and click **Edit** on the right side. 3. Click **Delete** on the right, then click **Delete Review** in the confirmation prompt. ### Search for a Review Each review type list — Team On-Call Handoff, Service Performance, and Business Performance — includes a search capability that allows you to locate specific reviews quickly. Navigate to **Analytics** → **Operational Reviews**, select the name of the desired review type, and search for the desired team or review name.  *Search for a review* ## Review Types > **Info:** For each review type, sparklines compare the most recent review period to the four previous periods to show how metrics are trending. To the left of each sparkline, the metric for the current period appears. Below each sparkline, the metric for the **Last** period and the percent change between the two periods appear. ### Team On-Call Handoff Reviews Team On-Call Handoff Reviews help teams capture and improve alert fatigue and responder well-being. The metrics focus on interruptions to responders during business hours, off hours, and sleep hours, as well as MTTA/MTTR, escalations, and the most frequent incidents. Team On-Call Handoff Reviews generate every Monday by default. #### Metrics **Team Metrics**: - **Major Incidents**: Count of incidents on the team's technical services with high priority (P1, P2) or severity (Sev-1, Sev-2), and/or requiring more than one responder. - **High Urgency Incidents**: Count of high urgency incidents within the time period designated for the review. - **High Urgency Incident MTTR**: Average mean time to resolve (MTTR) for high urgency incidents. - **Off Hours Interruptions**: The count of interrupting notifications sent between 6pm and 10pm Monday to Friday, or all day over the weekend, in the user's local time. - **Escalations**: Total count of escalations that occurred in the team's weekly report, including both manual and time-out escalations. - **High Urgency Incident MTTA**: The mean time to acknowledge (MTTA) for high urgency incidents. - **Sleep Hours Interruptions**: The count of interrupting notifications sent between 10pm and 8am, in the user's local time. - **Loudest Service**: The service that sends out the highest number of unique interrupting notifications. - **Loudest Incident**: The single incident with the highest number of interrupting notifications sent until resolution. - **Interruptions By Service**: A breakdown of interruptions per service, displayed in a pie chart. **Individual Metrics**: - **Company Averages This Period**: The average interruption summary among incident responders for a specified time period. PagerDuty takes all individuals interrupted at least once, uses their time zones to determine when interruptions occurred, and divides the totals by the number of interrupted individuals for the time period. This data surfaces comparisons at the team individual level to highlight whether any member experienced below or above average operational load relative to peers. - **Average Hours Interrupted**: The number of hours in a day where a user receives one or more interrupting notifications. The maximum is 24 per day. - **Average Total Interruptions**: The average total interruptions per user in the time range designated by the review. - **# Responders Interrupted This Period**: Number of responders interrupted in the period designated by the review. Each listed user also displays a **Current Vibe**: - **Sad face**: Any responder interrupted once during sleep hours, twice during off hours, or more than five times in total. - **Neutral face**: Any responder with one off hours interruption and five or fewer business hours interruptions. - **Happy face**: Any responder who received no off hours or sleep hours interruptions and has fewer than five total interruptions. - **Most Frequent Incidents**: Recurring and interrupting incidents with identical descriptions. Each metric includes the incident **Description** and total count of **Interruptions**. - **Incidents from this report**: A table of incidents included in this report's data. ### Service Performance Reviews Service Performance Reviews guide investments into service performance. The metrics focus on aggregate measurements such as time without major incidents, MTTR for major and high urgency incidents, and a breakdown of incidents and services that may warrant the most attention and investment. Service Performance Reviews generate on the 1st of every month by default. #### Metrics - **Time W/O Major Incident**: The total amount of time during the reporting period without an open [major incident](/incident-management/analytics/operational-reviews#major-incidents). Concurrent major incidents are counted together as a single measure. - **Time W/O High Urg. Incident**: The calculated net duration of high-urgency incidents in a month (removing any overlapping time) and the calculated percentage of time without high-urgency incidents. - **Major Incident MTTR**: Average mean time to resolve (MTTR) for incidents on the service with priority (P1, P2) or severity (Sev-1, Sev-2), and/or requiring more than one responder. - **High Urgency Incident MTTR**: Average mean time to resolve (MTTR) for high urgency incidents on the service. - **Major Incidents Count**: Count of major incidents. - **High Urgency Count**: Count of high urgency incidents. - **Longest Major Incident TTR**: The longest time to resolve (TTR) on a major incident. - **Longest Urgent Incident TTR**: The longest time to resolve (TTR) on a high urgency incident. - **Longest Incident Duration (High Urg.)**: The longest total duration from trigger to resolution on a high urgency incident. - **Loudest Services**: The technical services with the highest number of interrupting notifications. - **Most Frequent Incidents**: Recurring and interrupting incidents with identical descriptions. - **Business Service At Risk**: A measure of service stability based on the amount and duration of incidents on technical services mapped to business services in your system. PagerDuty calculates this in two ways: - The business service with the longest single major incident, calculated by adding up the overlapping total major incident durations on the technical services that support a business service (flattening the time). - The business service with the highest major incident volume, calculated by adding up the major incident count on the technical services that support a business service. - **Worst Performing Technical Services**: Services with the largest number of incidents. Incident count includes both high and low-urgency incidents. Business service affiliations and team associations for the technical service also appear here. ### Business Performance Reviews Business Performance Reviews provide business and technology leaders with insight into how service operations affect business outcomes. The metrics focus on the company cost of operating services (hours lost responding, cost of responder time), the impact on customers (aggregate major incident duration), and a summary of high-impact incidents from the quarter. Business Performance Reviews generate every calendar quarter (April 1st, July 1st, October 1st, and January 1st) by default. #### Metrics - **Time W/O Major Incident**: The total amount of time during the reporting period without an open [major incident](/incident-management/analytics/operational-reviews#major-incidents). Concurrent major incidents are counted together as a single measure. - **Est. Response Cost**: The estimated cost, in US dollars, that your company spent on employee incident response. This is a fixed cost calculation of $50 per hour. - **Responder Cost in Hours**: The actual cost in people/labor hours that your company spent on employee response to major incidents (each engaged responder's time from acknowledgement to resolution). This is also known as your responder burn rate. - **Major Incidents**: Count of incidents on the team's technical services with priority (P1, P2) or severity (Sev-1, Sev-2), and/or requiring more than one responder. - **Major Incident MTTR**: The mean time to resolve (MTTR) for major incidents. - **Most Time in Response**: The top three teams affected by major incidents, along with the number of major incidents, cost in hours, and the percentage of time spent on unplanned effort caused by those incidents. - **Business Services At Risk**: A measure of service stability based on the amount and duration of incidents on technical services mapped to business services in your system. PagerDuty calculates this in two ways: - The business service with the longest single major incident, calculated by adding up the overlapping total major incident durations on the technical services that support a business service (flattening the time). - The business service with the highest major incident volume, calculated by adding up the major incident count on the technical services that support a business service. - **Technical Services Hit List**: A list of three services in order of worst affected that need the most attention based on frequency of major incidents. The three worst services are determined by the **Time w/o Major Incident** metric, with the lowest times shown first. - **Major Incident Details**: The **Est. Response Cost**, **Duration**, **Technical Service**, and **Business Services Affected** for each major incident. ## FAQ **I just had the Operational Reviews feature enabled, why don't I see any reviews yet?** After enablement, it can take approximately one hour to analyze your account's data. Ensure you are assigned to at least one [Team](/account-admin/teams) so that team reviews can generate. **Why don't I see all my Teams on my Team On-Call Handoff Reviews?** After the feature is enabled, all existing teams have a review generated. However, teams created after enablement do not have reviews added automatically. To generate reviews for new teams, click the [New Review button](/incident-management/analytics/operational-reviews#create-a-custom-review). **How are my default reviews determined, and how do I change what reviews I can see?** Your reviews generate based on the teams you are on. To view reviews for a team you are not on, you must [join that team](/account-admin/teams#edit-a-team) or [create a custom review](/incident-management/analytics/operational-reviews#create-a-custom-review) that covers the team with your desired data. **How do Operational Reviews deal with different time zones?** Time zones are used in three ways: - To determine business, off, and sleep hours. - To display the time of an incident. - To determine the date and time range that a review covers. When determining whether an interruption occurred during business, off, or sleep hours, PagerDuty uses the time zone set on your profile. If you have not set a time zone, your profile inherits the account time zone. When displaying the details of a specific incident in a review, PagerDuty displays time based on your time zone. If you have not set a time zone, your profile inherits the account time zone. When creating a review, you select the time range based on the displayed account time zone. Default reviews generate on weekly, monthly, and quarterly cadences based on the account time zone. **Are incident times based on when they were created or when they were resolved?** Results include only the incidents _created_ within the selected timeframe. --- URL: https://docs.pagerduty.com/incident-management/analytics/pagerduty-analytics-slack-integration # PagerDuty Analytics Slack Integration View and send PagerDuty Insights reports in Slack The PagerDuty Analytics Slack integration brings key Insights into Slack, providing quick and easy access to important metrics where you work. Slack Insights subscriptions allow you to evaluate metrics on a recurring basis, making it easier to identify trends and changes. ## Configure a Slack Insights Subscription Subscribe to recurring, high-level Insights reports on Incident Activity, Service Performance, and Teams, and receive them directly in Slack. Reports are only visible to you and they will not be shown publicly in the channels in which they are configured. > **Required User Permissions:** All users, with the exception of Limited Stakeholders, can configure a Slack Insights subscription. > **Availability:** - `/pd insights` is currently in beta for all users, with features and documentation subject to change. > - Slack v2 or the [Slack V2 Next Generation integration](/integrations/slack-integration-guide) is required to use Analytics features in Slack. > - The PagerDuty Analytics Slack integration requires the [Teams](/account-admin/teams) feature. This feature is available on PD Reliability Platform plans, and on the Business, Digital Operations (legacy), and Enterprise for Incident Management pricing plans. Please contact our [Sales Team](https://www.pagerduty.com/contact-us/#contact-sales) if you would like to upgrade to a plan featuring Teams. 1. In a channel that has the PagerDuty app configured, use the Slack slash command `/pd insights` to configure recurring Insights reports. If prompted, **Choose a PagerDuty account**. 2. Configure your subscription: - **Which teams need to be included?**: Select up to 25 [Teams](/account-admin/teams) you would like to receive these reports for. - **How often do you need to be updated?**: Indicate how frequently you would like to receive these reports. - **When do you need the report delivered?**: Specify the **Day** and **Time** you would like to receive these reports. Click **Confirm** to save your settings. 3. You will then see a final confirmation message from the PagerDuty app:  *Slack confirmation message* After a few moments, you will receive a report for the last full period based on the duration and delivery time you selected. ### View Reports On the date(s) that you have configured (see above) you will receive a report that is only visible to you. Each report provides a high-level view of your Insights. Select the **Incident Activity**, **Service Performance**, or **Team** buttons to view each report. You have the option to **Explore [Report Name] in PagerDuty** to see more details in the PagerDuty web app. You may also click **Manage Subscriptions** to **Unsubscribe** from this report. 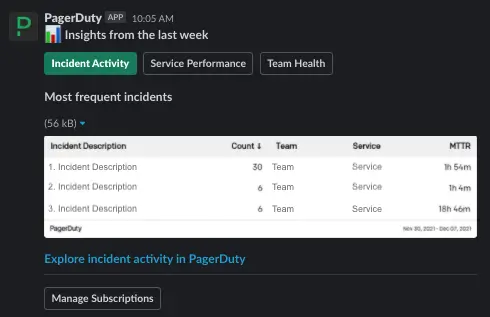 *View Slack report* ## FAQ **Can Slack Insights Subscriptions (/pd insights) be delivered to direct messages or channels?** At this time, Slack Insights Subscriptions are delivered directly to the PagerDuty app instead of in direct messages or channels. --- URL: https://docs.pagerduty.com/incident-management/analytics/recommendations # Recommendations View each service's noise-reduction maturity rating from A to E and apply one-click configuration changes to improve it. Recommendations provide a view into where your services stand in relation to the Maturity Model, along with single, push-button configuration of helpful settings to drive further maturity. Recommendations can be found in the web app by navigating to **Analytics** → **Service Recommendations**. 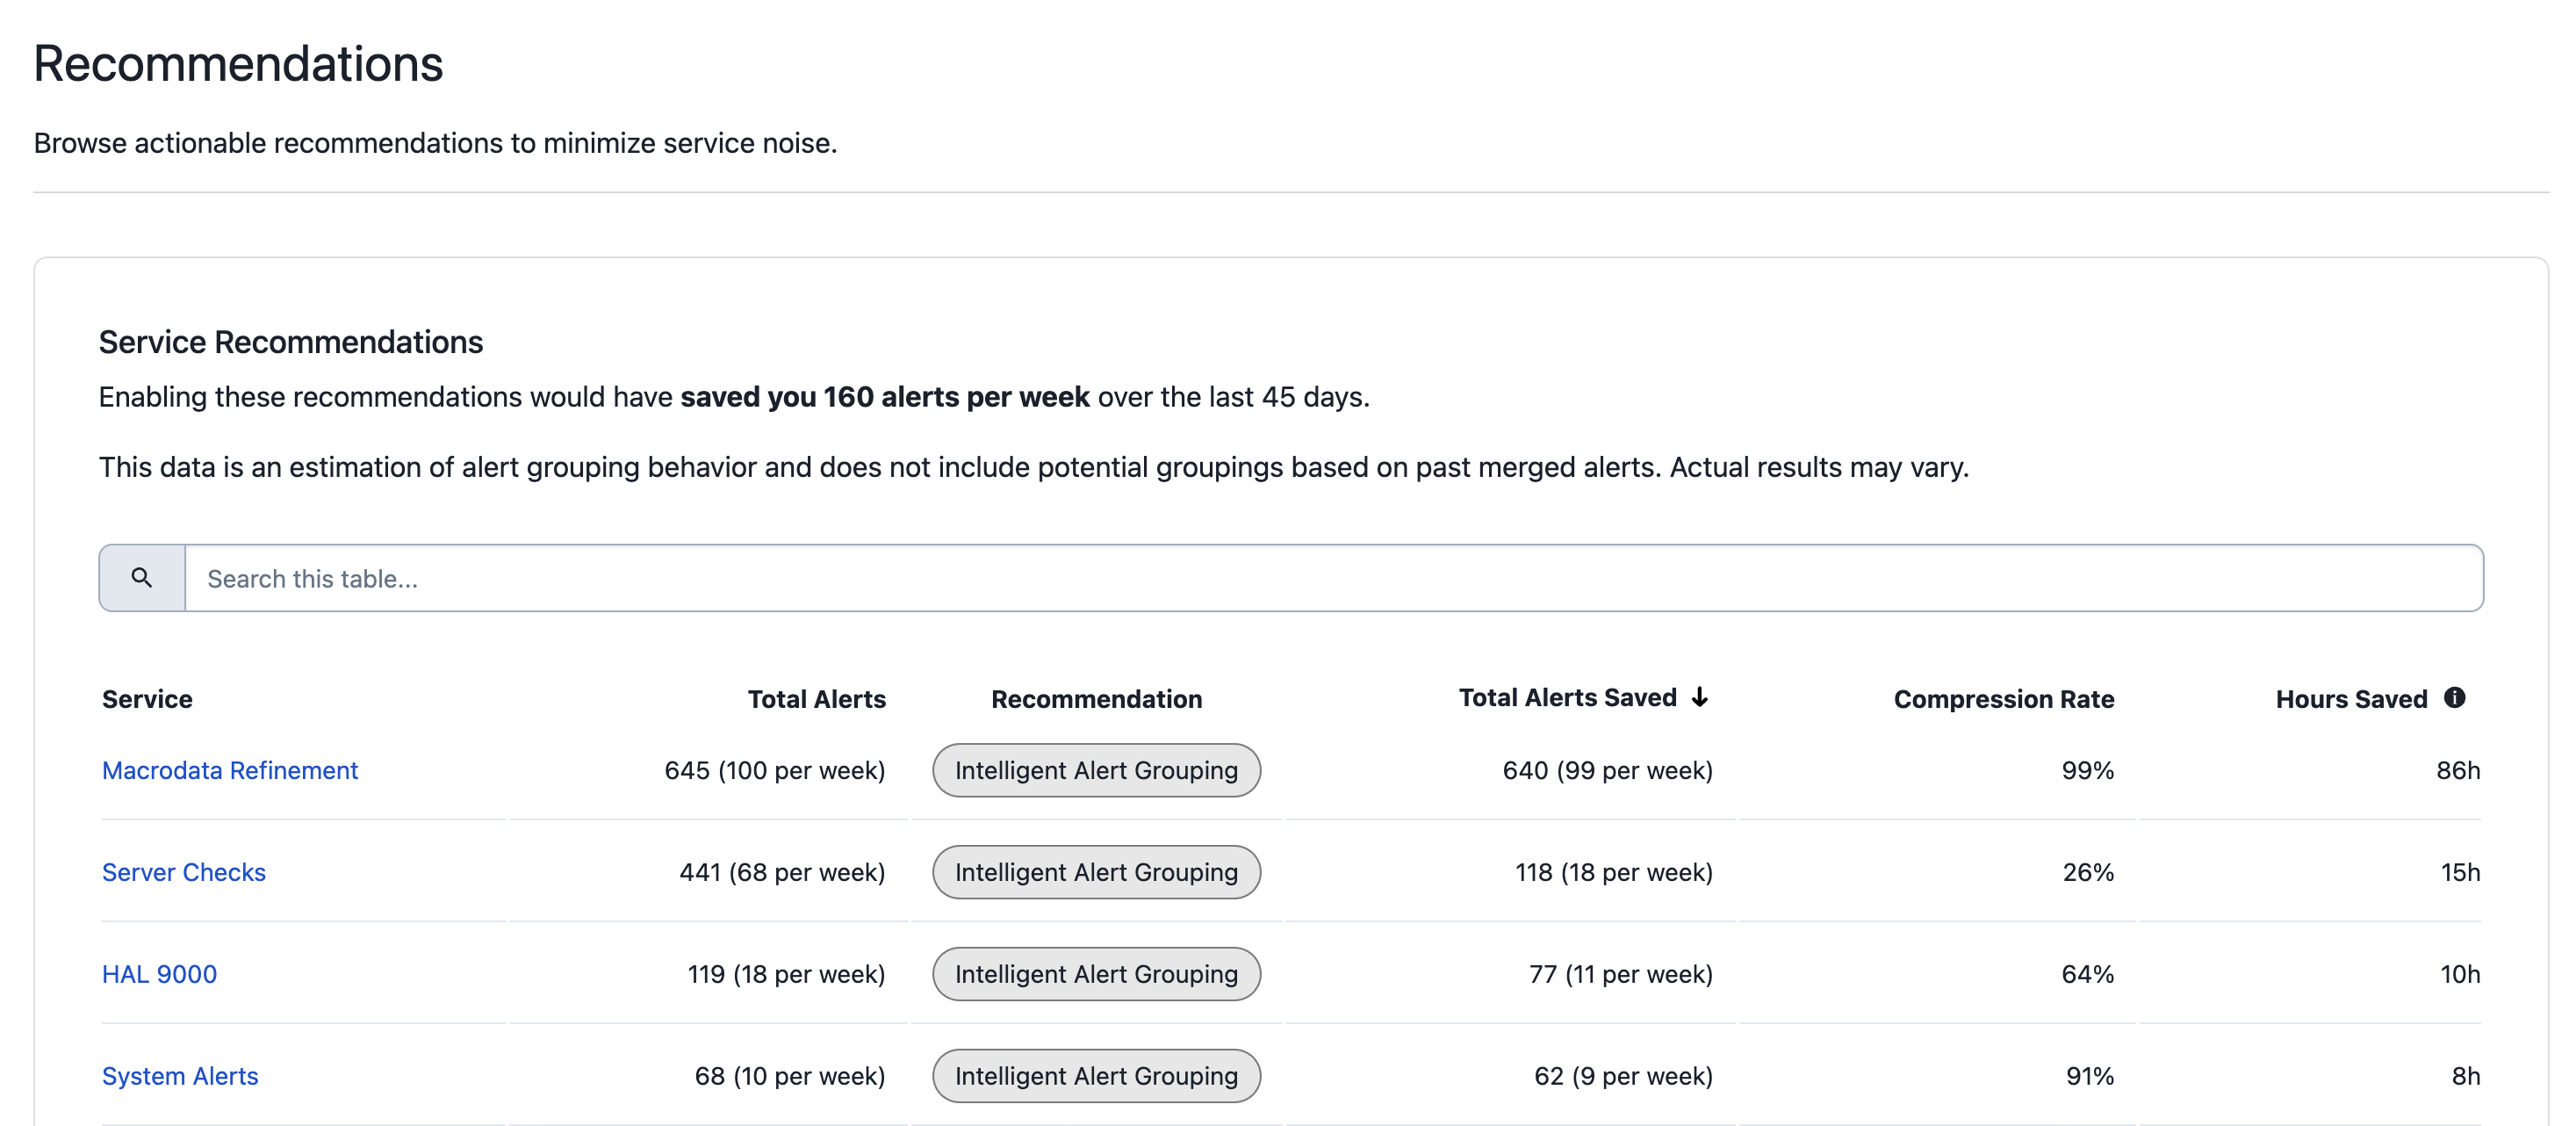 *Service Recommendations list* > **Availability:** Recommendations are available to customers on PD Reliability Platform plans. They're also available on the following pricing plans: Professional, Business, Digital Operations (legacy), and Enterprise for Incident Management. [Contact the Sales Team](https://www.pagerduty.com/contact-us/#contact-sales) if you would like to upgrade to a plan featuring Recommendations. ## Search and View Recommendations 1. You see a list of all **Service Recommendations** in your account. You can search for services by typing into the search bar. To sort the table, click the column name you wish to sort by. 2. Once you have located the data you are looking for, click the name of the **Service** to view further details about its recommendations. 3. On the next screen, you see this service's **Maturity Rating**, which is based on a comparison of all services across your account. Maturity ratings range from A (lowest noise) to E (highest noise). You also see the **Recommendation** for this service and a **Preview** of how this recommended configuration would affect your account if enabled. 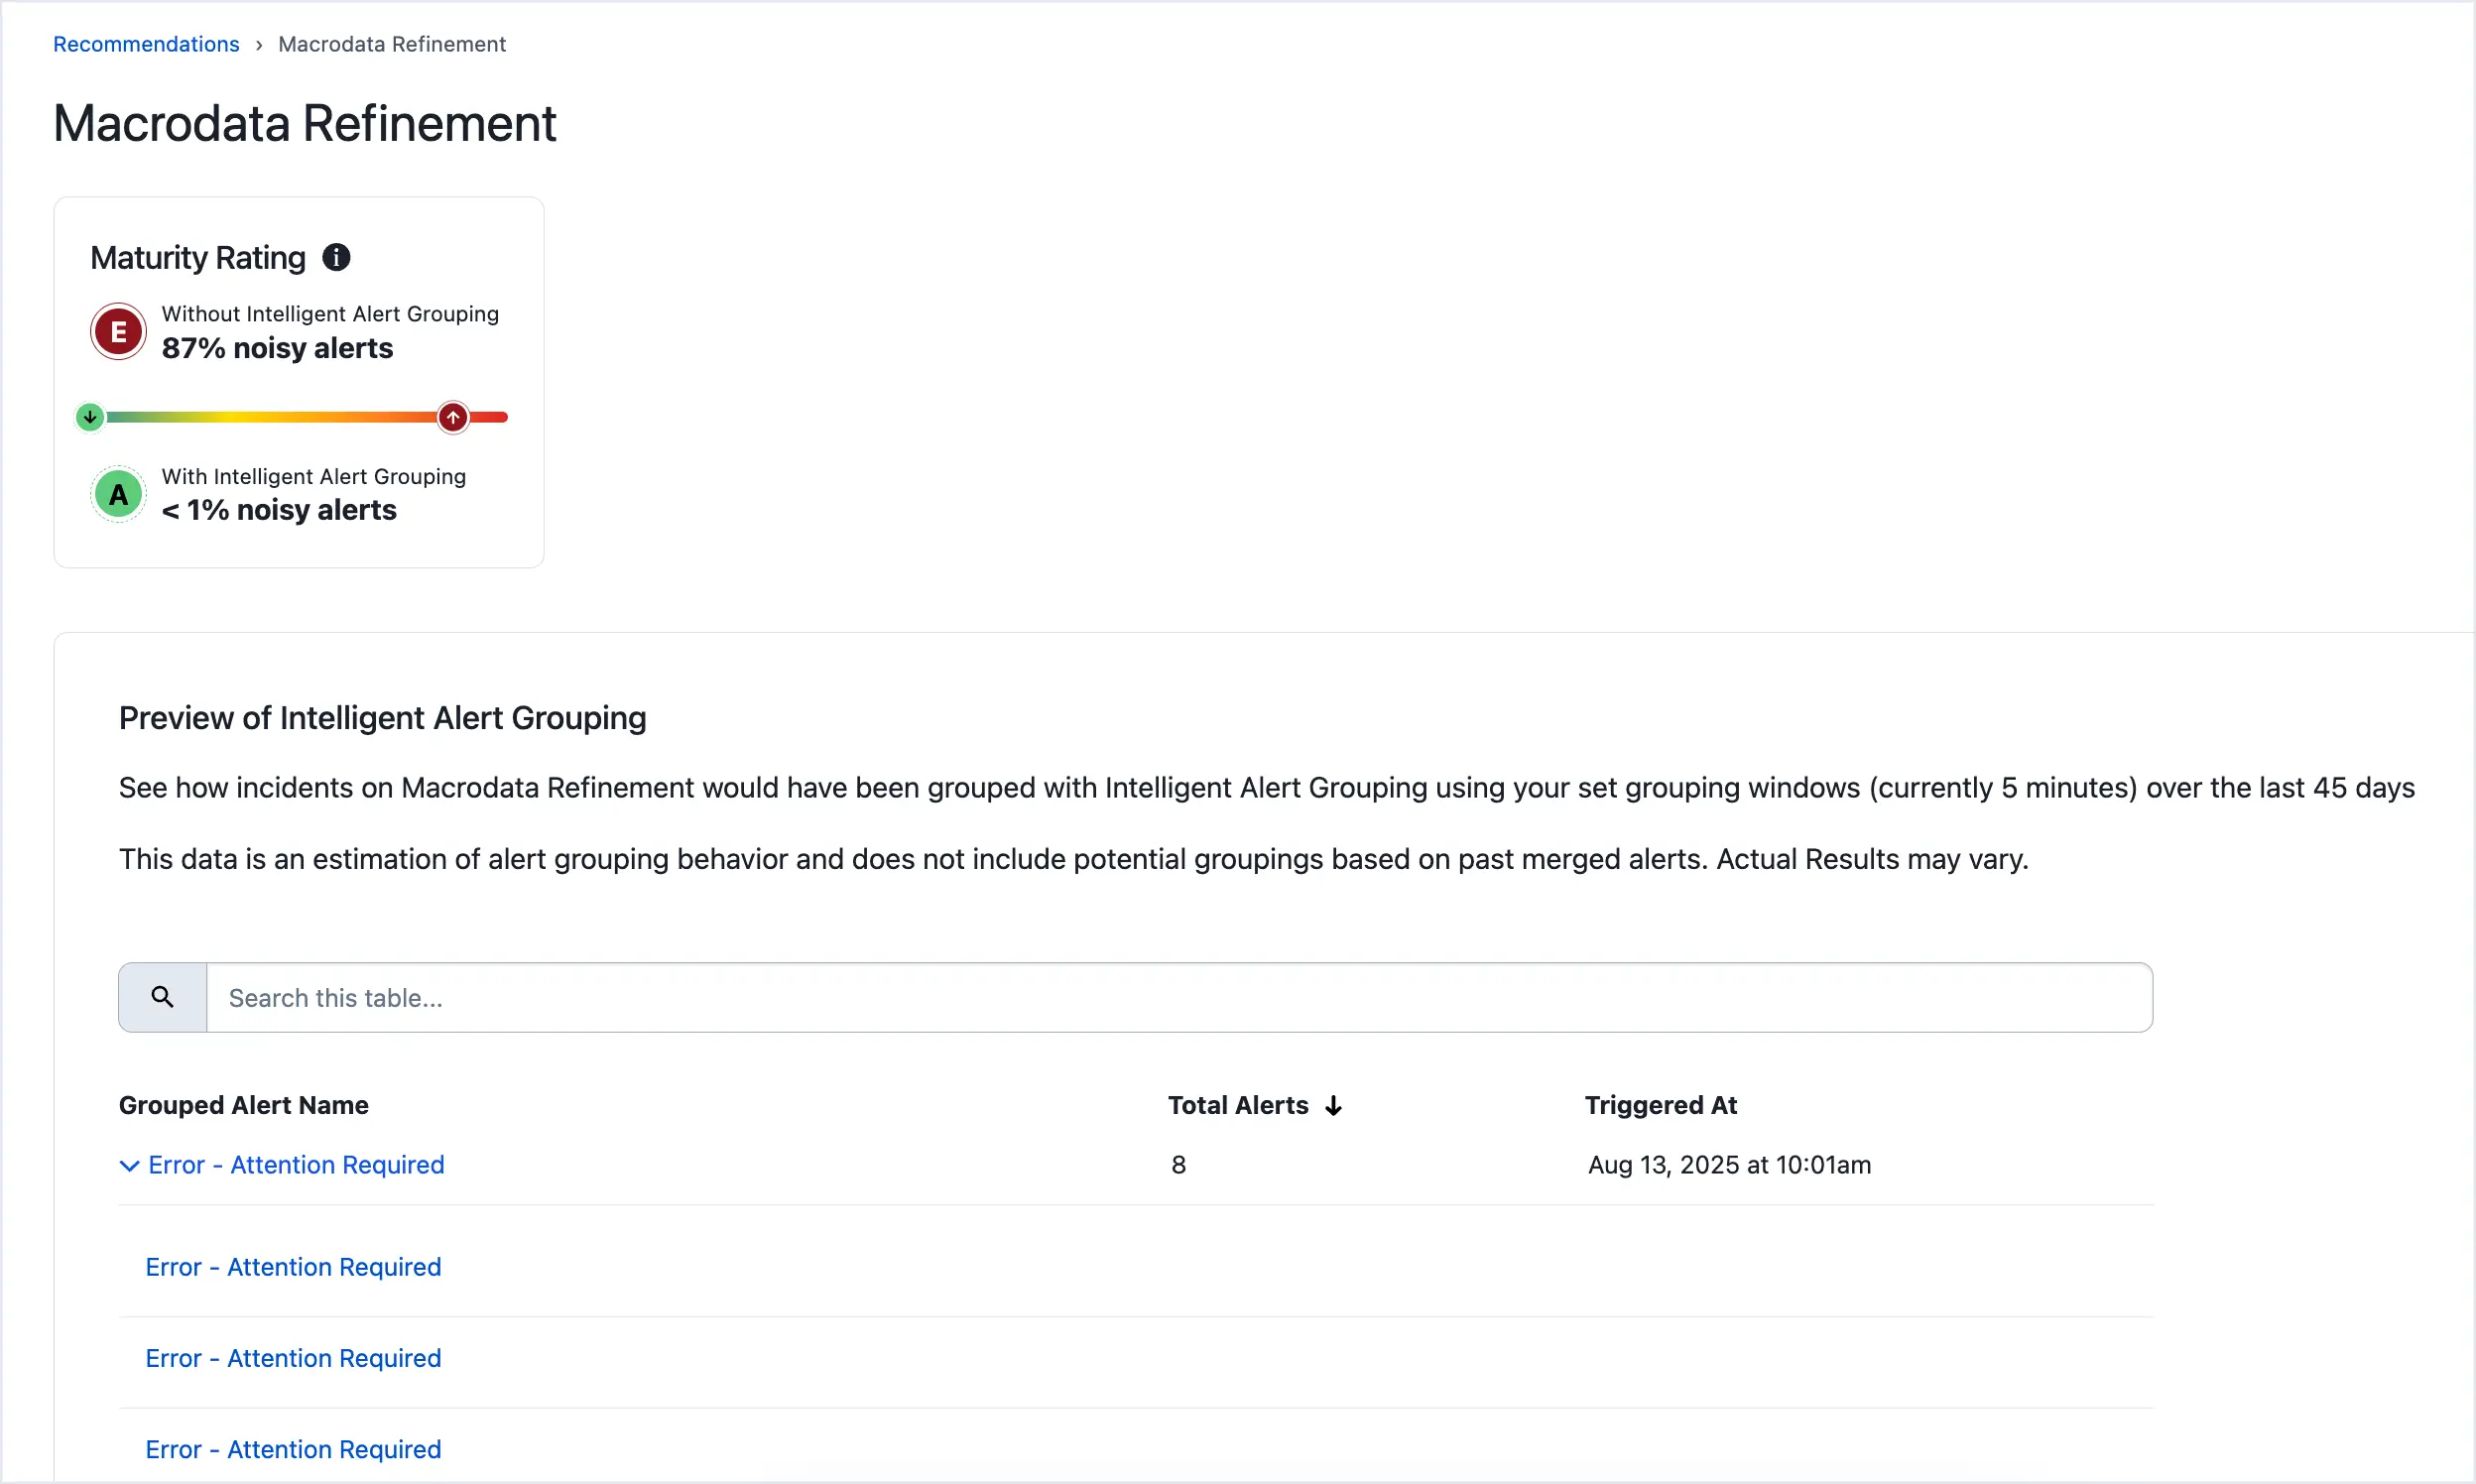 *Recommendation details*
--- URL: https://docs.pagerduty.com/incident-management/analytics/user-onboarding-report # User Onboarding Report View the status of invited users and their progress The User Onboarding report displays all user metrics, allowing account administrators to get a full overview of the user licenses in the account, as well as how well-configured users' accounts are. > **Required User Permissions:** The Account Owner, Admins, and Managers can view the User Onboarding report. Users without the necessary permissions do not see the User Onboarding report. > **Data Update Schedule:** User Onboarding report data is updated once per day, and it may take up to 24 hours for new data to appear. The report indicates when it was last updated in the upper-right of the page. ## View the User Onboarding Report To view the User Onboarding report in the PagerDuty web app, navigate to **Analytics** → **User Onboarding**. ### Filter and Search You have the option to filter with the following parameters: - **Team**: You can filter by selecting the **My Teams** tab, **All Teams** tab, or enter a term in the search box to find your preferred [Teams](/account-admin/teams). Select the **checkbox** next to your preferred Team(s) and click **Apply**. - **Invited Date Range**: The date range automatically defaults from the **date of account creation** to the **current date**. If you would like to change the date range, you may select from **Last 7 Days**, **Last 30 Days**, **Last Month**, **This Month**, or **Custom Range**. If you select **Custom Range**, select the range on the calendar and click **Apply**. **Note**: For custom ranges, you can select a start date up to three years in the past. A maximum duration of one year is allowed. ### Summary Metric Cards Each card shows the percentage and number of users that meet the criteria for the current data to help you measure user onboarding progress. - **Invited versus Joined Utilization**: Comparison between users who were invited to PagerDuty versus users who joined (i.e., accepted the invitation). - **% on an Escalation Policy**: Percentage of users included in at least one [escalation policy](/incident-management/schedules/escalation-policies). - **% with Notifications Configured**: Percentage of users with at least one [notification method](/account-admin/user-profile/notification-rules) configured. - **% on Mobile App**: Percentage of users with PagerDuty's [mobile app](/get-started/mobile-app) installed. ### User List Below the summary metric cards you see the User List data specific to the filters you have selected. You may perform the following actions with this table: - **Search**: Use the **search field** to search for specific terms in the table. You can search for a user's name or email address, a Team, or a specific month or year. - **Sort**: Click on a **column header** to sort results. You can also sort with multiple columns by **holding down the shift key while clicking on both of the columns**. To customize the columns you would like to view, click the **Edit Columns** button and select your preferred data. The available columns are: | Column Name | Description | | :------------------------------------------- | :-------------------------------------------------------------------------------------------------------------- | | **User Name** | The user's name _(required)_. | | **Role** | The user's role. | | **Email** | The email address associated with the user. | | **Team** | The user's teams. Only one team name displays at a time while any additional teams are indicated with a number. | | **Date Invited** | The date the user was invited to the PagerDuty account. | | **Last Sign In** | The most recent date the user signed in to the PagerDuty web app. Excludes mobile app logins. | | **Accepted Invite** | Details if the user has signed in to the PagerDuty web app. | | **Notification Methods** | Details if the user has notification methods set up. | | **Has Mobile App and Notifications Enabled** | Details if the user has installed the mobile app and enabled notifications. | | **On an Escalation Policy** | Details if the user is on an escalation policy. | | **On a Schedule** | Details if the user is on a schedule. | > **Note:** The **On an Escalation Policy** and **On a Schedule** columns are marked with a **Yes** only if the user is a target on an escalation policy or is a member of a schedule's rotation. Users added to a schedule via an [override](/incident-management/schedules/edit-schedules#create-overrides) are marked with a **No** value. By default, the User List displays 10 results at a time. Use the dropdown below the table to select from 10, 20, 30, 40, or 50 results per page. If there are more results than the selected dropdown value, you can use the arrows (i.e., , , , ) to navigate through the results. ## Share the User Onboarding Report There are two ways to share the User Onboarding report: - [Share Button](#share-button) - [Export CSV](#export-csv) ### Share Button Click **Share** → **Copy Link** to copy the report's unique URL to your clipboard, which you can share with others. Signed-in users who visit the link see the same filters applied in their report.  *Share the User Onboarding report's URL* ### Export CSV To export the User Onboarding report as a `.csv` file, click **Export CSV** to generate a file, which keeps the view and results based on your search and filter selections.  *Export CSV*
--- URL: https://docs.pagerduty.com/incident-management/communicate # Communicate with Stakeholders Manage incident subscribers and send status updates to stakeholders through the web app, mobile app, email, SMS, and API. Proactive stakeholder communications advise others on an incident's status and scope of impact. When stakeholders receive proactive status updates, the primary response team can focus on resolution, rather than answering status inquiries, leading to more efficient incident response and improved MTTR. > **Availability:** This feature is available on current Business, Enterprise for Incident Management, and Digital Operations (Legacy) plans. Contact the [Sales Team](https://www.pagerduty.com/contact-sales/) to upgrade to a plan that includes this feature. ## Add Subscribers to an Incident PagerDuty offers multiple ways to add subscribers to incidents: **Add Subscribers to an Ongoing Incident** Users and Teams can subscribe to an active incident from the PagerDuty [web app](#add-subscribers-to-an-ongoing-incident-in-the-web-app) or the [mobile app](#add-subscribers-to-an-ongoing-incident-in-the-mobile-app). > **Unsubscribed Users:** If an individual user has already subscribed to an incident, either individually or through a Team, and then unsubscribes from it, you cannot resubscribe them as part of a Team or [as a group via Incident Workflow](/workflow-actions/pagerduty-incident-management/add-stakeholders). You must either resubscribe them as an individual user using the following instructions, or the user must [resubscribe themselves](/incident-management/services/business-services/subscription#subscribe-to-incidents). #### Add Subscribers to an Ongoing Incident in the Web App 1. Navigate to the **Incidents** page and select an incident's title to view its detail page. 2. Select the **Status Updates** tab. 3. Click the **Manage Subscribers** button. 4. On the **Manage Subscribers** screen. 5. In the **Add a User or Team** dropdown, search for and select users and teams to subscribe to the incident. 6. Click **Add Subscribers**. #### Add Subscribers to an Ongoing Incident in the Mobile App 1. Under **My Open Incidents**, select an incident's title to view its detail page. 2. Select the **Overview** tab. 3. Scroll to the **Latest Status Update** section and tap **Manage**. 4. On the **Add Subscribers** screen, tap in the top-right and search or select users or Teams to subscribe to the incident. Users and Teams are automatically subscribed as soon as you tap them. **Add Subscribers at Incident Creation** You can configure PagerDuty to automatically subscribe stakeholders whenever an incident triggers. You can subscribe up to 25,000 users to an incident. To automatically subscribe users: 1. [Create an Incident Workflow](/ai-automation/automation/incident-workflows#create-an-incident-workflow) that subscribes users and/or Teams. If you frequently subscribe the same sets of stakeholders to incidents, you can simplify this task by adding those groups to the Incident Workflow. 2. Associate the Incident Workflow with a PagerDuty service under the **Services that this rule applies to** section in the Workflow. > **Note:** Stakeholders do not receive a notification when they are subscribed to an incident. This "silent subscription" allows you to subscribe stakeholders to an incident at any time (for example, at incident creation) and then explicitly choose to publish a status update if there is something noteworthy to report. Thus, stakeholders only receive curated updates, which helps avoid notification fatigue. **Subscribe to a Business Service** Users subscribed to a business service are added as subscribers whenever an incident impacts the business service. To learn more about subscribing to a business service, refer to [Business Service Subscription](/incident-management/services/business-services/subscription). > **Stakeholder Users:** - You can add any kind of PagerDuty user as an incident subscriber: Account Owner, managers, responders, and more. > - There are also special [Full Stakeholder](/account-admin/advanced-permissions#full-stakeholder-users) and [Limited Stakeholder](/account-admin/advanced-permissions#limited-stakeholder-users) user licenses available; these user roles are specifically designed to subscribe to incidents and receive incident status updates. > > - Full Stakeholders have read-only access to other data in your PagerDuty account. > > - Limited Stakeholders only have access to view and subscribe to [Internal Status Pages](/incident-management/communicate/internal-status-page), and do not see any other parts of PagerDuty. > > - Full Stakeholders and Limited Stakeholders cannot add, edit, or delete any objects in the account. > > - Both Stakeholder user licenses are available at a reduced price and are ideal for employees who need to be involved in internal incident communications but do not actively participate in the resolution effort. > > Contact the [Sales Team](https://www.pagerduty.com/contact-sales/) for more information about both types of Stakeholder users. ## Remove Subscribers from an Incident Either users assigned to an incident can remove incident subscribers, or subscribers can unsubscribe themselves. **Remove a Subscriber in the Web App** 1. Navigate to **Incidents** and select an incident's title to view its detail page. 2. Select the **Status Updates** tab. 3. Click the **Manage Subscribers** button. 4. In the list of **Subscribers**, find the user or Team you want to unsubscribe and click **Unsubscribe**.  **Remove a Subscriber in the Mobile App** 1. On the **Incidents** screen, select an incident to view its **Incident Details** screen. 2. Select the **Overview** tab and scroll to the **Latest Status Update** section. 3. Tap **Manage**. 4. Next to the subscriber's name, tap **Unsubscribe**. ## Status Updates Once subscribed to an incident, stakeholders will start receiving all subsequent status updates for that incident. A responder can perform the following: - Compose and publish an ad-hoc status update via the web or mobile app. - Send status updates as part of an Incident Workflow. - Send incident resolution notes as a status update - Send a status update or start an Incident Workflow Instance that sends a predefined message via the API. - Send status updates with rich text email notifications > **Required User Permissions:** - All users, with the exception of Limited and Full Stakeholders, can send status updates for incidents assigned to them. > - Only Responders, Managers, Global Admins, and Account Owners can send status updates for incidents that are not assigned to them. You can send status updates in different ways: **Send Status Updates via Web or Mobile App** Publishing an ad hoc status update on the web or mobile app is beneficial when the update is context-dependent. For example, if a status update needs to provide details about the nature of the incident, the current impact, or the estimated resolution time, for example: `P1 incident in progress. Customers cannot watch any archived video streams. Diagnosed as networking-related, but the underlying cause is still being determined. Estimated time to remediation is at least 60m. Next status update in 30m.` #### Send Status Updates via the Web App 1. Navigate to the **Incidents** page and click an incident's title to view the detail page. 2. In the **Status Updates** tab, enter or confirm the **Impacted Business Service** and/or desired **Subscribers**. 3. On the incident detail page, there are two ways to create a new status update: - In the actions menu, click **Send Status Update** _or_ - Select the **Status Updates** tab and click **New Update** 4. Select your desired template and click **Preview**. 5. Enter your **Message** for the status update and make any necessary changes to the template. **Note**: If you have [PagerDuty AI](/ai-automation/advance/user-guide#pagerduty-ai-for-status-updates), select **Generate** to automatically create a status update. You can also click **Settings** to enable or disable Chat data as a source for message creation. 6. Click **Send Update** when you are finished. > **Select a Business Service:** If you see a message that "This update will **not** be published to your status dashboard," ensure you have selected a business service in step 3, above. #### Send Status Updates via the Mobile App 1. In the **My Incidents** section, select an incident to view its detail screen. 2. Select the **Overview** tab, scroll to the **Latest Status Update** section, and tap **Post Status Update**. 3. On the **Add Status Update** screen, enter your status update message. 4. Tap to send the status update. > **Select a Business Service:** If you see a message "Update will not be shown on the status dashboard," it is most likely because a [business service is not selected](#select-a-business-service-in-the-mobile-app) or the [incident does not have a priority](#edit-incident-priority-in-the-mobile-app). ##### Select a Business Service in the Mobile App 1. In the **My Incidents** section, select an incident to view its detail screen. 2. Select the **Overview** tab, scroll to the section **Latest Status Update**, and tap **Post Status Update**. 3. On the **Add Status Update** screen, tap **Change**. 4. In the **Impacted Business Services** section, tap . 5. On the **Add Business Service** screen, select a business service. 6. Tap **Done** (iOS) or **Confirm** (Android). ##### Edit Incident Priority in the Mobile App 1. In the **My Incidents** section, select an incident to view its detail screen. 2. Select the **Overview** → scroll to the section **Latest Status Update**, and tap **Post Status Update**. 3. On the **Add Status Update** screen, tap **Change**. 4. In the **Priority** section, tap . 5. On the **Edit Priority** screen, select a priority business service and tap **Done** (iOS) or **Confirm** (Android) in the confirmation modal. **Send Status Update via Incident Workflows** You can send Status Updates as part of an Incident Workflow. Refer to [Send Status Update](/workflow-actions/pagerduty-incident-management/send-status-update) in the Workflow Actions library for more information. **Send Resolution Notes as a Status Update** When resolving an incident, responders can add a resolution note. They can also send this note to subscribers as a status update if: - The incident has subscribers, or it is visible on the [Internal Status Page](/incident-management/communicate/internal-status-page). - AND the incident is resolved from the PagerDuty [web app](/incident-management/incidents/overview#resolve-an-incident-via-web-app) as a single resolve (i.e., it was not resolved as part of a bulk action from the incident dashboard).  If you enable **Post resolution note as status update**, the note is sent to all incident subscribers, regardless of whether they were added via Incident Workflow or on demand through the UI. **Send Status Updates via API** Follow the API documentation to [publish a status update](/developer/api/reference/rest/incidents/create-incident-status-update) or [start an Incident Workflow Instance](/developer/api/reference/rest/incident-workflows/create-incident-workflow-instance) that publishes a predefined message via the API. **Send Status Updates Using Status Update Templates** Refer to the [Status Update Templates](/incident-management/communicate/status-update-templates) article for more information on customizing and standardizing your status updates. ## Status Update Notification Methods > **Note:** Status updates are sent to [subscribed](/incident-management/communicate/communicate-with-stakeholders#add-subscribers-to-an-incident) users depending on their status update notification rules. Currently, you cannot configure a time delay for status update notifications. For information on configuring status update notifications, refer to [Status Update Notifications](/account-admin/user-profile/notification-rules#when-an-incident-i-am-subscribed-to-has-a-status-update). You can see some examples for each notification method in the following. ### Push Status Update 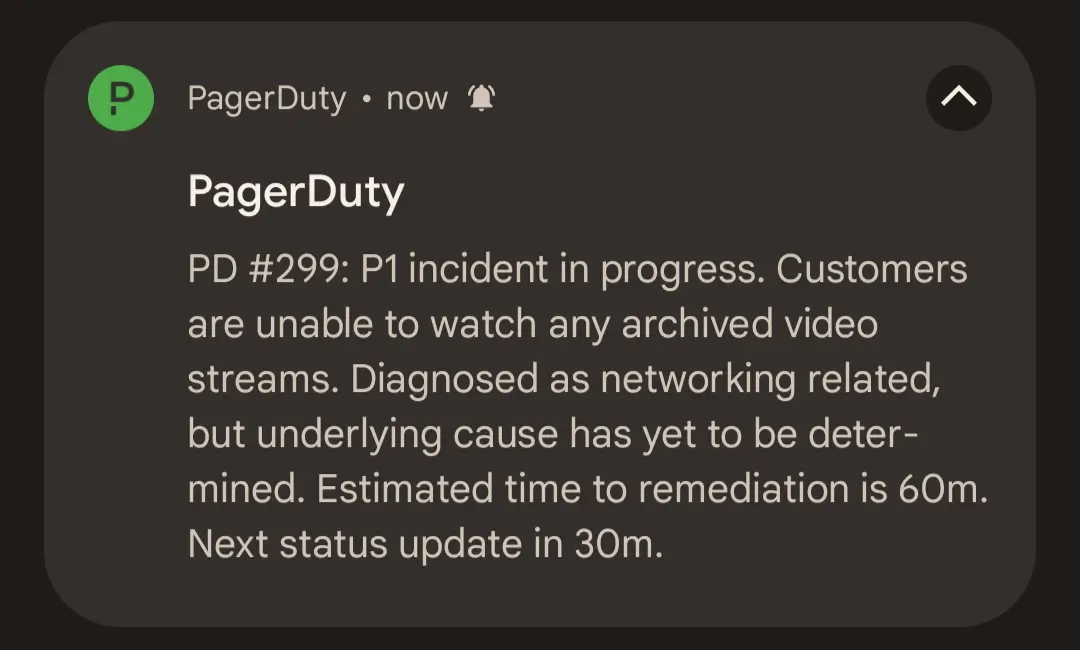 ### Email Status Update Status update emails contain the most information about an incident: - Who sent the status update - Incident number and description - When the incident was opened - The affected service - Incident status - A link to the incident status page 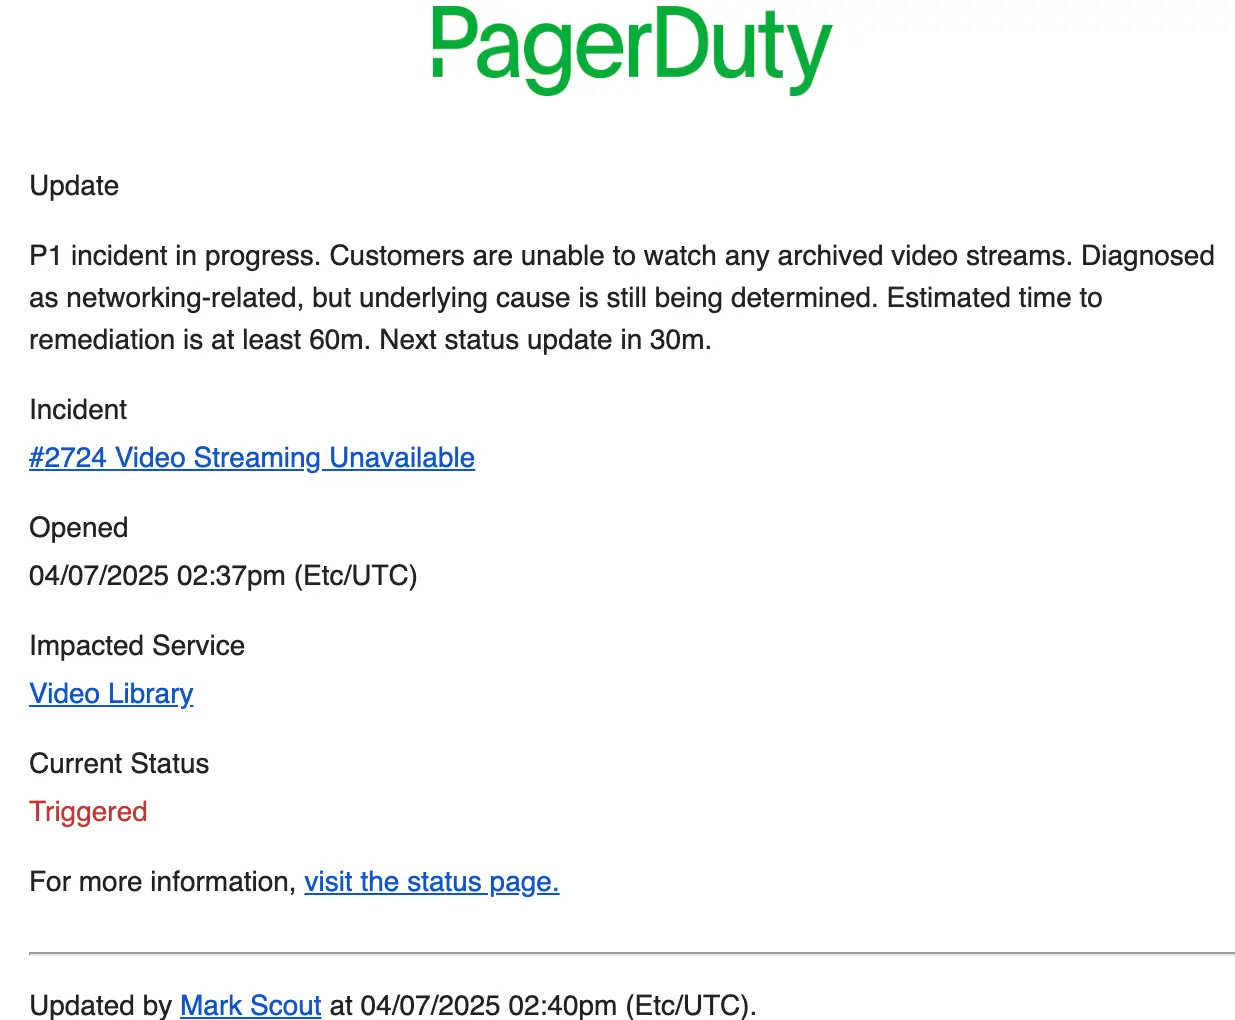 ### SMS Status Update 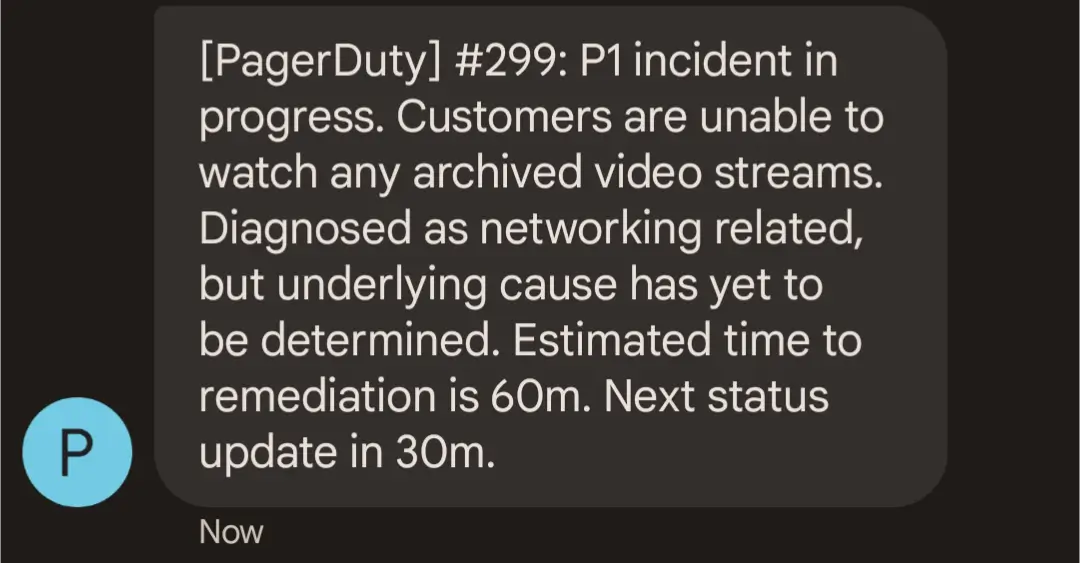 ### Internal Status Page Update In addition to the notification methods above, all status updates are posted to the [Internal Status Page](/incident-management/communicate/internal-status-page). For more information on how to view an incident on the status dashboard, visit [Status Updates](#status-updates). 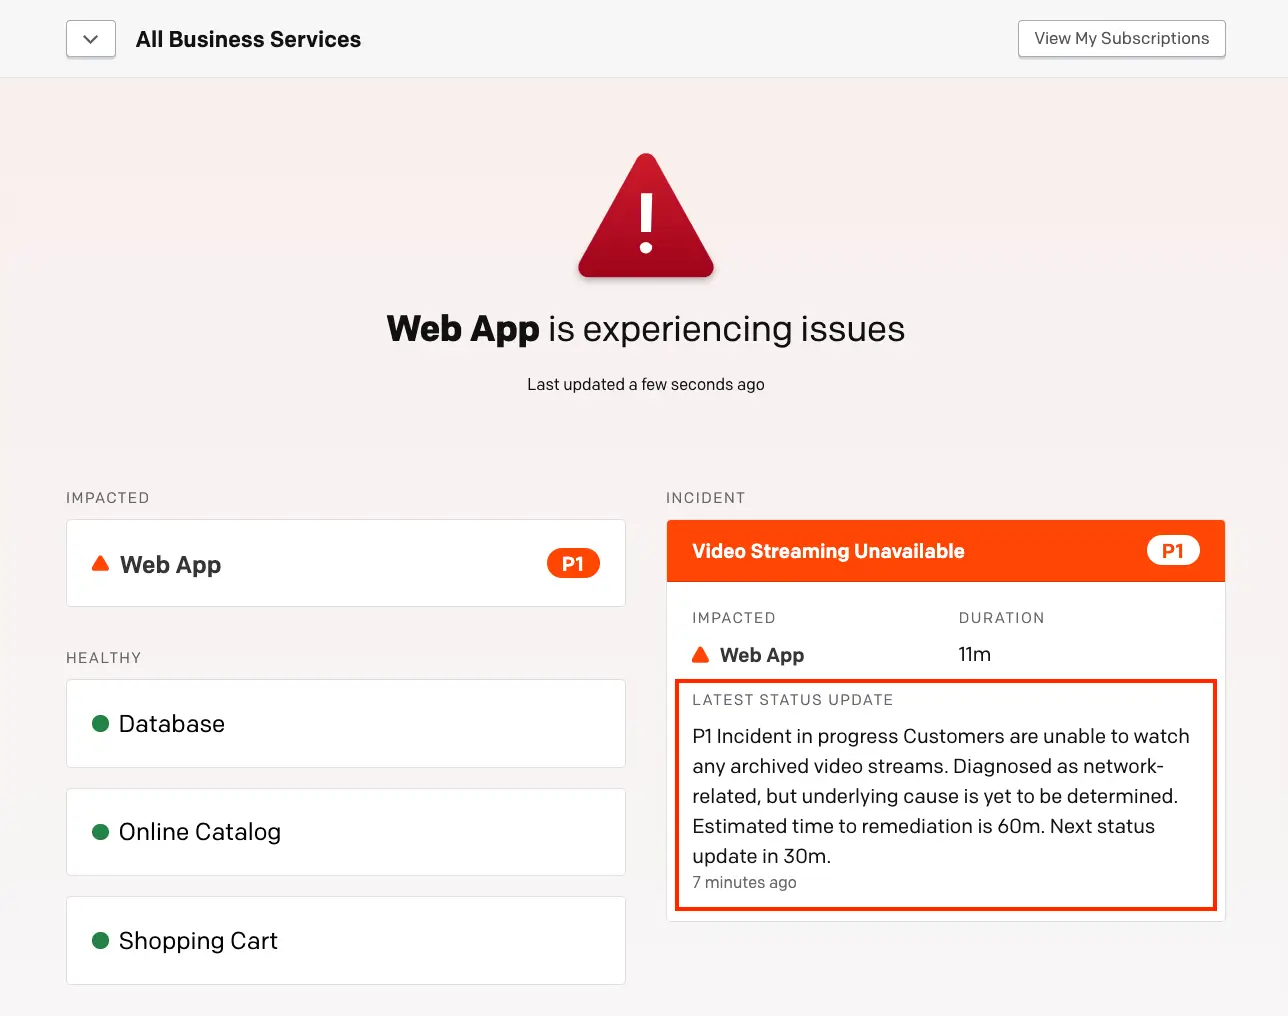 --- URL: https://docs.pagerduty.com/incident-management/communicate/communicate-with-stakeholders # Communicate with Stakeholders Provide stakeholders with proactive information about an incident's scope of impact and progress towards resolution Proactive stakeholder communications advise others on an incident’s status and scope of impact. When stakeholders receive proactive status updates, the primary response team can focus on resolution, rather than answering status inquiries, leading to more efficient incident response and improved MTTR. > **Availability:** This feature is available on current Business, Enterprise for Incident Management, and Digital Operations (Legacy) plans. Contact the [Sales Team](https://www.pagerduty.com/contact-sales/) to upgrade to a plan that includes this feature. ## Add Subscribers to an Incident PagerDuty offers multiple ways to add subscribers to incidents: **Add Subscribers to an Ongoing Incident** Users and Teams can subscribe to an active incident from the PagerDuty [web app](#add-subscribers-to-an-ongoing-incident-in-the-web-app) or the [mobile app](#add-subscribers-to-an-ongoing-incident-in-the-mobile-app). > **Unsubscribed Users:** If an individual user has already subscribed to an incident, either > individually or through a Team, and then unsubscribes from it, you cannot > resubscribe them as part of a Team or [as a group via Incident > Workflow](/workflow-actions/pagerduty-incident-management/add-stakeholders). You must either resubscribe them as > an individual user using the following instructions, or the user must > [resubscribe > themselves](/incident-management/services/business-services/subscription#subscribe-to-incidents). #### Add Subscribers to an Ongoing Incident in the Web App 1. Navigate to the **Incidents** page and select an incident's title to view its detail page. 2. Select the **Status Updates** tab. 3. Click the **Manage Subscribers** button. 4. In the **Add a User or Team** dropdown, search for and select users and teams to subscribe to the incident. 5. Click **Add Subscribers**. #### Add Subscribers to an Ongoing Incident in the Mobile App 1. Under **My Open Incidents**, select an incident's title to view its detail page. 2. Select the **Overview** tab. 3. Scroll to the **Latest Status Update** section and tap **Manage**. 4. On the **Add Subscribers** screen, tap in the top-right and search or select users or Teams to subscribe to the incident. Users and Teams are automatically subscribed as soon as you tap them. **Add Subscribers at Incident Creation** You can configure PagerDuty to automatically subscribe stakeholders whenever an incident triggers. You can subscribe up to 25,000 users to an incident. To automatically subscribe users: 1. [Create an Incident Workflow](/ai-automation/automation/incident-workflows#create-an-incident-workflow) that subscribes users and/or Teams. If you frequently subscribe the same sets of stakeholders to incidents, you can simplify this task by adding those groups to the Incident Workflow. 2. Associate the Incident Workflow with a PagerDuty service under the **Services that this rule applies to** section in the Workflow. > **Note:** Stakeholders do not receive a notification when they are subscribed to an > incident. This “silent subscription” allows you to subscribe stakeholders to > an incident at any time (for example, at incident creation) and then > explicitly choose to publish a status update if there is something noteworthy > to report. Thus, stakeholders only receive curated updates, which helps avoid > notification fatigue. **Subscribe to a Business Service** Users subscribed to a business service are added as subscribers whenever an incident impacts the business service. To learn more about subscribing to a business service, refer to [Business Service Subscription](/incident-management/services/business-services/subscription). > **Stakeholder Users:** - You can add any kind of PagerDuty user as an incident subscriber: Account Owner, managers, responders, and more. > - There are also special [Full Stakeholder](/account-admin/advanced-permissions#full-stakeholder-users) and [Limited Stakeholder](/account-admin/advanced-permissions#limited-stakeholder-users) user licenses available; these user roles are specifically designed to subscribe to incidents and receive incident status updates. > - Full Stakeholders have read-only access to other data in your PagerDuty account. > > - Limited Stakeholders only have access to view and subscribe to [Internal Status Pages](/incident-management/communicate/internal-status-page), and do not see any other parts of PagerDuty. > > - Full Stakeholders and Limited Stakeholders cannot add, edit, or delete any objects in the account. > > - Both Stakeholder user licenses are available at a reduced price and are ideal for employees who need to be involved in internal incident communications but do not actively participate in the resolution effort. > > Contact the [Sales Team](https://www.pagerduty.com/contact-sales/) for more information about both types of Stakeholder users. ## Remove Subscribers from an Incident Either users assigned to an incident can remove incident subscribers, or subscribers can unsubscribe themselves. **Remove a Subscriber in the Web App** 1. Navigate to **Incidents** and select an incident’s title to view its detail page. 2. Select the **Status Updates** tab. 3. Click the **Manage Subscribers** button. 4. In the list of **Subscribers**, find the user or Team you want to unsubscribe and click **Unsubscribe**.  **Remove a Subscriber in the Mobile App** 1. On the **Incidents** screen, select an incident to view its **Incident Details** screen. 2. Select the **Overview** tab and scroll to the **Latest Status Update** section. 3. Tap **Manage**. 4. Next to the subscriber's name, tap **Unsubscribe**. ## Status Updates Once subscribed to an incident, stakeholders will start receiving all subsequent status updates for that incident. A responder can perform the following: - Compose and publish an ad-hoc status update via the web or mobile app. - Send status updates as part of an Incident Workflow. - Send incident resolution notes as a status update - Send a status update or start an Incident Workflow Instance that sends a predefined message via the API. - Send status updates with rich text email notifications > **Required User Permissions:** - All users, with the exception of Limited and Full Stakeholders, can send status updates for incidents assigned to them. > - Only Responders, Managers, Global Admins, and Account Owners can send status updates for incidents that are not assigned to them. You can send status updates in different ways: **Send Status Updates via Web or Mobile App** Publishing an ad hoc status update on the web or mobile app is beneficial when the update is context-dependent. For example, if a status update needs to provide details about the nature of the incident, the current impact, or the estimated resolution time, for example: `P1 incident in progress. Customers cannot watch any archived video streams. Diagnosed as networking-related, but the underlying cause is still being determined. Estimated time to remediation is at least 60m. Next status update in 30m.` #### Send Status Updates via the Web App 1. Navigate to the **Incidents** page and click an incident’s title to view the detail page. 2. In the **Status Updates** tab, enter or confirm the **Impacted Business Service** and/or desired **Subscribers**. 3. On the incident detail page, there are two ways to create a new status update: - In the actions menu, click **Send Status Update** _or_ - Select the **Status Updates** tab and click **New Update** 4. Select your desired template and click **Preview**. 5. Enter your **Message** for the status update and make any necessary changes to the template. **Note**: If you have [PagerDuty AI](/ai-automation/advance/user-guide#pagerduty-ai-for-status-updates), select **Generate** to automatically create a status update. You can also click **Settings** to enable or disable Chat data as a source for message creation. 6. Click **Send Update** when you are finished. > **Select a Business Service:** If you see a message that “This update will **not** be published to your > status dashboard,” ensure you have selected a business service in step 3, > above. #### Send Status Updates via the Mobile App 1. In the **My Incidents** section, select an incident to view its detail screen. 2. Select the **Overview** tab, scroll to the **Latest Status Update** section, and tap **Post Status Update**. 3. On the **Add Status Update** screen, enter your status update message. 4. Tap to send the status update. > **Select a Business Service:** If you see a message “Update will not be shown on the status dashboard,” it is > most likely because a [business service is not > selected](#select-a-business-service-in-the-mobile-app) or the [incident does > not have a priority](#edit-incident-priority-in-the-mobile-app). ##### Select a Business Service in the Mobile App 1. In the **My Incidents** section, select an incident to view its detail screen. 2. Select the **Overview** tab, scroll to the section **Latest Status Update**, and tap **Post Status Update**. 3. On the **Add Status Update** screen, tap **Change**. 4. In the **Impacted Business Services** section, tap . 5. On the **Add Business Service** screen, select a business service. 6. Tap **Done** (iOS) or **Confirm** (Android). ##### Edit Incident Priority in the Mobile App 1. In the **My Incidents** section, select an incident to view its detail screen. 2. Select the **Overview** tab, scroll to the section **Latest Status Update**, and tap **Post Status Update**. 3. On the **Add Status Update** screen, tap **Change**. 4. In the **Priority** section, tap . 5. On the **Edit Priority** screen, select a priority business service and tap **Done** (iOS) or **Confirm** (Android) in the confirmation modal. **Send Status Updates via Incident Workflows** You can send Status Updates as part of an Incident Workflow. Refer to [Send Status Update](/workflow-actions/pagerduty-incident-management/send-status-update) in the Workflow Actions library for more information. **Send Resolution Notes as a Status Update** When resolving an incident, responders can add a resolution note. They can also send this note to subscribers as a status update if: - The incident has subscribers, or it is visible on the [Internal Status Page](/incident-management/communicate/internal-status-page). - AND the incident is resolved from the PagerDuty [web app](/incident-management/incidents/overview#resolve-an-incident) as a single resolve (i.e., it was not resolved as part of a bulk action from the incident dashboard).  _Incident resolution note_ If you enable **Post resolution note as status update**, the note is sent to all incident subscribers, regardless of whether they were added via Incident Workflow or on demand through the UI. **Send Status Updates via API** Follow the API documentation to [publish a status update](/developer/api/reference/rest/incidents/create-incident-status-update) or [start an Incident Workflow Instance](/developer/api/reference/rest/incident-workflows/create-incident-workflow-instance) that publishes a predefined message via the API. **Send Status Updates Using Status Update Templates** Refer to the [Status Update Templates](/incident-management/communicate/status-update-templates) article for more information on customizing and standardizing your status updates. ## Status Update Notification Methods > **Note:** Status updates are sent to > [subscribed](/incident-management/communicate/communicate-with-stakeholders#add-subscribers-to-an-incident) > users depending on their status update notification rules. Currently, you > cannot configure a time delay for status update notifications. For information > on configuring status update notifications, refer to [Status Update > Notifications](/account-admin/user-profile/notification-rules#when-an-incident-i-am-subscribed-to-has-a-status-update). > You can see some examples for each notification method in the following. ### Push Status Update  _Push notification status update_ ### Email Status Update Status update emails contain the most information about an incident: - Who sent the status update - Incident number and description - When the incident was opened - The affected service - Incident status - A link to the incident status page  _Email status update_ ### SMS Status Update  _SMS status update_ ### Internal Status Page Update In addition to the notification methods above, all status updates are posted to the [Internal Status Page](/incident-management/communicate/internal-status-page). For more information on how to view an incident on the status dashboard, visit [Status Updates](#status-updates).  --- URL: https://docs.pagerduty.com/incident-management/communicate/external-status-page # External Status Page Inform the public about your infrastructure's health External Status Pages offer public audiences a unified source of truth about your infrastructure’s health. You can customize this feature to fit your brand’s look and feel, and define different views and sets of [Business Services](/incident-management/services/business-services) to display. Visitors can stay informed about ongoing incidents and read status updates, or subscribe to your status page to receive notifications via email, Slack, or webhook. > **Availability:** External Status Pages are available on all plans and can be extended to include Private/Audience-specific pages or more subscribers with the add-on. Professional plans include one public page, and Business plans include one public and one private status page. > > Please contact our [Sales Team](https://www.pagerduty.com/contact-sales/) for pricing details, or if you would like to upgrade to the status page add-on. > > PagerDuty offers two Status Page packaging add-on options, one which includes Public Status Pages, and a premium package that also features [Private Status Pages](/incident-management/communicate/external-status-page/private-status-page) and [Audience-Specific Status Pages](/incident-management/communicate/external-status-page/private-status-page#audience-specific-status-page). Depending on the package you choose, features such as Page Subscribers, Premium Account Subscribers, and Total Account Subscribers may vary. > > | Pricing Plan | Subscribers | > | :----------- | :---------- | > | Professional | 250 | > | Business | 500 | > | Enterprise | 1000 | > > Please contact our [Sales Team](https://www.pagerduty.com/contact-sales/) for more information. > **Product Limits:** The number of status pages (public external page plus private external page) in an account cannot exceed the limit of 100.
The number of business services associated to an external status page cannot exceed the limit of 500. > **Looking for our Company Status Page?:** This article describes our External Status Page product, which you can use to build your own status pages. If you are looking for more information about the PagerDuty company status page at [status.pagerduty.com](https://status.pagerduty.com/), please read [PagerDuty Outage Notifications](/get-started/pagerduty-outage-notifications). ## Create an External Status Page > **Required User Permissions:** Users with the following base roles can configure an external status page: > > - Manager > - Global Admin > - Account Owner > > Users who create an External Status Page become the **Page Owner**. Page Owners can [edit](#edit-an-external-status-page) their own status pages or [delete](#delete-a-draft-status-page) their own drafts. Account Owners can edit any status page and delete any draft. > **Prerequisites and Product Limits:** - External Status Pages rely on [Business Services](/incident-management/services/business-services) to automatically notify users when there is a service degradation. After you have configured [service dependencies](/incident-management/services/business-services#supporting-services), information about impacted business services will appear on the External Status Page. > - By default, an incident with a [priority](/incident-management/incidents/incident-priority) of **P1** or **P2** will be considered an "impacting" incident. You can [adjust this setting](/incident-management/services/business-services#edit-business-services-settings) to restrict or include a wider set of incident priorities, depending on your organization's needs. > - Incident priority is an account-wide setting, and will apply to both [Internal Status Pages](/incident-management/communicate/internal-status-page) and External Status Pages. Incident priority can also be configured via the [REST API](/developer/api/reference/rest/business-services/put-business-service-priority-thresholds). > - You can create up to **100** status pages. 1. In the PagerDuty web app, navigate to **Status** → **External Status Page**. 2. Click **New Status Page**. 3. In the section **Status Page Type**, make a selection: **Public** or **Private**. 1. **Note**: Depending on the features in your account, this option may not be available. 4. Enter a descriptive **Name** for your status page. In the **Simple URL** field, create a unique public subdomain that your users can access. - **Note**: After you've published an external status page, you will have the option to set a **Custom URL**, which will determine the web address where your status page can be accessed, and will also be used for the sender address when email notifications are sent to status page subscribers. Please see the section [Configure DNS Records](#configure-dns-records) for more information. 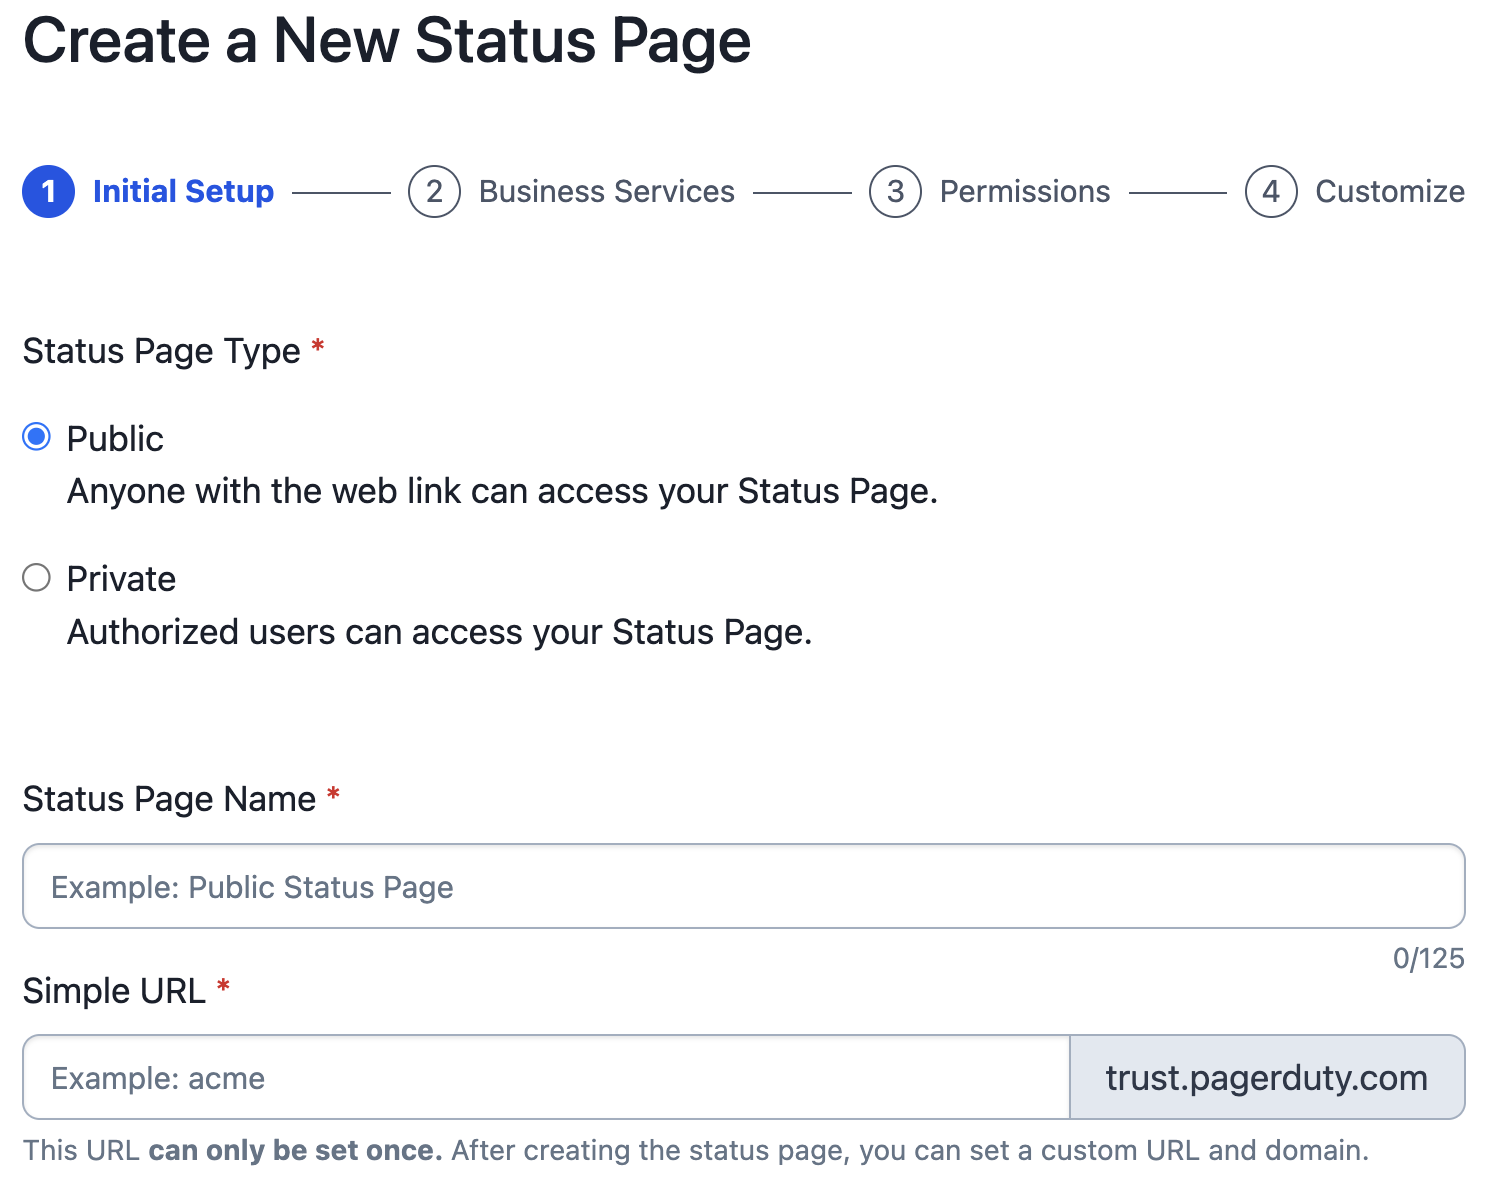 *Create a new status page* > **Simple URL:** The **Simple URL** cannot be changed after you have saved or published an external status page. Please take a moment to confirm that you've entered your **Simple URL** correctly. 5. Click **Next**. 6. In the **Business Services** section, select the [Business Services](/incident-management/services/business-services) that you’d like to display on your status page by clicking next to each. Selected business services will be shown in the right column. To deselect them, click . You can add up to 500 business services per status page. Once you’re ready, click **Next**. - _Optional_: You can organize business services into groups: 1. Click **Add Group**, enter a **Group Name** and click . 2. Click and hold next to a business service's name, drag it over the group's name, and release. 3. Click the expand arrow (e.g., /) to show/hide the business services in a group. - _Optional_: Click **Edit Display Names** to adjust your business services' public-facing names. This can be useful if you do not wish to disclose internal naming conventions, or to display a name that the public would better understand. 7. The **Permissions** section allows you to define which [Teams](/account-admin/teams) and user roles can post incident status messages on the status page, which Teams can edit the status page, whether posts require approval, and whether you'd like to automate posts when an incident affects a business service. Make your selection in each of the following sections: | Section | Instructions | | :------------------------------------- | :--------------------------------------------------------------------------------------------------------------------------------------------------------------------------------------------------------------------------------------------------------------------------------------------------------------------------------------------------------------------------------------------------------------------------------------------------------------------------------------------------------------------------------------------------- | | Teams that can manage the Status Page | From the dropdown, select which **Team(s)**, besides the original creator, can edit or delete the Status Page. | | Create Post | Select which PagerDuty [base roles](/account-admin/advanced-permissions#base-roles) can create posts for the External Status Page: **Global Admin**, **Manager**, **Responder**, **Observer** and/or **All of these roles**. | | Teams that can post to the Status Page | Select which [Teams](/account-admin/teams) can post new incidents or updates to the status page. | | Automated Incident Posts | This enables whether an automated status page post is published when the status of an incident changes (triggered, acknowledged, resolved) on an included business service. If approval is required to post messages, the incident will need to be approved before it is posted. **Note**: If enabled, this option will override the [Post to External Status Page](/workflow-actions/pagerduty-incident-management/post-to-external-status-page) incident workflow action for that status page. In this case, the incident workflow action will not run. | | Posts Approval | Select **Approval is required to post messages** or **No approval is needed to post messages**. If you select **Approval is required to post messages**, please select up to 15 users from the dropdown; these users will be able to [review a draft of the message](#approve-a-status-update) before it is posted on the status page. | 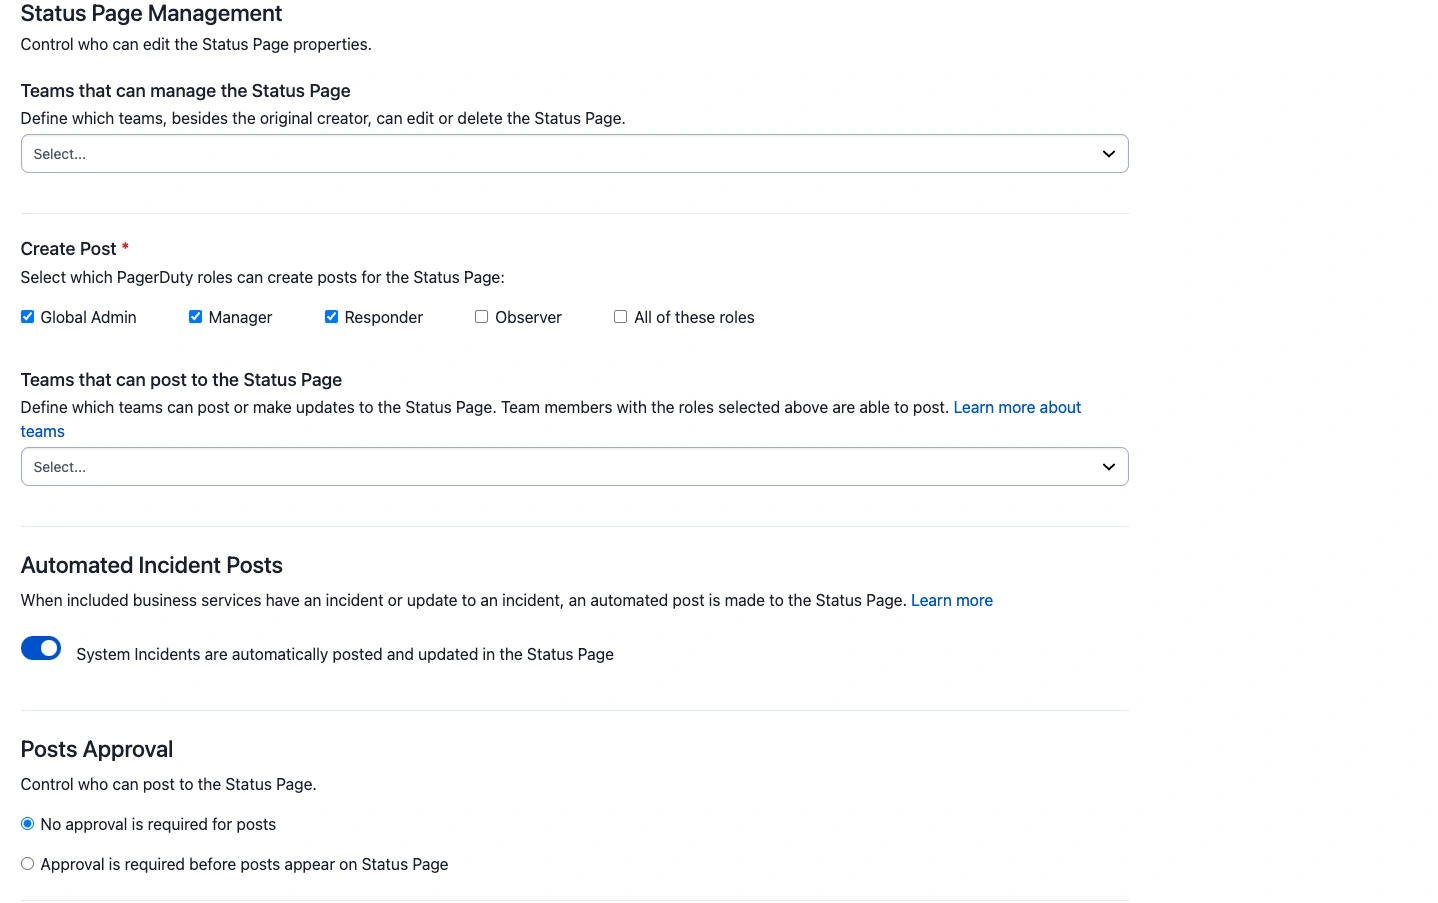 *Example status page permissions* 7. Click **Next**. 8. In the **Theme** tab of the **Customize** section, you can set the color palette, and upload your organization's logo and a favicon that will be displayed on the browser tab. 9. In the **Status Page** tab, you can _optionally_ add an image to the header and footer, set up a navigation bar, and you can include relevant links to your status page. - If you'd like to hide the **Subscribe** button on the public-facing status page, in the section **Navigation Bar** → **Subscribe Button**, move the toggle to **No**. 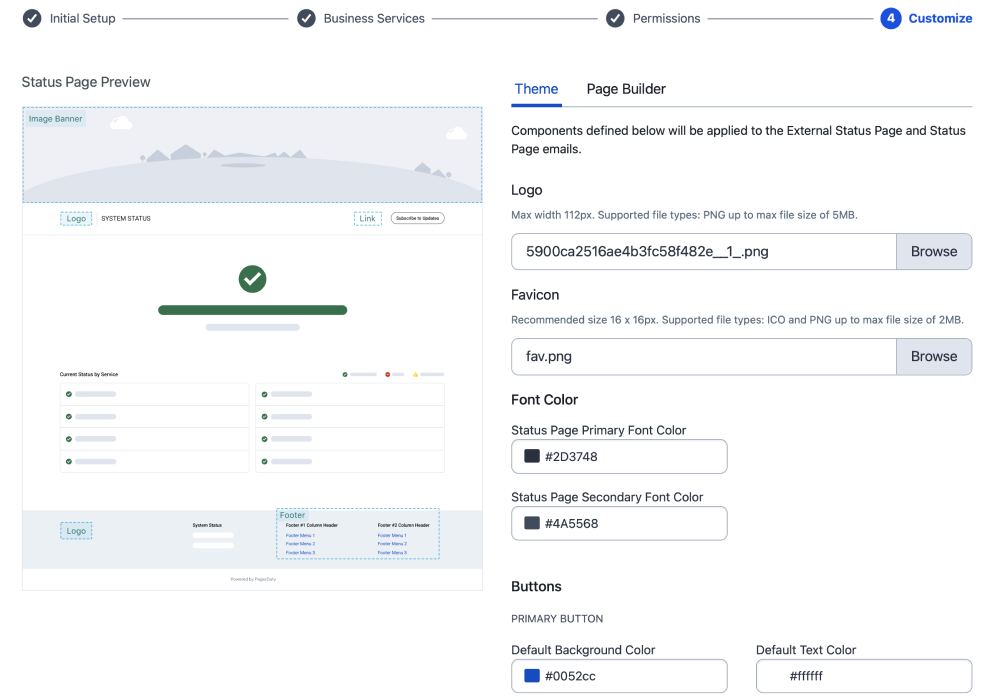 *Customize status page* 10. Click **Publish**. - _Optionally_, if you’re not ready to publish your status page, click **Save as Draft** in the bottom-left corner. ### Configure DNS Records After you publish an external status page, you can configure a **Custom URL**, which will be used for the sender address when email notifications are sent to status page subscribers. PagerDuty will generate a set of DNS records, each of which must be verified with your DNS provider. 1. Navigate to **Status** → **External Status Page**. 2. Click next to the desired **published** status page and select **Edit**. 3. In the field **Custom URL**, enter your desired domain. > **Custom URL:** The **Custom URL** cannot be changed after you have saved or published an external status page. Please take a moment to confirm that you've entered your **Custom URL** correctly. > > If you plan on migrating a custom URL that's currently in use with another status page solution, and you want to decrease downtime, please reach out to us at [support@pagerduty.com](mailto:support@pagerduty.com). 4. Click **Submit Custom URL**. 5. Using the information in the section **DNS Records**, add each record in your provider's administration console. 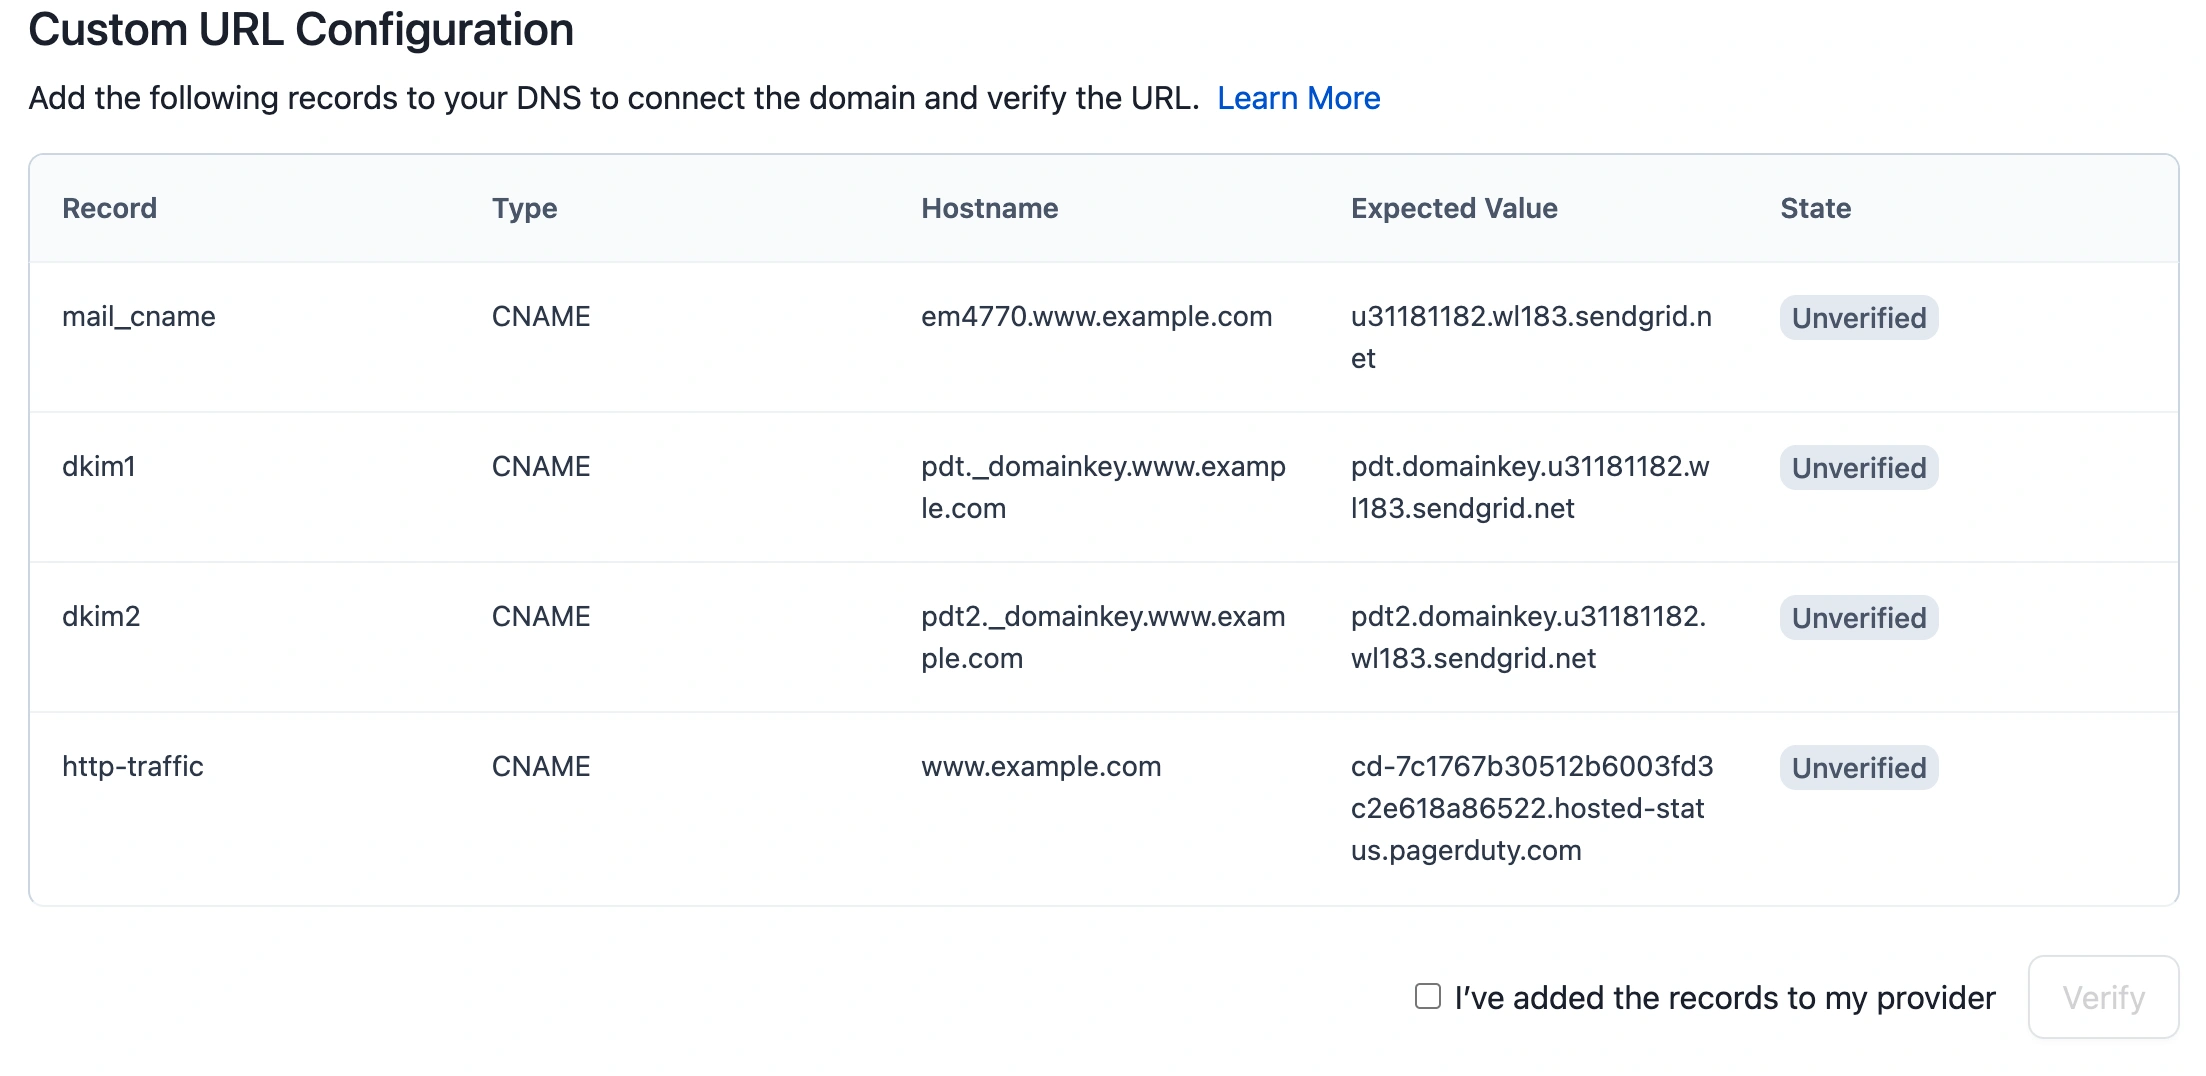 *Example DNS records* ### Why We Require These Records - `mail_cname, dkim`: Allows PagerDuty to authenticate emails on behalf of your domain. - `tls-certificate`: Allows PagerDuty to issue a TLS certificate for your domain to secure your Status Page with SSL/TLS. - `http-traffic`: Redirects users to the Status Page. 6. Check the box **I’ve added the records to my provider** and click **Verify Records**.  *Verify records* After successful verification, the tag in the **State** column will change from **Unverified** to **Verified**. Depending on your DNS provider, record validation may take anywhere from a few minutes up to one or more days. Please refer to your DNS provider's documentation for more information about adding DNS records and troubleshooting. ### View an External Status Page PagerDuty users can view an external status page by navigating to its unique public URL (e.g., `https://subdomain.trust.pagerduty.com`), or in the PagerDuty web app by navigating to **Status** → **External Status Page** and selecting a status page's **title** from the list. ### Edit an External Status Page > **Required User Permissions:** Only the Page Owner (i.e., the user who created the status page draft), the Account Owner, and members of a Team with edit access can edit a status page. 1. Navigate to **Status** → **External Status Page**. 2. Click next to the desired status page and select **Edit**. 3. On the first page you can make changes to your **Status Page Name**. Click **Next** at bottom left to continue on to edit **Business Services**, **Permissions** and **Customize** settings. 4. When ready, click **Publish**. ### Publish a Draft Status Page 1. Navigate to **Status** → **External Status Page**. 2. Click next to the desired status page and select **Publish**. ### View Incidents You can see ongoing and resolved incidents, as well as pending communication approvals related to each of your External Status Pages. 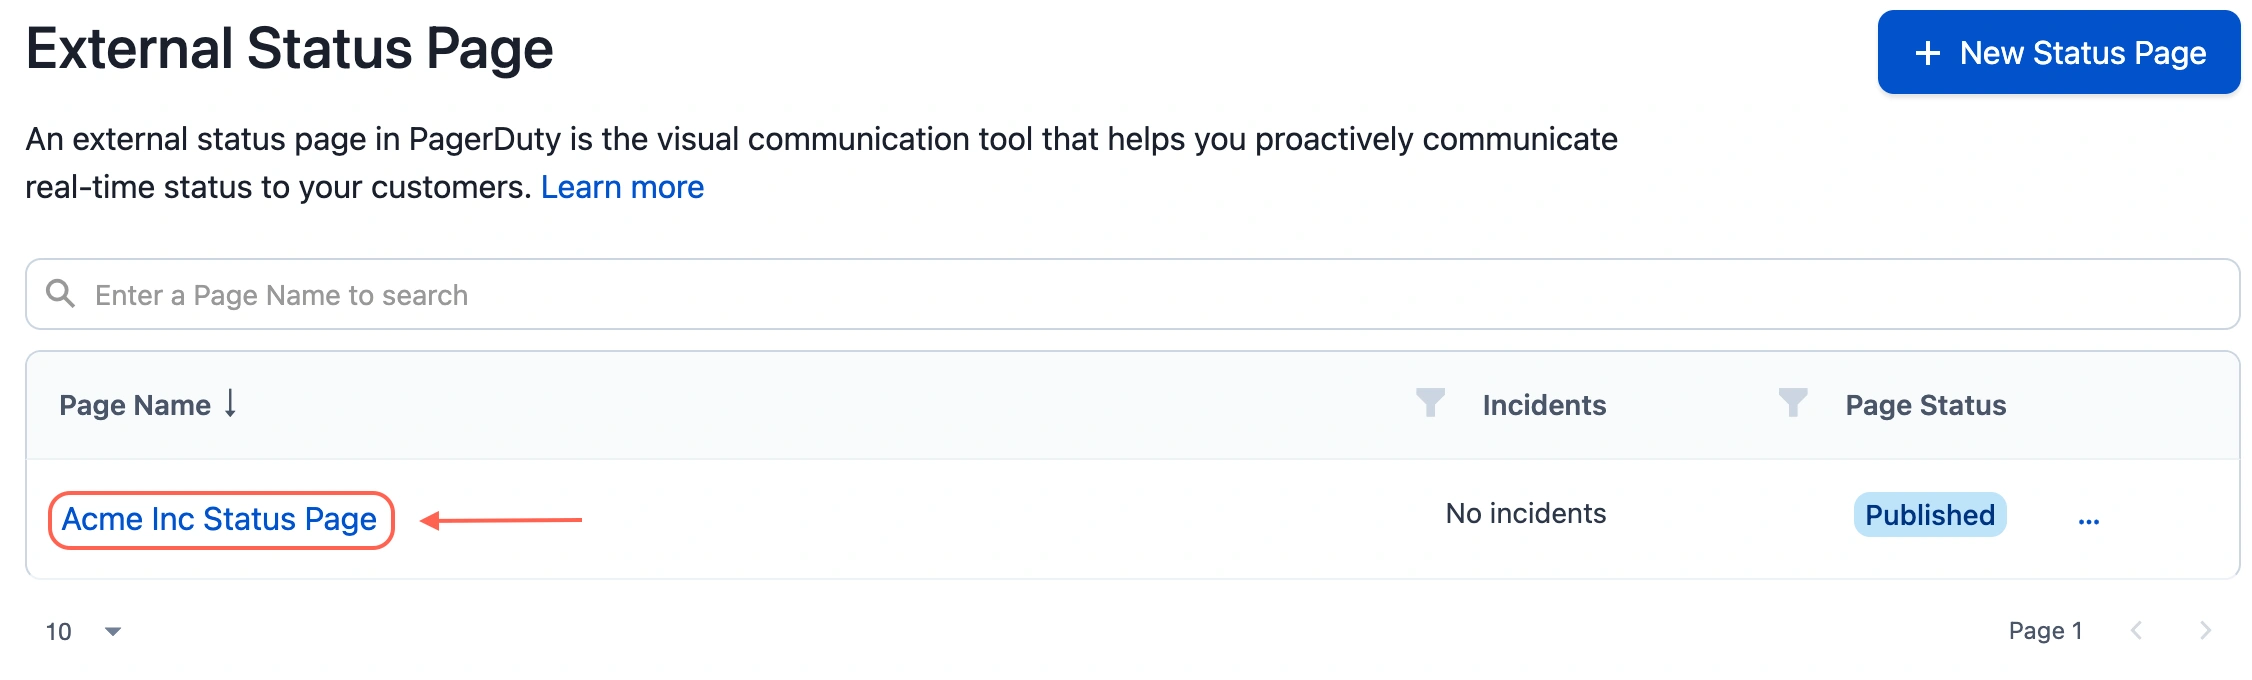 *View incidents* 1. Navigate to **Status** → **External Status Page**. 2. Click on the status page name.
a. Use the **Ongoing Incidents** tab to gain awareness of the incidents that are currently impacting the Business Services related to this External Status Page.
b. The **Resolved Incidents** tab will let you see the history of past incidents.
c. The **Pending Approvals** tab will display ad-hoc communications that [need to be approved](#approve-a-status-update) in order to be published on your External Status Page.
d. Click **New Incident** to manually trigger a new incident in order to notify your user base about an issue. ### Configure an External Status Page You can customize the metrics display on your status page. The status page uptime metrics calculation is based on major and minor outages, and their durations. Maintenance windows are reflected in the metrics but are not included in the uptime calculation. 1. Navigate to **Status** → **External Status Page** and select your preferred status page. 2. In the left pane, click next to **Configuration** and select **Metrics**. 3. From the dropdown, select your preferred **time period** to preview status page metrics. 1. **Don't display** (default) 2. **Last 90 days** 3. **Last 30 days** 4. **Last 7 days** 4. Click **Save**. 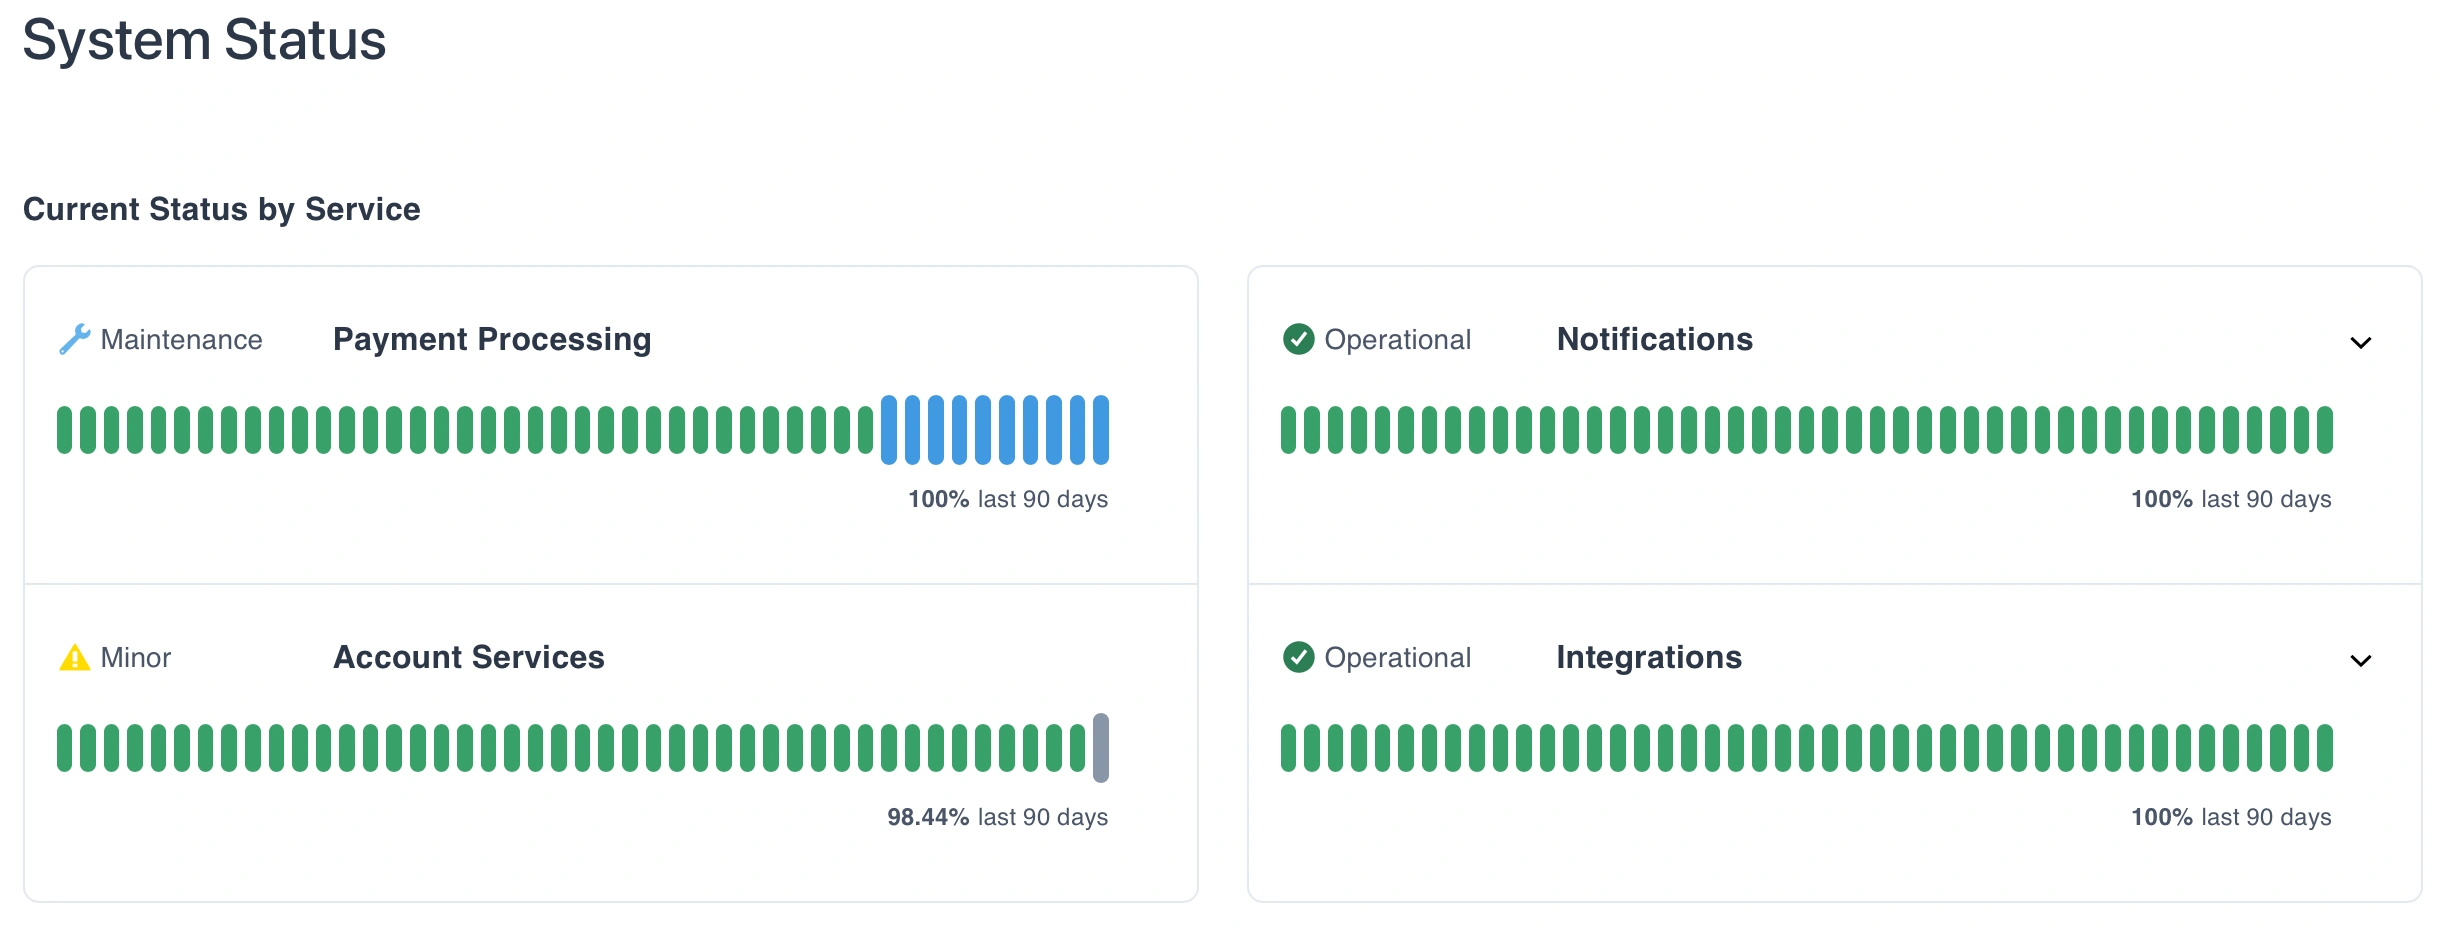 *External status page metrics*
The uptime percentage is calculated based on the duration of partial or significant outage incidents on the external status page. For example, using the last 90 days option, if an incident occurred and lasted 1 hour, we would have 2159 hours of uptime out of 2160 total hours. This would equal 99.9% of uptime. In other words: _Hours of uptime Total hours 100 = Uptime percentage_ The number of bars will adapt to the screen size with each bar representing a specific timeframe. For example, a 13” screen display would show the following for the available time periods: - For 90 days, each bar represents 2 days. - For 30 days, each bar represents 1 day. - For 7 days, each bar represents roughly 4 hours and 20 minutes. ### Set a Status Page Timezone When status page email notifications always show times in UTC, subscribers have to convert incident and maintenance times to their own timezone. You can set a timezone for each status page, and subscriber email notifications will show incident and maintenance timestamps in that timezone, with its abbreviation (for example, "2:00 PM CDT"). > **Required User Permissions:** Users with the following base roles can set a status page timezone: > > - Manager > - Global Admin > - Account Owner 1. Navigate to **Status** → **External Status Page** and select your preferred status page. 2. In the left pane, click next to **Configuration** and select **Timezone**. 3. From the **Notification timezone** dropdown, select your preferred timezone. Your account's timezone is labeled **(Account default)**. A preview below the dropdown shows how timestamps will appear in email notifications. 4. Click **Save**.  *External status page timezone setting* > **Default Timezone:** New status pages use your PagerDuty account's [timezone](/account-admin/time-zone-settings) by default. Existing status pages keep using UTC until you set a timezone. #### How Timezones Display Across Channels The timezone you set for a status page applies only to subscriber email notifications. Other channels display timestamps as follows: | Channel | Timestamp Display | | :--- | :--- | | Email | Timestamps use the status page's timezone, with its abbreviation. | | Slack | Timestamps use each subscriber's local Slack timezone. | | Webhook | Timestamps in webhook payloads always use UTC. | | Public status page | Timestamps use each viewer's local browser time. | ### Delete an External Status Page > **Required User Permissions:** Only the Page Owner (i.e., the user who created the status page draft), the Account Owner, and members of a Team with edit access can delete a status page. 1. Navigate to **Status** → **External Status Page**. 2. Click on the name of the status page that you wish to delete. 3. Click button in the sidebar at the left side of the page. 4. Select **Delete Status Page**. 5. Confirm the deletion by typing "delete" in the modal window and click **Delete**. ## Status Page Incidents Status Page Incidents are different from other [Incidents](/incident-management/incidents/overview) you or your monitoring tools may trigger on technical services. Status Page Incidents are bound to the status page only and are meant to be used to publish status updates and inform your external audience of the current status of an internal incident. > **Prerequisite:** In order to post Status Page Incidents, incident [Priority](/incident-management/incidents/incident-priority), an account-level setting, must be enabled. 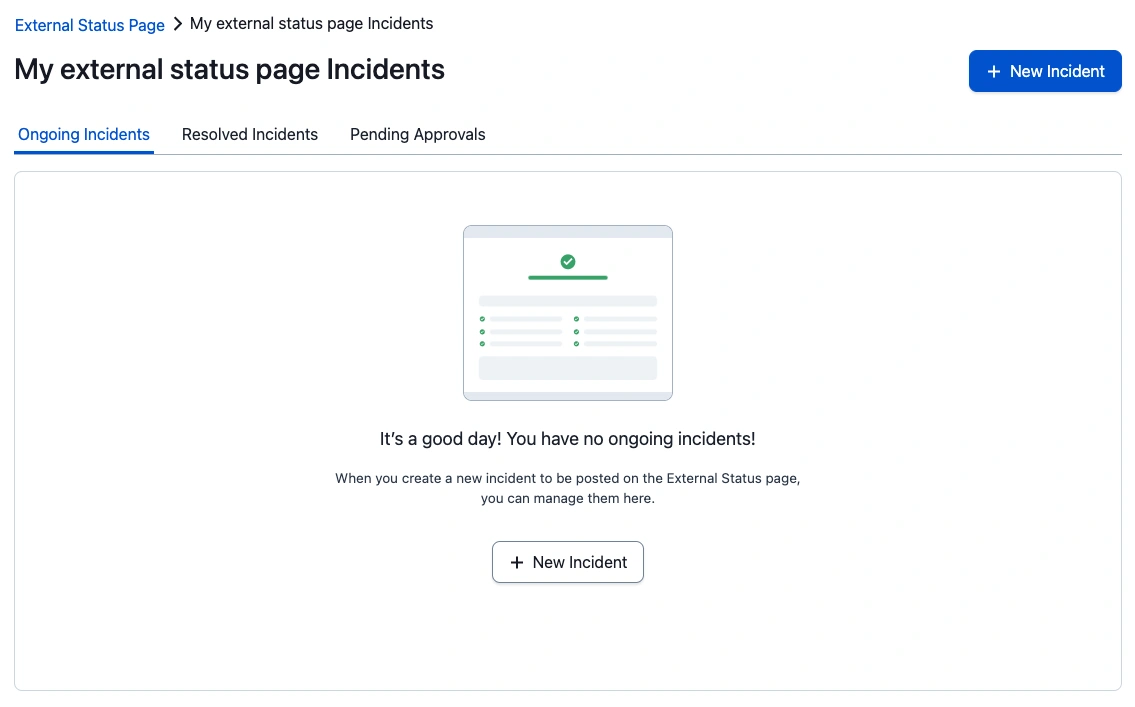 *Status Page Incidents* > **Post Limits:** - Posts have a character limit of 5000 characters. > > - You can have a maximum of 500 ongoing posts per status page. This includes both incident and maintenance posts. > > - You can create up to 1000 posts per status page per month. ### Create a Status Page Incident 1. Navigate to **Status** → **External Status Page**. 2. Click on the **name** of the desired status page. 3. Click **New Incident**. 4. Select the incident status: 1. **Detected**: We've identified an issue and it's under investigation. 2. **Investigating**: The incident is still under investigation, and efforts to resolve it are underway. 3. **Resolved**: We've resolved the incident and resumed normal operations. 1. **For Automated Incidents**: 2. **Detected**: Maps to the **Triggered** status of the linked technical incident. 3. **Investigating**: Maps to the **Acknowledged** status of the linked technical incident. 4. **Resolved**: Maps to the **Resolved** status of the linked technical incident. 5. Give the Status Page Incident a descriptive **Title** and write an initial **Message** for External Status Page subscribers and visitors. The **Message** field supports rich text, including hyperlinks. To add a hyperlink to a message, highlight the text your preferred text, then right-click and click **Link**, to fill out the URL and other information.
**Optional**: Set the Incident start time to reflect when impact began. You can backdate the start time so the public timeline matches the actual impact window with the Published Time field 6. Select the **Impacted Business Services**. 7. Select the level of impact: **All Good**, **Major**, or **Minor**. 8. _Optional_: Let users know the estimated **Time till Next Update**. 9. _Optional_: Check the **Send update notifications to subscribers** checkbox to send notifications. 10. Click **Post** to post the incident. 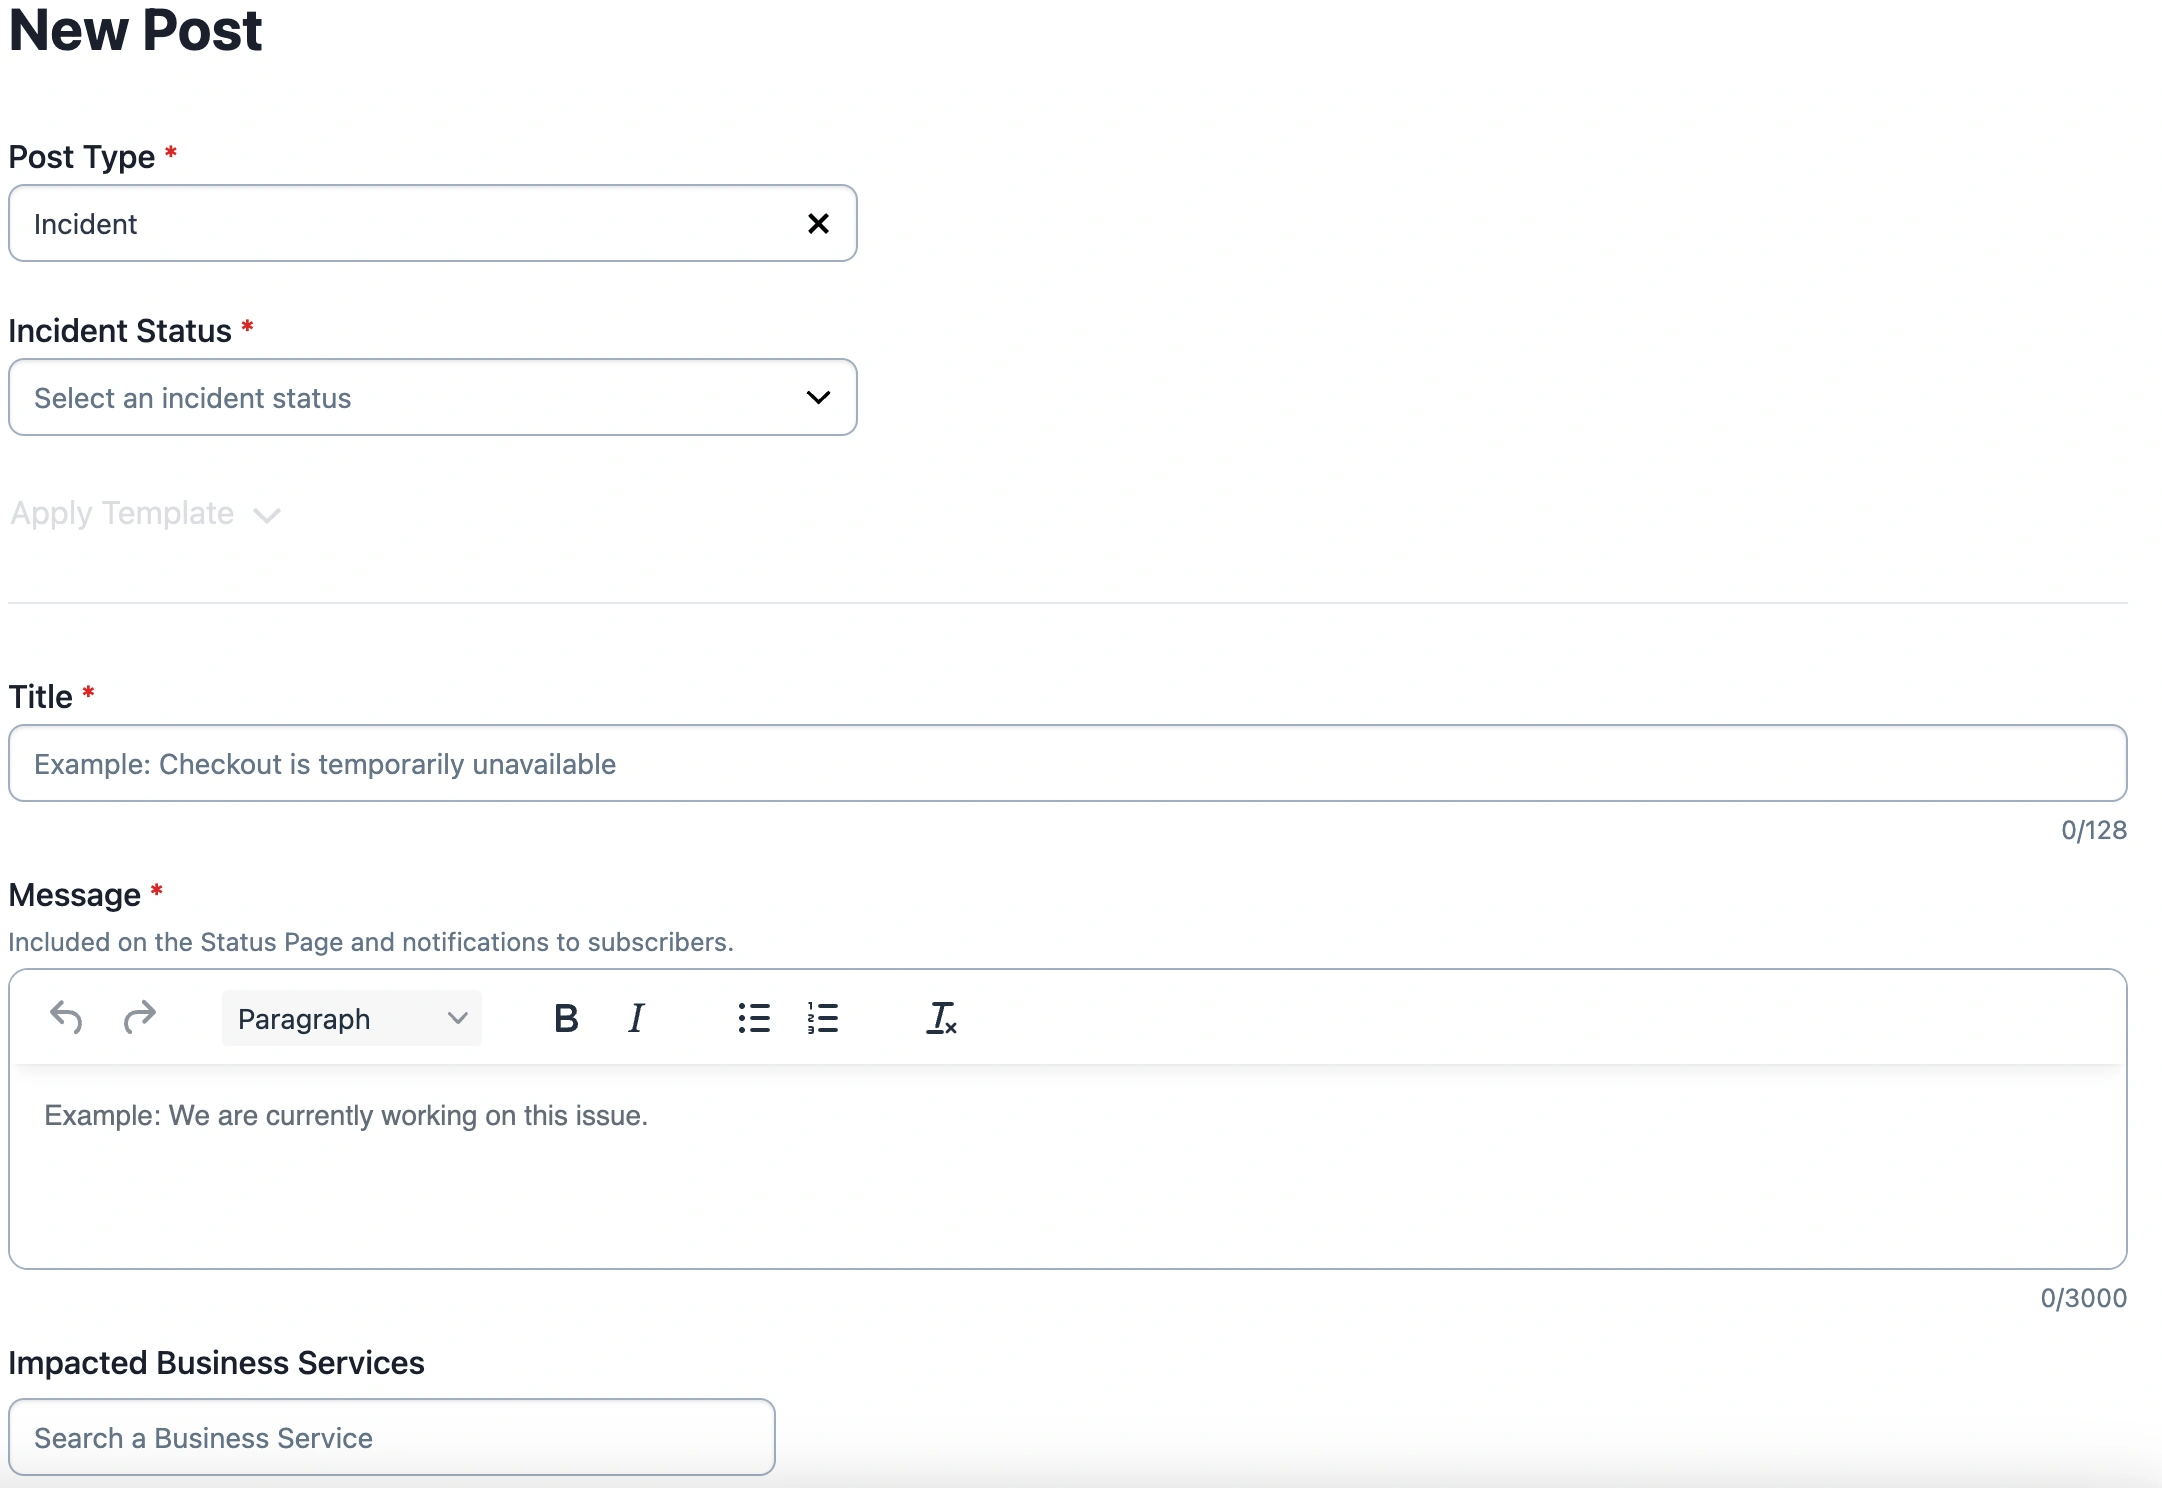 *Create a Status Page Incident* **Note**: External Status Pages refresh automatically when new posts or updates are published. No manual reload is required.
### Publish a Status Update To publish a new status update you’ll need to have an open [Status Page Incident](#create-a-status-page-incident) or a regular [incident](/incident-management/incidents/overview) that is impacting a [Business Service](/incident-management/services/business-services). > **Status Update Limit:** You can add up to 50 status updates per post. 1. Navigate to **Status** → **External Status Page**. 2. Click on the **name** of the desired status page. 3. In the open incidents list, click to the right of the desired incident and select **New Update**. 4. Select the **Post Status**. 5. Write a **Message** for your External Status Page subscribers and visitors. 6. Select the **Impacted Business Services**. 7. Select the level of impact: **All Good**, **Major**, or **Minor**. 8. _Optional_: Let users know the estimated **Time till Next Update**. 9. _Optional_: Check the **Send update notifications to subscribers** checkbox to send notifications. 10. Click **Update** to publish the status update. 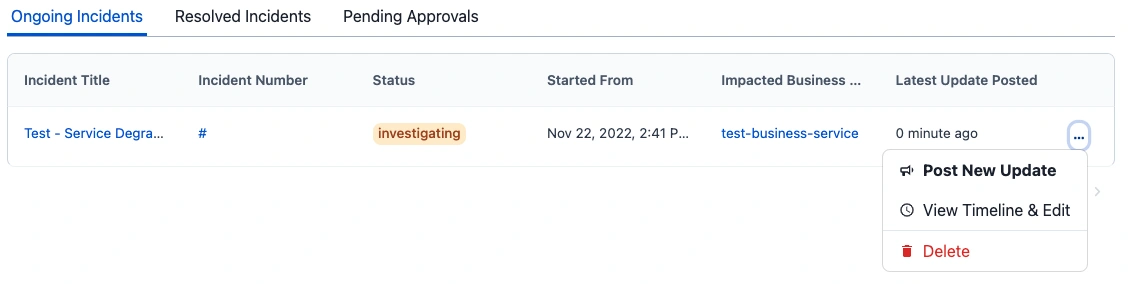 *Publish a status update* #### Approve a Status Update When a status update requires approval, named approvers will receive an email notification, a banner will appear on a status page's Incidents screen, and the **Pending Approvals** tab will also indicate that there are updates that need review.  *Pending status updates banner* Users with appropriate permissions can approve pending status updates in the web app: 1. Navigate to **Status** → **External Status Page**. 2. Click on the **name** of the desired status page. 3. Select the **Pending Approvals** tab. 4. Click next to the status update and select **Review Post**. 5. Review the details of the status update and click **Publish**. #### Reject a Status Update While following the [approval steps above](#approve-a-status-update), you also have the option to **Reject** a status update. Click **Reject** and confirm your decision in the modal by clicking **Yes, delete**. > **Rejected Status Updates:** Rejected status updates cannot be retrieved, and this action cannot be undone.  *Reject a status update* ### Edit a Status Update Your users can add information or make changes to existing status updates. 1. Navigate to **Status** → **External Status Page**. 2. Click on the **name** of the desired status page. 3. In the open incidents list, click next to the desired incident and select **Edit Timeline**. 4. Locate the status update that you need to update and click next to it. Make the necessary changes and click **Update**. 5. If you need to edit the impacted services, click icon under **Business Services Impacted**, select the desired business services, and then click **Update**. ## Add a Postmortem to a Status Page You can add public postmortems to any resolved External Status Page incident to share with your customers. To add a postmortem to a resolved External Status Page incident: 1. Navigate to **Status** → **External Status Page** and then select your preferred **status page**. 2. You will be directed to the **Posts** → **Incidents** page by default. Select the **Resolved** tab, click menu to the right of the incident, and then select **Add Postmortem**. 3. Enter your postmortem in the **Message** field. You may use the text formatting options above to format your postmortem message. 4. Once you are finished entering your postmortem message, under **Notifications** you may _optionally_ select the checkbox to **Send update notifications to subscribers**. 5. Please note that once posted, postmortems will be published immediately, independent of any configured approval flow you may have for your page. When you are sure that you would like to proceed, click **Post**. ### Edit an External Status Page Postmortem To edit an External Status Page postmortem that has already been posted: 1. Navigate to **Status** → **External Status Page** and then select your preferred **status page**. 2. You will be directed to the **Posts** → **Incidents** page by default. Select the **Resolved** tab, click menu to the right of the incident and then select **Edit Postmortem**. 3. Edit the postmortem in the **Message** field. You may use the text formatting options above to format your postmortem message. 4. Once you are finished editing your postmortem message, under **Notifications** you may _optionally_ select the checkbox to **Send update notifications to subscribers**. 5. Please note that once posted, postmortems will be published immediately, independent of any configured approval flow you may have for your page. When you are sure that you would like to proceed, click **Update**. ### Delete an External Status Page Postmortem To delete an External Status Page postmortem that has already been posted: 1. Navigate to **Status** → **External Status Page** and then select your preferred **status page**. 2. You will be directed to the **Posts** → **Incidents** page by default. Select the **Resolved** tab, click menu to the right of the incident and then select **Edit Postmortem**. 3. At the bottom right, click **Delete**. A confirmation modal will appear, notifying you that this action cannot be undone and that subscribers are not notified of deleted posts. When you are ready to proceed, click **Delete** again. ## Scheduled Maintenance Notices You may let your users know about upcoming or ongoing maintenance windows for any components of your application or infrastructure. The external status page allows you to schedule maintenance notices, select the affected business services, and post updates. > **Post Limits:** You can have a maximum of 500 ongoing posts per status page. This includes both incident and maintenance posts. ### Post a Maintenance Notice 1. Navigate to **Status** → **External Status Page**. 2. Click on the **name** of the desired status page. 3. On the left sidebar, select **Maintenance** under **Posts**. 4. Click **Post Maintenance**. 5. Select the **Post Status**: **Scheduled**, **In progress**, or **Completed**. 6. Write a **Title** for your notice and a **Message** describing the maintenance. Visitors and subscribers will see this text. 7. In the section **Scheduled Maintenance Time**, use the date and time pickers to select start and end times. 8. Select the **Impacted Business Service(s)**. 9. In the **Notifications** section, check or uncheck the box depending on whether you'd like to notify subscribers about the maintenance. 10. Click **Post**. 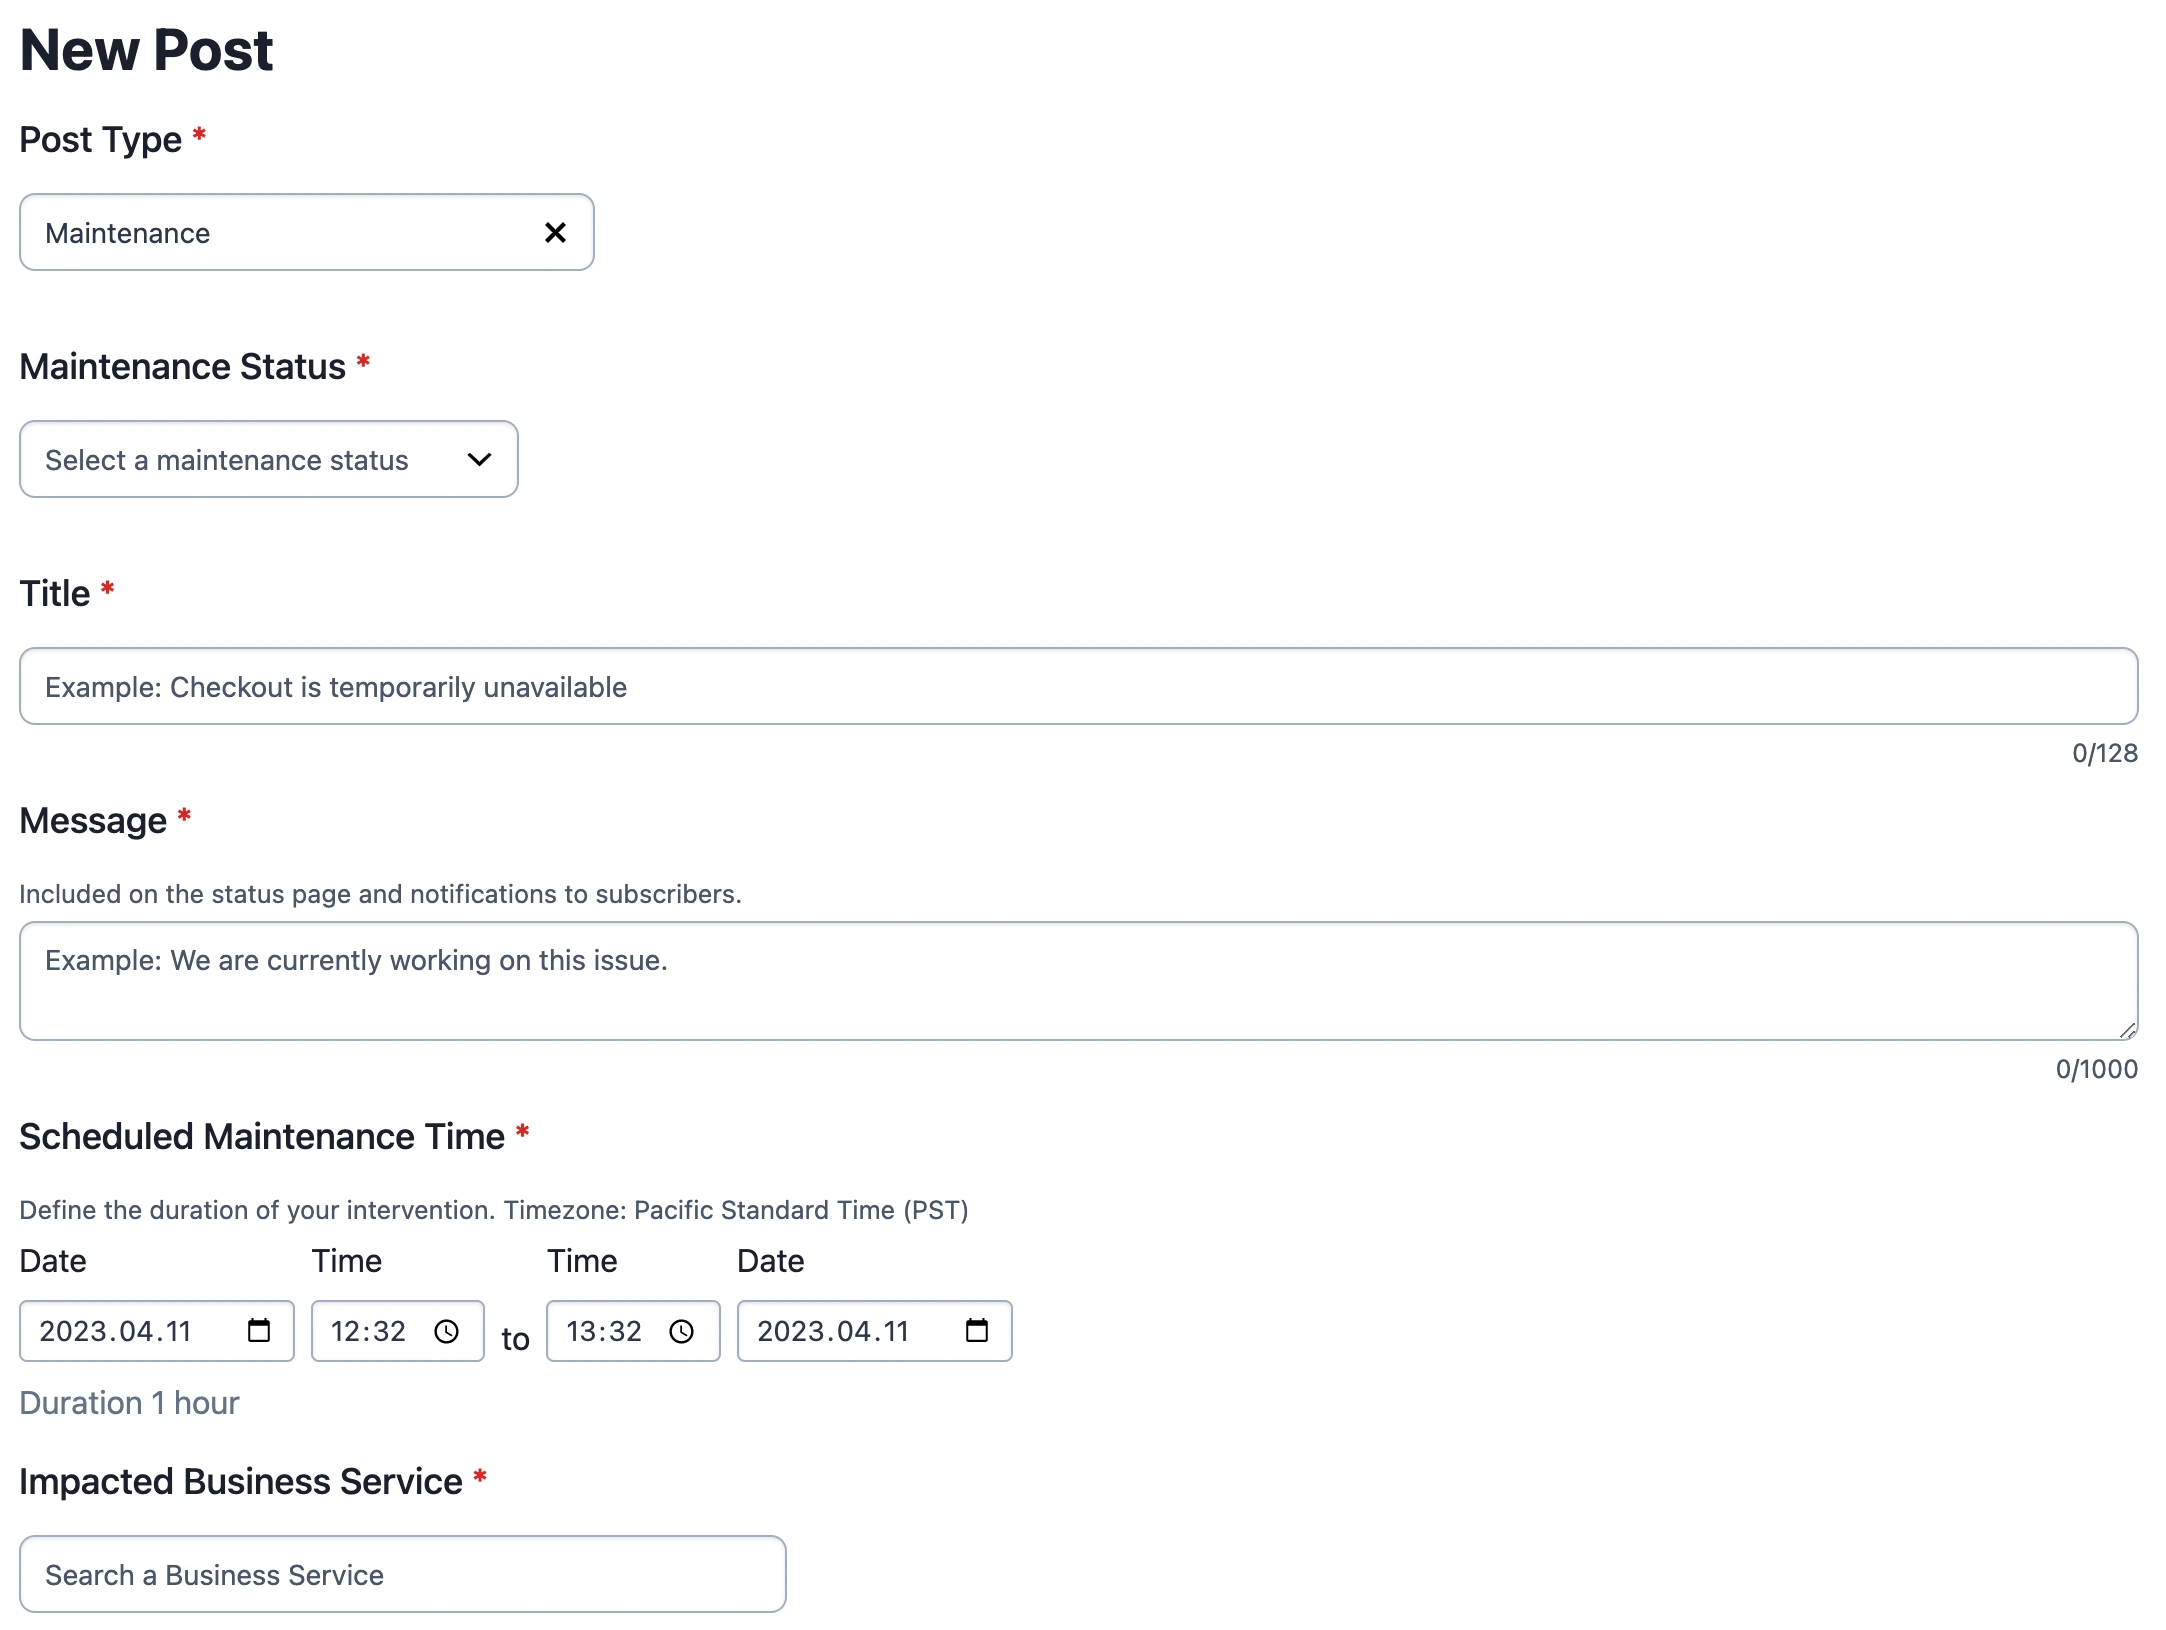 *New maintenance notice submission form* ### Post a Maintenance Update > **Status Update Limit:** You can add up to 50 status updates per post. 1. Navigate to **Status** → **External Status Page**. 2. Click on the **name** of the desired status page. 3. On the left sidebar, select **Maintenance** under **Posts**. 4. Click next to the desired maintenance notice and select **Post New Update** 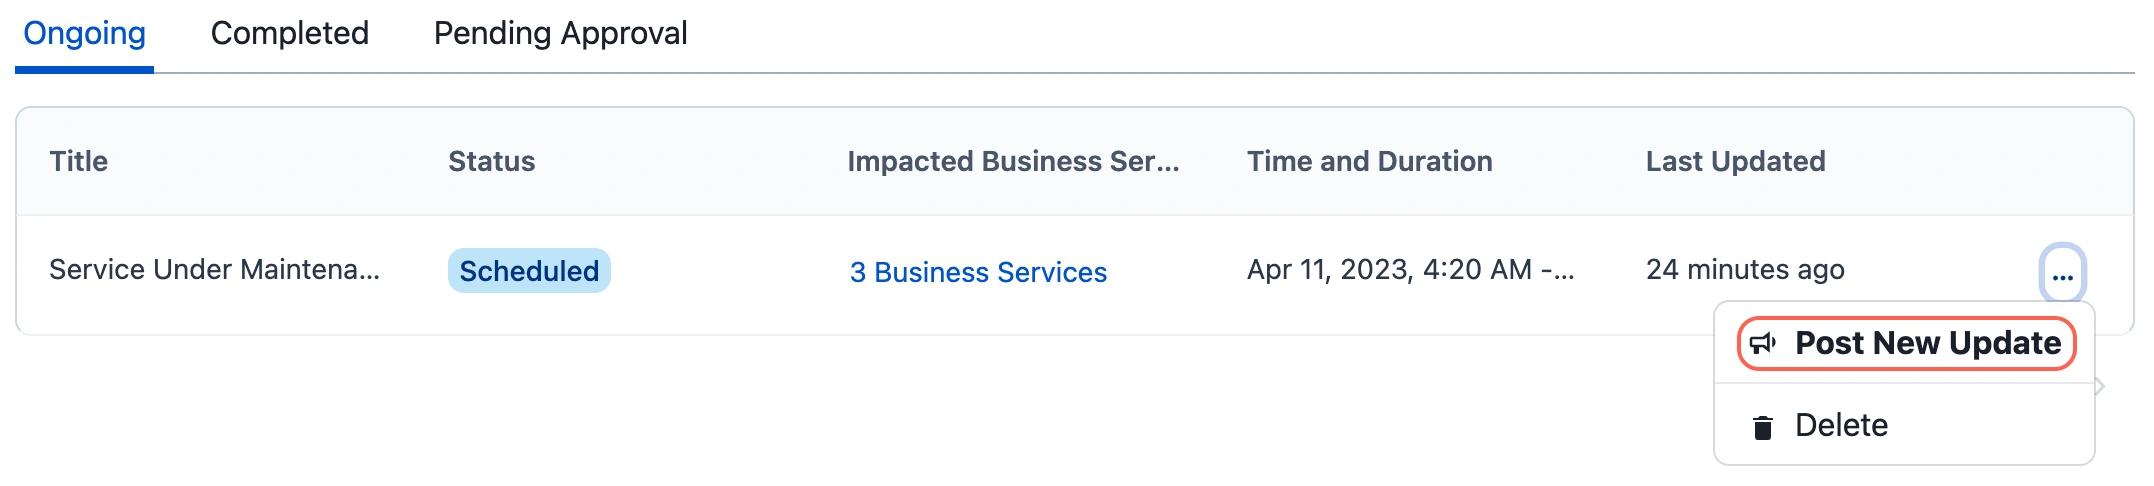 *Post new maintenance update* 5. Select the Maintenance Status and write an update in the Message field. 6. Select the impacted Business Services. 7. Click **Post**. ### End a Maintenance Window 1. Navigate to **Status** → **External Status Page**. 2. Click on the **name** of the desired status page. 3. Select **Maintenance** under **Posts**. 4. Click next to the desired maintenance notice and select **Post New Update** 5. Under Maintenance Status, select **Completed**. 6. Post the update. The maintenance moves to the **Completed** tab.  *Completed maintenance windows* ### Delete a Maintenance Notice 1. Navigate to **Status** → **External Status Page**. 2. Click on the name of the desired status page. 3. On the left sidebar, select **Maintenance** under **Posts**. 4. Click next to the desired maintenance notice and select **Delete** 5. Confirm the action by clicking **Delete** button. Deleted maintenance notices cannot be restored. ## Subscribe to Status Updates There are multiple ways you or other users can subscribe to status updates: - [In the Subscriber Console](#in-the-subscriber-console) - [On the Public-Facing Status Page](#on-the-public-facing-status-page) - [Slack Subscriptions](#slack-subscriptions) - [Webhook Subscriptions](#webhook-subscriptions) ### In the Subscriber Console You can subscribe yourself or another user to receive status updates via email. 1. In the web app, navigate to **Status** → **External Status Page**. 2. To the right of your desired status page, click → **Subscribers**. 3. Click **Add Subscriber**. 4. In the modal, enter a user's **email address** and select **Status Page** or **Business Services**. - If you select **Status Page**, the user will be notified for all incidents and updates to this status page. - If you select **Business Services**, please enter one or more [Business Services](/incident-management/services/business-services). This option only notifies the user when there is a status page update related to their selected business service(s). 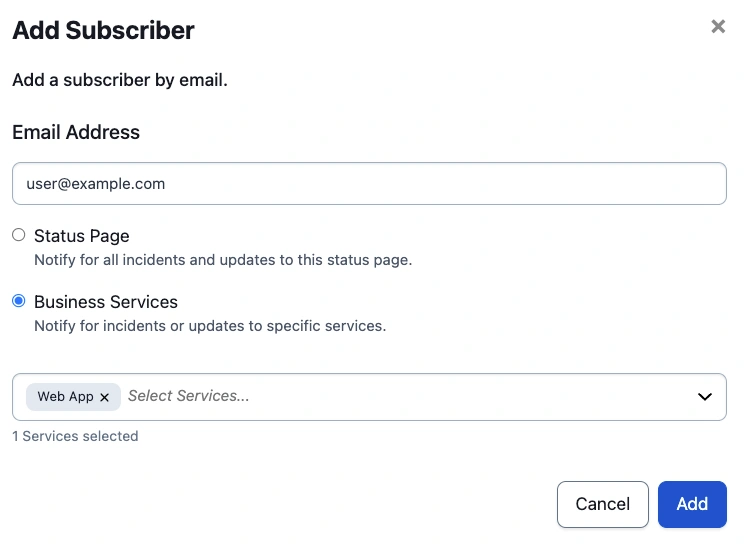 *Subscribe a user to a business service* 5. Click **Add**. Subscribed users will receive an email notification whenever there is an incident on the status page or their selected business services. 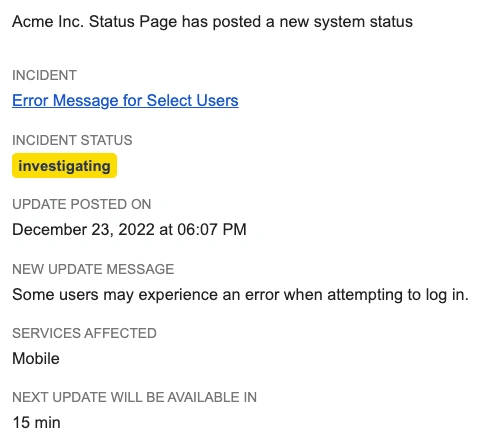 *Example email notification* > **Subscriber Count:** To view the number of subscribers, navigate to your preferred status page and select **Subscribers** in the left menu. **Page Subscribers** indicates how many users are subscribed to the currently selected status page, while **Total Account Subscribers** shows how many users are subscribed to _all_ status pages. > >  *Status page subscribers* > > If you reach the maximum number of subscribers, the option to add subscribers will be disabled. Please contact our [Sales Team](https://www.pagerduty.com/contact-us/#contact-sales) to purchase additional status page subscriber licenses. > > You can have a maximum number of 150,000 subscriptions per status page. This includes all email, Slack and webhook subscription channels. #### Import Subscribers from a CSV File > **Notification Method:** The Import Subscribers feature only supports email subscriptions at this time. 1. In the web app, navigate to **Status** → **External Status Page** and select your preferred status page's **name**. 2. In the left pane, click **Subscribers**. 3. To the right of **Add Subscriber**, click → **Import Subscribers (CSV)**.  *Select Import Subscribers* 4. In the modal, download the **CSV Template** (`PD-import-subscribers-template.csv`), and then add your subscribers' email addresses to the file. 1. **Note**: The file type must be CSV, and a maximum of 5000 rows is allowed. 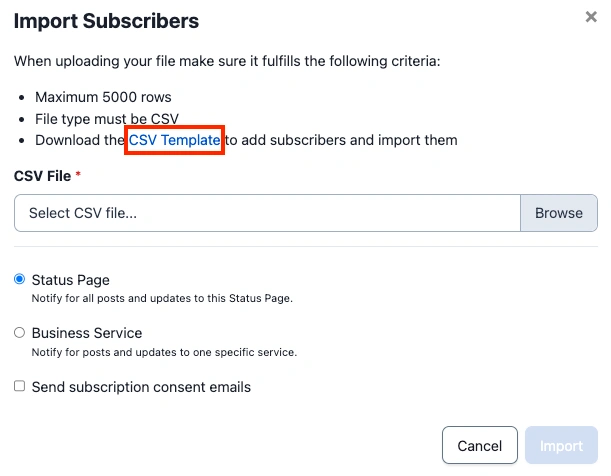 *Downland CSV template* 5. In the section **CSV File**, click **Browse** and select the file with your subscribers' email addresses. 6. Select **Status Page** to notify users whenever there is a post or update on the status page, _or_ **Business Service** to only notify when a specific [business service](/incident-management/services/business-services) is affected. 1. If you select **Business Service**, a section **Subscribe to a Service** will appear. Select your preferred business service. **Note**: Only the business service(s) that you selected while [configuring the status page](#create-an-external-status-page) will appear in this section. 7. _Optional_: Check the box **Send subscription consent emails** if you'd like users to receive a confirmation email. They will need to confirm their subscription before they begin receiving status updates. 8. Click **Import**. ### On the Public-Facing Status Page You can also subscribe to a status page from its public URL. 1. Visit a status page's public URL, e.g., `https://status.pagerduty.com/`. 2. In the top-right, click **Subscribe to Updates**. 3. In the modal, enter your **email address** and select which business services you'd like to be notified for. To receive notifications for all incidents on this status page, leave the default selection, **All Services**. 4. Click **Subscribe**. 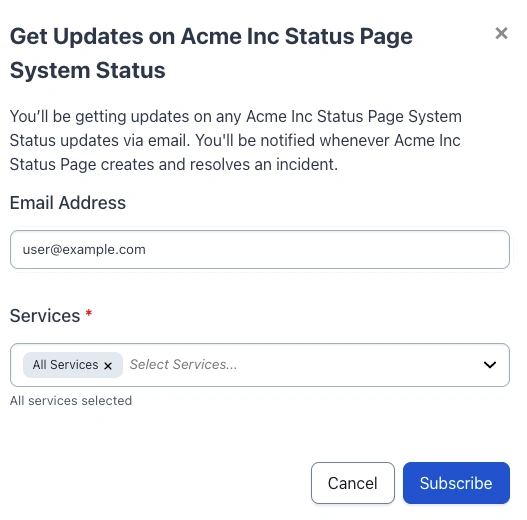 *Subscribe on the public-facing status page* 5. You should receive a confirmation email; open it and click **Confirm your subscription**. 6. On the following page, click **Yes, subscribe**. ### Slack Subscriptions A status page administrator can [enable Slack subscriptions](#enable-slack-subscriptions) so that end users can [receive status updates in Slack](#subscribe-via-slack). #### Enable Slack Subscriptions 1. In the web app, navigate to **Status** → **External Status Page**. 2. To the right of your desired status page, click → **Edit**. 3. Under step 4 **Customize**, select the **Status Page** tab.  *Edit External Status Page* 4. Under **Select the subscription method(s) shown on the Status Page**, select **Slack** . 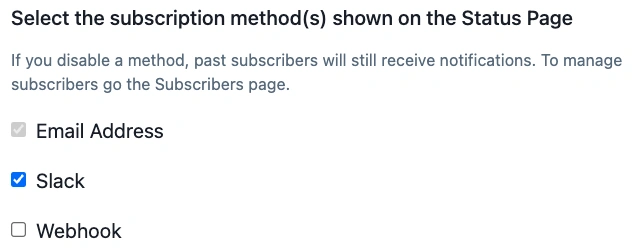 *Select "Slack"* 5. Click **Save**. #### Subscribe via Slack 1. In your web browser, navigate to the status page's public URL and click **Subscribe to Updates** in the top-right. 2. Select the **Slack** tab and click **Add to Slack**. 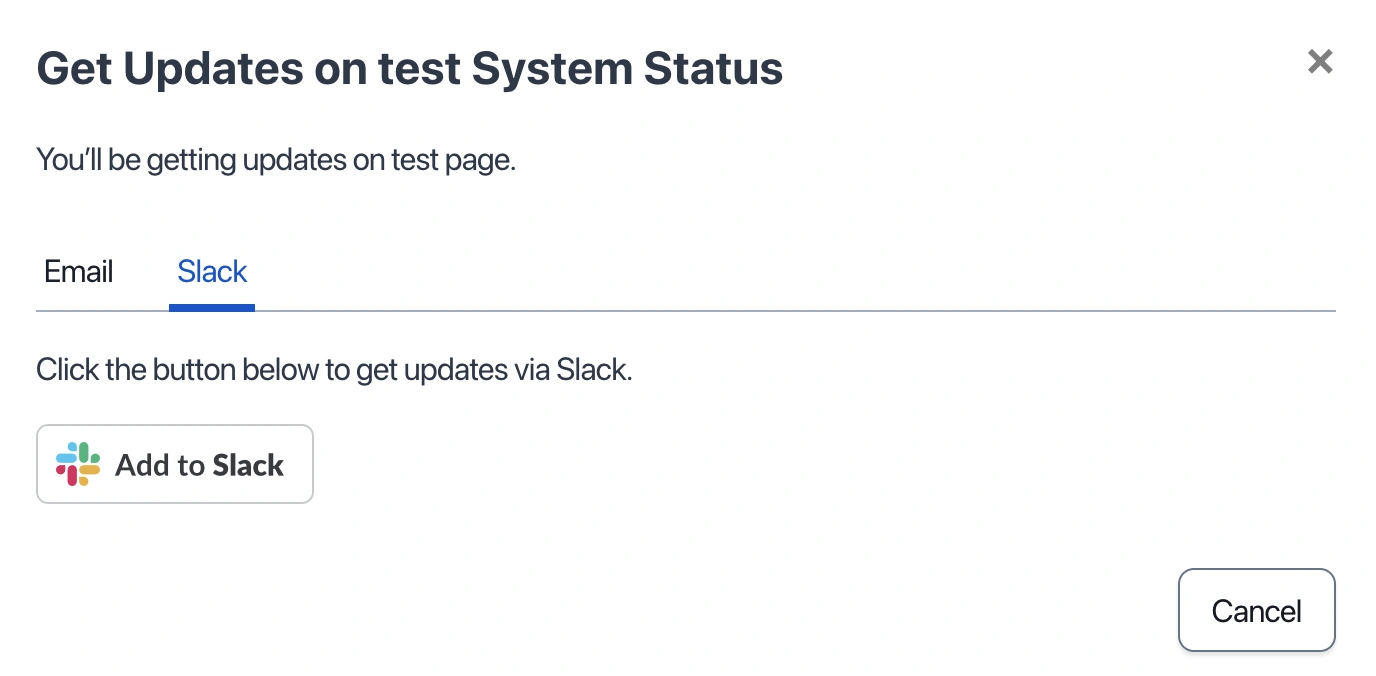 *Add to Slack* 3. If you have administrative permissions to add apps to your Slack workspace, select a channel from the dropdown and click **Allow** to authorize your workspace. If you do not have administrative permissions, you can **add a message for your App Managers** and click **Submit** to send the installation request to your organization's Slack admins. - **Note**: If you are part of more than one Slack workspace, you can select the appropriate workspace from the dropdown in the top-right.  *Connect Slack workspace*
 *Request to install* 4. After successful installation, you will receive a Slack message in the connected channel: `added an integration to this channel: PagerDuty Status Pages`. Now, whenever there is a post on the status page, you'll receive an update in Slack, too.  *Slack Status Update* ### Webhook Subscriptions A status page administrator can [enable webhook subscriptions](#enable-webhook-subscriptions) so that end users can [receive a webhook](#subscribe-via-webhooks) when there is a status update. #### Enable Webhook Subscriptions 1. In web app, navigate to **Status** → **External Status Page**. 2. To the right of your desired status page, click → **Edit**. 3. Under step 4 **Customize**, select the **Status Page** tab. 4. Under **Select the subscription method(s) shown on the Status Page**, select **Webhook** .  *Select "Webhook"* 5. Click **Save**. #### Subscribe via Webhooks 1. Navigate to an external status page's public-facing site. 2. In the top-right, click **Subscribe to Updates**. 3. Select the tab **Webhook** and enter your webhook's URL in the field **Webhook URL**. _Optionally_ enter an email address; we will send a notification to this email address if there are issues delivering the webhook. 4. Click **Subscribe Webhook**. > **Source IP Addresses:** Status page webhook notifications are not sent from the IP addresses listed in PagerDuty's [webhook IP documentation](/developer/webhook-ips). That list applies to incident and event webhooks only. The source IP addresses for status page webhook notifications are not published and are subject to change, so we don't recommend relying on IP allowlisting to receive them. If your endpoint is behind a firewall or VPN, authenticate using the token in your webhook URL instead. #### Example Payload ```json JSON { "ends_at": null, "href": "https://subdomain.trust.pagerduty.com/incident_details/PXXXXXX", "message": "We are currently working on the issue.", "next_update_ms": 900000, "post_type": "incident", "reported_at": "2023-05-15T20:47:12Z", "services": [ { "service_name": "Checkout", "severity": "minor" } ], "severity": "minor", "starts_at": null, "status": "investigating", "status_page": "Acme Corp", "title": "Checkout is temporarily unavailable" } ``` ``` { status_page:
| Field | Instruction |
|---|---|
| Post Type | Select the type of post you would like to create a template for: **Incident** or **Maintenance**. |
| Template Name | Enter a **template name**. |
| Description | Enter an _optional_ **template description**. |
| Incident or Maintenance Status | Depending on the post type selected above, you will see either Incident Status or Maintenance Status. Select your post's **status** from the dropdown. |
| Title | Enter an _optional_ **title** for the post. |
| Message | Enter the post **message**. |
| Impacted Business Services | Search and select **impacted business services** by checking the checkbox to the left of the business service. If you have selected an Incident post type, select the **outage status** in the dropdown to the right. |
| Impact (**Incident Post Type Only**) | Select the incident **impact level**. This will determine the status level on your page. |
| Time till Next Update (**Incident Post Type Only**) | Select the **time duration** until the next status update. |
| Notifications | **Check** this checkbox if you would like status update notifications to be sent to subscribers. |
--- URL: https://docs.pagerduty.com/incident-management/communicate/external-status-page/private-status-page # Private Status Page Restrict a status page to authorized users through OpenID SSO, kept independent of PagerDuty's own single sign-on feature. Private Status Pages are similar to [External Status Pages](/incident-management/communicate/external-status-page), but only authorized users are allowed to access them. Private Status Pages are not available to the general public. Authorization is handled by OpenID SSO, and is independent from PagerDuty's [Single Sign-On (SSO)](/account-admin/sso) feature. > **Pricing Information:** PagerDuty offers two Status Page packaging add-on options, one which includes Public Status Pages, and a premium package that also features [Private Status Pages](/incident-management/communicate/external-status-page/private-status-page) and [Audience-Specific Status Pages](/incident-management/communicate/external-status-page/private-status-page#audience-specific-status-page). Depending on the package you choose, features such as Page Subscribers, Premium Account Subscribers, and Total Account Subscribers may vary. > > Please contact our [Sales Team](https://www.pagerduty.com/contact-us/#contact-sales) for more information. ## Create a Private Status Page 1. In the PagerDuty web app, navigate to **Status** → **External Status Page**. 2. Click **New Status Page**. 3. Under **Status Page Type**, select **Private**. 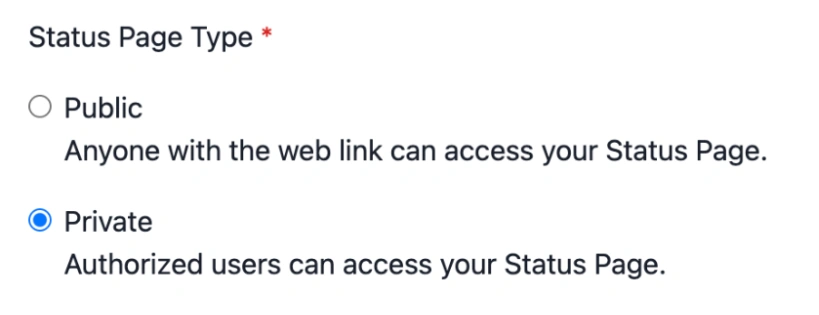 *Initial setup* 3. Continue setting up the status page using the instructions from [Create an External Status Page](/incident-management/communicate/external-status-page#create-an-external-status-page). ## Prerequisites for Single Sign-On (SSO) Before configuring Single Sign-On for your Private Status Page, review the following requirements to ensure a smooth setup process. ### Identity Provider Compatibility > **OIDC Application Support:** Verify that your IdP subscription or plan includes OIDC application support. Some providers restrict this functionality to specific pricing tiers or enterprise plans. Your identity provider (IdP) must support the OpenID Connect (OIDC) protocol with the authorization code flow. PagerDuty's Private Status Pages have been tested and verified to work with the following identity providers (but not limited to): - Okta - Azure AD (Microsoft Entra ID) - Salesforce - Ping Identity ### Administrative Access You must have administrative access to your identity provider with sufficient privileges to: - Create new OAuth 2.0/OIDC applications - Configure application settings and callback URLs - Manage client credentials (client ID and client secret) - Define custom claims and user attributes ### Required OIDC Scopes PagerDuty requests the following standard OIDC scopes during authentication: - `openid` — Required for OIDC authentication - `email` — Used to identify and match users - `profile` — Provides basic user profile information Ensure your identity provider is configured to support and return these scopes. ### Custom Claim Requirement Your identity provider must support sending a custom claim named `status_pages` in the ID token or access token response. This custom claim must contain the identifier(s) of the private status pages(s) an individual can access. ## Configure Single Sign-On (SSO) You will need to configure SSO on your Private Status Page before users can access it. Private Status Pages use the OpenID Connect (OIDC) protocol to allow users access. 1. In the PagerDuty web app, navigate to **Status** → **External Status Page**. 2. Select the **Private** tab. 3. Click the name of the page you want to configure. 4. In the left pane, navigate to **Configuration** → **Single Sign-On**. 5. If prompted to **Update your SSO Configuration**, click **Continue** to proceed. 6. Update the following fields: | Field | Value | | ------------------------ | -------------------------------------------------------------------------------------------------------------------------------------------------------------------------------------------------------------------------------------- | | **Custom Claims** | You can disable custom claims. If you disable custom claims, any authenticated account from your IdP can access this page via SSO. To restrict access further, re-enable claims or configure separate IdP applications for each page. | | **Configuration URL** | The URL on your OpenID server that ends with `/.well-known/openid-configuration` | | **OpenID client ID** | Your OpenID client ID | | **OpenID client secret** | Your OpenID client secret | 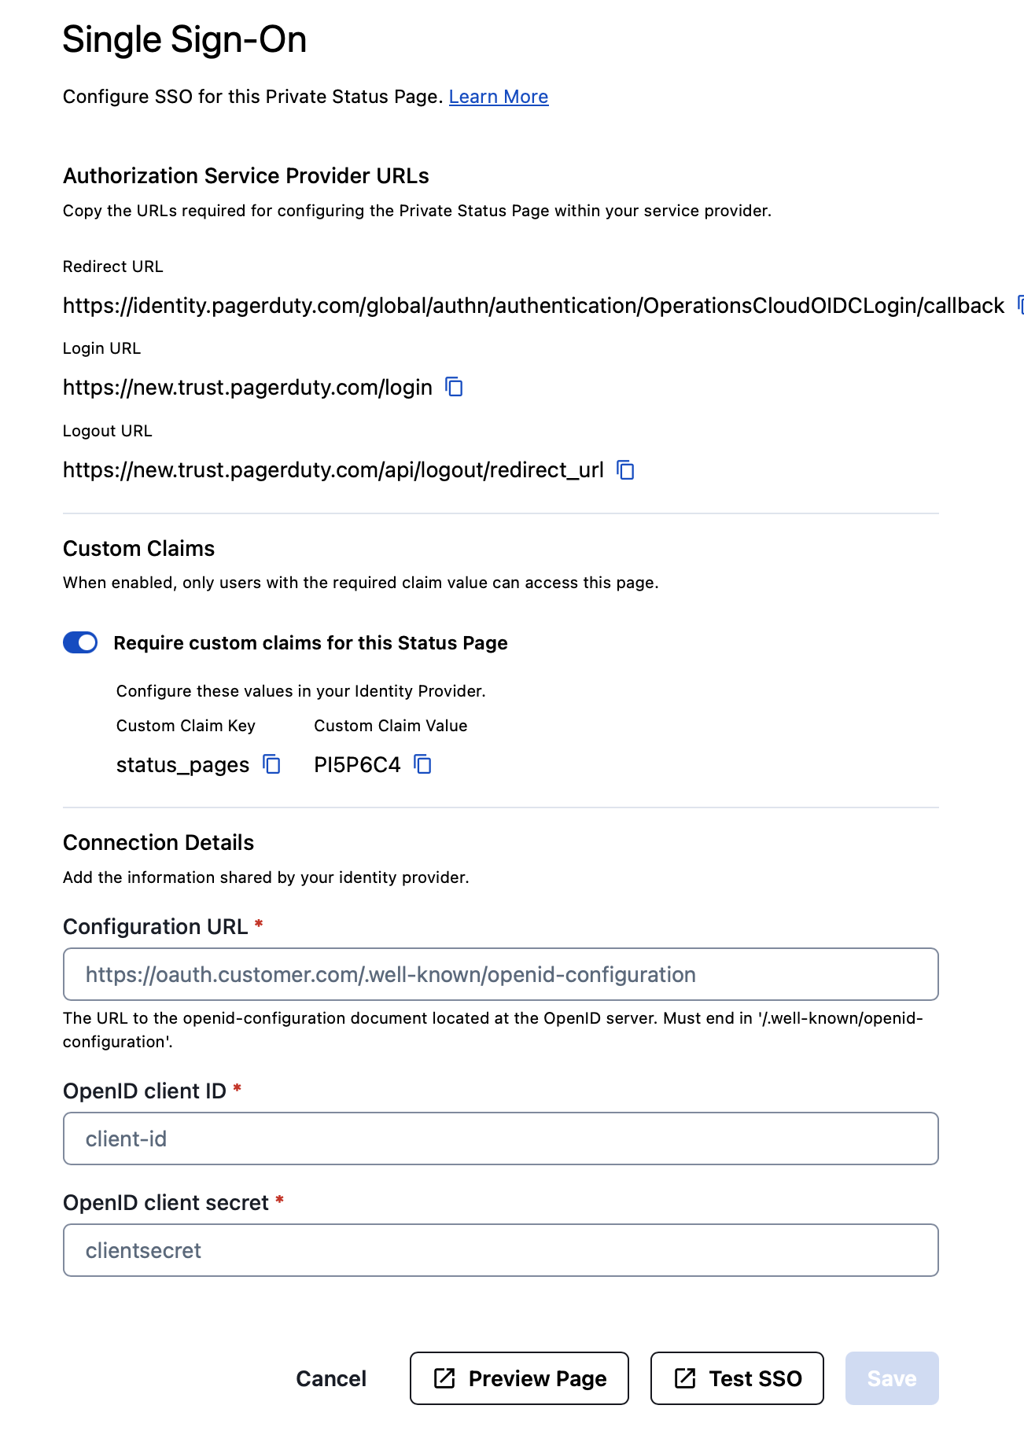 *SSO configuration* 7. Click **Test SSO** to check your configuration. Resolve any reported errors and proceed to the next step. > **Note**: After successfully configuring and saving your SSO settings, **Test SSO** may not appear in the UI the next time you visit the page. 8. If using Custom Claims, copy the **Custom Claim Key** and **Custom Claim Value**, as these will be necessary to complete the Identity Provider configuration in the next step. You'll need to create a custom claim in your IdP using this exact key name and assign the corresponding value to users who should have access to this status page. 9. Click **Save**. The instructions below detail how to integrate with common SSO providers. You are free, however, to integrate with the SSO provider of your choice: - [Audience-Specific Status Page](#audience-specific-status-page) - [Okta](#okta) - [Azure](#azure-ad--entra-id) - [Salesforce](#salesforce) - [Ping Identity](#ping-identity) ### Audience-Specific Status Page Audience-Specific Status Pages enhance Private Status Pages by allowing authorized users to see customized views based on their access level. This feature is only available to users authenticated through OpenID SSO, which operates separately from [PagerDuty's Single Sign-On (SSO)](/account-admin/sso) feature. > **Audience Limit:** You can add up to 100 audiences per status page. #### Create an Audience-Specific Status Page > **Requirements:** To set up Audience-Specific Status Pages, you must first: > > 1. [Configure a Private Status Page](#create-a-private-status-page). > 2. [Configure SSO](#configure-single-sign-on-sso) on the Private Status Page. > **Conversion Warning:** Once you convert a Private Status Page to an Audience-Specific Status Page, you will not be able to revert it. If you want all users to see the same view of the status page, you must add them to the same audience. 1. After you’ve created the Private Status Page and configured SSO, click the Status Page’s **name** to open its settings. 2. From the left menu, select the **Configuration** drop-down → **Business Services**
→ **Audiences** tab. 3. To the right of the **New Audience** button, select the menu → **Audience Settings**. 4. Next, select the **Default Business Services** that should be visible to all users who have access to the Private Status Page. 5. At the bottom of the page, enter the **Group claim custom key** to enable audience filtering. This is the **Claim name** from your SSO Provider. For example, with Okta, this is the claim name from the claim created for the Status Page Authorization Server. 6. Click **Save**. 7. Once saved, click **New Audience** to create a new audience view for the status page. 8. Enter the following:
| Field | Value | | --------------------- | --------------------------------------------------------------------------------------------------------------------------------------- | | **Audience Name** | Add a name for this audience. | | **Description** | Describe the purpose of this audience. | | **Group Claim** | Add the group claim used in your SSO provider to link groups. This must match the audience key from the SSO provider. | | **Business Services** | Select the business services that should be visible to this audience, or individuals who log in with credentials with this Group Claim. | 9. Click **Create Audience** to create the Audience-Specific Status Page. #### Example: Configure Audience Groups in Okta Using Okta as an example, the following is a sample flow for setting up Audiences. > **Prerequisite:** You must first configure [Okta SSO for Private Status Pages](/incident-management/communicate/external-status-page/private-status-page#okta) in PagerDuty. 1. In Okta, navigate to **Directory** → **Groups**. 2. Click **Add group** to create groups for the PagerDuty Status Page Audiences. Enter a **Group Name** and optional **Description**. 1. **Note**: The names of the groups created need to match the **Group Claim** for each PagerDuty Audience. 3. Click **Save** and continue adding as many groups as necessary. 4. Assign users to each created group as necessary by clicking **Group Name** → **Assign people** → plus icon to the right of each user you’d like to assign → **Done** in the upper right. 5. Next, navigate to **Security** → **API** → select the **Authorization Server** for the Private Status Page. 6. Select the **Claims** tab → **Add Claim** and perform the following: | Field | Value | | -------------------------- | --------------------------------------------------------------------------- | | **Name** | Match the Group Claim custom key on the Audience setting page in PagerDuty. | | **Included in token type** | Select ID Token and Always. | | **Value Type** | Select Groups. | | **Filter** | Select Matches regex and enter `.*`. | | **Disable claim** | Leave unchecked. | | **Include in** | Select Any scope. | 7. Click **Create**. You should now be able to see the audiences in the token under the **Token Preview** tab → **Preview Token**. ### Okta #### Create the Application 1. Go to **Applications** → **Create App Integration**. 2. For **Sign-in method**, select **OIDC - OpenID Connect**, and for **Application type**, select **Web Application**. Click **Next**. 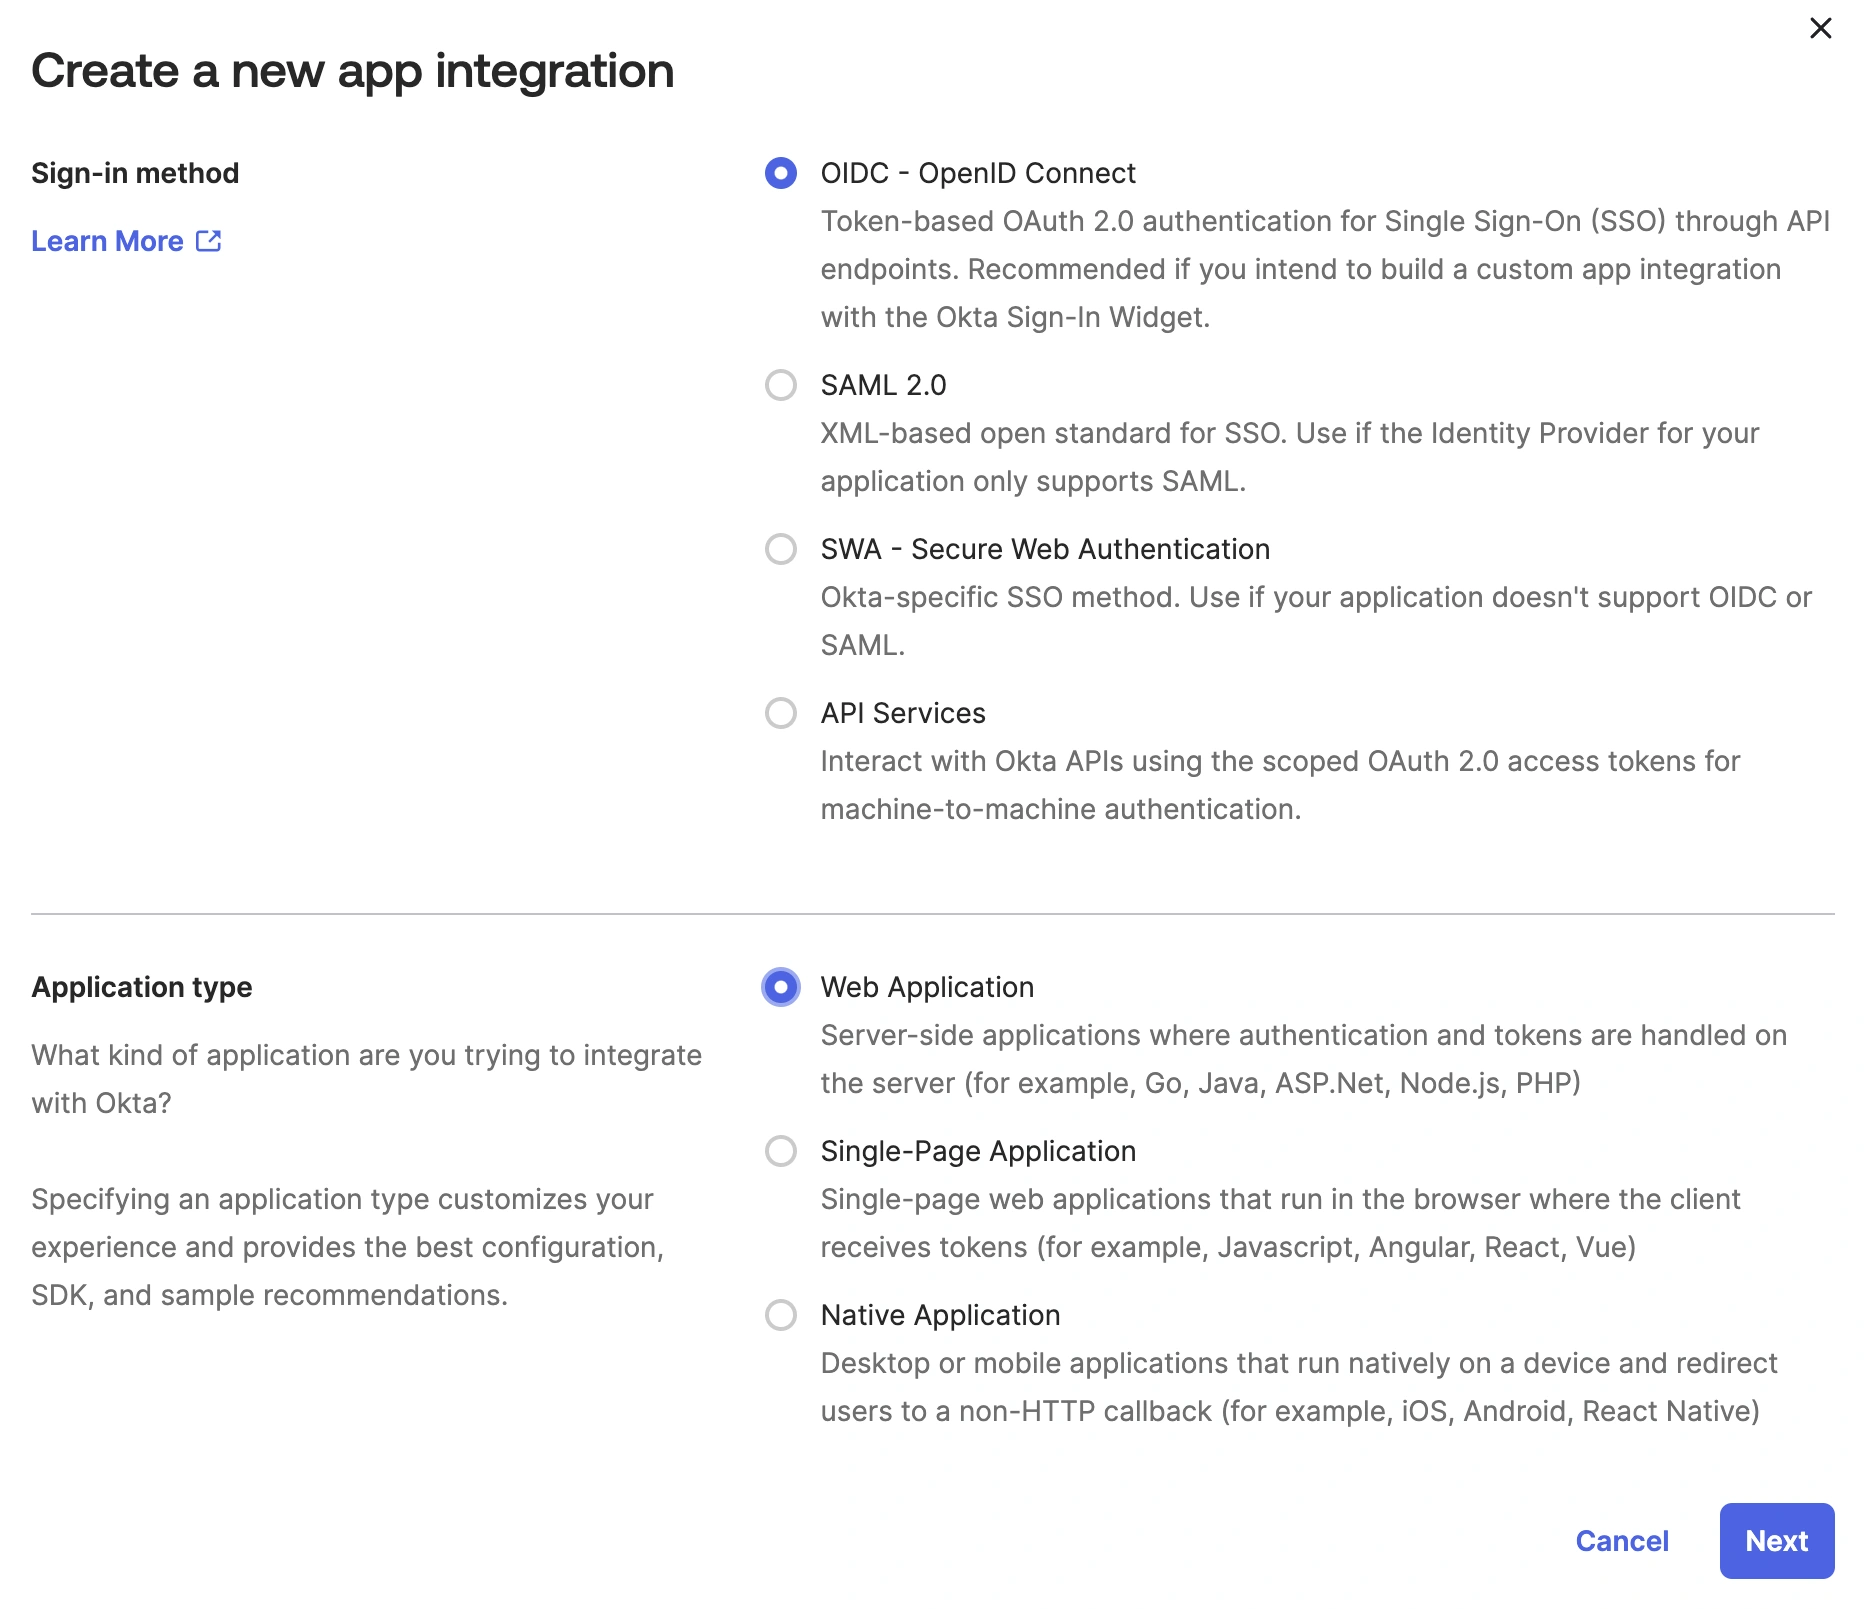 *Create a new app integration* 3. Under **Application**, enter a name for the application. 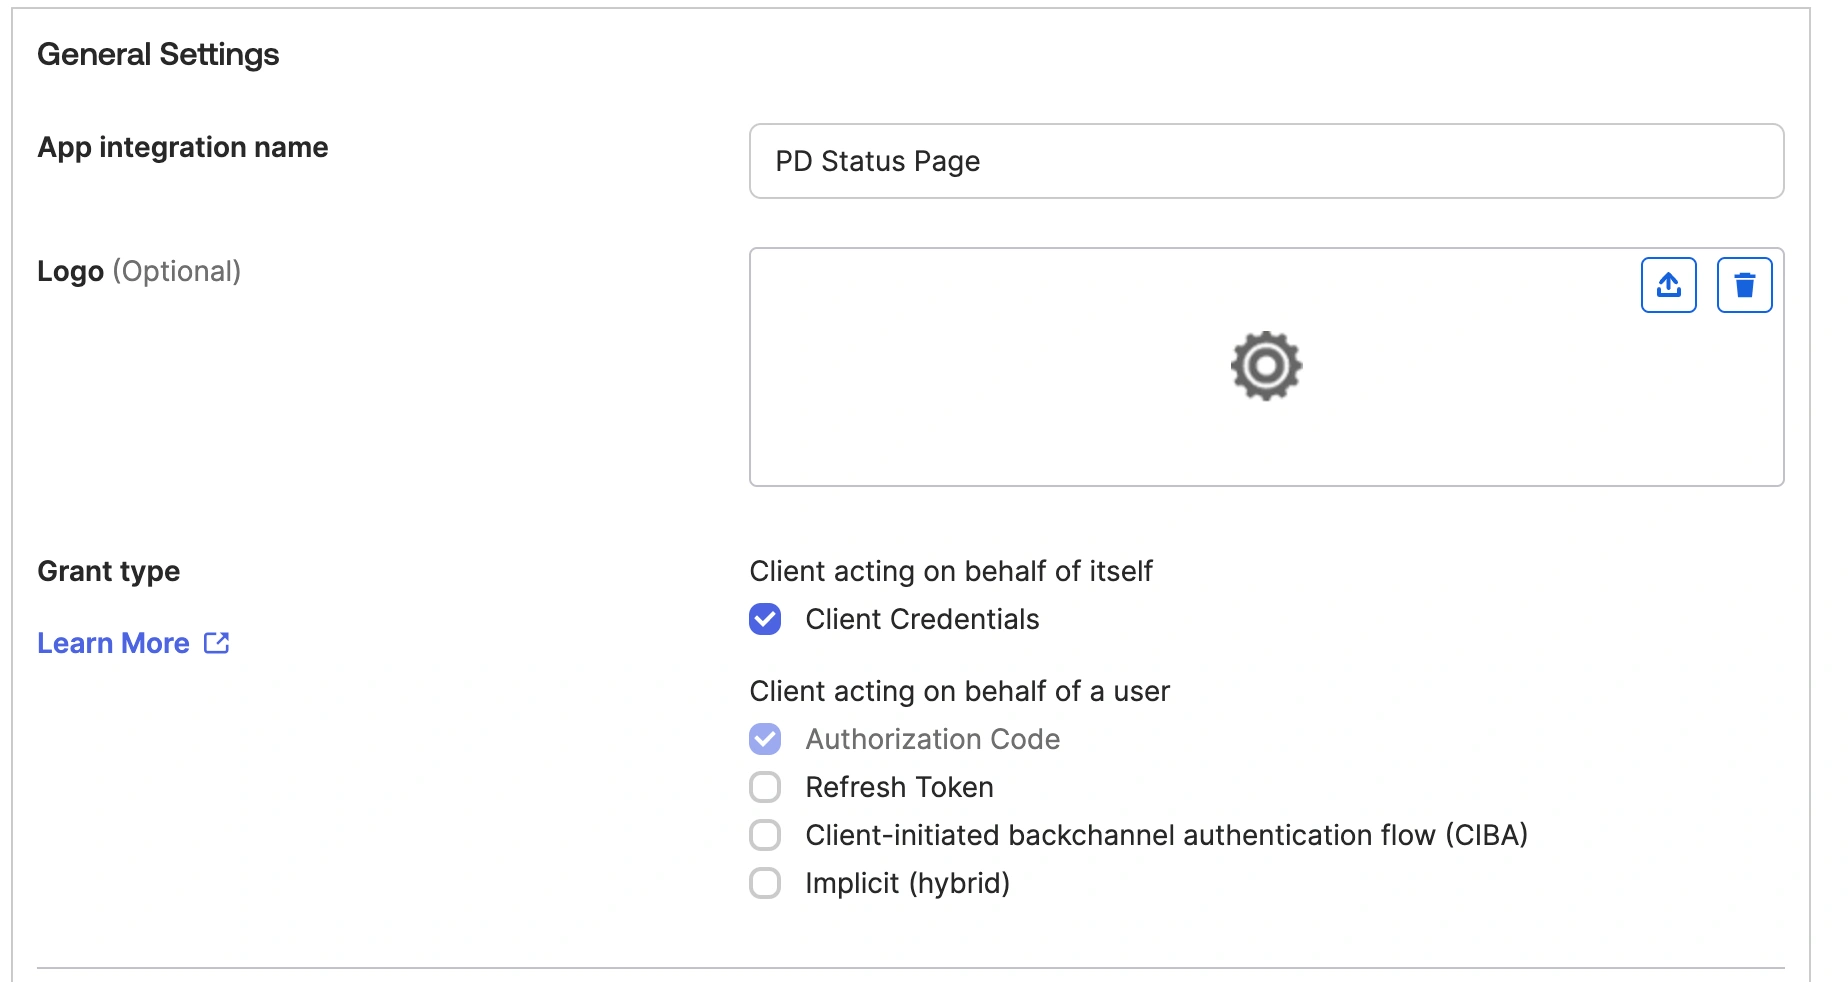 *General settings* 4. Copy the **Redirect URL** from the SSO configuration in PagerDuty and paste it into the **Sign-in redirect URI**. Do the same for the **Login URL** and the **Sign-out redirect URIs**. 5. Select how you would like to assign the application, and click **Save**. 6. On the next page, copy the client ID and client secret, and paste it into the **OpenID client ID** and **OpenID client Secret** fields on the PagerDuty SSO configuration page.  *Client credentials* 7. Go to **Security** → **API** and select the **Authorization Server** you want to connect. 8. Copy the **Metadata URI** and paste it into the **Configuration URL** field in the PagerDuty SSO configuration page.  *Metadata URI* 9. Replace the end of the URL (`oauth-authorization-server`) with `openid-configuration`. The URL in PagerDuty must end with `/.well-known/openid-configuration`. 10. Save the SSO configuration. #### Profile Mapping and Custom Claims 1. Go to **Directory** → **Profile Editor** and select your application. 2. Click **Add Attribute**. For the Data type, select string. Enter a Display name. For the variable name enter `pd_status_pages`. Select **Greater than** for **Attribute length**, with a value of **0**. Select **Yes** for **Attribute required** and click **Save**.  *Add attribute* 3. Click **Mappings**, and find `pd_status_pages`. Ensure that **Apply mapping on user create and update** is selected (i.e., it shows a green arrow). Enter the custom claim value from the PagerDuty SSO configuration page, surrounded by single quotes, and click **Save Mappings**.  *Custom claim value* 4. Go to **Security** → **API** and select the authorization server you will be using. Then select the **Claims** tab and click **Add Claim**. 5. In the **Name** field, enter the name found under the **Custom Claim Key** on the PagerDuty SSO configuration page. Select **ID Token** as **Always**. Under **Value**, enter `appuser.pd_status_pages`. 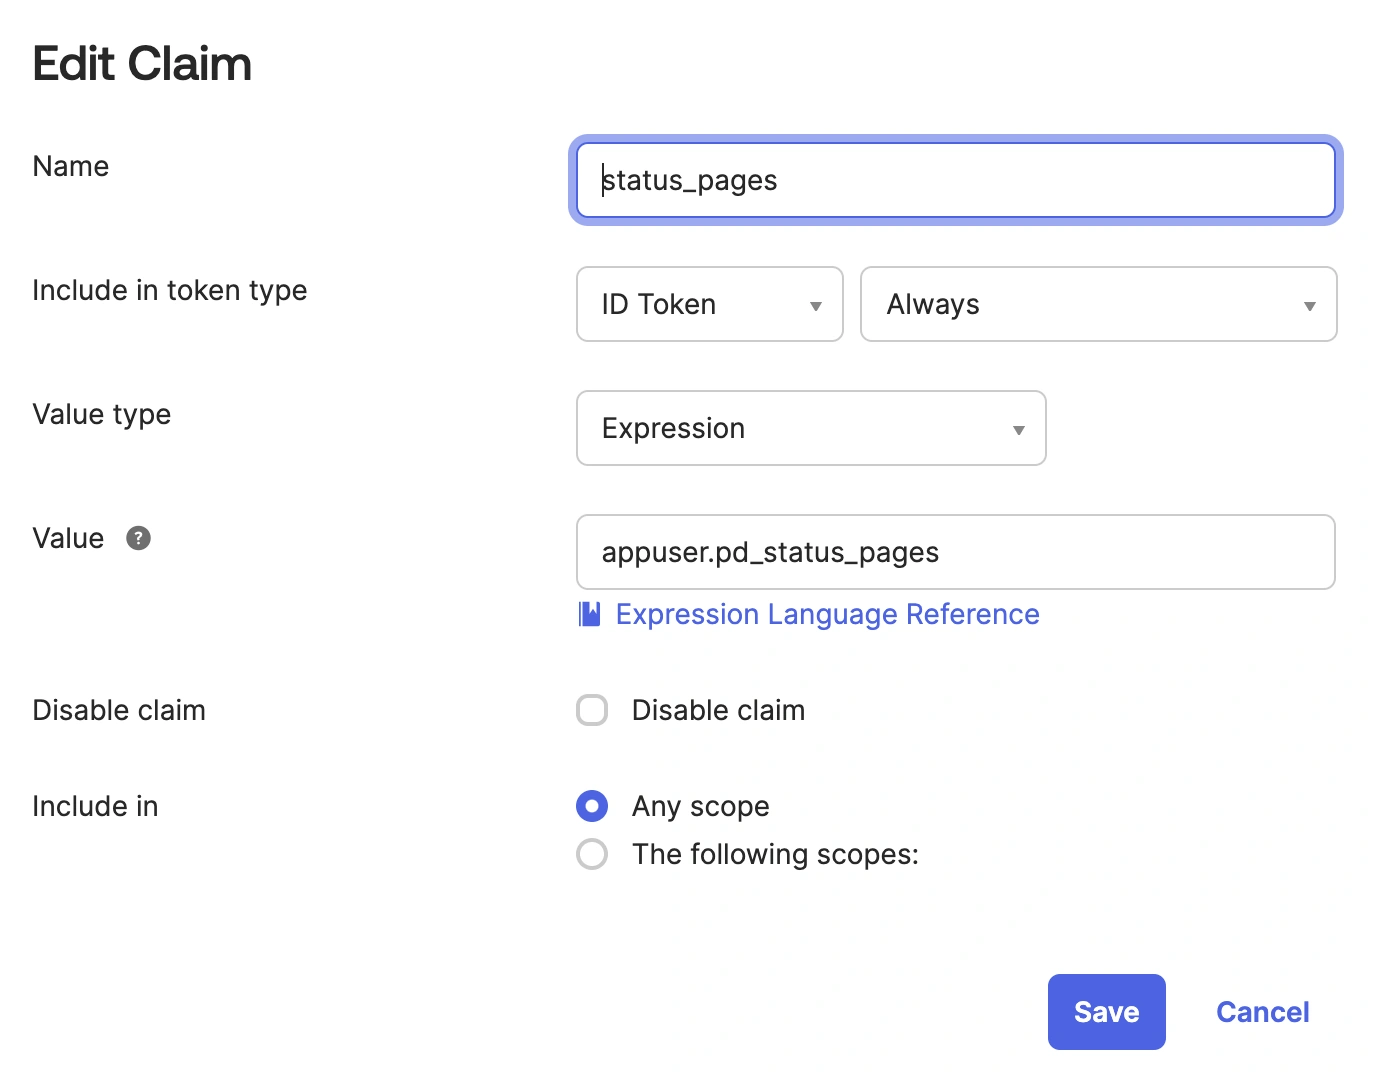 *Edit claim* > **Data Requirement:** The name of the claim _must_ match the **Custom Claim Key** name. ### Azure AD / Entra ID #### Create the Application 1. In the Microsoft Entra Admin Center, navigate to **App Registrations** → **New Registration**. 2. Enter a name for the app and the **Redirect URI** from the PagerDuty SSO Configuration page. 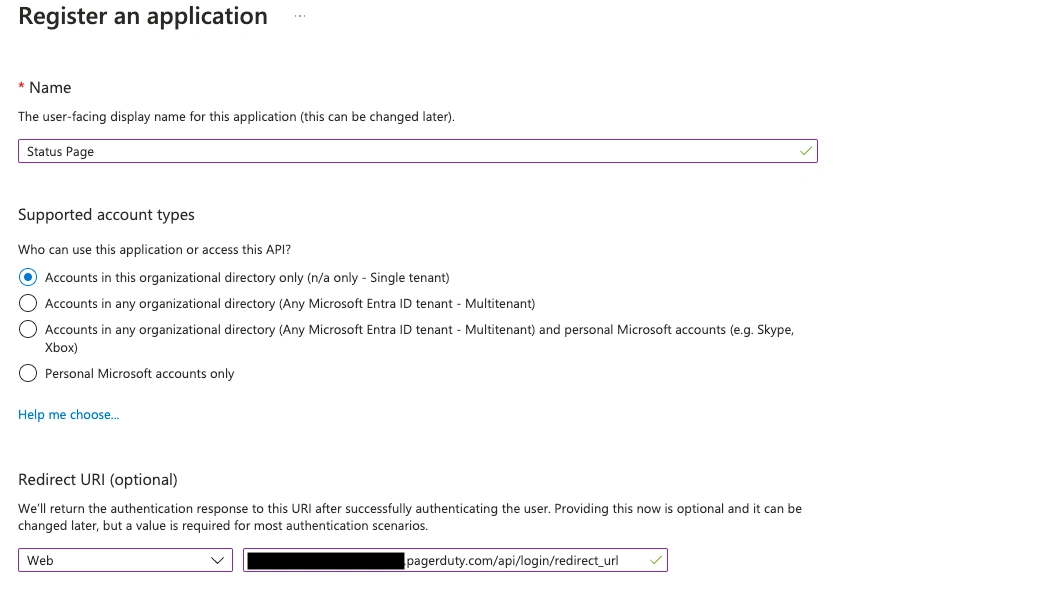 *Register an application* 3. Find the newly created app under **App Registrations** and select it. Then, click **Add a certificate or secret** to create a client secret. On the next screen, click **New Client Secret**.  *Add a certificate or secret* 4. Copy newly created client secret and paste it into the PagerDuty SSO configuration page. Then go back to the previous page and copy and paste the Application (i.e., client) ID.
**Note**: you will be presented with an array of values associated with your client secret. - Typically the values will include the following fields: **Description**, **Expires**, **Value**, **Secret ID**. - Look for the secret's **Value** field. - **Note**: Please **_do not_** use the data in the Secret's **Secret ID** field, which is UUID and not intended for the secure use. 5. Go back to the previous screen and click **Authentication**. Under **Front-channel logout URL**, add the logout URL from the PagerDuty SSO Configuration page and **Save**.  *Redirect URL* 6. In the same menu where **Authentication** was found, select **Manage** → **Branding and Properties**. In the **Home page URL** field, enter the login URL from the PagerDuty SSO Configuration page and click **Save**.  *Home page URL* 7. Go back to the created application (as in step 3), and click on **Endpoints**. Locate the **OpenID Connect metadata document** URL and copy it and paste it into the **Configuration URL** on the PagerDuty SSO Configuration page. 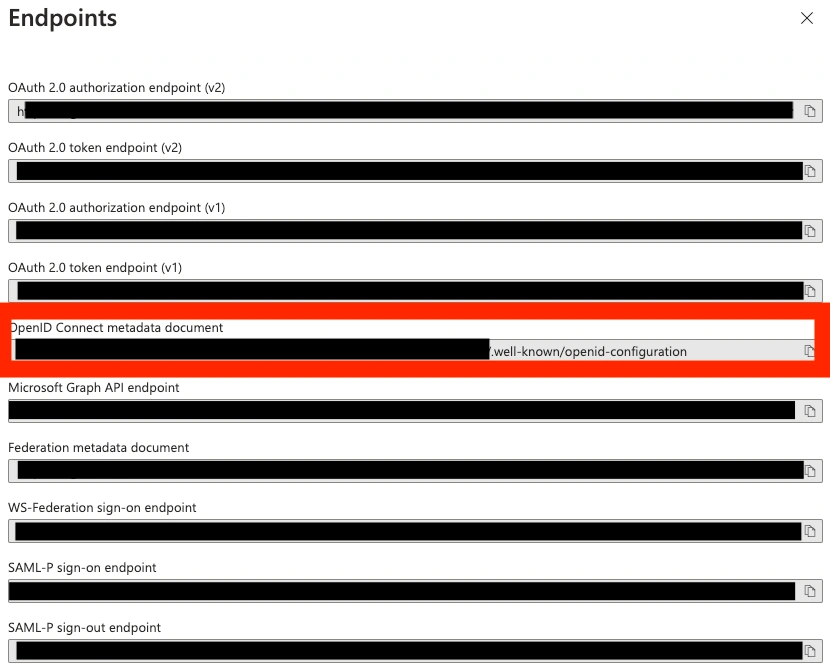 *OpenID Connect metadata document* #### Profile Mapping and Custom Claims 1. On your app page (from app registration), select **Manage** → **App roles**. 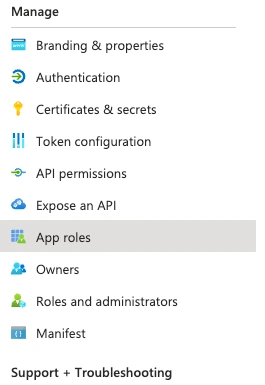 *App roles* 2. Click **Create Role**, and enter the custom claim key and custom claim value found on the PagerDuty SSO configuration page. Click **Apply**. 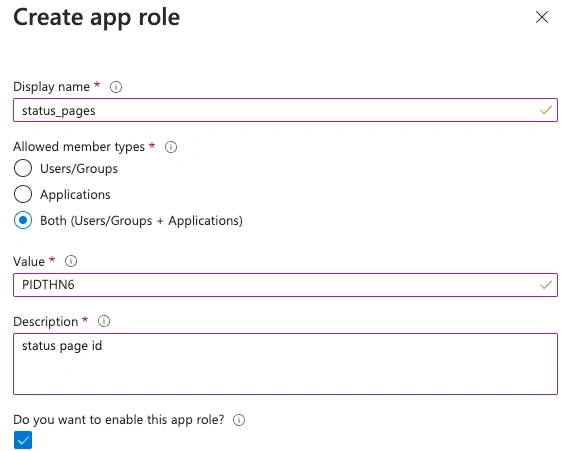 *Create app role* 3. Under **Manage**, select **Manifest**. In the JSON representation, update `acceptMappedClaims` to `true` and save. 4. Go to **Applications** → **Enterprise Applications**, select the application, and go to **Single Sign-On**. Click **Edit** next to **Attributes & Claims**.  *Attributes and Claims* 5. Click **Add New Claim**. Enter the custom claim key (`status_pages`) for the name. Under **Source**, select **Attribute**, and under **Source attribute**, enter `user.assignedroles`. Click **Save**. 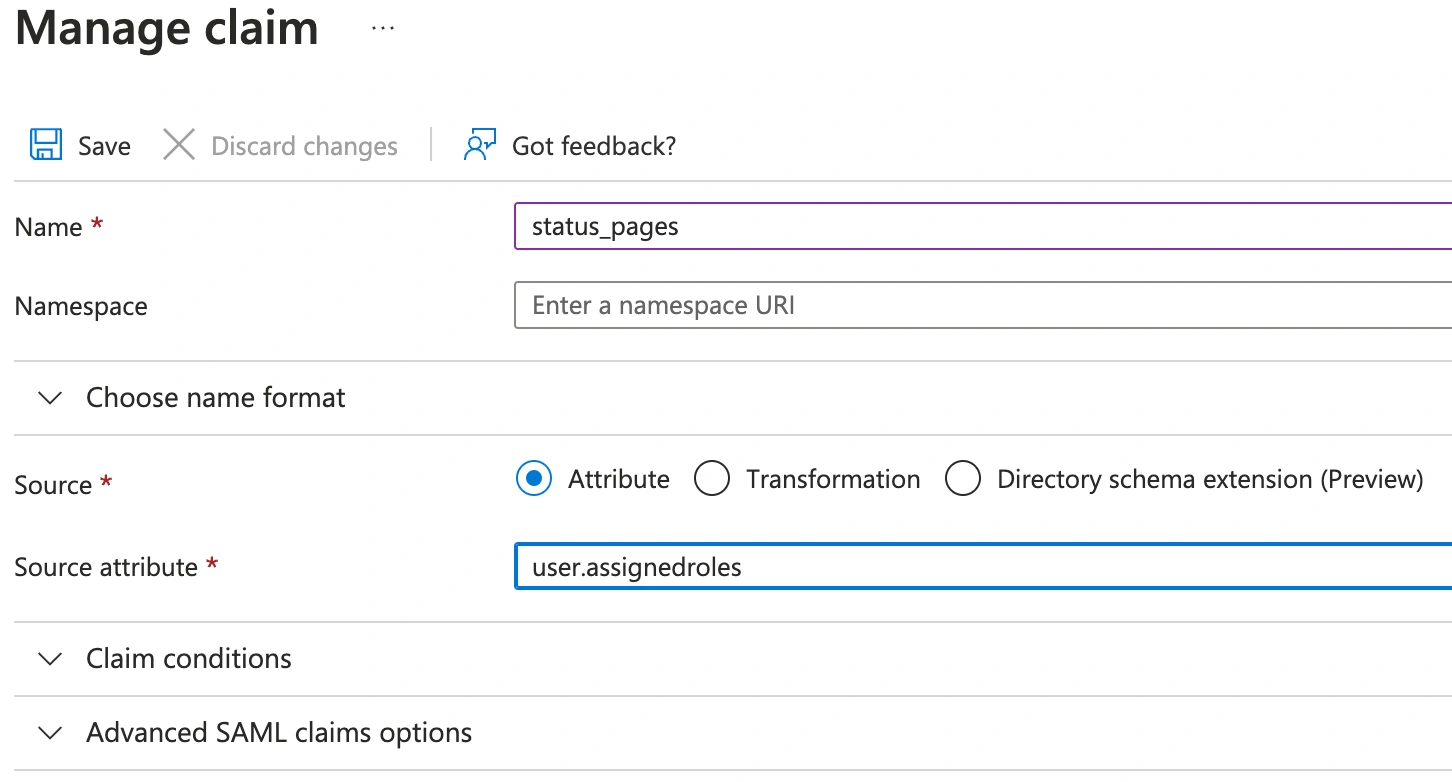 *Manage claim* 6. Go to **Applications** → **Enterprise Applications**, select the application, and go to **Users and groups**. Click **Add user/group**. Select the users who should have access to the private status page, then select the `status_pages` role. Click **Assign**. 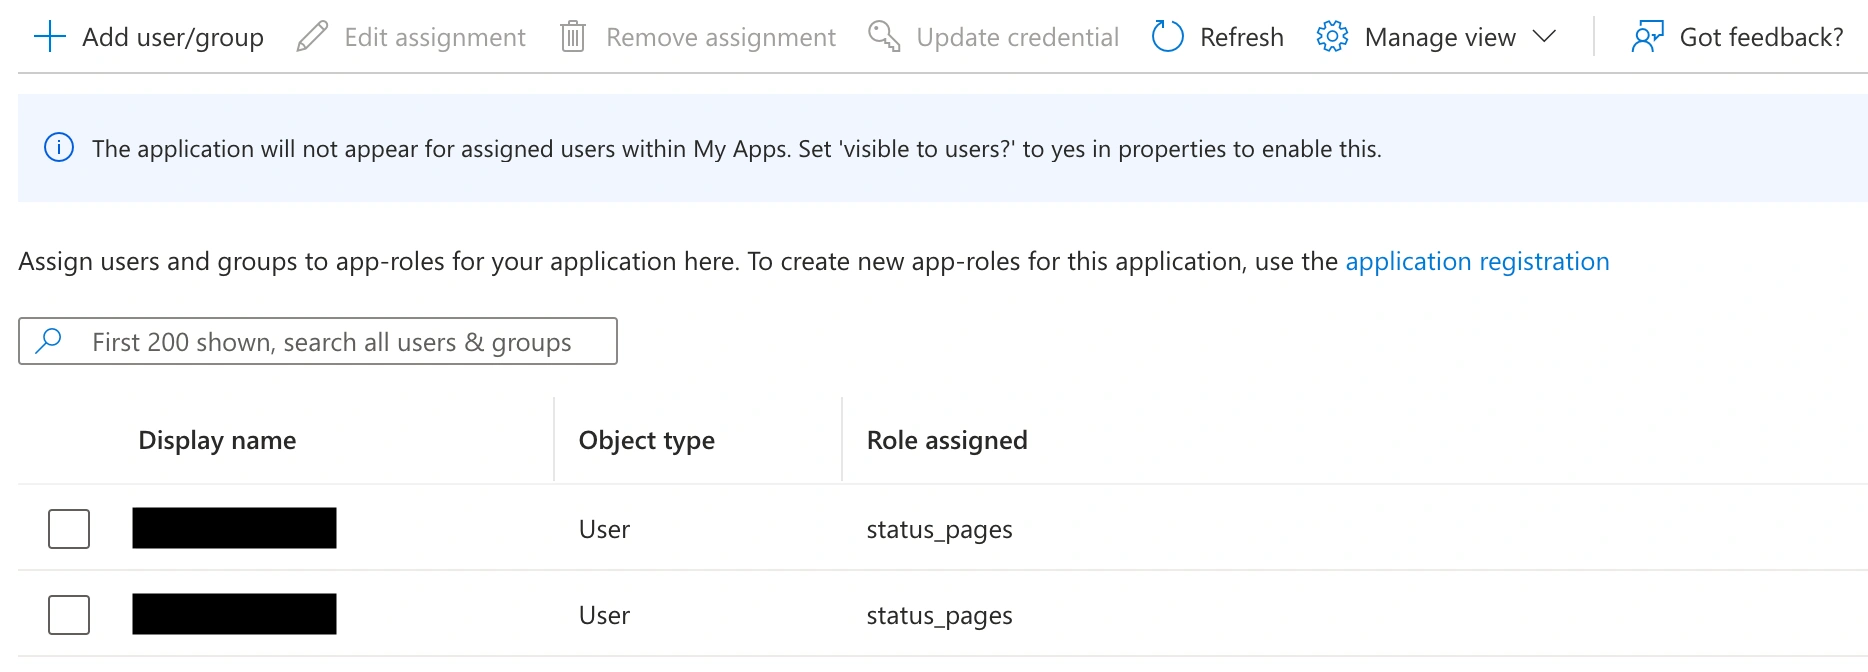 *Assign app role* ### Salesforce #### Create the Application 1. Ensure that the Identity Provider is enabled in Salesforce. In the Setup view, go to **Settings** → **Identity** → **Identity Provider**, and click **Enable Identity Provider**.  *Enable identity provider* 2. Go to **Settings** → **Identity** → **OAuth and OpenID Connect Settings** and ensure that the **Allow Authorization Code and Credentials Flows** option is enabled. 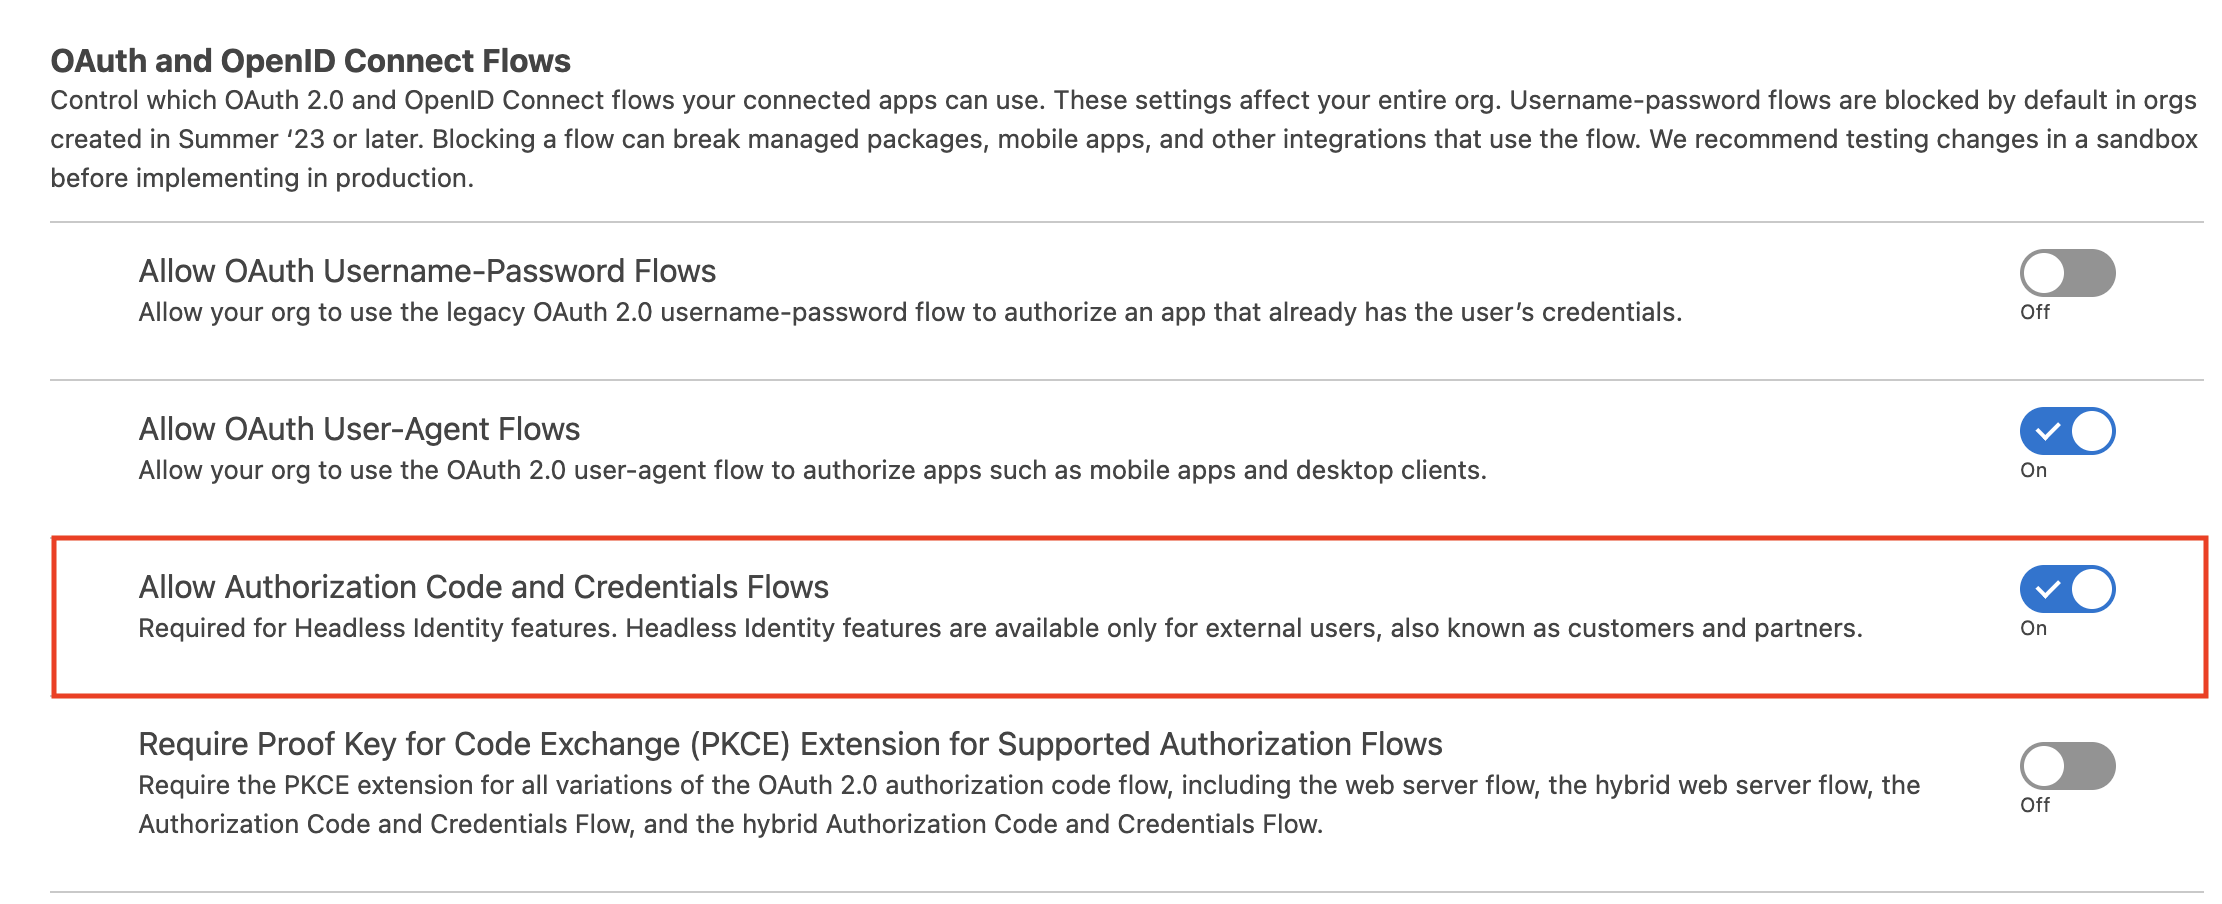 *Allow Authorization Code and Credentials Flows* 3. Go to **PlatformTools** → **Apps** → **External Client Apps** → **External Client App Manager**, and click **New External Client app** to add a new application.  *New external client app* 4. Under **Basic Information**, enter a name and contact email for the app.  *Application settings* 5. Scroll to **API (Enable OAuth Settings)** and check the **Enable OAuth** checkbox.  *Enable OAuth* 6. Under **App Settings**, configure the following: - **Callback URL**: the redirect URL from the PagerDuty Private Status Page's Single Sign-On configuration page - **OAuth Scopes**: Add the following two scopes: - `Access unique user identifiers (openid)` - `Access the identity URL service (id, profile, email, address, phone)` - Check **Configure ID token** - Check **Include standard claims** - Check **Custom Attributes** 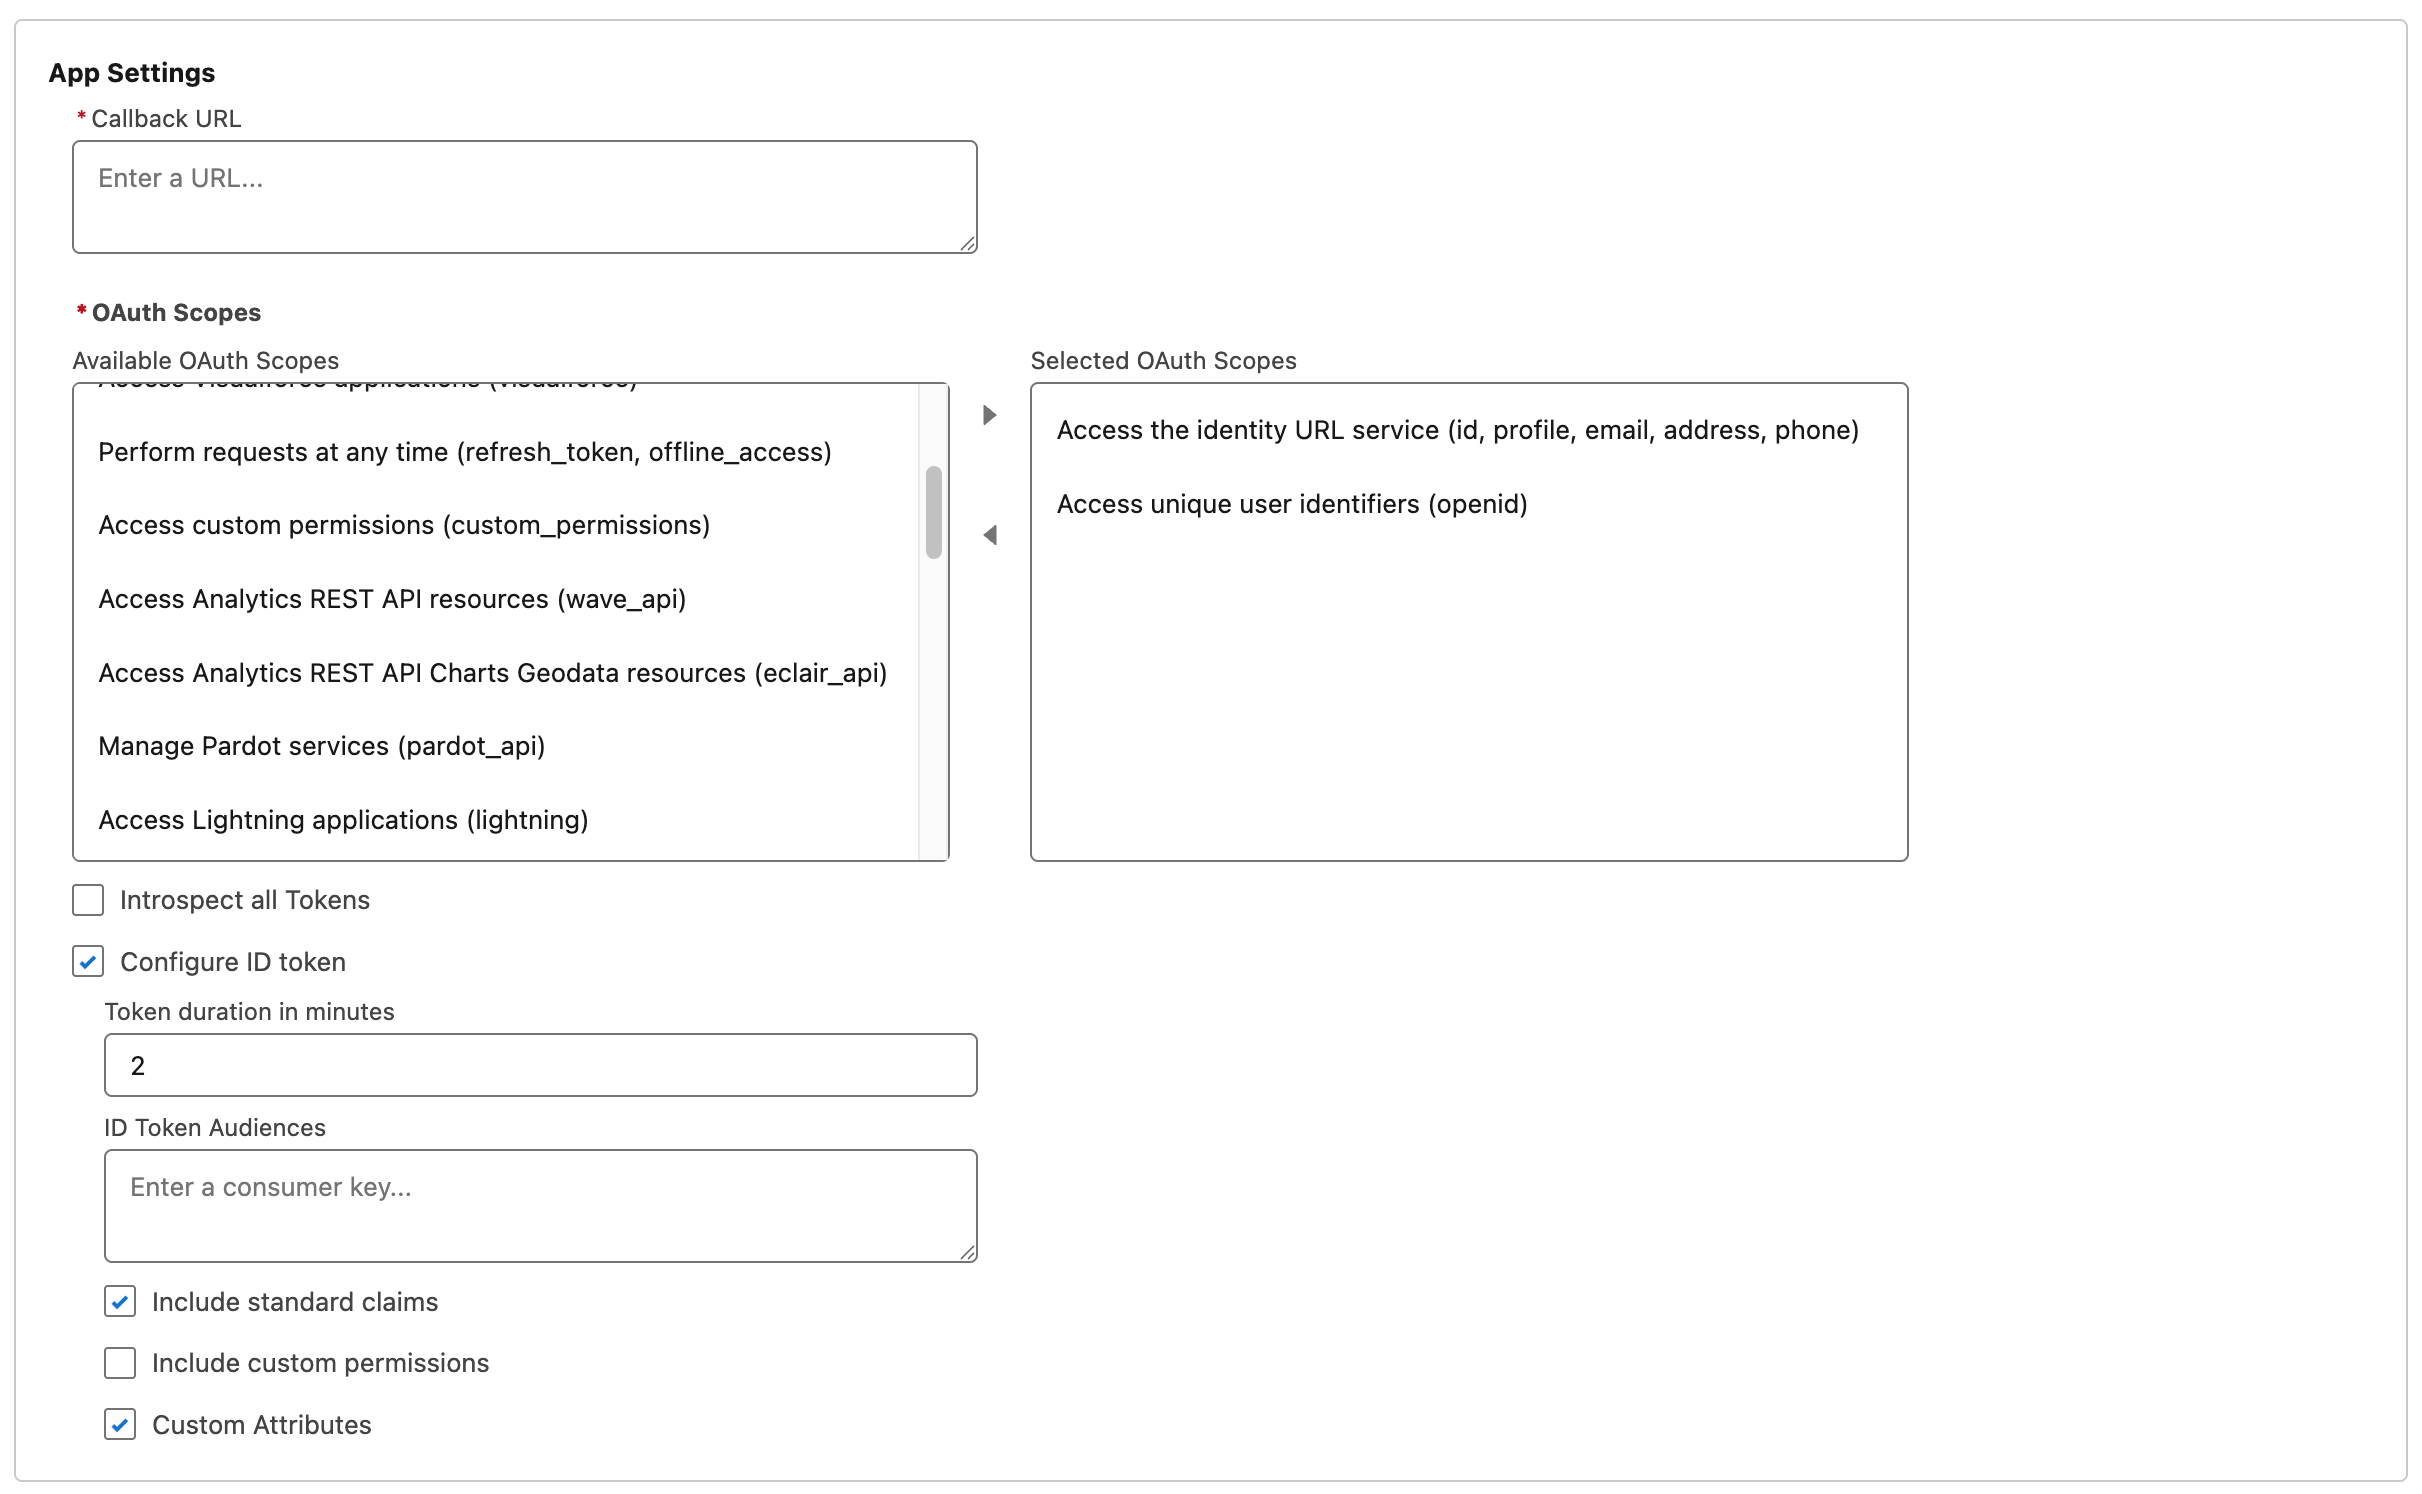 *App details* 7. Under **Flow Enablement**, select: - **Enable Authorization Code and Credentials Flow** - **Require user credentials in the POST body for Authorization Code and Credentials Flow**  *Flow enablement* 8. Under **Security**, select (some may be on by default): - **Require secret for Web Server Flow** - **Require secret for Refresh Token Flow** - **Require Proof Key for Code Exchange (PKCE) extension for Supported Authorization Flows** - **Issue JSON Web Token (JWT)-based access tokens for named users**  *Security settings* 9. Click **Create**. 10. Go to the external client app's **Policies** tab and click **Edit**. 11. Under **App Policies**, set the **Start Page** field to **None**.  *App Start Page* 12. Click **Save**. 13. Go to the external client app's **Settings** tab. 14. Expand the **OAuth Settings**, and click the **Consumer Key and Secret** button. 15. Copy the **Consumer Key** and **Consumer Secret** values. 16. In your PagerDuty Private Status Page's Single Sign-On settings, enter the following: - **Configuration URL**: `https://{{your-Salesforce-subdomain}}.my.salesforce.com/.well-known/openid-configuration` - **OpenID client ID**: `{{Consumer Key}}` - **OpenID client secret**: `{{Consumer Secret}}` 17. Click **Save**. #### Profile Mapping and Custom Claims 1. Back in Salesforce, grant permissions to the groups that you want to be able to access the page (if users are not self-authorizing). To do this, go to your external client app's **Policies** tab and click **Edit**. Select the **Profiles** and/or **Permission Sets** for users who can access the app.  *App Profiles and Permission Sets* 2. Expand **OAuth Policies** and scroll to **Custom Attributes**. 3. Click the plus button to add a new attribute: - **Attribute Key**: `status_pages` - **Attribute Value**: `"PXXXXXX"` (including the double quotes, and replacing `PXXXXXX` with the **Custom Claim Value** from your PagerDuty Private Status Page's Single Sign-On configuration page) 4. Click **Save** for the new custom attribute, then click **Save** at the bottom of the **Policies** page. ### Ping Identity #### Create the Application 1. Go to **Applications**, and click to add a new application.  *Add application* 2. Enter an application name, select an application type, and click **Save**. 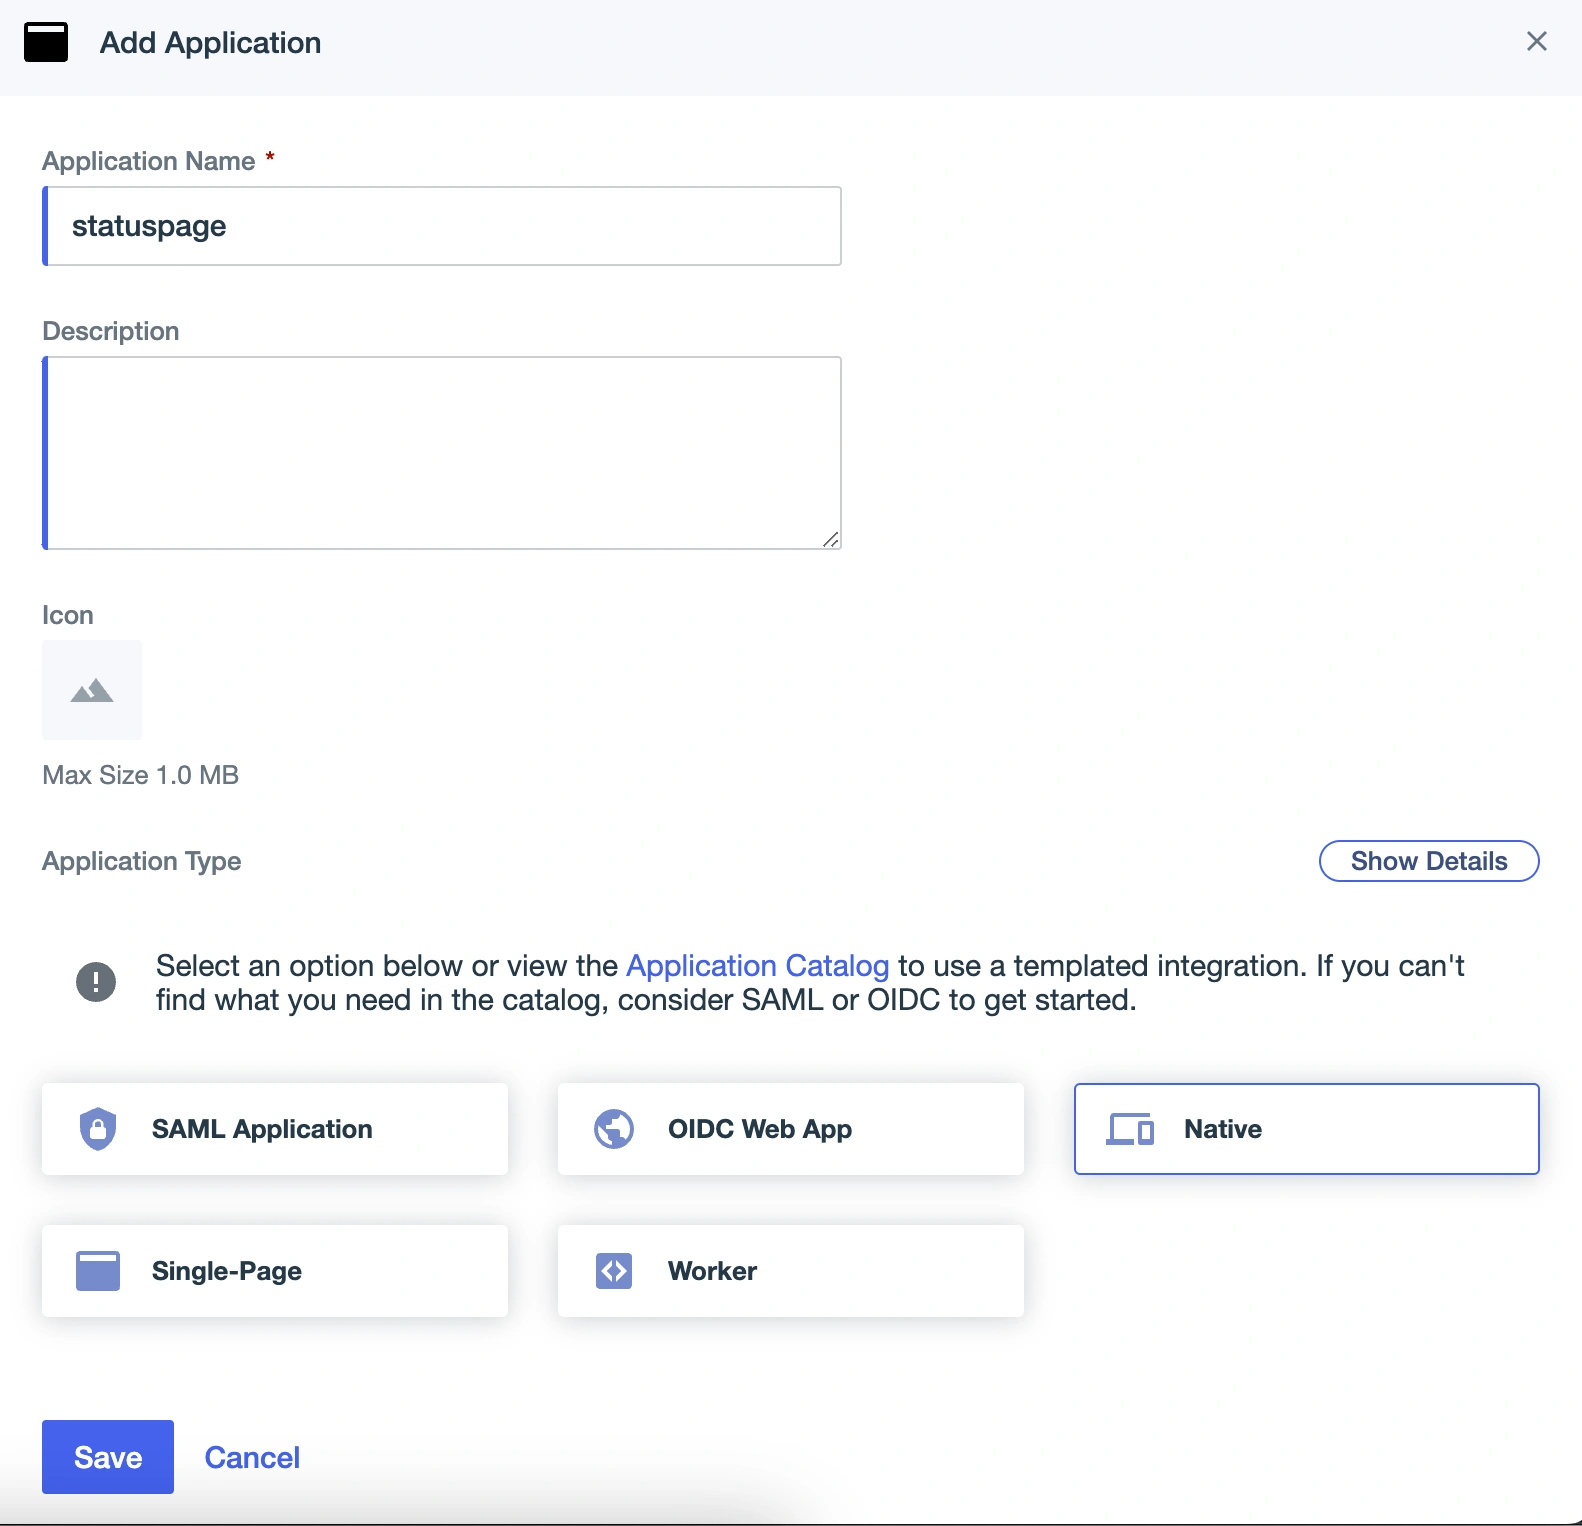 *Application settings* 3. Click on the **Configuration** tab and the **URLs** dropdown. 4. Copy the **OIDC Discovery Endpoint**, the **Client ID**, and the **Client Secret**, and paste these values into the PagerDuty private page Single Sign-On Settings.  5. Edit the configuration by clicking the pencil button in the top right corner, update the following fields, and save: 1. **Client Credentials**: Enable 2. **Redirect URIs**: the redirect URL from the PagerDuty Single Sign-On page 3. **Token Endpoint Authentication Method**: **Client Secret Post** 4. **Initiate Login URI**: Login URL from the PagerDuty Single Sign-On page 5. **Signoff URLs**: Logout URL from the PagerDuty Single Sign-On page 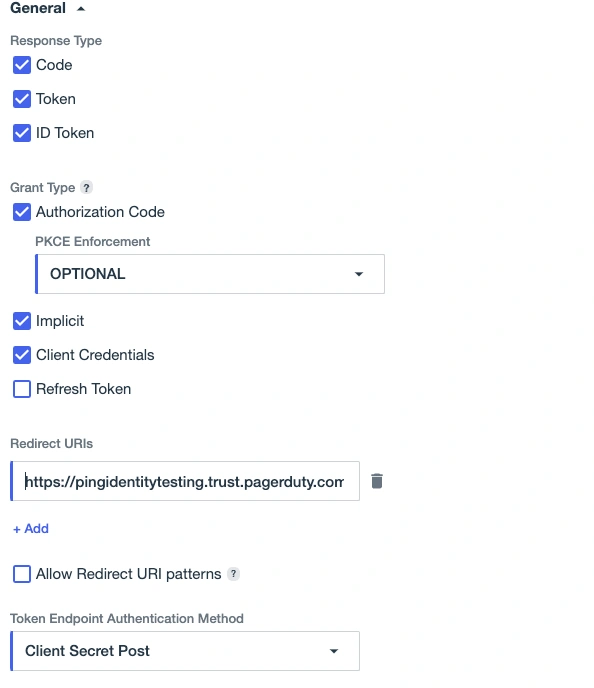 *General settings* 6. In the **Resources** tab, check that the **openid** scope is available.  *Allow openid* #### Profile Mapping and Custom Claims 1. Go to **Directory** → **User Attributes** and click to add a new attribute. 2. Select **Declared**, enter a name for the attribute and save it. 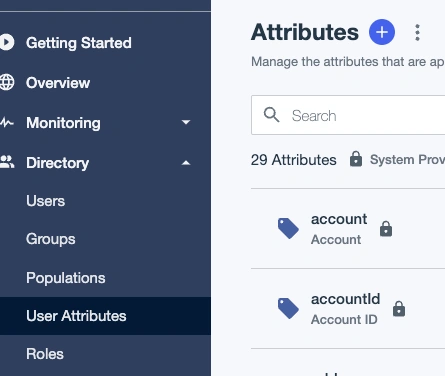 *Add attribute* 3. Go to **Users**, edit any users you want to grant access, and click **Add** next to **Custom Attributes**. Enter the **custom claim ID** value found on the Single Sign-On page. 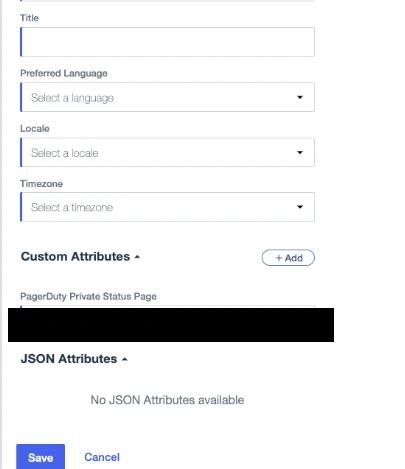 *Custom attributes* 4. Go to **Applications** → **Resources**, find the openid resource that is being used, and select it. 5. Go to the **Attributes** tab and click to add a new attribute. 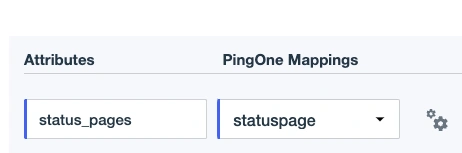 *Attributes* 6. Enter the **Custom Claim Key** from the Single Sign-On page and select the attribute that you created in steps 1–3. ## Remove Users from a Private Status Page Removing a user's access through your SSO provider alone will not automatically remove them as a subscriber to a Private Status Page in PagerDuty as well. They may continue to receive status update until you have taken the following steps: 1. Remove the user's access in your SSO provider. Please see your SSO provider's documentation for specific instructions. 2. In the PagerDuty web app, navigate to **Status** → **External Status Page**. 3. Select the desired status page's **name**. 4. In the left panel, select **Subscribers**. 5. Select the appropriate tab (i.e., **Email**, **Slack** or **Webhook**), and _optionally_ enter a search term to find the desired user. 6. On the right of the user's row, select → **Delete**. 7. In the confirmation modal, click **Yes, delete**.
--- URL: https://docs.pagerduty.com/incident-management/communicate/internal-status-page # Internal Status Page View the current status of business services impacted by incidents, and provide status updates to stakeholders across your organization PagerDuty’s Internal Status Page provides technical responders, business responders, and leaders a live, shared dashboard of system health to improve awareness of operational issues. It displays the current status of key business services and sends notifications to alert users when business services are impacted. This feature improves communication between response teams and stakeholders during incidents. 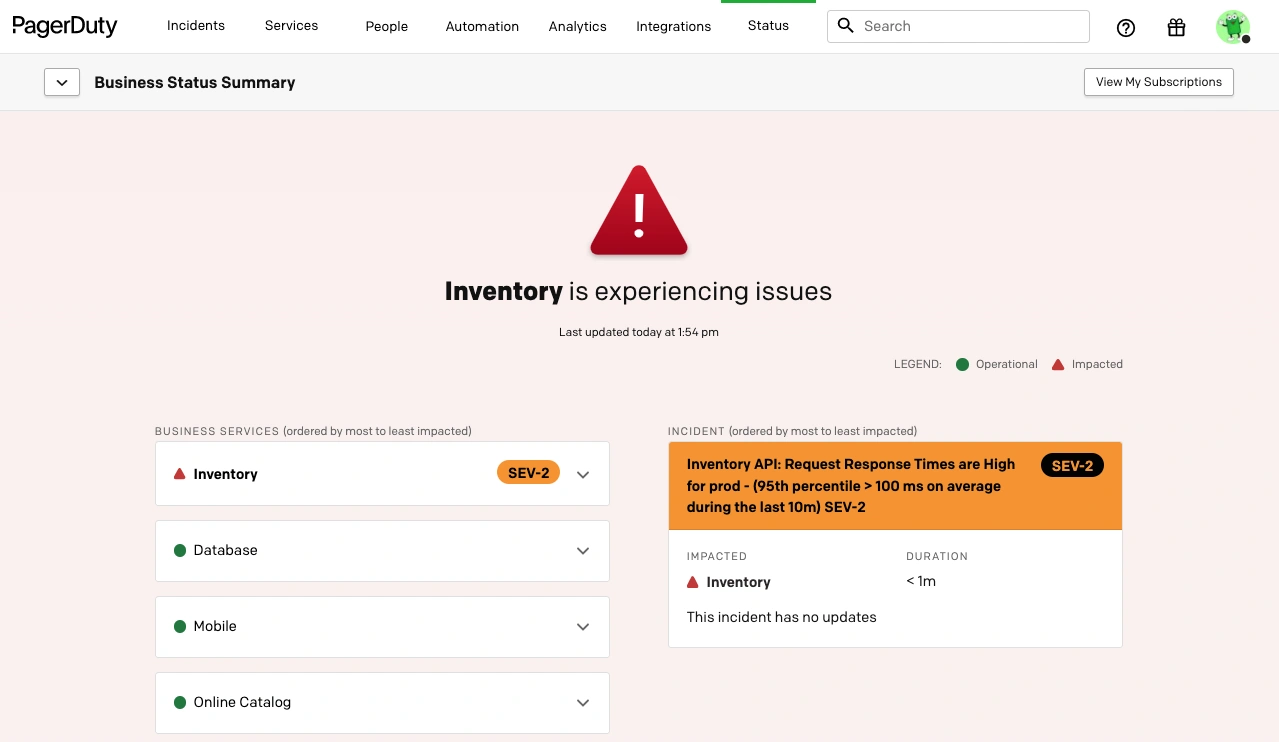 > **Availability:** The Internal Status Page feature is available on PD Reliability Platform plans. It's also available on the following pricing plans: Business, Enterprise for Incident Management and Digital Operations (Legacy). Please contact our [Sales Team](https://www.pagerduty.com/contact-sales/) if you would like to upgrade to a plan that includes this feature. > **Looking for our Company Status Page?:** This article describes our Internal Status Page product, which you can use to create your own status pages. If you are looking for more information about the PagerDuty company status page at [status.pagerduty.com](https://status.pagerduty.com/), please read [PagerDuty Outage Notifications](/get-started/pagerduty-outage-notifications). ## Configure the Internal Status Page > **Required User Permissions:** Manager, Global Admin and Account Owner base roles can configure the Internal Status Page. ### Step 1: Create Business Services Follow our instructions on [configuring business services](/incident-management/services/business-services#create-a-business-service) to create new business services and add supporting services. ### Step 2: Edit Business Service Settings Follow our instructions to [edit business service settings](/incident-management/services/business-services#edit-business-services-settings) to choose how you would like to indicate business service incident impact on the status dashboard. ### Step 3: Configure Incident Priority in Your Account Follow our instructions to [configure incident priority](/incident-management/incidents/incident-priority#establish-an-incident-classification-scheme). Once business services have been created and incident priority has been enabled, your status dashboard will be operational. > **Business Service Incident Impact Settings:** Please note that incident priority will indicate business service incident impact based on the settings configured in Step 2 (above): > > - **If a supporting technical service has an open incident with any priority assigned**: _All_ incidents with an **assigned priority** will indicate business service incident impact on the status dashboard. > - **If a supporting technical service has an open incident with a priority at or above `[SELECTED-PRIORITY]`**: _Only_ incidents **with priority levels at or above your predefined levels** will indicate business service incident impact on the status dashboard. ## Create Custom Dashboards Custom dashboards allow you to create multiple dashboards for different business units or teams with varying multiple Business Service views. > **Required User Permissions:** Managers, Global Admins and Account Owners can create multiple custom dashboard views. To create a new dashboard: 1. Navigate to **Status**, click the **Business Status Summary** dropdown and select **New Dashboard**. 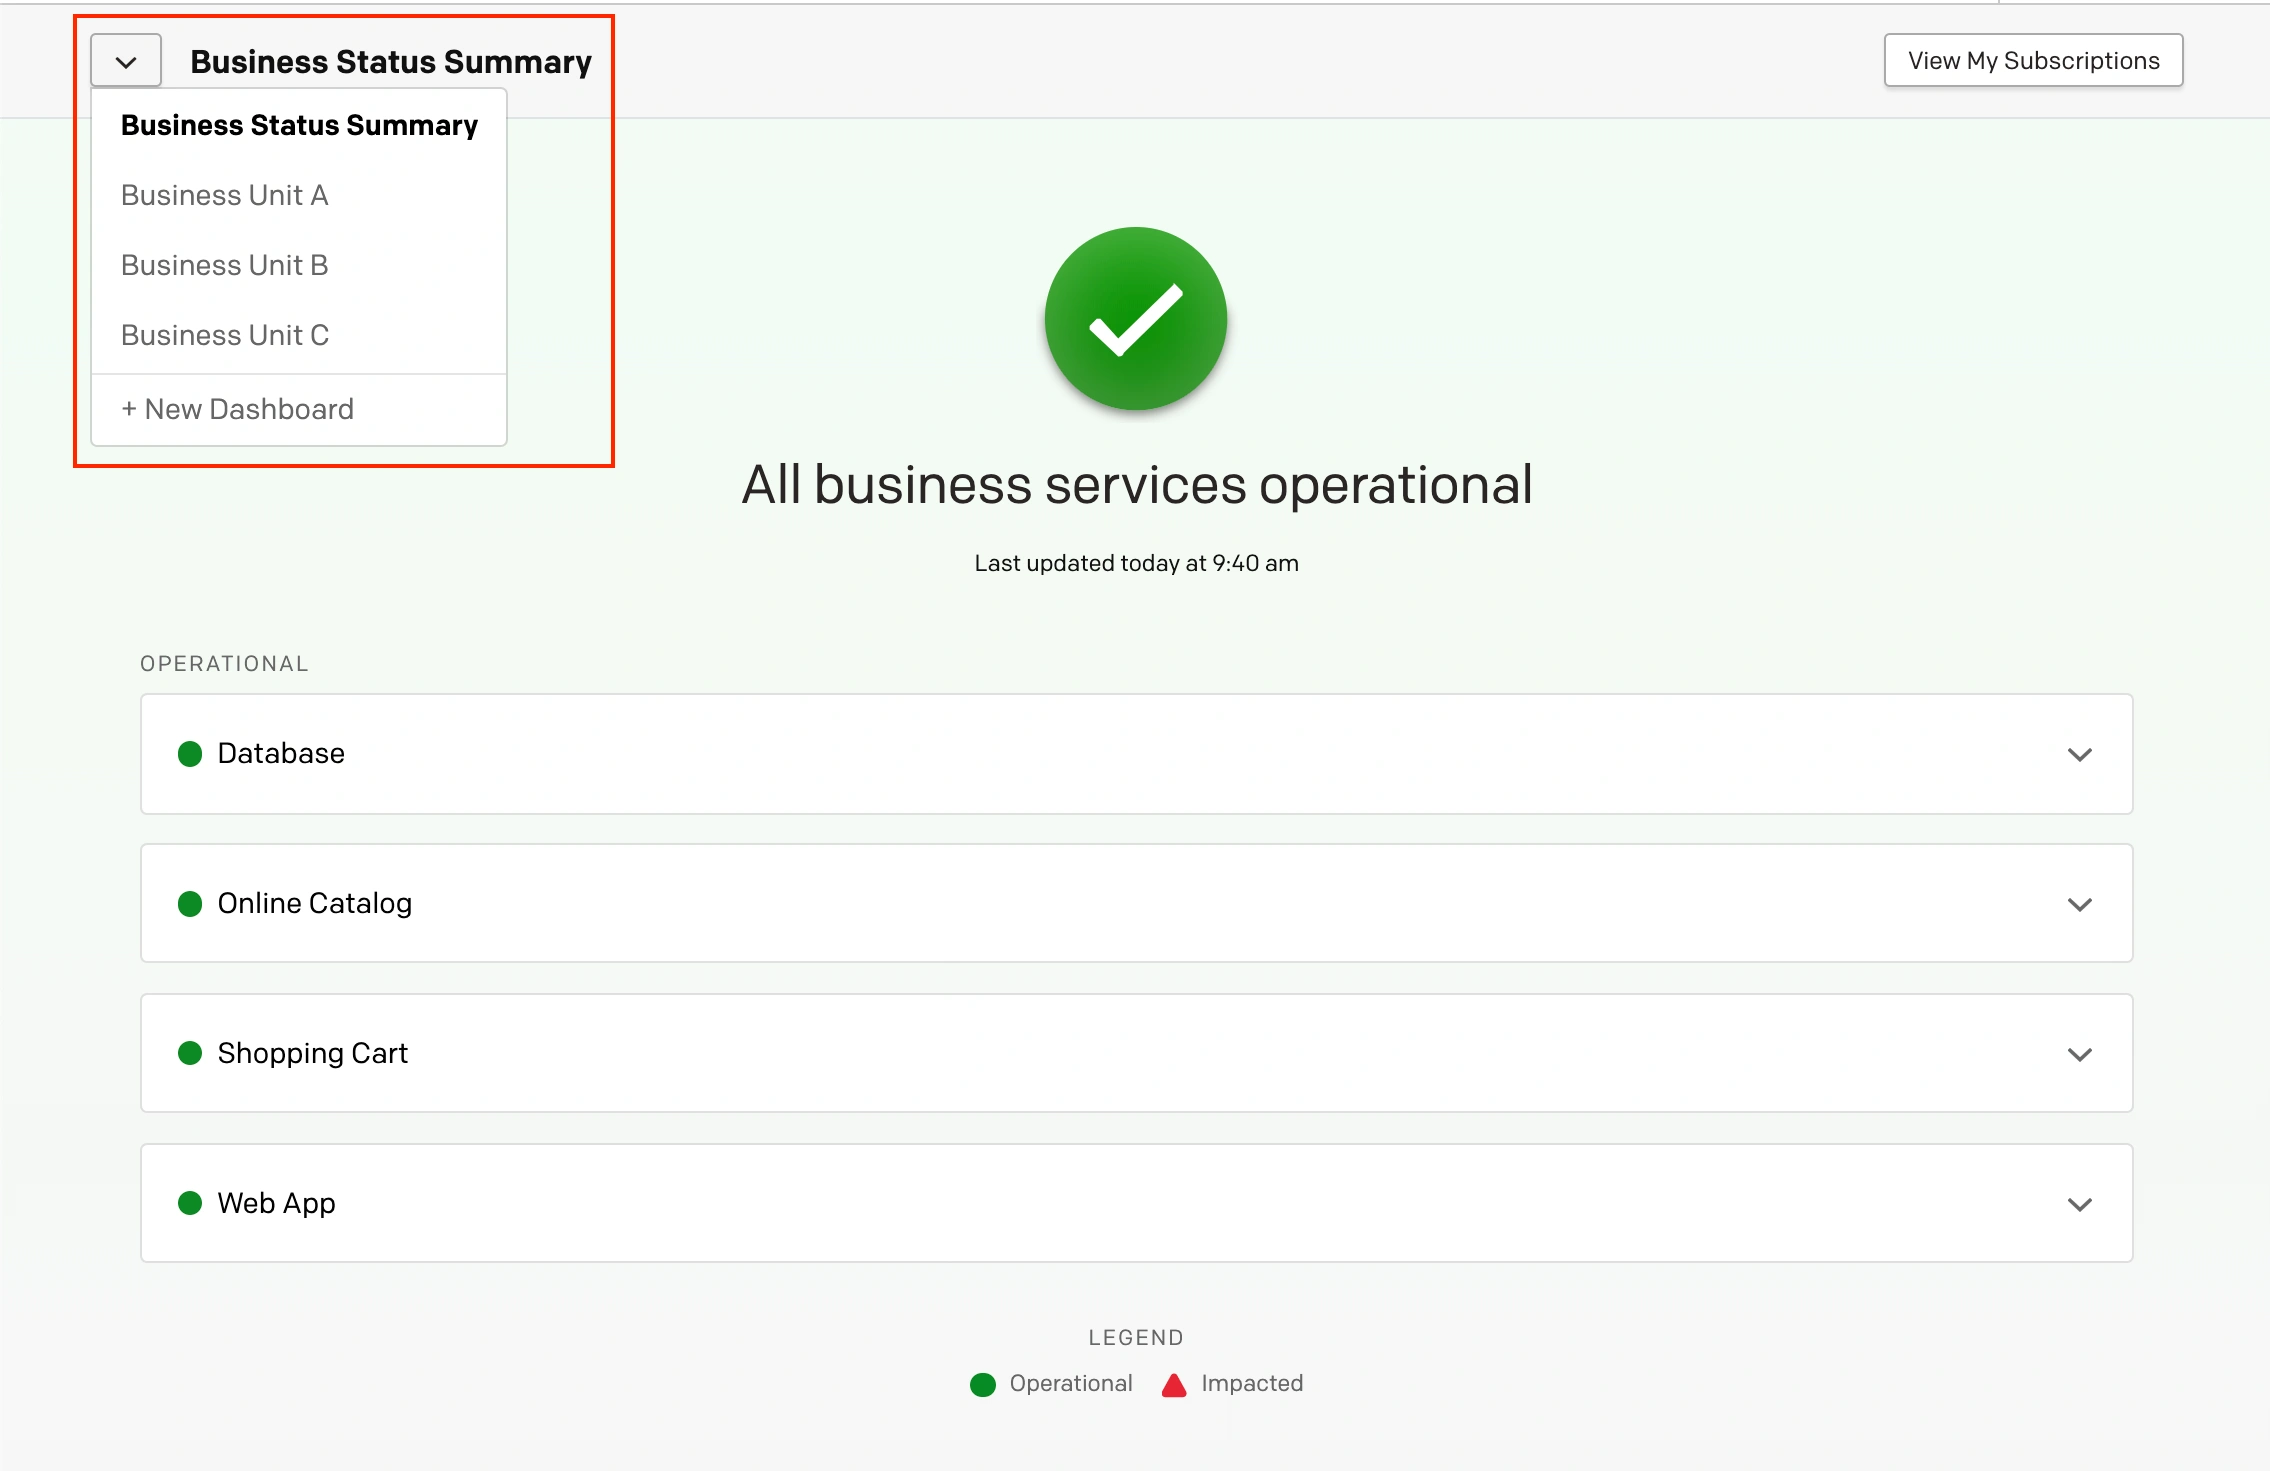 2. Enter a meaningful **Name** and optionally edit the **Custom URL**. Search and select which **Business Services** you would like to include in this dashboard view by clicking to the right of their name. Click **Create Dashboard** to save. ### Edit Custom Dashboards 1. Navigate to **Status**, select the **Business Service Summary** dropdown and select your desired dashboard. 2. Click **Edit Dashboard** on the right and make any edits necessary. 3. Click **Save Changes**. ### Delete Custom Dashboards 1. Navigate to **Status**, select the **Business Service Summary** dropdown and select your desired dashboard. 2. Click **Edit Dashboard** on the right. On the next screen, click **Delete Dashboard** at the bottom left. 3. A modal will appear confirming that the custom dashboard will be removed. Click **Delete Dashboard** again to confirm. ## View the Internal Status Page Designed with business stakeholders in mind, the status dashboard provides an overview of each business services' status, showing you at a glance whether any are being affected by incidents. > **Required User Permissions:** All users can view the internal status pages. > **Refresh Rate:** The Internal Status Page refreshes every 30 seconds. ### View the Internal Status Page in the Web App To view the web status dashboard, log in to your PagerDuty account, navigate to **Status** in the menu, or access via link at `YOUR-SUBDOMAIN.pagerduty.com/status-dashboard`. ### View the Internal Status Page in the Mobile App To view the mobile status dashboard, log in to your PagerDuty account, tap the menu, and tap **Status Dashboard**. ### Limited Stakeholder Access Level The Limited Stakeholder role provides users access to view and subscribe to the status dashboard, view their own user profile, and does not show any other parts of PagerDuty, whether they are using the web UI or the mobile app. If your organization [creates more than one status dashboard](#create-custom-dashboards), Limited Stakeholders can view all of them in the top-left dropdown, and manage their subscriptions by clicking **View My Subscriptions**.  This access level is great for users who don't need to see all of the incident and responder activity in your account, but need some level of insight into your systems' health. To set up a Limited Stakeholder user, please visit our [Advanced Permissions](/account-admin/advanced-permissions#limited-stakeholder-users) article. ## Business Service Statuses There are two business service statuses: - **Impacted** (denoted by a red ): A business service will appear as impacted on the status dashboard when it is experiencing an active incident on one of its supporting services. A business service can become impacted by an incident automatically or manually. - **Operational** (denoted by a green ): A business service will appear as operational when there are no active incidents impacting its supporting services. During an incident, responders can update the status of a business service to indicate its disruption to business stakeholders via the status dashboard. A business service will appear as disrupted on the status dashboard in **two** circumstances: 1. **Automatically** when there is an open incident on any supporting technical service mapped to the business service and the incident has a [priority](/incident-management/incidents/incident-priority) assigned. Depending on your business service settings, this incident may need a [priority assigned over a certain level](/incident-management/services/business-services#edit-business-services-settings). Incidents that have not been assigned a priority will not automatically appear on the status dashboard, so that it does not become cluttered with operational noise. 2. **Manually** when a user associates an incident with a business service by selecting the appropriate business service under the **Impacted Business Services** dropdown, found in the **Status Updates** tab of **Incident Details**. These manual incidents will appear on the Dashboard regardless of the Business Services setting in **When should a business service show an incident**. > **Required User Permissions:** Any user who has incident management permission should be able to add or remove an impacted business service from an incident. > > Regarding which business services a user can add/remove — they should be able to see and add/remove any business services they can see elsewhere in the product (any non private business services for most users, different for restricted access users). 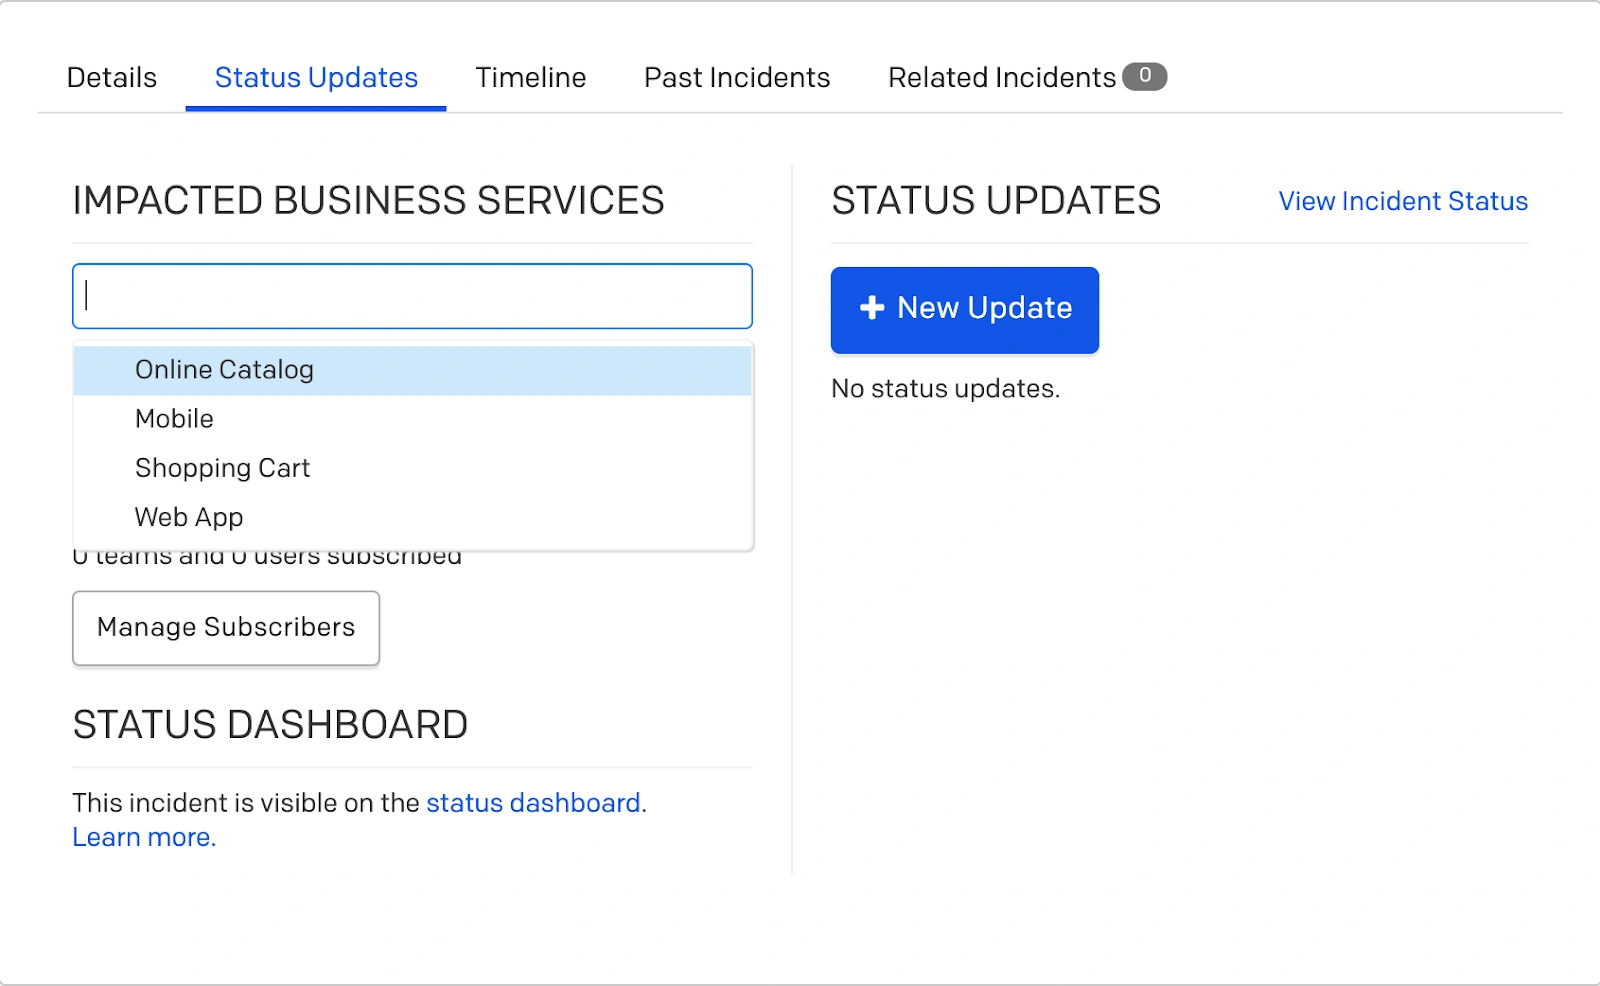 When the above criteria are not met, the business service will show as operational on the status dashboard. ### View Status Updates When responders make status updates on incidents associated with an impacted business service, stakeholders can view these on the status dashboard. For more information on sending status updates, please read our [Communicate With Stakeholders](/incident-management/communicate/communicate-with-stakeholders#status-updates) article. 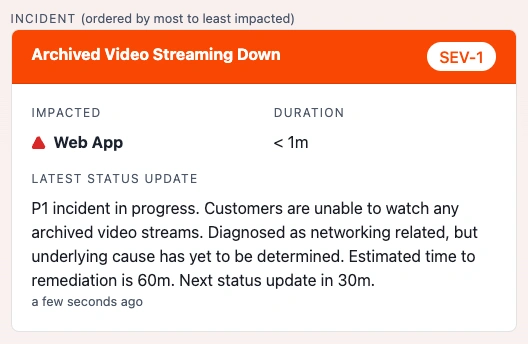 ### Status Update Branding > **Availability:** Status update branding is available on PD Reliability Platform plans. It's also available with our Modern Incident Response suite of features available on the following pricing plans: Business, Enterprise for Incident Management and Digital Operations (Legacy). > **Required User Permissions:** Account Owners and Global Admins can manage status update branding. If you would like to change the logo that appears in your status update emails (it will be the PagerDuty logo by default), you may upload a custom logo.  To upload a custom logo: 1. Navigate to **User Icon** → **Account Settings** and select the **Status Updates** tab. 2. Click **Replace Logo** and upload the file from your device. Once uploaded, it is automatically saved. If you would like to preview how this logo will appear on your emails, click **Preview**. If at any time you wish to switch back to the default PagerDuty logo, you can click **Reset PagerDuty Logo** on the right side of the screen.  ## Subscribe to Business Services Please see our article on [Business Service Subscriptions](/incident-management/services/business-services/subscription) for more information. ## FAQ **How can I set incident priority?** There are three ways to set incident priority: 1. [Set priority manually from the web or mobile app](/incident-management/incidents/incident-priority). 2. [Set priority via the REST API](/developer/api/reference/rest/incidents/create-incident). You can use [this endpoint](/developer/api/reference/rest/priorities/list-priorities) to get your **priority_id** values. 3. [Set priority via Event Orchestration](/ai-automation/aiops/event-orchestration#basic-event). **If I manually disassociate a business service from an incident, and then re-associate it, will upstream business service dependencies still show up on the Internal Status Page?** No. If the upstream dependency is removed, our system will remember that it had been disassociated and it will not show up on the status dashboard after it has been re-associated. Here’s an example to illustrate: - There’s a technical service for mobile push notifications where an incident has been triggered. This is linked to two business services: one for mobile push notifications, and one upstream business service for the whole mobile app. Initially when this incident is triggered, it will show both business services affected on the status dashboard. - After further analysis, the engineer determines only push notifications are affected, not the entire mobile app, so they remove the Mobile App Business Service from impacted services and now only the Push Notifications Business Service shows as affected. - Now, if after removing the Mobile App Business Service they decide to re-associate it, it will NOT automatically show the Mobile App Business Service as affected, even though it’s upstream and dependent. This is because our system remembers that it’s not the whole mobile app that’s affected, due to the engineer’s previous removal. **We've made large-scale changes via API to our Business Services and dependencies. Will there be any possible lag time in processing these changes on the status dashboard?** Yes, please be aware that large-scale changes to your business services and dependencies may temporarily impact the accuracy of the status dashboard. --- URL: https://docs.pagerduty.com/incident-management/communicate/status-pages-overview # Status Pages Overview Get real-time, visual clarity of your systems' health and performance PagerDuty Status Pages provide visual, real-time insights into an organization’s operations, and the status of incident resolution. PagerDuty users can proactively and securely communicate real-time operational updates without context switching to other tools, giving users one platform, PagerDuty, as the single source of truth. PagerDuty Status Pages improve customer experience, reduce the burden on support teams, and eliminate the need to maintain separate status page infrastructure, allowing businesses to consolidate their tools while providing better service to their customers. PagerDuty offers the following status page products to help keep users and customers informed about your infrastructure's health: - [Internal Status Page](#internal-status-page) - [External Status Page](#external-status-page) - [Private Status Page](/incident-management/communicate/external-status-page/private-status-page) > **Looking for our Company Status Page?:** If you are looking for information about PagerDuty's corporate status page at [status.pagerduty.com](https://status.pagerduty.com/), please read [PagerDuty Outage Notifications](/get-started/pagerduty-outage-notifications). ## Internal Status Page PagerDuty’s Internal Status Page feature provides technical responders, business responders, and leaders a live, shared view of system health to improve awareness of operational issues. It displays the current status of key business services and sends notifications to alert users when business services are impacted. This feature improves communication between response teams and stakeholders during incidents. Please read [Internal Status Page](/incident-management/communicate/internal-status-page) for more information. ## External Status Page External Status Pages offer public audiences a unified source of truth about your infrastructure’s health. This feature can be customized to fit your brand’s look and feel, and you can define different views and sets of [Business Services](/incident-management/services/business-services) to display. Visitors can stay informed about ongoing incidents and read status updates, or subscribe to your status page to receive notifications via email, Slack or webhook. Please read [External Status Page](/incident-management/communicate/external-status-page) for more information. ## Private Status Page Private Status Pages provide secure, real-time system updates to authorized users, ensuring that internal teams, partners, or key customers stay informed without exposing sensitive information to the public. Designed for organizations that need controlled access to incident status, these pages enhance communication, reduce confusion, and improve trust by delivering the right information to the right audience. Please read [Private Status Page](/incident-management/communicate/external-status-page/private-status-page) for more information. --- URL: https://docs.pagerduty.com/incident-management/communicate/status-update-templates # Status Update Templates Customize and standardize your status updates Status update templates simplify and standardize incident status communications. This feature frees up time during incident response and keeps stakeholders informed with consistent, detailed context. > **Availability:** This feature is available on current Business, Enterprise for Incident Management, and Digital Operations (Legacy) plans. Contact the [Sales Team](https://www.pagerduty.com/contact-sales/) to upgrade to a plan that includes this feature. > **Required User Permissions:** If you have one of the following roles, you can [create](#create-a-template-in-the-web-app) and [edit](#edit-a-template-in-the-web-app) status update templates: > > - Manager > - Global Admin > - Account Owner > > You can [use a status update template during incident response](#use-a-status-update-template-during-incident-response) with any role. ## Create a Template in the Web App > **Product Limit:** You can add up to 500 templates to your account. 1. Navigate to **Incidents** → **Status Update Templates**. 2. Click **New Template**. 3. Enter the following information in the fields provided, then click **Create Template**: | Field | Value | | :--------------------------- | :------------------------------------ | | **Name** | Enter a name for the template. | | **Description** _(optional)_ | Enter a description for the template. | 4. Enter the following information in the fields provided: | Field | Value | | :---------- | :--------------------------------------------------------------------------------------------------------------------------------------------------------------------------------------------------------------------------------------------------------------------- | | **Message** | In the **Message template** section, enter your desired text. This text appears in push, email, and SMS status update notifications. | | **Subject** | In the **Email template** section, enter a subject line. | | **Body** | In the **Email template** section, use the rich text editor to customize the default email status update notification body. Refer to the [Fields in Email Notifications](#fields-in-email-notifications) section for more information about including dynamic content. |  *Message template* 5. Click **Save**. Before saving, you can click **Preview** in the top-right at any time to view how the message appears in each notification channel. ### Fields in Email Notifications Email status update notifications can dynamically include information about the status update or incident. You can select standard fields and [custom fields](/incident-management/incidents/custom-fields-on-incidents). While editing the content of the email status update notification in the rich text editor: 1. In the **Fields** panel on the right, click to copy the field to your clipboard. 2. Paste the field into the appropriate place in the email template. The field appears in the email body between double curly braces, for example, `{{ status_update.message }}`. 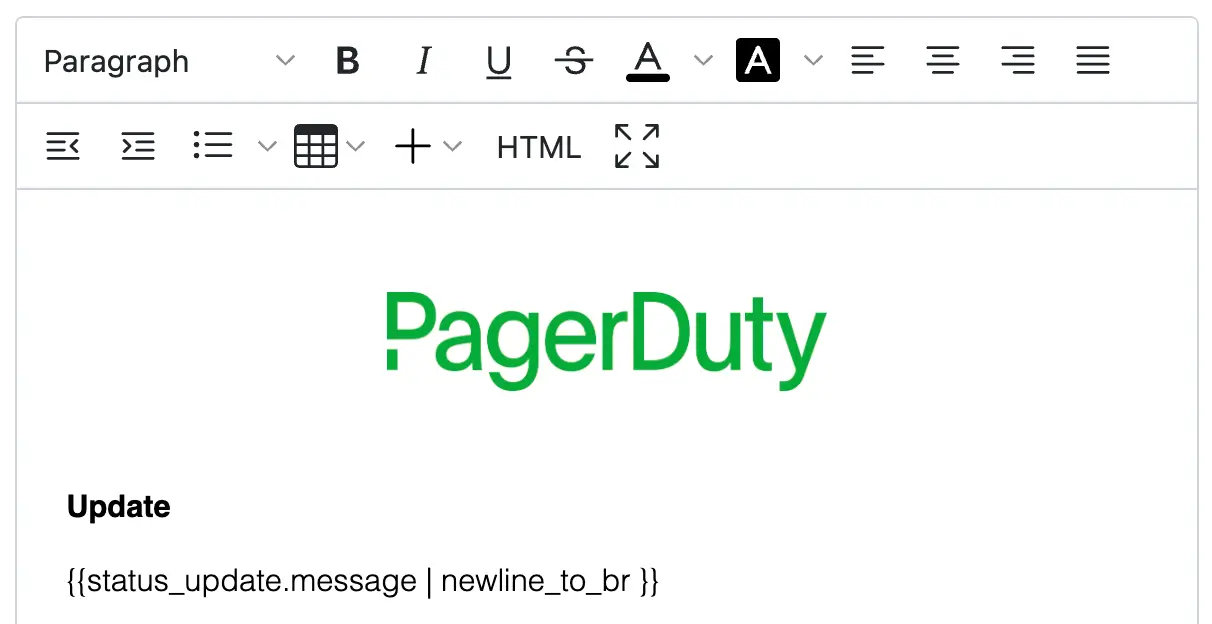 *Status update message field* The most common fields are listed by default; however, you can also enter a term to search for a more complete list of objects and their associated attributes. Refer to the [FAQ](#what-is-the-full-list-of-supported-fields) section for an exhaustive list of supported fields.  *Search fields* ### Support for Liquid Templating Language If you want to create conditional communications, status update templates support the [Liquid](https://shopify.github.io/liquid/) templating language across all configurable fields, including **Message** and email **Subject and Body**. When referring to fields inside a Liquid tag, omit the double curly braces `{{ ... }}`. For example, the following snippet transforms the incident title to uppercase for incidents with a "P1" [priority](/incident-management/incidents/incident-priority), and otherwise leaves it unchanged: ```liquid {% if incident.priority.name == "P1" %} {{ incident.title | upcase }}{% else %}{{ incident.title}} {% endif %} ``` > **Note:** The following Liquid tags are not supported: > > - `tablerow` > - `liquid` > - `echo` > - `render` > - `include` #### Fields with Multiple Values Depending on where an incident is in its lifecycle, the following fields can contain more than one value (that is, in an array): - **Status updates**, `incident.previous_status_updates` - **Impacted business services**, `incident.impacted_business_services` - **Impacted technical services**, `incident.impacted_services` - **Acknowledgements**, `incident.acknowledgements` - **Assignments**, `incident.assignments` - **Teams**, `incident.teams` Since these items are stored in an array, you might need to provide an index to access the values of their properties. For example, `{{incident.previous_status_updates[0].message}}` displays the first status update associated with the incident. Alternatively, use a `for` loop to display all values stored in an array. The following example iterates through all status updates associated with an incident: ```liquid {% for update in incident.previous_status_updates %} {{update.message}} {% endfor %} ``` You can also access more than one of the properties associated with the `update` variable. For example, you can include the time of a status update with the message: ```liquid {% for update in incident.previous_status_updates %} {{update.created_at}} — {{update.message}} {% endfor %} ``` Additionally, you can display only the most recent status update and its creation time. Status updates are sorted by date and time in descending order, so you can use Liquid's `first` syntax to display only the most recent update: ```liquid {% assign update = incident.previous_status_updates | first %} {{update.created_at}} — {{update.message}} ``` For more information, refer to the [Liquid](https://shopify.github.io/liquid/) templating language documentation. ## Edit a Template in the Web App 1. Navigate to **Incidents** → **Status Update Templates**. 2. Click → **Edit** to the right of the template you want to edit. 3. Edit the template as desired. 4. Click **Save**. ## Duplicate a Template in the Web App 1. Navigate to **Incidents** → **Status Update Templates**. 2. Click → **Duplicate** to the right of the template you want to duplicate. 3. Enter the following information in the fields provided, then click **Duplicate Template**: | Field | Value | | :--------------------------- | :---------------------------------------- | | **Name** | Enter a new name for the template. | | **Description** _(optional)_ | Enter a new description for the template. | ## Delete a Template in the Web App 1. Navigate to **Incidents** → **Status Update Templates**. 2. Click → **Delete** to the right of the template you want to delete. 3. In the confirmation modal, click **Delete**. This action is irreversible and cannot be undone. ## Use a Status Update Template During Incident Response 1. Navigate to the incident detail page. 2. Select the **Status Updates** tab. 3. Click **New Update**. 4. Select a communication template from the dropdown. 5. Click **Preview**. 6. (_Optional_) If necessary, adjust the pre-populated text in the **Message** field. Adjustments made in the **Message** field also reflect in the email body. 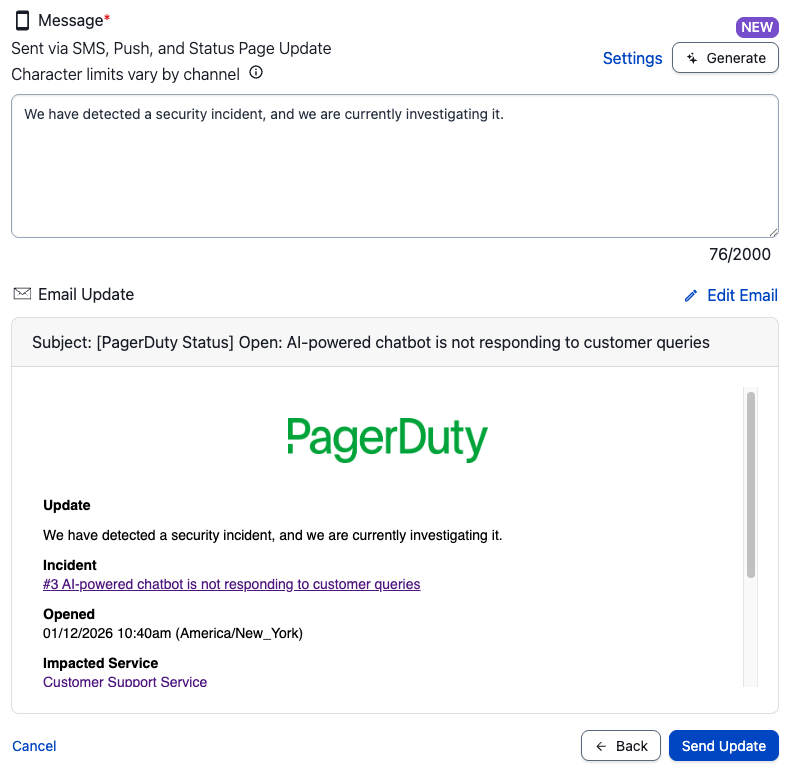 *Status Update Template* 7. Click **Send Message** to notify [incident subscribers](/incident-management/communicate/communicate-with-stakeholders#add-subscribers-to-an-incident). > **Requirement:** The email **Subject** has a maximum of 255 characters. A status update notification containing more than the maximum character length returns the following error message: > > `There is a problem with this template. Please report this problem to your account administrator.` > > If this occurs, you can click **Edit Email** to adjust the **Subject**. ## FAQ **What is the full list of supported fields?** The following table details the full list of fields you can use in your status update templates: | Category | Field | Description | Example Value | | :-------------- | :--------------------------------------------------------- | :----------------------------------------------------------------------------- | :-------------------------------------------------------------------------- | | Incident | `incident.created_at` | The time the incident was created | `2022-10-06T21:30:42Z` | | | `incident.html_url` | PagerDuty URL to this incident | `https://subdomain.pagerduty.com/incidents/PT4KHLK` | | | `incident.id` | Unique ID of the incident | `Q0U747RKFEV100` | | | `incident.incident_number` | The incident number | `1234` | | | `incident.last_status_change_at` | The time of the last status change for this incident | `2022-08-15T16:57:40Z` | | | `incident.last_status_change_by.html_url` | PagerDuty URL of the entity that made the last status change for this incident | `https://subdomain.pagerduty.com/service-directory/PAW0B9L` | | | `incident.last_status_change_by.id` | The ID of the entity that made the last status change for this incident | `PAW0B9L` | | | `incident.last_status_change_by.summary ` | The name of the entity that made the last status change for this incident | `Technical Service Name` | | | `incident.last_status_change_by.type` | The type of entity that made the last status change for this incident | `service_reference` | | | `incident.priority.name` | The priority of the incident | `P2` | | | `incident.resolved_at` | The time the incident was resolved | `2023-08-22T07:12:50Z` | | | `incident.status` | The status of the incident | `acknowledged` | | | `incident.summary` | Short description of the incident containing the incident number and title | `[#1234] The server is on fire.` | | | `incident.title` | The title of the incident | `The server is on fire.` | | | `incident.urgency` | The urgency of the incident | `high` | | | `incident.linked_records.servicenow_itsm_incidents[0].id` | The ID of the ServiceNow ITSM incident | INC1234567 | | | `incident.linked_records.servicenow_itsm_incidents[0].url` | The URL of the ServiceNow ITSM incident | `https://subdomain.servicenow.com/incident.do?sys_id=INC1234567` | | | `incident.linked_records.servicenow_csm_cases[0].id` | The ID of the ServiceNow CSM case | CS1234567 | | | `incident.linked_records.servicenow_csm_cases[0].url` | The URL of the ServiceNow CSM case | `https://subdomain.servicenow.com/csm_case.do?sys_id=CS1234567` | | | `incident.linked_records.jira_incidents[0].id` | The unique identifier for the Jira incident | INC-1234 | | | `incident.linked_records.jira_incidents[0].url` | The URL of the Jira incident | `https://subdomain.jira.com/browse/INC-1234` | | | `incident.linked_records.salesforce_cases[0].id` | The unique identifier for the Salesforce case | Case #123456 | | | `incident.linked_records.salesforce_cases[0].url` | The URL of the Salesforce case | `https://subdomain.salesforce.com/incident.do?sys_id=Case%23123456` | | | `incident.linked_records.zendesk_tickets[0].id` | The unique identifier for the Zendesk ticket | 1234567 | | | `incident.linked_records.zendesk_tickets[0].url` | The URL of the Zendesk ticket | `https://subdomain.zendesk.com/agent/tickets/1234567` | | Acknowledgement | `incident.acknowledgements[X].acknowledger.html_url`† | PagerDuty URL of the acknowledger | `https://subdomain.pagerduty.com/users/PXPGF42` | | | `incident.acknowledgements[X].acknowledger.summary`† | Name of the acknowledger | `Earline Greenholt` | | | `incident.acknowledgements[X].acknowledger.type`† | Acknowledger type | `user` | | | `incident.acknowledgements[X].at`† | Time this acknowledger was added to the incident | `2022-08-18T14:28:44Z` | | Assignment | `incident.assignments[X].assignee.html_url`† | PagerDuty URL of the assignee | `https://subdomain.pagerduty.com/users/PL0S7BA` | | | `incident.assignments[X].assignee.id`† | The ID of this assignee | `PL0S7BA` | | | `incident.assignments[X].assignee.summary`† | The name of this assignee | `Earline Greenholt` | | | `incident.assignments[X].assignee.type`† | Assignee type | `user_reference` | | | `incident.assignments[X].at`† | Time this assignment was added to the incident | `2022-08-15T16:57:40Z` | | Communications | `incident.conference_bridge.conference_number`\* | Conference bridge number to this incident | `+1-415-555-1212,,,,1234#` | | | `incident.conference_bridge.conference_url`\* | Conference URL number to this incident | `https://example.com/123-456-789` | | | `incident.slack_channel.name` | Slack channel name to this incident | `Slack Channel Name` | | | `incident.slack_channel.url` | Slack channel URL to this incident | `https://slack.com/app_redirect?channel=somechannel&team=someteam` | | Services | `incident.impacted_business_services[X].id`† | The ID of the impacted business service | `PD1234` | | | `incident.impacted_business_services[X].summary`† | The name of the impacted business service | `Web API` | | | `incident.impacted_services[X].html_url`† | PagerDuty URL of the impacted technical service | `https://subdomain.pagerduty.com/service-directory/PAW0B9L` | | | `incident.impacted_services[X].id`† | The ID of the impacted technical service | `PAW0B9L` | | | `incident.impacted_services[X].summary`† | The name of the impacted technical service | `Technical Service Name` | | | `incident.service.html_url` | PagerDuty URL of the technical service that belongs to this incident | `https://subdomain.pagerduty.com/service-directory/PAW0B9L` | | | `incident.service.id` | PagerDuty ID of the technical service that belongs to this incident | `PAW0B9L` | | | `incident.service.summary` | The name of the technical service that belongs to this incident | `Technical Service Name` | | Teams | `incident.teams[X].html_url`† | PagerDuty URL of the Team that belongs to this incident | `https://subdomain.pagerduty.com/teams/PP2R1SK` | | | `incident.teams[X].id`† | The Team ID that belongs to this incident | `PP2R1SK` | | | `incident.teams[X].summary`† | The name of the Team that belongs to this incident | `Billing Support` | | Status Update | `incident.previous_status_updates[X].created_at`† | The time this status update was created | `2022-08-20T07:40:48Z` | | | `incident.previous_status_updates[X].id`† | The ID of this status update | `PX69SY8` | | | `incident.previous_status_updates[X].message`† | The message of this status update | `The team is still investigating the issue.` | | | `incident.previous_status_updates[X].sender.html_url`† | PagerDuty URL of the user that created this status update | `https://subdomain.pagerduty.com/users/PXPGF42` | | | `incident.previous_status_updates[X].sender.id`† | The unique ID of the user that created this status update | `PXPGF42` | | | `incident.previous_status_updates[X].sender.summary`† | The name of the user that created this status update | `Earline Greenholt` | | | `incident.previous_status_updates[X].sender.type`† | Sender type of this status update | `user_reference` | | | `sender.description` | Profile description of the user sending the status update | `Support Engineer` | | | `sender.email` | The email of the user sending the status update | `125.greenholt.earline@graham.name` | | | `sender.html_url` | URL to the user sending the status update | `https://subdomain.pagerduty.com/users/PXPGF42` | | | `sender.name` | The name of the user sending the status update | `Earline Greenholt` | | | `status_update.created_at` | The time the status update is created | `2015-10-06T21:30:42Z` | | | `status_update.message` | The message entered by a responder when creating a status update | `The team is still investigating the outage.` | | | `status_update.status_dashboard_url` | URL to the status dashboard for this incident | `https://subdomain.pagerduty.com/status-dashboard/incidents/Q0U747RKFEV100` | \* If an incident has its own conference bridge, this value is shown. If not, and the conference bridge is configured at the [service level](/incident-management/incidents/conference-bridge#create-a-service-level-conference-bridge), the service-level conference bridge information is displayed. If no conference bridge information is available, this value is empty. † This field can contain more than one value. Refer to the [Fields with Multiple Values](#fields-with-multiple-values) section in the previous section for tips on using the Liquid templating language to display multiple values. > **Custom Fields:** Status update templates support [custom fields](/incident-management/incidents/custom-fields-on-incidents). You can search for custom fields using their **Field Name**, or you can find them in the **Incident** section. --- URL: https://docs.pagerduty.com/incident-management/incidents/add-responders # Add Responders Add responders to open incidents to receive additional assistance The Add Responders feature allows you to add additional users or escalation policies to an incident beyond those initially assigned. Whether you are managing a SEV-1/P1 incident or rapidly assembling a response team, this feature ensures you can quickly mobilize the right resources. Add users manually for flexibility, or automatically with preset groupings via [Incident Workflows](/ai-automation/automation/incident-workflows). > **Availability:** This feature is available on PD Reliability Platform plans. It's also available on Business, Enterprise for Incident Management, and Digital Operations (Legacy) plans. Contact the [Sales Team](https://www.pagerduty.com/contact-sales/) to upgrade to a plan that includes Add Responders. > **Best Practice:** For an in-depth look at how adding responders can improve your organization's processes, refer to the [Incident Response](/ops-guides/incident-response-guide) best practice guide. ## Add Responders to an Incident You can request **individual users** or [**escalation policies**](/incident-management/incidents/add-responders#escalation-policy-responder-notifications) as responders. Requested users receive a notification that allows them to accept or decline the request. > **Limits Per Incident:** There is a limit of 500 unique responders and 1,000 responder requests per incident. There are two ways to add responders to an incident: - [Manually Add Responders to an Open Incident](#manually-add-responders-to-an-open-incident) - [Automatically Add Responders With Incident Workflows](#automatically-add-responders-with-incident-workflows) ### Manually Add Responders to an Open Incident Any user who can take action on an open incident can add responders in the web and mobile apps. **On an open incident:** 1. Click the incident title to view its details page. 2. Click **Add Responders** in the right-hand pane. 3. In the **Search for an Escalation Policy or User** field, select your preferred **Escalation Policy(ies)** and/or **User(s)**. Use [tags](/account-admin/tagging) to help filter results. 4. _(Optional)_ Add a message or a [conference bridge](/incident-management/incidents/conference-bridge). 5. Click **Save**. **When manually triggering an incident:** 1. On the **Incidents** page or a service's **Activity** page, click **New Incident**. 2. Enter the appropriate incident details. 3. Select the **Advanced Options** dropdown. 4. In the **Add additional responders to help** field, select the **Escalation Policy(ies)** and/or **User(s)**. 5. Click **Create Incident**. 1\. In an open incident, add responders from either: - The actions carousel menu in the **Triage** tab by tapping **Add Responder** - The **All Actions** menu by tapping **Add Responder** 2. Select the user(s) or escalation policy(ies) to add and include an optional message. You can add a conference bridge address in the message field. 3. Tap **Notify**. > **Paging a Specific Person:** You can page specific responders, whether or not they are on the incident's escalation policy or currently on call. Search for them under **Users** in **Add Responders** and request them individually. ### Automatically Add Responders With Incident Workflows Manually adding responders gives you the flexibility to select exactly who is needed for a specific incident. However, identifying the right responders and adding them one by one can be time-consuming and error-prone. If you regularly involve the same set of responders, consider streamlining the process with [Incident Workflows](/ai-automation/automation/incident-workflows). You can predefine responder groups and automate their mobilization. During an incident, users can trigger the appropriate workflow from a list of plays, or you can configure services to launch workflows automatically when certain conditions are met. - [Create an Incident Workflow](/ai-automation/automation/incident-workflows#create-an-incident-workflow) - [Run an Incident Workflow When a Condition is Met](/ai-automation/automation/incident-workflows#run-an-incident-workflow-when-a-condition-is-met) ## Responder Notifications Responder notifications prompt users to accept or decline an invitation to join an incident. When you request a user to join as a responder, they receive notifications that match their [high-urgency notification rules](/account-admin/user-profile/notification-rules). ### Escalation Policy Responder Notifications When you request an escalation policy as a responder, it sends responder invites to every user currently on call at each escalation policy level until someone accepts the invitation or the incident resolves. Regardless of which escalation policy you selected while adding responders, the incident continues to escalate according to the escalation policy associated with its service. If you request a user to join as a responder and they acknowledge the incident, their responder request is automatically accepted. A similar action occurs when a user bulk-acknowledges multiple incidents at once. For example, if a user selects five incidents to bulk-acknowledge and has pending responder requests on three of them, the bulk update automatically accepts those three requests. ## Status of Responders To view the status of all requested responders for an incident, click the incident title to navigate to its details page. On the right-hand side, there is a list of responders and icons indicating their status. There are three possible responder statuses: - **Joined** — the requested responder accepted the request. - **Declined** — they declined the request. - **Pending** — they have yet to respond. In the mobile app, an incident labelled **Coordinated Response** indicates that a user requested assistance from one or more responders. The [incident timeline](/incident-management/incidents/overview#incident-timeline) also shows whether a responder has accepted or declined a request. If a responder's status remains **Pending**, you can [Renotify a Responder.](/incident-management/incidents/renotify-a-responder) --- URL: https://docs.pagerduty.com/incident-management/incidents/alerts # Alerts Learn how PagerDuty handles alerts from events, and how to manage alerts for effective responses and noise reduction When PagerDuty receives a qualifying event (e.g., from a monitoring tool), it triggers an alert, which then triggers an incident. You can aggregate multiple alerts into a single incident for triage, which streamlines incident handoff between teams, centralizes critical information, and reduces notification fatigue. Alerts can move from one incident to another, either [manually](/incident-management/incidents/edit-incidents#move-alerts-to-another-incident) or automatically, via [Alert Grouping](/ai-automation/aiops/overview#noise-reduction). You may also [suppress](/ai-automation/aiops/event-orchestration#incident-data) or [deduplicate](/ai-automation/aiops/event-orchestration#deduplication) alerts via [Event Orchestration](/ai-automation/aiops/event-orchestration). ## Create Alerts > **Alert Behavior:** Similar to incidents, someone must be on-call per the service's [escalation policy](/incident-management/schedules/escalation-policies) in order to create a triggered alert. If an event with a **trigger** [event action](/developer/send-alert-event#event-action-behavior) is received but the service does not have an on-call user at that time, the event will be dropped and it will not create an alert. You cannot audit or view dropped events. Inbound events submitted via the [Events API](/developer/events-api-v2-overview), or via Events API-based integrations, create alerts. You cannot manually create an alert in PagerDuty. In the most basic terms, events create alerts, and then alerts create incidents. The following diagram details this flow: 1. Monitoring tools send events to PagerDuty 2. PagerDuty triggers an alert 3. PagerDuty associates the alert with an incident 4. Incident creation sends out notifications 5. Users receive notifications  *Alert and incident creation flow* > **Incidents That do not Create Alerts:** Incidents created via any of the following processes do not generate alerts: > > - [Incidents manually triggered in the web app](/incident-management/incidents/overview#triggerdeclare-an-incident) > - [Incidents created via REST API](/developer/incident-creation-api) > > With that in mind, [Event Orchestration](/ai-automation/aiops/event-orchestration), [suppression](/ai-automation/aiops/event-orchestration#incident-data) and other alert-related features are not applicable. ### Alerts and Incident Titles When PagerDuty creates an alert, it creates an accompanying incident and gives it the same title as the alert. As time passes, it is possible that users will [manually](/incident-management/incidents/edit-incidents#move-alerts-to-another-incident) add additional alerts, or that [Alert Grouping](/ai-automation/aiops/overview#noise-reduction) will add them automatically. When this happens, the incident’s title will not change — it keeps the title from the original alert. That said, you can manually [edit an incident’s title](/incident-management/incidents/edit-incidents#edit-incident-title) at any time. You cannot edit alert titles. ## View Alerts You can review incident-associated alerts in the PagerDuty [web app](#view-alerts-in-the-web-app) or [mobile app](#view-alerts-in-the-mobile-app). For an overview of all alerts, please refer to the [Alerts Table](/incident-management/incidents/alerts/alerts-table) article. ### View Alerts in the Web App 1. Go to **Incidents** and select an incident’s **Title** to go to its detail page. 2. Select the **Alerts** tab. - Here you can review information about all of the alerts grouped under the incident, as well as **Show/Hide Details** about the alert. 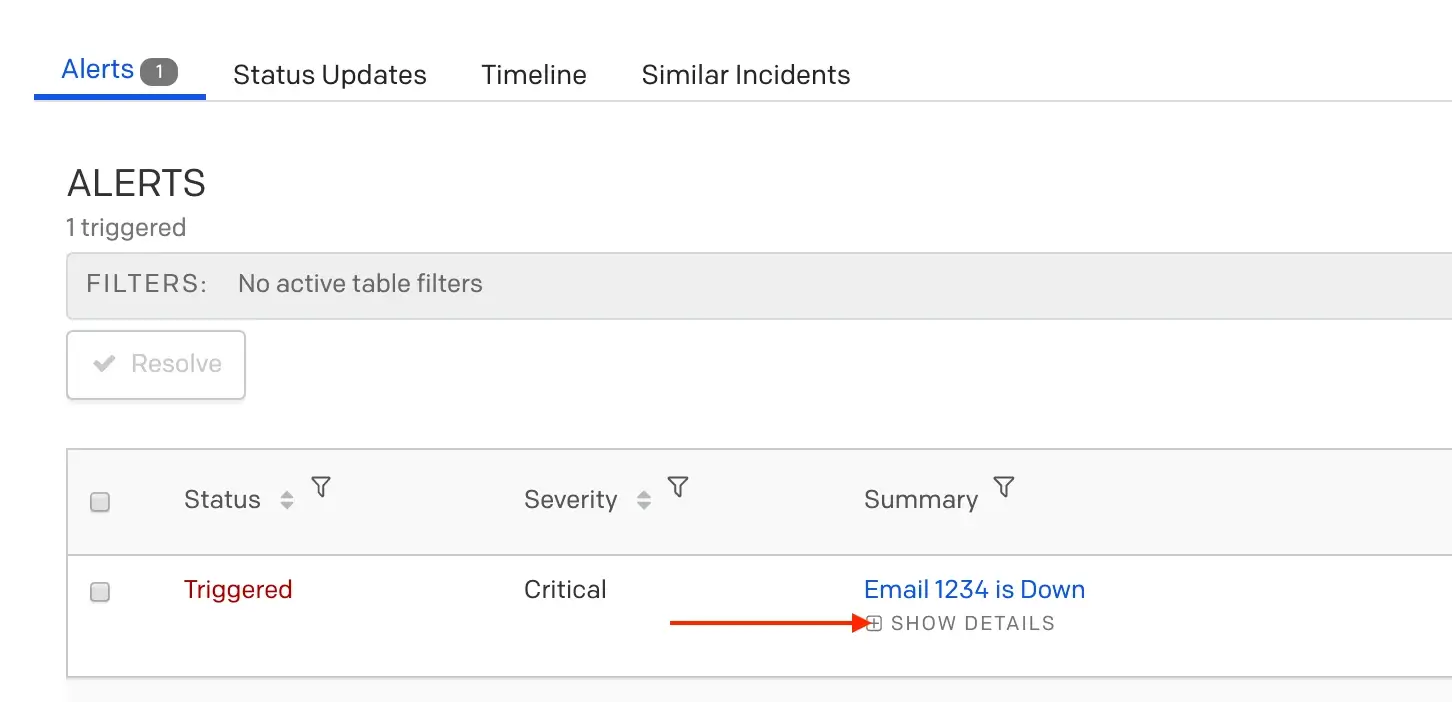 *Show alert details* 3. Select an alert’s **Summary** for a more detailed view. - The **Alert Log** shows information about when the alert triggered, how it was processed, and any [deduplicated alerts](#view-deduplicated-alerts). ### View Alerts in the Mobile App 1. On the **Incidents** screen, select an incident. 2. On the incident detail screen, scroll down to the **Alerts** section and select an alert. ### View Deduplicated Alerts While an incident is unresolved, any subsequent alerts with a matching `dedup_key` deduplicate into the original alert. Here is an example of the **Alert Log** showing a deduplicated alert: 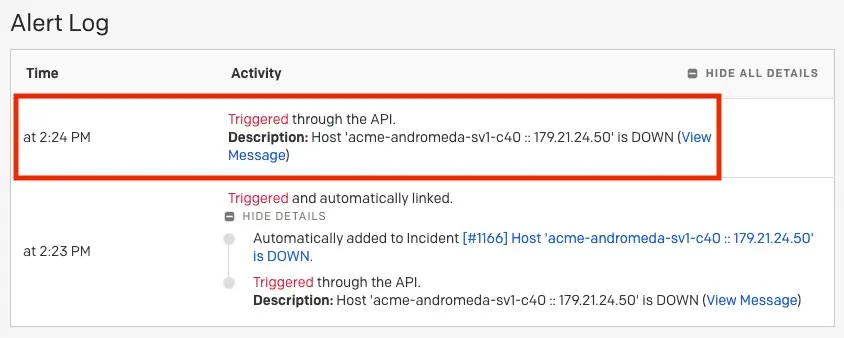 *Deduplicated alert* For more information, please read our developer documentation [Alert Deduplication](/developer/send-alert-event#alert-de-duplication). ## Move Alerts to Another Incident You may want to move alerts to another incident to better organize related issues or correct misclassified alerts. For example, moving alerts that were initially grouped separately but actually represent the same underlying problem, or relocating alerts that were incorrectly associated with an unrelated incident during initial triage. ### Manually Move Alerts to a New Incident 1. Navigate to the incident's details page and scroll to the **Alerts** section. 2. Click the checkbox next to the alert you want to move. In the box that appears, select **Move** and choose **Create new incident**. 3. In the modal, the details of the new incident will populate. You can click **Edit Incident** if you wish to change anything. Otherwise, click **Create incident**. ### Manually Move Alerts to an Existing Incident **From the Incident Details Page**: 1. Navigate to the incident's details page and scroll to the **Alerts** section. 2. Click into the alert's **Summary** and then click **Move to Another Incident**. 3. Enter the existing incident's **number** and click **Find Incident**. 4. When the incident appears, click **Move Alert**. **From the Alerts Table**: 1. Navigate to **Incidents** → **Alerts**. 2. Click into the alert's **Summary** and then click **Move to Another Incident**. 3. Enter the existing incident's **number** and click **Find Incident**. 4. When the incident appears, click **Move Alert**. ### Alert Grouping Please see our article on PagerDuty AIOps [Alert Grouping](/ai-automation/aiops/noise-reduction/alert-grouping) features for more information about how to aggregate alerts and reduce noise. ### Alert Suppression and Deduplication Please see our [Event Orchestration](/ai-automation/aiops/event-orchestration) article for more information on alert [suppression](/ai-automation/aiops/event-orchestration#incident-data) and [deduplication](/ai-automation/aiops/event-orchestration#deduplication). ## Resolve Alerts Alerts, in contrast to incidents, have two only states: **triggered** and **resolved**. You can resolve alerts manually, or via the API. If you resolve all alerts under an incident, it will resolve the incident. Conversely, if you resolve an incident, that will then resolve all alerts under that parent incident. > **Resolve via Events API:** When sending an event with the **resolve** [event action](/developer/send-alert-event#event-action-behavior), the event must have the same `dedup_key`as the **trigger** alert in order to resolve the alert. > > If a matching `dedup_key` value is not found in an existing alert, the resolve event will be dropped. You cannot audit or view dropped events. ### Resolve Alerts in the Web App To manually resolve an alert in the web app: 1. Go to **Incidents** and select the **Title** of an unresolved incident. 2. On the incident detail page with the **Alerts** tab selected, check the box next to the alert you’d like to resolve. - **Note**: To mass select alerts, select the checkbox at the top in the header row. 3. Click **Resolve**. ### Resolve Alerts in the Mobile App To manually resolve an alert in the mobile app: 1. On the **Incidents** screen, select an incident. 2. On the incident detail screen, scroll down to the **Alerts** section and select an alert. 3. Tap **Resolve**. --- URL: https://docs.pagerduty.com/incident-management/incidents/alerts/alerts-table # Alerts Table View and take action on incident alerts The alerts table allows you to view and sort alerts according to your preferences, helping you locate what you're looking for quickly and efficiently. > **Required User Permissions:** The alerts table only shows alerts from services that you have access to. The visible alerts may be restricted by your [Base Role, Team Role or Object Role](/account-admin/advanced-permissions#base-roles). If you would like permission to view alerts from a specific service, please reach out to the appropriate Team Manager, Global Admin or the Account Owner to grant access. > > When using [Event Orchestration](/ai-automation/aiops/event-orchestration), if you suppress alerts and do not route them to a service, those alerts will only be visible to administrators. ## View the Alerts Table Navigate to the alerts table in the PagerDuty web app by selecting **Incidents** → **Alerts**. By default, the alerts table displays alerts from the **Last 30 days**. You can adjust the time range: 1. On the alerts table, find the **Created** column and click to the right. 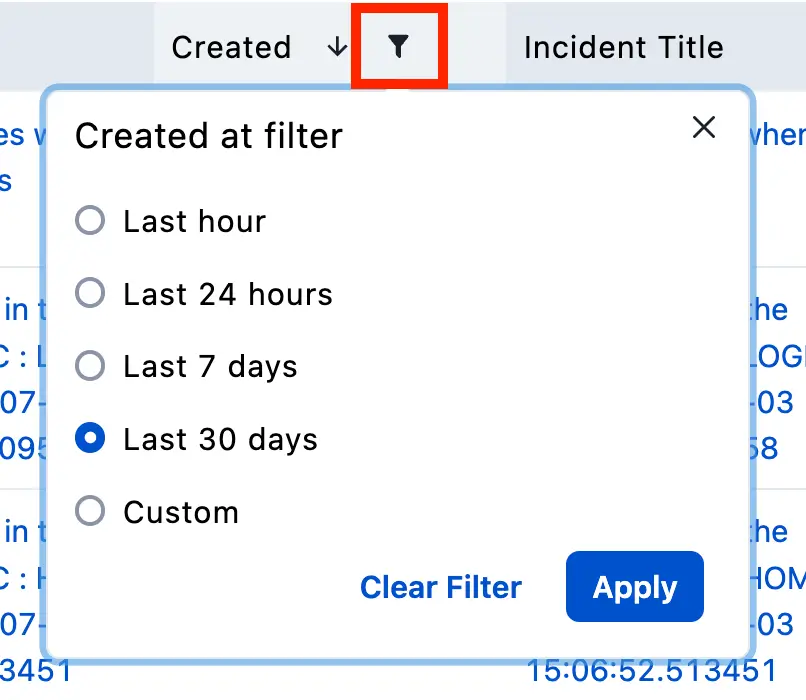 *Filter the Created column* 2. Select one of the following time range options: - **Last hour** - **Last 24 hours** - **Last 7 days** - **Last 30 days** (default) - **Custom** 3. Click **Apply**. ### Alerts Table Columns Alerts are filtered via the columns that appear in the alerts table. The type of filter (e.g., radio button or search) varies based on column data type. The columns **Severity**, **Summary**, **Source**, **Class**, **Component** and **Group** all map to [Common Event Format (PD-CEF)](/developer/api/pd-cef) fields, which can be included in your events with our [Events API v2](/developer/events-api-v2-overview). The **Status** column indicates whether your alerts are triggered, resolved, suppressed, or suspended. **Created** indicates the date and time the alert was created. **Incident Title** points to the incident your alerts are grouped under, and **Service** and **Integration** point to the service and integration your alerts are associated with. ### Show and Hide Columns **Customize Columns** lets you show or hide the **Incident Title**, **Service**, **Integration**, **Source**, **Class**, **Component** and **Group** columns. The **Status**, **Severity**, **Summary** and **Created** columns cannot be disabled and are grayed out in the **Customize Columns** menu. **Incident Title**, **Service**, **Integration** and **Source** are automatically enabled, but can be hidden. ### Search Filtering Search filtering is enabled on the **Summary**, **Incident Title**, **Integration**, **Source**, **Class**, **Component** and **Group** columns. Partial matches will be displayed, for example searching `Prod` will show results for both `prod04` and `Prod03`. ### Sort Filtering You can sort a majority of the columns. The default sort setting is by **Status** (i.e., **Triggered**, **Resolved**, **Triggered (Suppressed)**, **Resolved (Suppressed)**, or **Suspended**). Sortable columns will display or when you hover over a column's name. Click the arrow to sort your alerts based on this column. The active sort column will show an arrow, while other columns will not.  *Sorted by status* ### Active Filters Bar The active filters bar at the top of the alerts table keeps track of which filters are enabled. Column tags populate the bar, and filter icons highlight blue when filters are active. The following image shows the alerts table with active **Severity** and **Status** filters:  *Active Severity and Status filters* ### Clear Table Filters Table filters can be cleared from within the **Active Filters Bar** by clicking next to each individual filter. You may also remove a search filter by clicking the search icon a second time and selecting **Clear filter**. 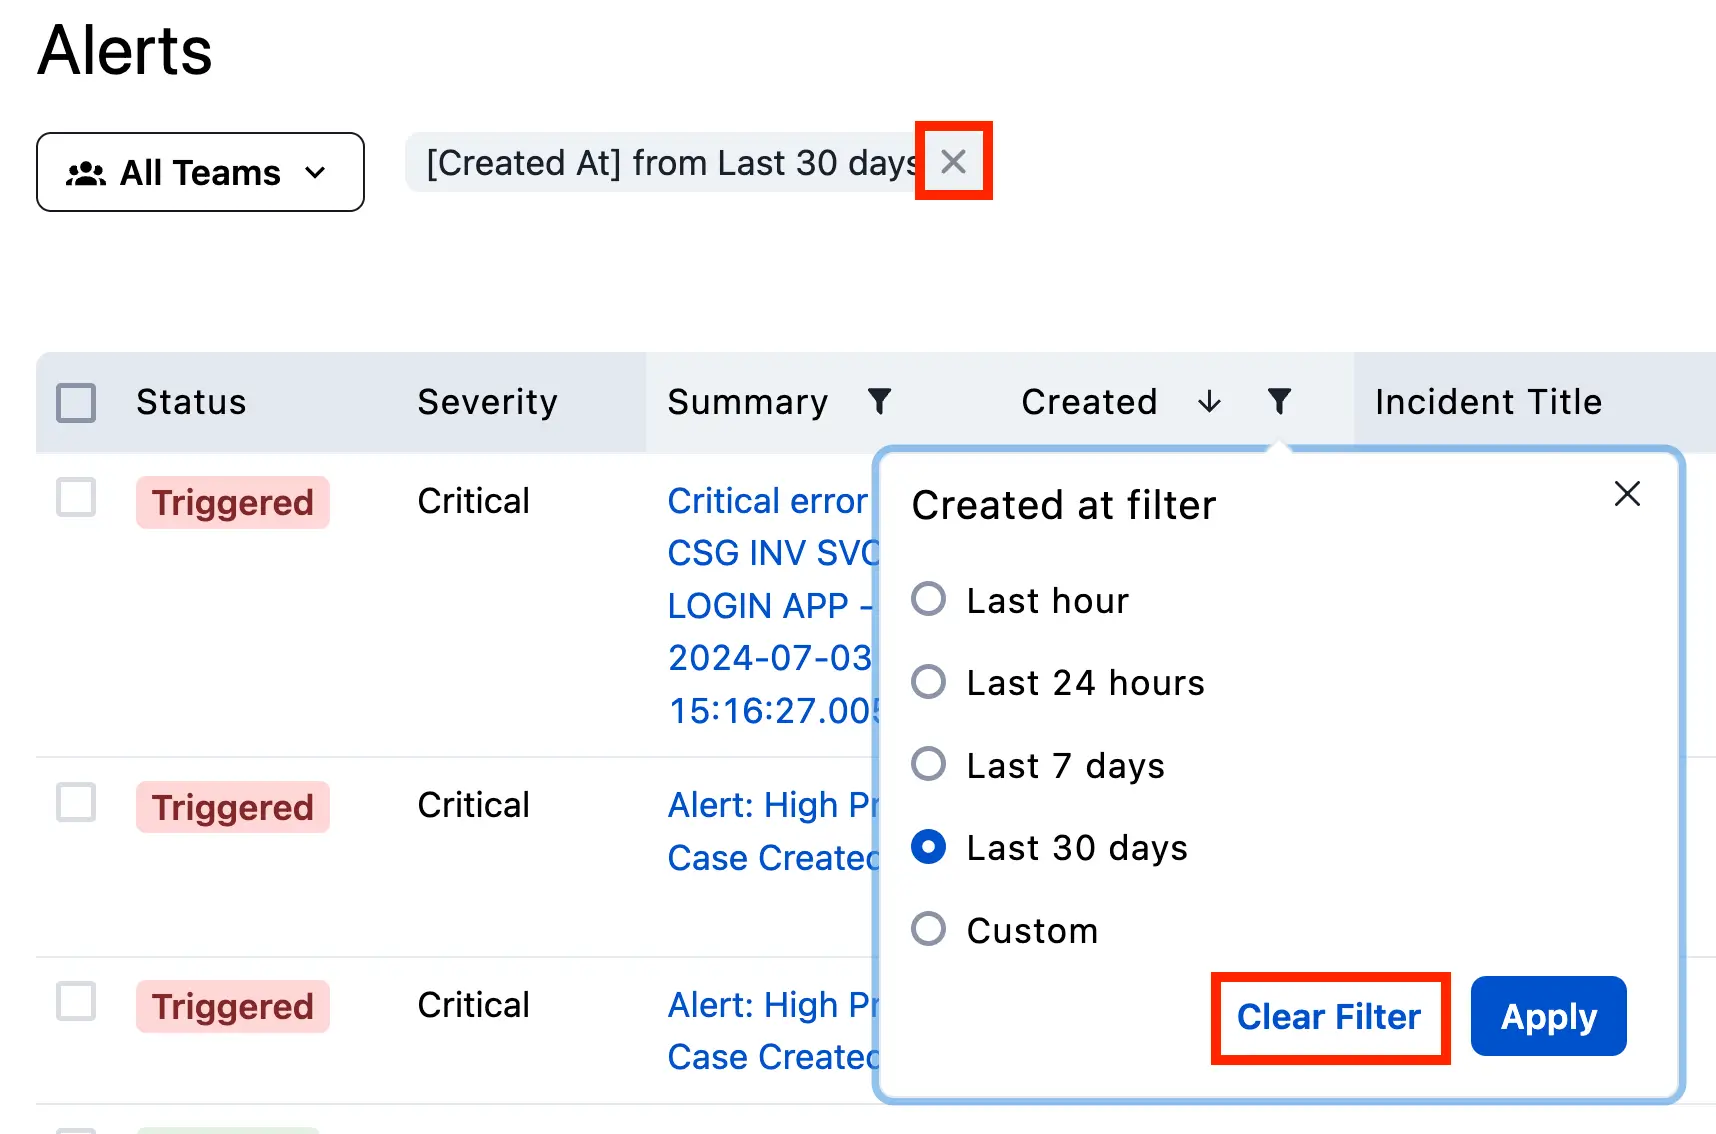 *Clear table filters* ## Alert Actions You may perform actions on alerts that have are triggered, triggered (suppressed) and suspended. ### Triggered Alerts You can resolve triggered alerts, including [suppressed](/ai-automation/aiops/event-orchestration#incident-data) triggered alerts, by ticking the **checkbox** to the left of the alert and clicking **Resolve** at the bottom of the screen. 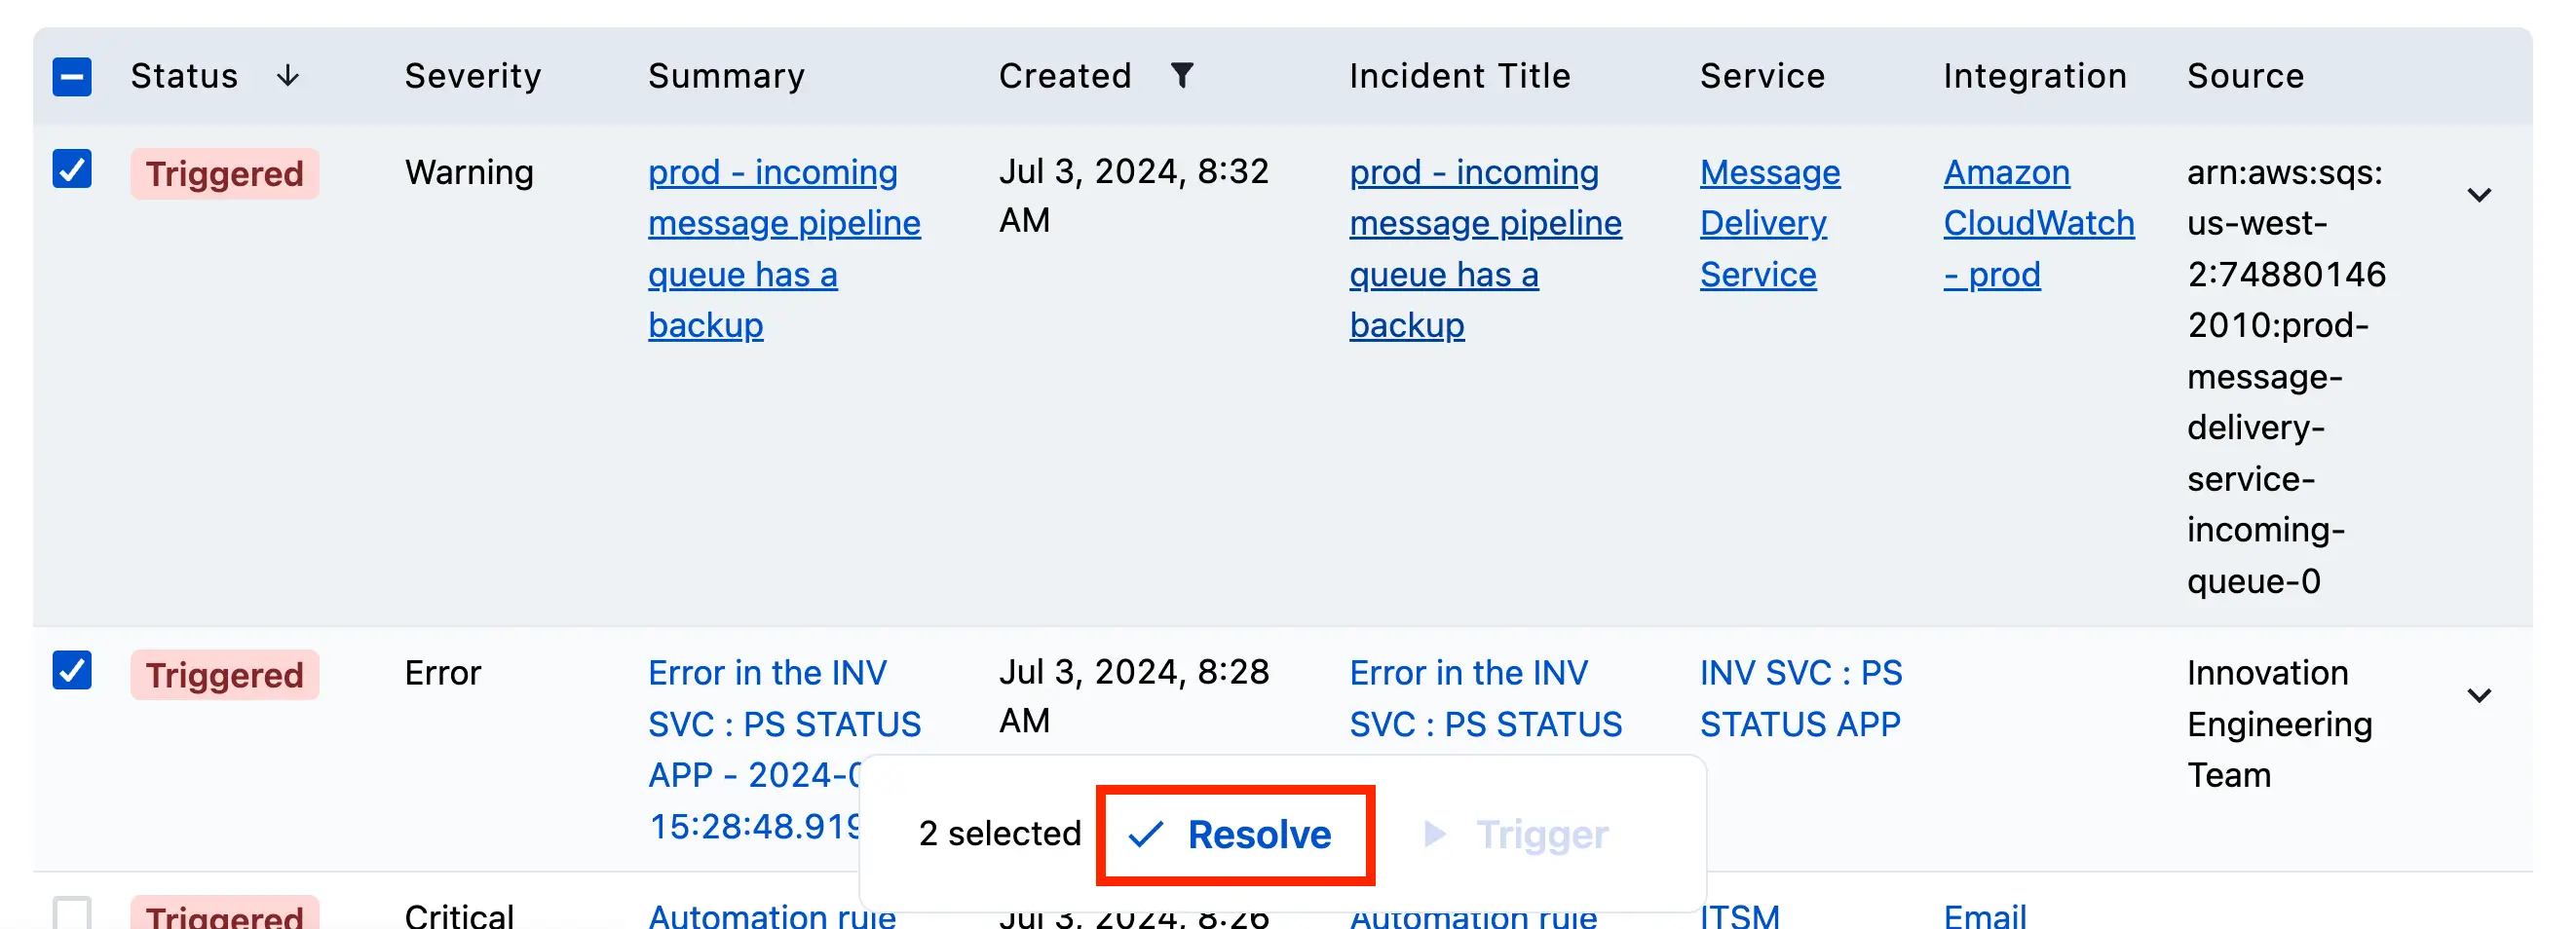 *Resolve triggered alerts* ### Suspended Alerts You can configure [Event Orchestration](/ai-automation/aiops/event-orchestration) to generate **Suspended** alerts, which will not immediately trigger an incident or send out responder notifications. These alerts can either be triggered or resolved by checking the **checkbox** to the left of the alert and clicking **Trigger** or **Resolve**. For more information, please read [Event Orchestration: Pause Incident Notifications](/ai-automation/aiops/event-orchestration#pause-incident-notifications). --- URL: https://docs.pagerduty.com/incident-management/incidents/conference-bridge # Conference Bridge Add a conference bridge in order to easily connect and collaborate during major incident response A conference bridge is a central channel where all responders can gather for collaboration. Conference bridges allow responders to connect to your preferred web conferencing provider directly from an incident, via phone, or meeting URL. You can use the same conference bridge for all major incidents, or configure multiple as needed. There are two ways to create conference bridges in your PagerDuty account: - [Create an Account-Level Conference Bridge](#create-an-account-level-conference-bridge) - [Create a Service-Level Conference Bridge](#create-a-service-level-conference-bridge) And there are two ways to add a conference bridge to an incident: - [Manually Add a Conference Bridge to an Incident via Add Responders](#manually-add-a-conference-bridge-to-an-incident-via-add-responders) - [Add a Conference Bridge to an Incident with an Incident Workflow](#add-a-conference-bridge-to-an-incident-with-an-incident-workflow) > **Availability:** This feature is available on current Business, Enterprise for Incident Management, and Digital Operations (Legacy) plans. Contact the [Sales Team](https://www.pagerduty.com/contact-sales/) to upgrade to a plan that includes this feature. > **Best Practice:** For an in-depth look at how to incorporate conference bridges into your organization's processes, refer to the [Incident Response](/ops-guides/incident-response-guide) best practice guide. ## Create an Account-Level Conference Bridge You can add conference bridges as account-level extensions to view a persistent list of conference lines to choose from when [triggering an incident](/incident-management/incidents/overview#triggerdeclare-an-incident). 1. In the PagerDuty web app, navigate to **Integrations** → **Extensions**. 2. Select the **Conference Bridges** tab. 3. Click **New Conference Bridge**. 4. Enter the following based on your preferences. You must enter either a Conference Number or Conference URL, or you may enter both options: | Field | Instructions | | :-------------------- | :------------------------------------------------------------------------------------------------------------------------------------------------------------------------------------------------------------------------------- | | **Label** | Enter a logical name for the conference bridge to help you identify it in the conference bridge drop-down. | | **Description** | Enter a brief description of the conference bridge. | | **Conference Number** | Enter the phone number users can call into, if applicable. Phone numbers must be in the following format: `415-555-1212,,,,1234#`, where a comma (`,`) represents a one-second wait and pound (`#`) completes access code input. | | **Conference URL** | Enter a meeting URL, if applicable. | 4. Click **Create**. The conference bridge becomes available as an option under **Advanced Options** when [creating a new incident](/incident-management/incidents/overview#triggerdeclare-an-incident). 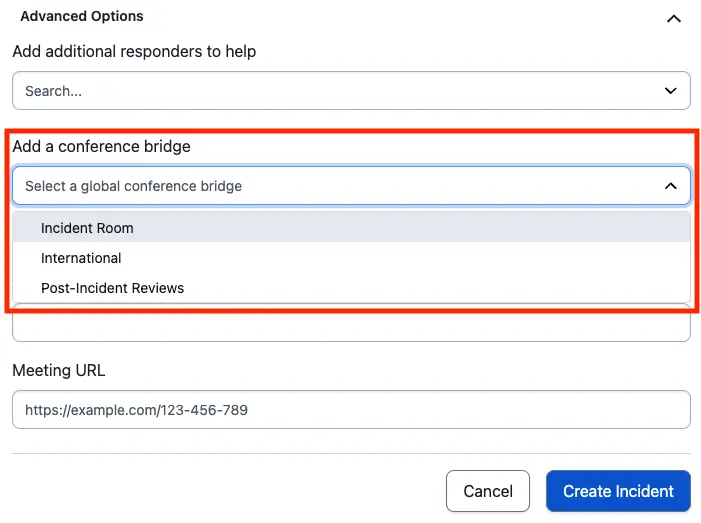 ### Edit an Account-Level Conference Bridge 1. Navigate to **Integrations** → **Extensions**. 2. Select the **Conference Bridges** tab. 3. On the right of your desired conference bridge, click → **Edit**. 4. Edit the necessary details. 5. Click **Save**. ### Delete an Account-Level Conference Bridge 1. Navigate to **Integrations** → **Extensions**. 2. Select the **Conference Bridges** tab. 3. On the right of your desired conference bridge, click → **Delete**. 4. In the confirmation dialog that appears, click **Delete**. ## Create a Service-Level Conference Bridge > **Conference Bridge for All Incidents:** When you add a conference bridge to a service, the conference bridge information will appear on **all incidents that trigger on that service**. You should add a conference bridge to services dedicated to critical incidents that require team coordination during an incident. 1. In the PagerDuty web app, navigate to **Services** → **Service Directory**. 2. Click the name of your desired service and select the **Settings** tab. 3. Scroll to the **Coordinate Responders and Stakeholders** section and click **Edit** on the right. 4. Enter the conference bridge information for your service. You must enter either a Conference Bridge Dial-In Number or Conference Bridge Meeting URL, or you may enter both options: - **Conference Bridge Dial-In Number**: Enter the phone number users must call to join the conference, if applicable. Phone numbers must be in the following format: `415-555-1212,,,,1234#`, where a comma (`,`) represents a one-second wait and pound (`#`) completes access code input. - **Conference Bridge Meeting URL**: Enter a meeting URL, if applicable. 5. Click **Save Changes**. When an incident is triggered on your service, the conference bridge information appears in the web app and in email notifications. 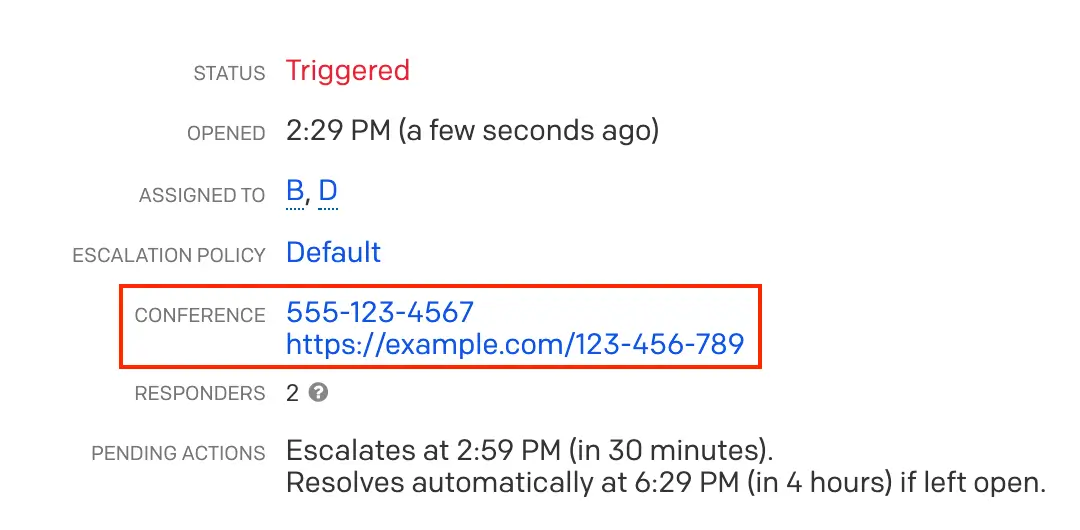 *Conference bridge details* ### Edit a Service-Level Conference Bridge 1. Navigate to **Services** → **Service Directory**. 2. Select the service containing the conference bridge that you want to edit. 3. Select the **Settings** tab. 4. Scroll to the **Coordinate Responders and Stakeholders** section and click **Edit**. 5. Edit the **Conference Bridge Dial-In Number** and/or **Conference Bridge Meeting URL** as necessary. 6. Click **Save Changes**. ### Delete a Service-Level Conference Bridge 1. Navigate to **Services** → **Service Directory**. 2. Select the service containing the conference bridge that you want to delete. 3. Select the **Settings** tab. 4. Scroll to **Coordinate Responders and Stakeholders** section and click **Edit** to the right. 5. Remove the **Conference Bridge Dial-In Number** and/or **Conference Bridge Meeting URL**, as applicable. 6. Click **Save Changes**. ## Manually Add a Conference Bridge to an Incident via Add Responders If you do not have conference bridge information added to your service, use the **Add Responders** feature to input the conference bridge information. > **Add Responders Requirement:** If you want to manually add a conference bridge to an open incident, use the add responders feature. Alternatively, you can also add a new conference bridge using an [Incident Workflow](#add-a-conference-bridge-to-an-incident-with-an-incident-workflow) with a manual trigger. 1. After an incident is triggered, **acknowledge** the incident and click **Add Responders**. 2. Select the **Users** and/or **Escalation Policies** to add to the incident (required for this option). 3. Under **Add a conference bridge**, if you already have an account-level or service-level Conference Bridge configured, use the dropdown to **Select a pre-configured conference bridge**. Alternatively, you can add the **Area Code**, **Dial-in Number**, and **Meeting URL** to manually create a conference bridge. **Note**: Phone numbers must be in the following format: `415-555-1212,,,,1234#`, where a comma (`,`) represents a one-second wait and pound (`#`) completes access code input. 4. Click **Save**. Requests are sent to responders, who can review conference bridge details on the incident details page and in the responder email notifications. ## Add a Conference Bridge to an Incident with an Incident Workflow > **Availability:** This feature is available on current Business, Enterprise for Incident Management, and Digital Operations (Legacy) plans. Contact the [Sales Team](https://www.pagerduty.com/contact-sales/) to upgrade to a plan that includes this feature. Adding a conference bridge to an Incident Workflow allows you to automatically mobilize responders when specific conditions are met or with a single click. Refer to [Incident Workflows](/ai-automation/automation/incident-workflows#create-an-incident-workflow-from-scratch) for instructions on adding a conference bridge to a workflow. ## Join a Conference Bridge as a Responder Conference bridge information is available in incidents in the web app, email notifications, Slack (if you have a [Slack integration](/integrations/slack-integration-guide) configured) and via voice call. When referencing the web app, email notifications, or Slack, responders must manually dial in to the conference bridge or click the link. For voice-call notifications, responders can use the [One Touch To Join](/incident-management/incidents/conference-bridge#one-touch-to-join-conference-bridge) feature. ### Example Responder Notifications #### Conference Bridge Information in the Web App 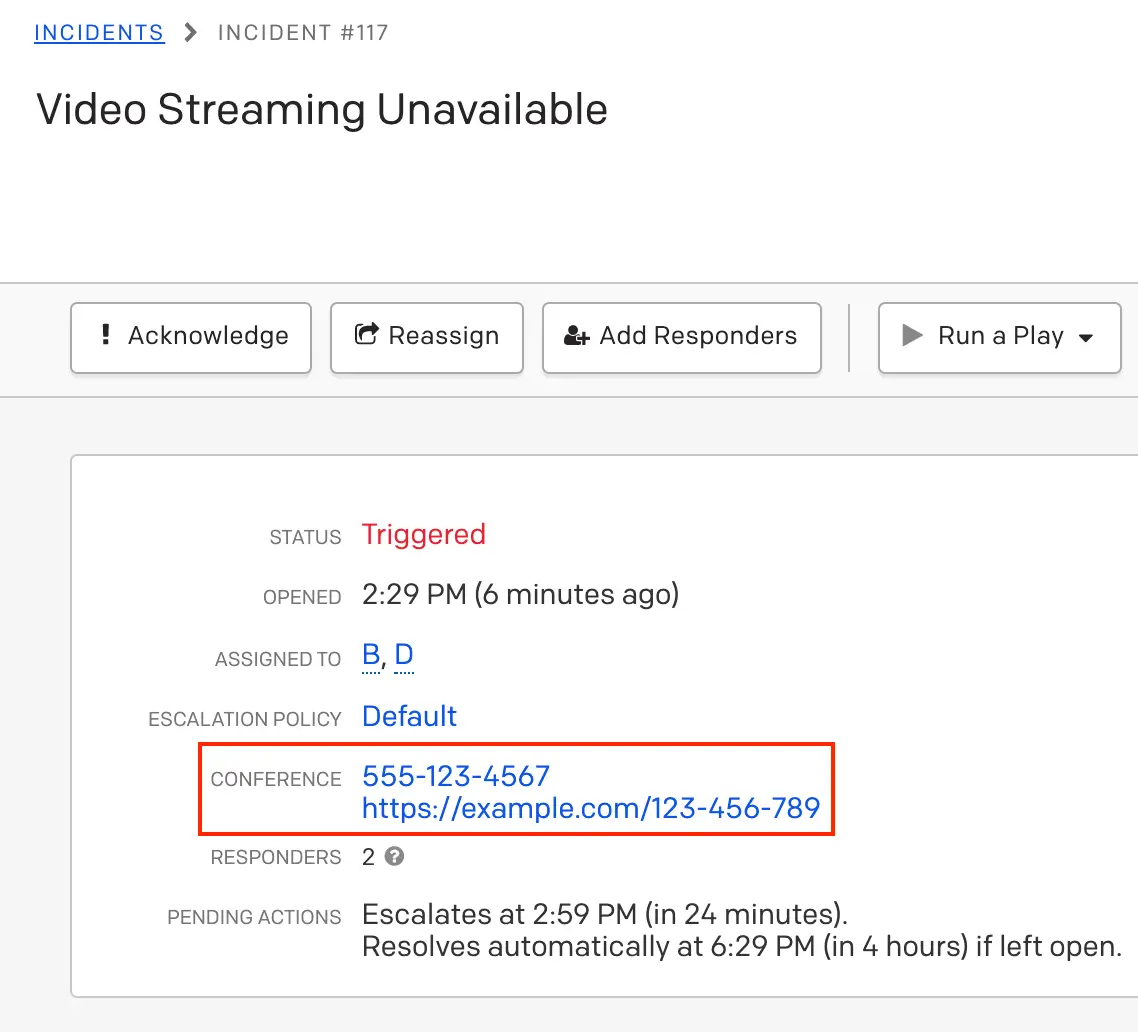 *Conference bridge information in the web app* #### Conference Bridge Information in Email Notifications 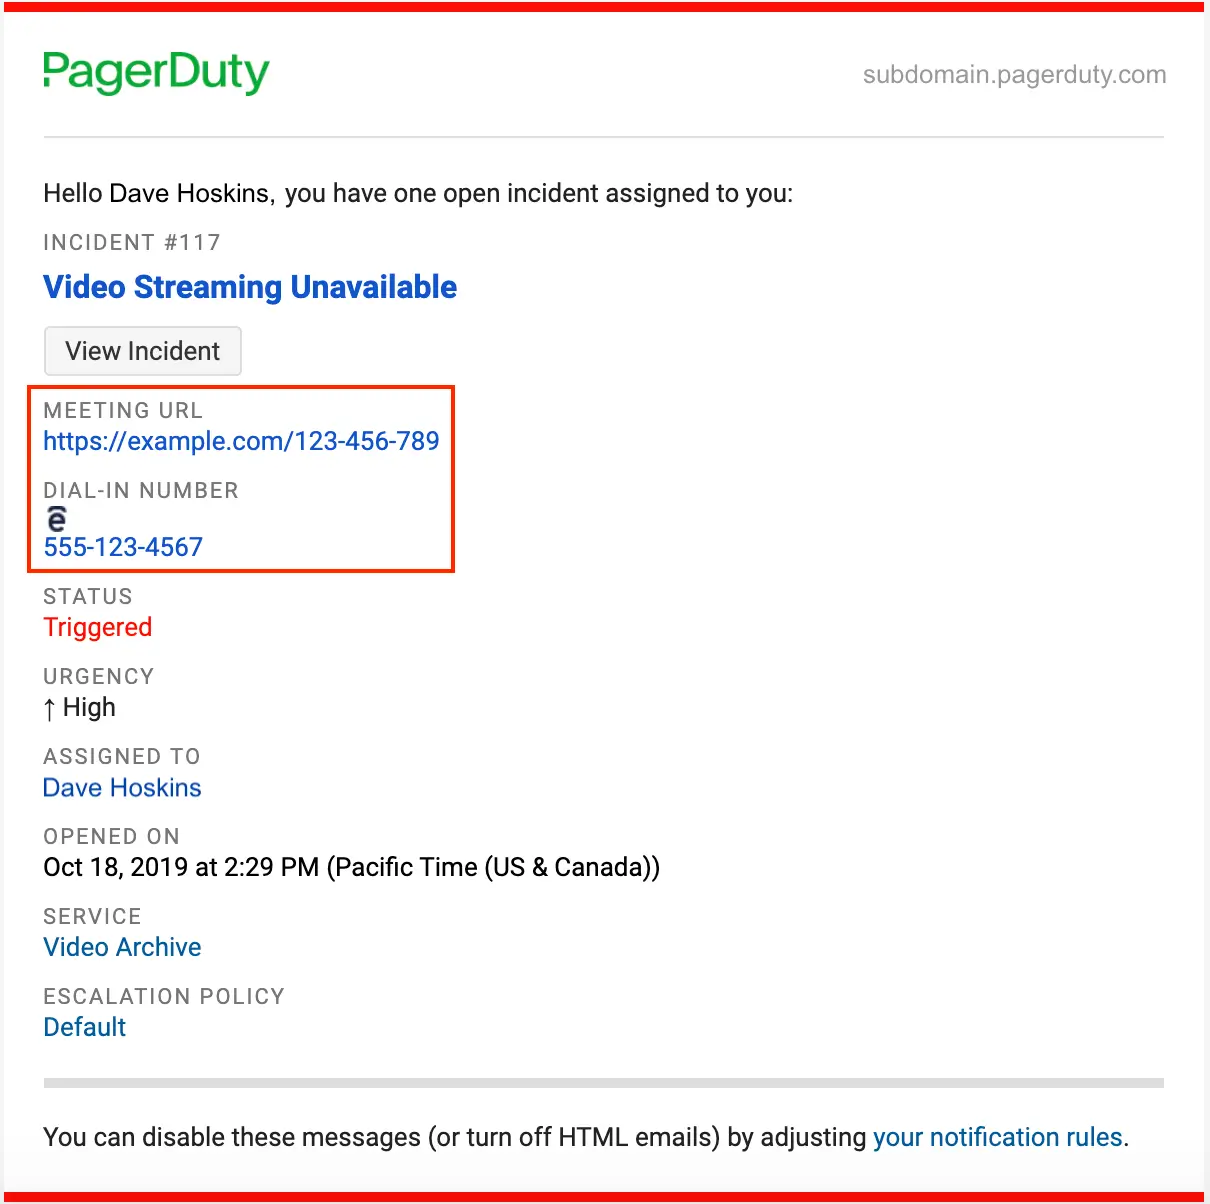 *Conference bridge information in email notifications* #### Conference Bridge Information in Slack Notifications 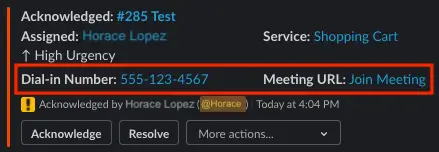 *Conference bridge information in Slack notifications* #### Conference Bridge Information in Voice Call Notifications When responders receive voice call notifications, they will hear the following prompt: > PagerDuty Alert. Please help me with [Incident Title] > > Press `[#]` to accept > Press `[#]` to decline > **Response Numbers:** The numbers that users are prompted to enter when accepting or declining a responder request may vary. **By default, users do not receive conference bridge information in the voice call**. Once accepted, they need to check the incident in the [web app](#conference-bridge-information-in-the-web-app), an [email notification](#conference-bridge-information-in-email-notifications), or a [Slack notification](#conference-bridge-information-in-slack-notifications) to obtain the conference bridge information and enter the bridge manually. **If you require responders to be able to join conference bridges via voice call notifications**, use the [One Touch To Join Conference Bridge](#one-touch-to-join-conference-bridge) add-on feature. ### One Touch To Join Conference Bridge > **Note:** One Touch to Join Conference Bridge works with [Conference Bridge](#create-a-service-level-conference-bridge) and [Add Responders](/incident-management/incidents/add-responders), which are features available on Business, Enterprise for Incident Management and Digital Operations (Legacy) plans. Please [reach out to our Sales team](https://www.pagerduty.com/contact-us/) if you are interested in a plan with these features. The One Touch To Join Conference Bridge feature enables rapid assembly of response teams by giving responders a push-button way to join a conference bridge. This feature relies on two core PagerDuty Platform features: [Conference Bridge](/incident-management/incidents/conference-bridge#create-a-service-level-conference-bridge) and [Add Responders](/incident-management/incidents/add-responders). When responders are added to an incident, and they receive a voice call, they can select “Join the bridge”, which immediately adds them to the conference call. The One Touch To Join Conference Bridge solution works with your existing direct-dial conference bridge provider and reduces effective time-to-engage and resolution time for major incidents. #### Configure One Touch To Join Conference Bridge 1. [Configure a conference bridge](/incident-management/incidents/conference-bridge#create-a-service-level-conference-bridge). 2. Responders must have the following: - [A phone number listed](/account-admin/user-profile/contact-information) in the **Contact Information** tab of their PagerDuty user profile. - [A high-urgency notification rule](/account-admin/user-profile/notification-rules) in the **Notification Rules** tab using this phone number in their user profile. 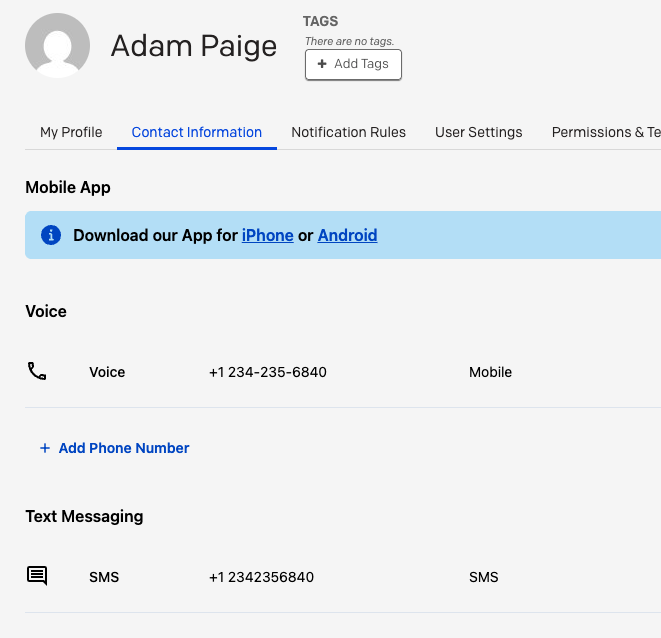 *Phone contact method* 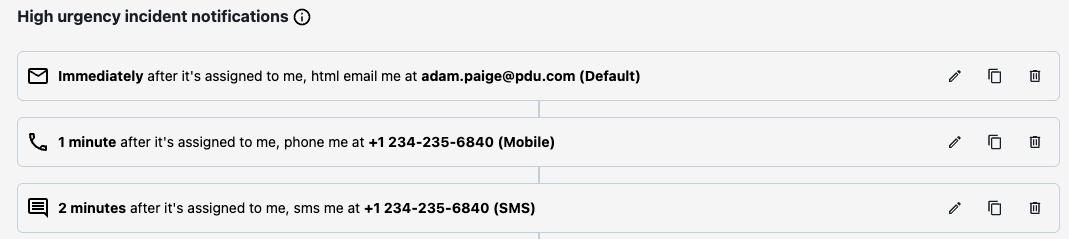 *Phone notification rule* 3. During an incident with a conference bridge, add responders by using the [Add Responders](/incident-management/incidents/add-responders) feature or at scale with [Incident Workflows](/ai-automation/automation/incident-workflows#create-an-incident-workflow-from-scratch). Any requested responder with the above configuration will receive a voice call with the following phrasing: > PagerDuty Alert. Please help with [Incident Title] > > Press 1 to join the bridge > Press 2 to accept the request > Press 3 to decline the request The following table lists the effects of each response to the voice call: | Response | Result | Responder Status | Conference Bridge Impact | Incident Timeline | | --- | --- | --- | --- | --- | | **1 — Join the Bridge** | Responder joins the bridge and the responder request is accepted. | Marked as **Joined**, per the [icon on the Responders box in the Incident Detail page](/incident-management/incidents/add-responders#status-of-responders). | Responder automatically joins the bridge. No manual dialing required. | Entry created showing when the responder joined the call. | | **2 — Accept the Request** | Responder request is accepted. | Marked as **Joined**. | Responder must manually dial into the bridge. Participation is not visible on the timeline. | Entry created showing the accepted request. | | **3 — Decline the Request** | Responder request is declined. | Marked as **Declined**. If the responder is part of an escalation policy, the next escalation level is paged. | None. | Entry created documenting the declined request. | | **No Answer** | Responder request is unanswered. | Remains **Pending**. If the responder is part of an escalation policy, the next escalation level is paged. | None. | None. | ##### Logged Events Whenever a responder who has joined the bridge via One Touch To Join disconnects, or when the bridge call ends, the [Incident Timeline](/incident-management/incidents/overview#incident-timeline) reflects these departures as well. This information is made available in [Postmortems and Jeli Post Incident Reviews](/incident-management/after-incident/post-incident-reviews). ##### Connection Duration You can add as many responders to your conference bridge as your conference provider allows. One Touch To Join calls will disconnect after **two hours**. If the responder still needs to participate in the call, they can manually redial the bridge using the conference details attached to the PagerDuty incident. ##### Missed Calls If a responder misses a voice call, PagerDuty attempts to reach them via each configured contact method for their [high-urgency notification rules](/account-admin/user-profile/notification-rules). PagerDuty recommends configuring at least two [contact methods](/account-admin/user-profile/contact-information) so that if a notification for one channel is missed, context is provided in another channel. For example, if a user misses a voice call, they can still manually join the conference bridge using information from the web app, an email notification, or a Slack message, but they cannot use One Touch To Join. #### Supported Countries The One Touch To Join feature is supported in over 30 of our highest responder countries. Countries are classified into one of the two groups: Base or Premium (refer to the following table). The One Touch To Join feature is available when both of the following are true: - The conference bridge is hosted in a Base country. - Requested responders' phone numbers are from a Base or Premium Country. | Base Countries | Premium Countries\* | | --- | --- | | Australia, Canada, China, Germany, India, Japan, Luxembourg, Mexico, New Zealand, United Kingdom, United States | All Base countries, Argentina, Brazil, Bulgaria, Costa Rica, Czech Republic, France, Guatemala, Hungary, Indonesia, Ireland, Israel, Netherlands, Nigeria, Pakistan, Philippines, Poland, Russia, Singapore, South Africa, Spain, Sri Lanka, Taiwan, Ukraine | \*One Touch To Join works with conference bridges hosted in Base countries only. --- URL: https://docs.pagerduty.com/incident-management/incidents/custom-fields-on-incidents # Custom Fields on Incidents Customize metadata fields for streamlined tracking and standardized information display. The Custom Fields feature allows you to: - Enrich PagerDuty incidents with critical and helpful metadata throughout the incident lifecycle. - Flexibly define your preferred data. - Standardize what information your incidents display. - Aggregate data from several existing systems and populate that information during incident response. > **Availability:** This feature is available with PD Reliability Platform plans. It's also available with the Business, Enterprise for Incident Management, and Digital Operations (Legacy) pricing plans. [Contact Sales](https://www.pagerduty.com/contact-us/#contact-sales) to upgrade to a plan with this feature. 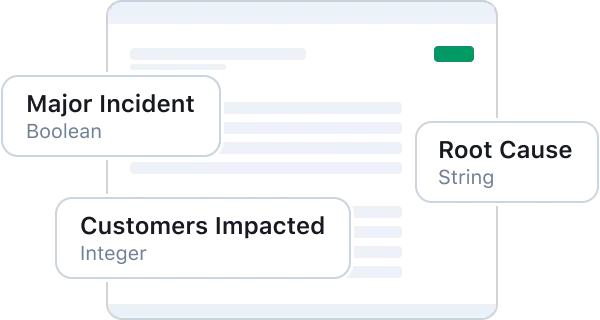 *Custom Fields overview* ## Configure Custom Fields ### Create a Custom Field After creating an [Incident Type](/incident-management/incidents/incident-types), you can add custom fields to that type. **Note**: Because Incident Types use inheritance, custom fields become available to that specific incident type and to its children. > **Custom Fields Availability:** Custom field limits are determined by your plan and the incident type. Please note that disabled custom fields do count toward these limits. | Plan | Base Incident Type Limit | Total Custom Fields Limit | | --- | --- | --- | | Business / PD Reliability Platform Essential | 15 Fields | 45 Fields | | EIM / PD Reliability Platform Plus/Ultimate | 100 Fields | 130 Fields | **How Limits Work** Each plan has a set number of fields available for the Base Incident Type. You can then add additional custom fields to other Incident Types until you reach your account's total field limit. Each individual Incident Type has a maximum limit of 15 custom fields. **Example:** If your plan allows for 15 fields on the Base Incident Type and 45 fields total: You have 30 fields remaining to use across other types. - You can add up to 15 fields per type (e.g., 15 for "Major Incident" and 15 for "Security Incident") until you hit that 45-field account total. > **Required User Permissions:** Admins and the Account Owner can create, edit and delete fields. To create a custom field: 1. Navigate to **Incidents** → **Incident Types**. 2. Select an **Incident Type**, _or_ [create a new Incident Type](#create-an-incident-type). 3. With the **Fields** tab selected, click **New Field**. 4. Enter the following information: | Field | Instructions | | --- | --- | | **Display Name** | Enter a logical name for the field that will display on incidents. | | **Field Name** | Enter a name for use when referencing this field in the API. This field can only contain lowercase letters, numbers, and underscores. You cannot change this value after initial creation. | | **Description** | Enter a description to help responders understand what this field is or how they should use it. | | **Field Type** | Select a data type (for example, **Text**, **Single Select**, **Multi Select**). You cannot change this value after initial creation. | | **Set a Default Value** _(Optional)_ | Pre-populate the field for new incidents to show a default value. This value does not apply to past incidents. | | **Enable Field** | Select **Enable** or **Disable**. | 5. Click **Create Field**. Repeat these steps for as many fields as needed. ### Edit a Custom Field 1. Navigate to **Incidents** → **Incident Types**. 2. Select the Incident Type for which you want to edit the custom field. 3. To the right of your desired custom field, click → **Edit**. 4. Edit the details. 5. Click **Update Field**. ### Disable a Custom Field When you disable a field, it is no longer editable on new or existing incidents. However, this will not erase values from existing incidents (i.e., they will still be visible on the incident details page). You should disable fields when you want to maintain existing data but no longer need them. 1. Navigate to **Incidents** → **Incident Types**. 2. Select the **Incident Type** for which you want to disable a field. 3. To the right of your desired custom field, click → **Disable**. 4. In the confirmation modal, click **Disable**. ### Delete a Custom Field > **Deletion Warning:** Deleting a field from an Incident Type permanently deletes the field for _all_ Incident Types. It also removes the field and values from existing incidents. This action cannot be undone. 1. Navigate to **Incidents** → **Incident Types**. 2. Select an Incident Type. 3. To the right of your desired field, select → **Delete**. 4. In the confirmation modal, click **Delete**. ## Field Types You can specify the field data type when you add a Custom Field. Data types help standardize and validate field data, preventing users from entering incorrect data types into a field. The following field types are available: - **Text** - **Single Select** - **Multiple Select** - **Tag** - **URL** - **Checkbox** - **Datetime** - **Decimal** - **Integer** - **Paragraph** > **Custom Field Limits by Type:** The following table shows the maximum character and quantity limits for each custom field type: | Field Type | Max Characters | Max Quantity of Fields | | --- | --- | --- | | Text | 255 | 100 | | Single Select | 100 | 100 | | Multiple Select | 100 | 5 (100 selectable values) | | Tag | 255 | 5 (55 selectable values) | | URL | 500 | 10 | | Checkbox | 2 | 100 | | Datetime | 10 | 100 | | Decimal | 10 | 100 | | Integer | 5 | 100 | | \*Paragraph | 2,000 | 5 | \*indicates new field type **Additional Requirements** - **Single Select and Multiple Select:** Can have a maximum of 100 options each. Multiple Select fields support up to 200 option selections. - **URL:** Only absolute URLs are allowed, and they must use one of the following schemes: http, https, tel. - **Datetime:** Values must conform to either full-date or date-time [RFC3339, section 5.6.](https://www.rfc-editor.org/rfc/rfc3339#section-5.6) Examples of supported values: `2022-03-14`, `2019-08-28T10:43:05Z`. **Child Incident Types & Field Limits** Field limits apply per **hierarchy branch**, not per **individual incident type.** - Each top-level incident type (including children of the base incident) starts its own hierarchy with independent limits - Fields on a parent type consume the limit for that entire branch (the parent + all its descendants) - Sibling branches maintain separate limits and do not affect each other > **Example:** If a base incident has 5 paragraph fields, the limit is maxed for that branch. However, if the base incident has 0 fields, a child type like "Major Incident" can use all 5 fields across itself and its children, while a sibling "Security Incident" branch gets its own separate 5-field allowance. ## View Custom Fields > **Required User Permissions:** Users with permission to view and edit an incident can also view and edit that incident's Custom Fields. There are two places to view Custom Fields on incidents: **View Custom Fields in the Web App** To view Custom Fields, navigate to an incident's details page and scroll to the **Custom Fields** section.  *Custom fields in the web app* #### Edit Custom Field Values in the Web App Custom Fields with default values are prefilled, but fields may also be left empty for the responder to fill in during incident response. 1. Navigate to an incident's details page. 2. Click **Edit Fields** in the **Custom Fields** section. 3. In the right pane, enter your desired value(s) for each Custom Field. 4. Click **Save**. When a responder updates a Custom Field's value, the action adds a log entry to the incident's timeline.  *Custom field update in the incident timeline* **View Custom Fields in the Mobile App** For incidents with Custom Fields defined, you can view them in the mobile app on the incident's details screen. - On iOS, you can do this by selecting the **Triage** tab and scrolling to the **Custom Fields** section. - On Android, you can do this by selecting the **Triage** tab, scroll to the Incident Type (e.g., Security Incident, Major Incident) section to view the custom fields. An **i** icon indicates they are the custom fields. If there are more than three Custom Fields defined, tap **Show More** to expand the section and view all Custom Fields.  *Custom fields in the mobile app* #### Edit Custom Field Values in the Mobile App 1. Navigate to an incident's details page by tapping the incident. 2. Under **Custom Fields** in iOS or under the Incident Type (e.g., Security Incident, Major Incident) section in Android, tap **Edit Custom Fields**. 3. Enter your desired value(s) for each Custom Field. 4. Tap **Save**.  When a responder updates a Custom Field's value, the action adds a log entry to the incident's timeline.  *Custom field update in the mobile app incident timeline* ## FAQ **What happens to active incidents if I add or remove a Custom Field?** Custom Fields apply across all incidents on an account. This means that if you create a new Custom Field, it will appear on all incidents previously created in your account. Similarly, if you delete a Custom Field, it will no longer appear on incidents in your account. When adding a new field, default values do not apply to previously created incidents — those incidents will have `null` values. **How many Custom Fields can I create?** Customers with a Business pricing plan can create up to 15 active Custom Fields on incidents. Customers with an Enterprise for Incident Management plan can create an additional 15 Custom Fields, for a total of 30. Contact the [Sales team](https://www.pagerduty.com/contact-us/#contact-sales) to upgrade to a plan with more Custom Fields. **How can I analyze or run a report on Custom Fields data?** Custom Fields are supported in the [Incident Activity](/incident-management/analytics/insights/incident-activity) report and can be added as additional columns to the report. **How can I sync PagerDuty Custom Fields with ServiceNow incident record fields?** Refer to the [Custom Field Mappings](/integrations/servicenow-integration-guide/advanced-servicenow-configuration#incident-types-and-custom-field-mappings) article for more information on bi-directionally syncing PagerDuty Custom Fields with ServiceNow Incident record fields. **How can I set Custom Field values with Event Orchestration?** Refer to the [Event Orchestration](/ai-automation/aiops/event-orchestration#custom-fields) article for more information. **How can I update Custom Field values with Slack?** Refer to the [Slack User Guide](/integrations/slack-integration-guide/slack-user-guide#dedicated-channel-commands) for more information. **How can I update Custom Field values with Microsoft Teams?** Refer to the [Microsoft Teams User Guide](/integrations/microsoft-teams/microsoft-teams-user-guide#update-custom-fields) for more information. --- URL: https://docs.pagerduty.com/incident-management/incidents/dynamic-notifications # Dynamic Notifications Add severity levels to incidents to support effective incident triage. Dynamic Notifications allow you to generate alerts with severity fields. When an incident is generated from an alert, you can use its severity field to control incident [urgency](/incident-management/services/configurable-service-settings#notification-urgency) and how responders receive notifications. This feature reduces noise and ensures responders can focus on the most critical incidents. > **Pricing Plans:** All pricing plans, with the exception of some legacy and specially negotiated > plans, have access to Dynamic Notifications. [Contact our Sales > team](https://www.pagerduty.com/contact-sales/) if you want to switch to a > plan with Dynamic Notifications. ## Event/Alert Severity Levels You can generate PagerDuty alerts with a severity field via a triggering monitoring tool that directly provides severity values, or you can set them using [Event Orchestration](/ai-automation/aiops/event-orchestration#alert-data). When an incident is generated from an alert, PagerDuty uses the alert’s severity field to determine the urgency level. The values of this field must be one of the following: - `critical` - `error` - `warning` - `info` > **Case Sensitivity:** Severity fields are case-sensitive. For example, the severity field `Info` (instead of `info`) produces an error: ` > 'payload.severity' is invalid (must be one of the following: 'critical', 'warning', 'error' or 'info')`. ### Severity and Urgency Mapping | Alert Severity | Description | Default Incident Urgency | Incident Behavior | | -------------- | ------------------------------------------------------------------------------------------------------------------------------ | ------------------------ | ----------------------------------------------------------------------- | | `critical` | A failure in the system's primary application. | High | Uses high-urgency notification rules and escalates if not acknowledged. | | `error` | Any error that is fatal to the operation, but not the service or application. | High | Uses high-urgency notification rules and escalates if not acknowledged. | | `warning` | May indicate that an error will occur if action is not taken. | Low | Uses low-urgency notification rules and cannot escalate. | | `info` | Normal operational messages that require no action. PagerDuty recommends suppressing `info` alerts if appended to an incident. | Low | Uses low-urgency notification rules and cannot escalate. | | Unknown | Automatically chosen when a monitoring tool is not set or cannot set the severity. | High | Uses high-urgency notification rules and escalates if not acknowledged. | Severity-to-urgency mappings are hard-coded (as shown below). Any incoming event without a severity defaults to high urgency. 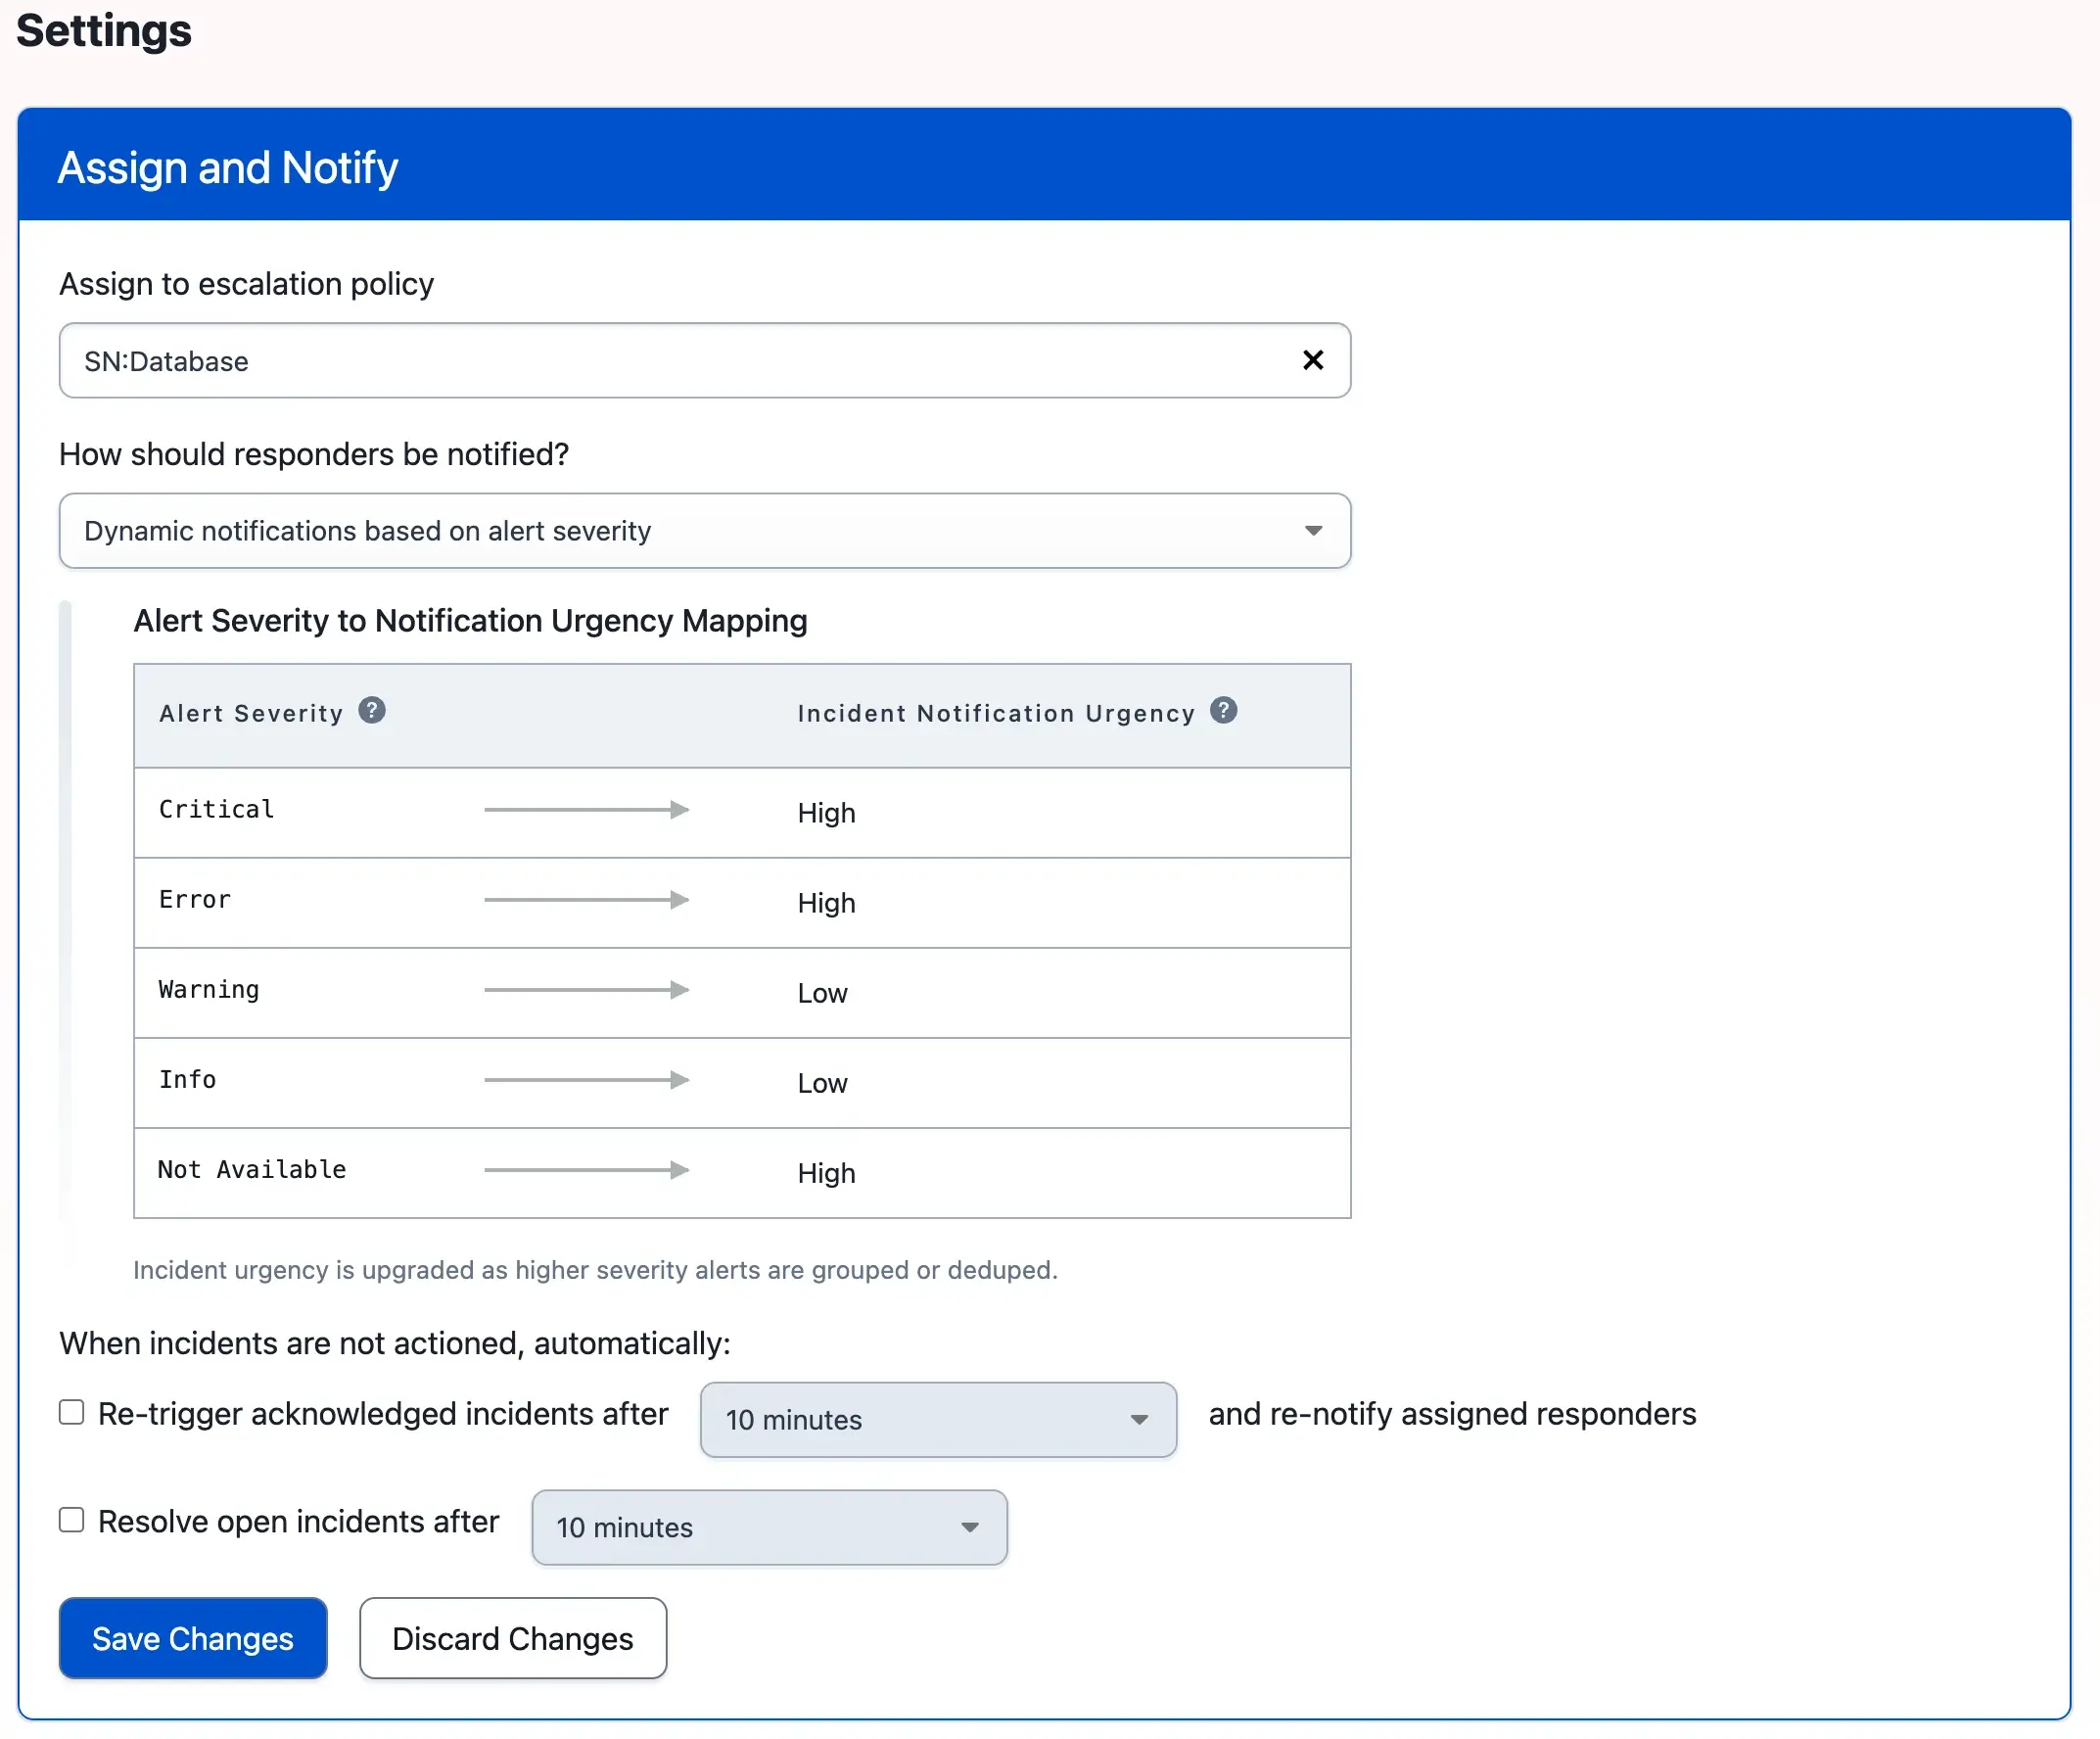 ## Configure Dynamic Notifications > **Required User Permissions:** Users with the following roles can configure Dynamic Notifications: > > - User > - Admin > - Manager base roles and team roles. Manager team roles can only manage services associated with their team. > - Global Admin base roles > - Account Owner To configure Dynamic Notifications: 1. Navigate to **Services** → **Service Directory**. 2. Select your preferred **service**. 3. Select the **Settings** tab. 4. In the **Assign and Notify** section, click **Edit**. 5. In the **How should responders be notified?** dropdown, select **Dynamic notifications based on alert severity**. 6. (_Optional_) Configure **When incidents are not actioned, automatically** with the following settings: 1. **Re-trigger acknowledged incidents after [x minutes] and re-notify assigned responders**: Select the checkbox and your preferred time period. 2. **Resolve open incidents after [x minutes]**: Select the checkbox and your preferred time period. 7. Click **Save Changes**. Any alert-created incidents on the service will now determine notification urgency according to the severity of their alerts. When an alert is added to an incident or its severity changes, the incident’s notification urgency is also updated. For example, an alert that changes from Warning to Critical updates the associated incident from Low to High, but a change from Critical to Warning does not reduce the incident’s urgency. Non-alert incidents, such as those manually triggered or triggered through the [Create Incidents API](/developer/api/reference/rest/incidents/create-incident), will always have their urgency set by the service’s setting. ### Edit or Disable Dynamic Notifications 1. Navigate to **Services** → **Service Directory**. 2. Select your preferred **service**. 3. Select the **Settings** tab. 4. In the **Assign and Notify** section, click **Edit**. 5. Edit your preferred settings. To disable Dynamic Notifications, select a different notification under **How should responders be notified?** dropdown. 6. Click **Save Changes**. ## Defined Support Hours You can also use Dynamic Notifications in relation to a service’s [defined support hours](/incident-management/services/configurable-service-settings#urgency-use-case-support-hours). You can set specific support hours and choose how you want to receive notifications during and outside those hours. 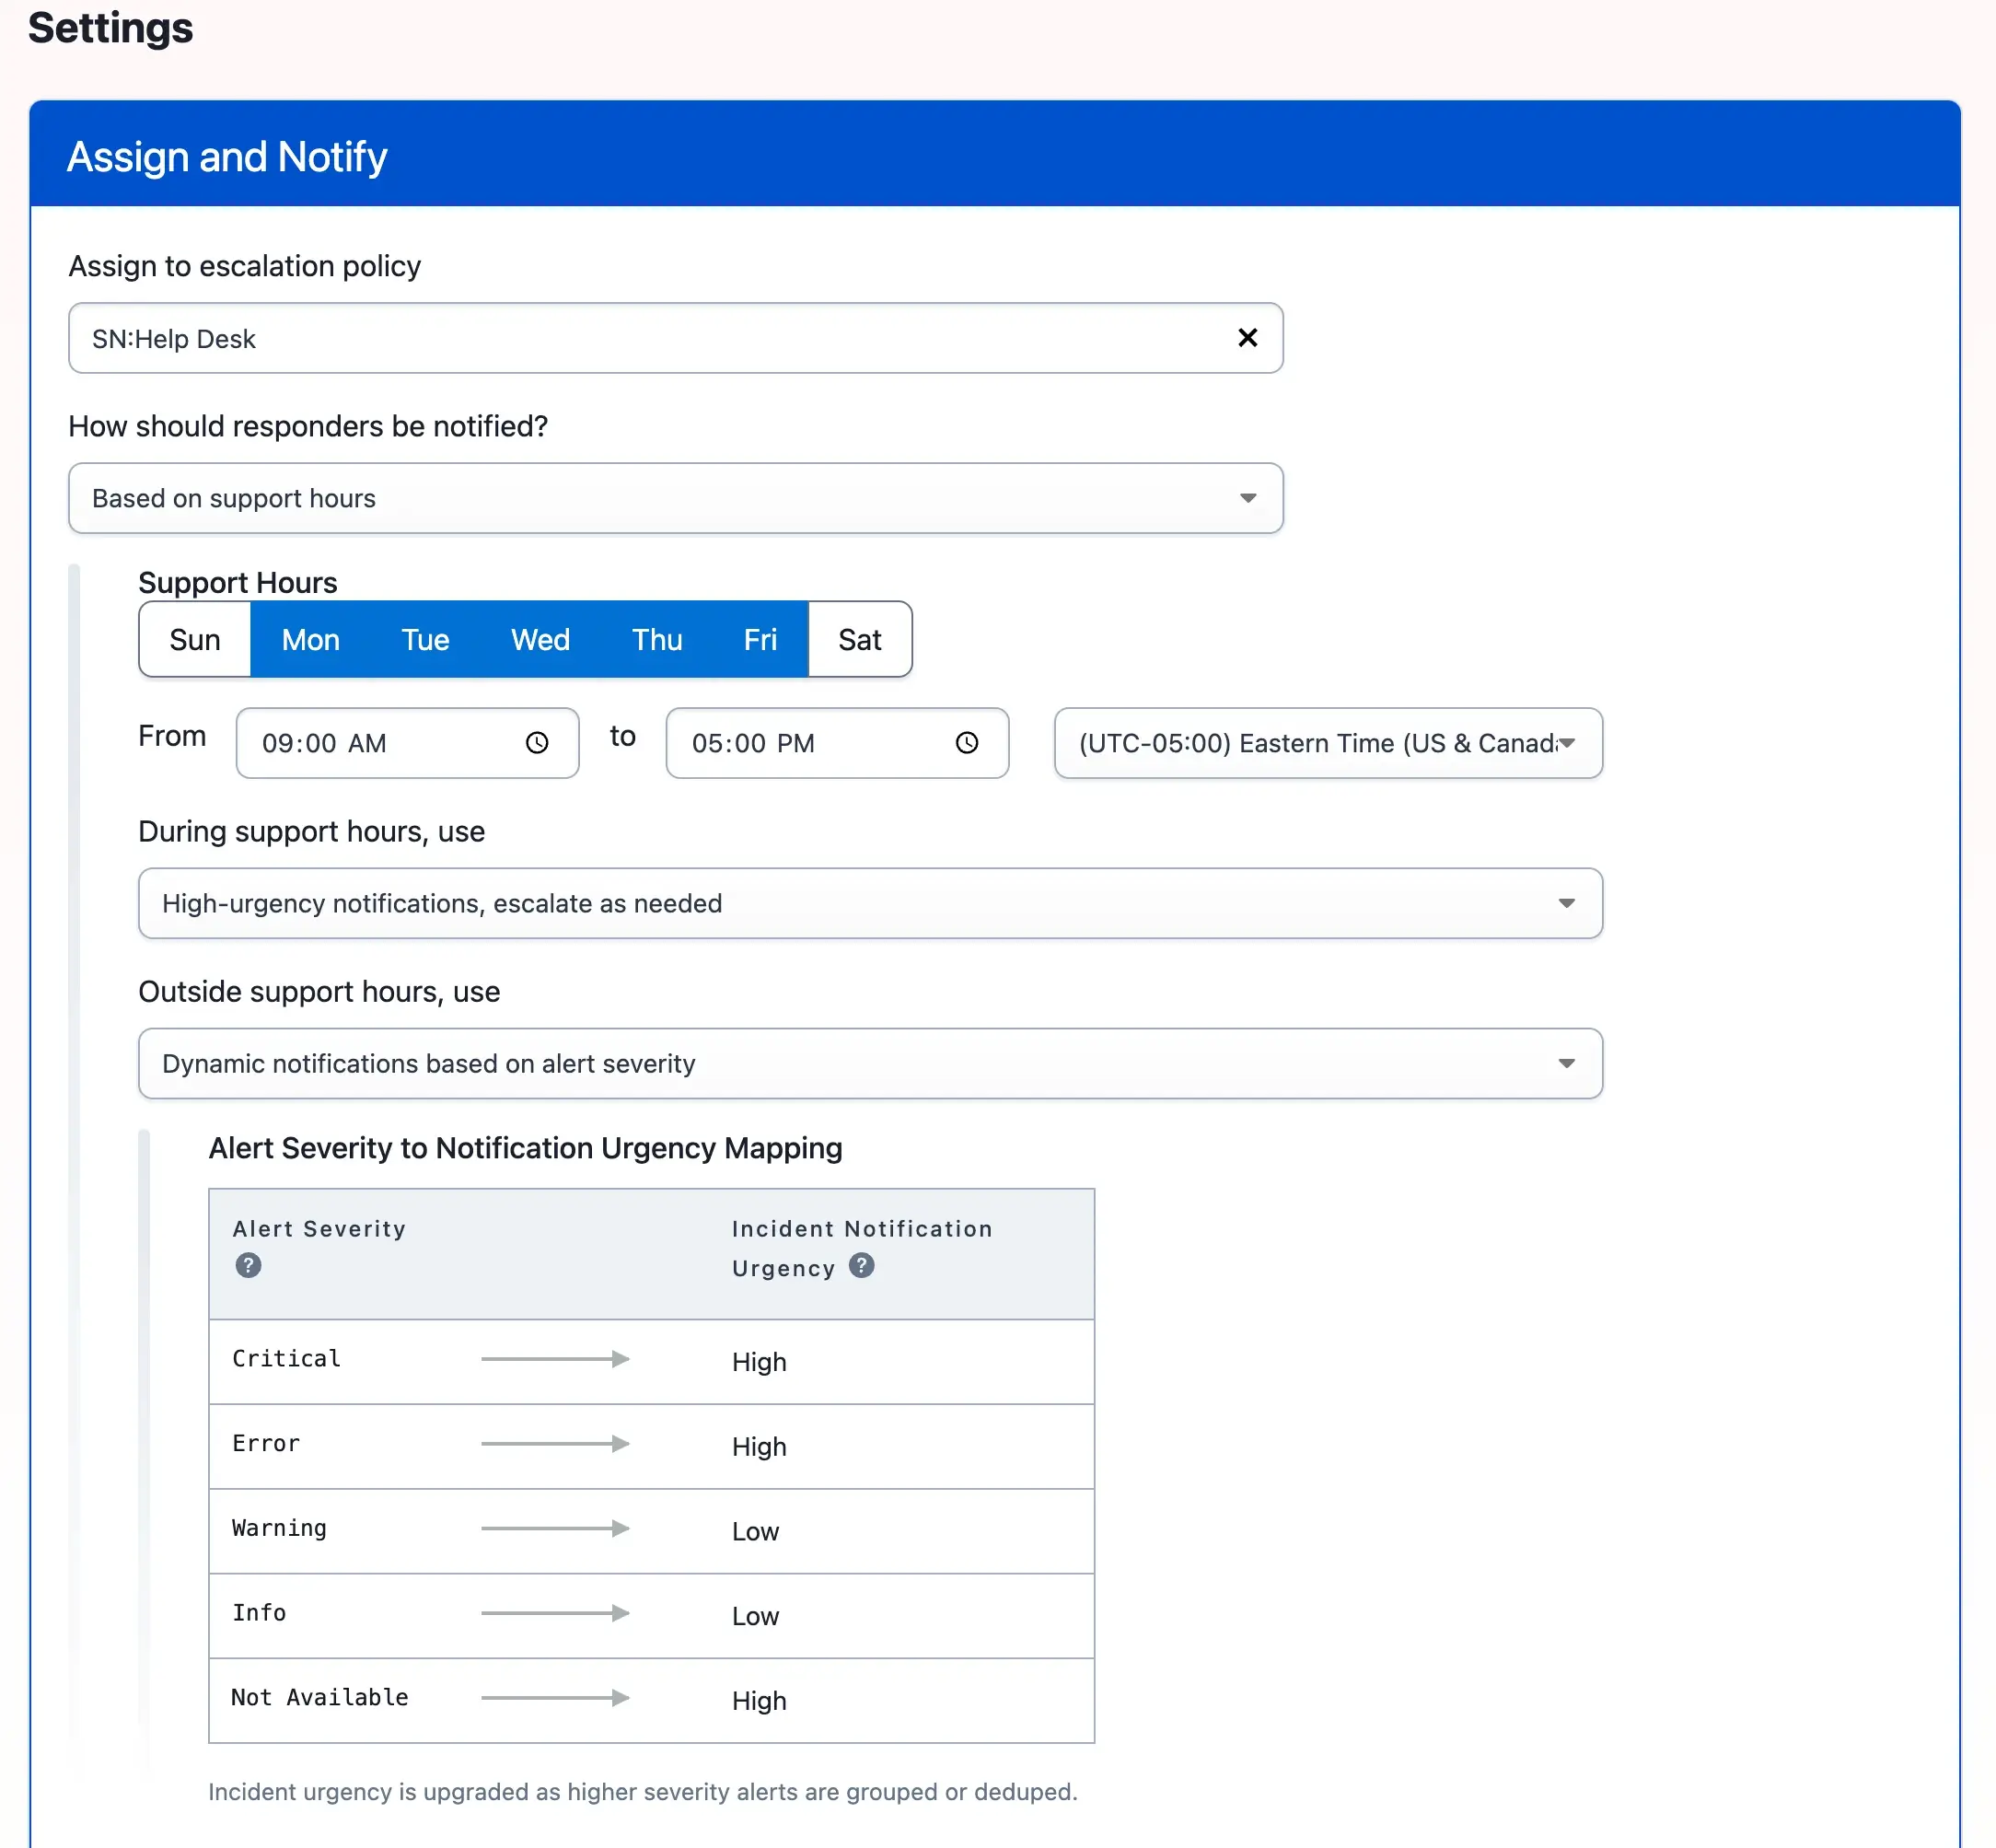 _Dynamic notifications based on support hours_ To configure defined support hours: 1. Navigate to **Services** → **Service Directory**. 2. Select your preferred **service**. 3. Select the **Settings** tab. 4. In the **Assign and Notify** section, click **Edit**. 5. In the **How should responders be notified?** dropdown, select **Based on support hours**. 6. Select the **days** of the week, **hours**, and **time zone** for your support hours. 7. Under **During support hours, use**, select what **type of notification urgency** you want during support hours. 8. Under **Outside support hours, use**, select what **type of notification urgency** you want outside of support hours. 9. (_Optional_) Configure **When incidents are not actioned, automatically** with the following settings: 1. **Re-trigger acknowledged incidents after [x minutes] and re-notify assigned responders**: Select the checkbox and your preferred time period. 2. **Resolve open incidents after [x minutes]**: Select the checkbox and your preferred time period. 10. Click **Save Changes**. ## Upgrade Incident Notification Urgency If multiple trigger events occur for the same alert, the alert's severity is set to the highest severity. For example, if an alert initially triggers on a Warning event, and then a Critical event occurs, the alert changes to Critical, and the associated incident changes from Low urgency to High urgency. If a subsequent `Info` event occurs, the incident remains High urgency. It does not downgrade to Low. There are three ways you can bundle multiple alerts into a single incident: - **Using the [Alert Grouping](/ai-automation/aiops/noise-reduction/alert-grouping/time-based-alert-grouping) feature**: You can group alerts for a set period of time or until the incident resolves. While grouping is active, subsequent alerts roll up under a single incident. The incident uses the notification urgency that corresponds with the most severe alert grouped with it. - **Manually merge the alerts’ parent incidents**: The following example shows two alerts with different severity levels merged into a single incident. The initial alert had an `info` severity, and it created an incident with **Low** urgency. After merging the incidents, the remaining incident is marked as **High** urgency due to the second alert's severity level: 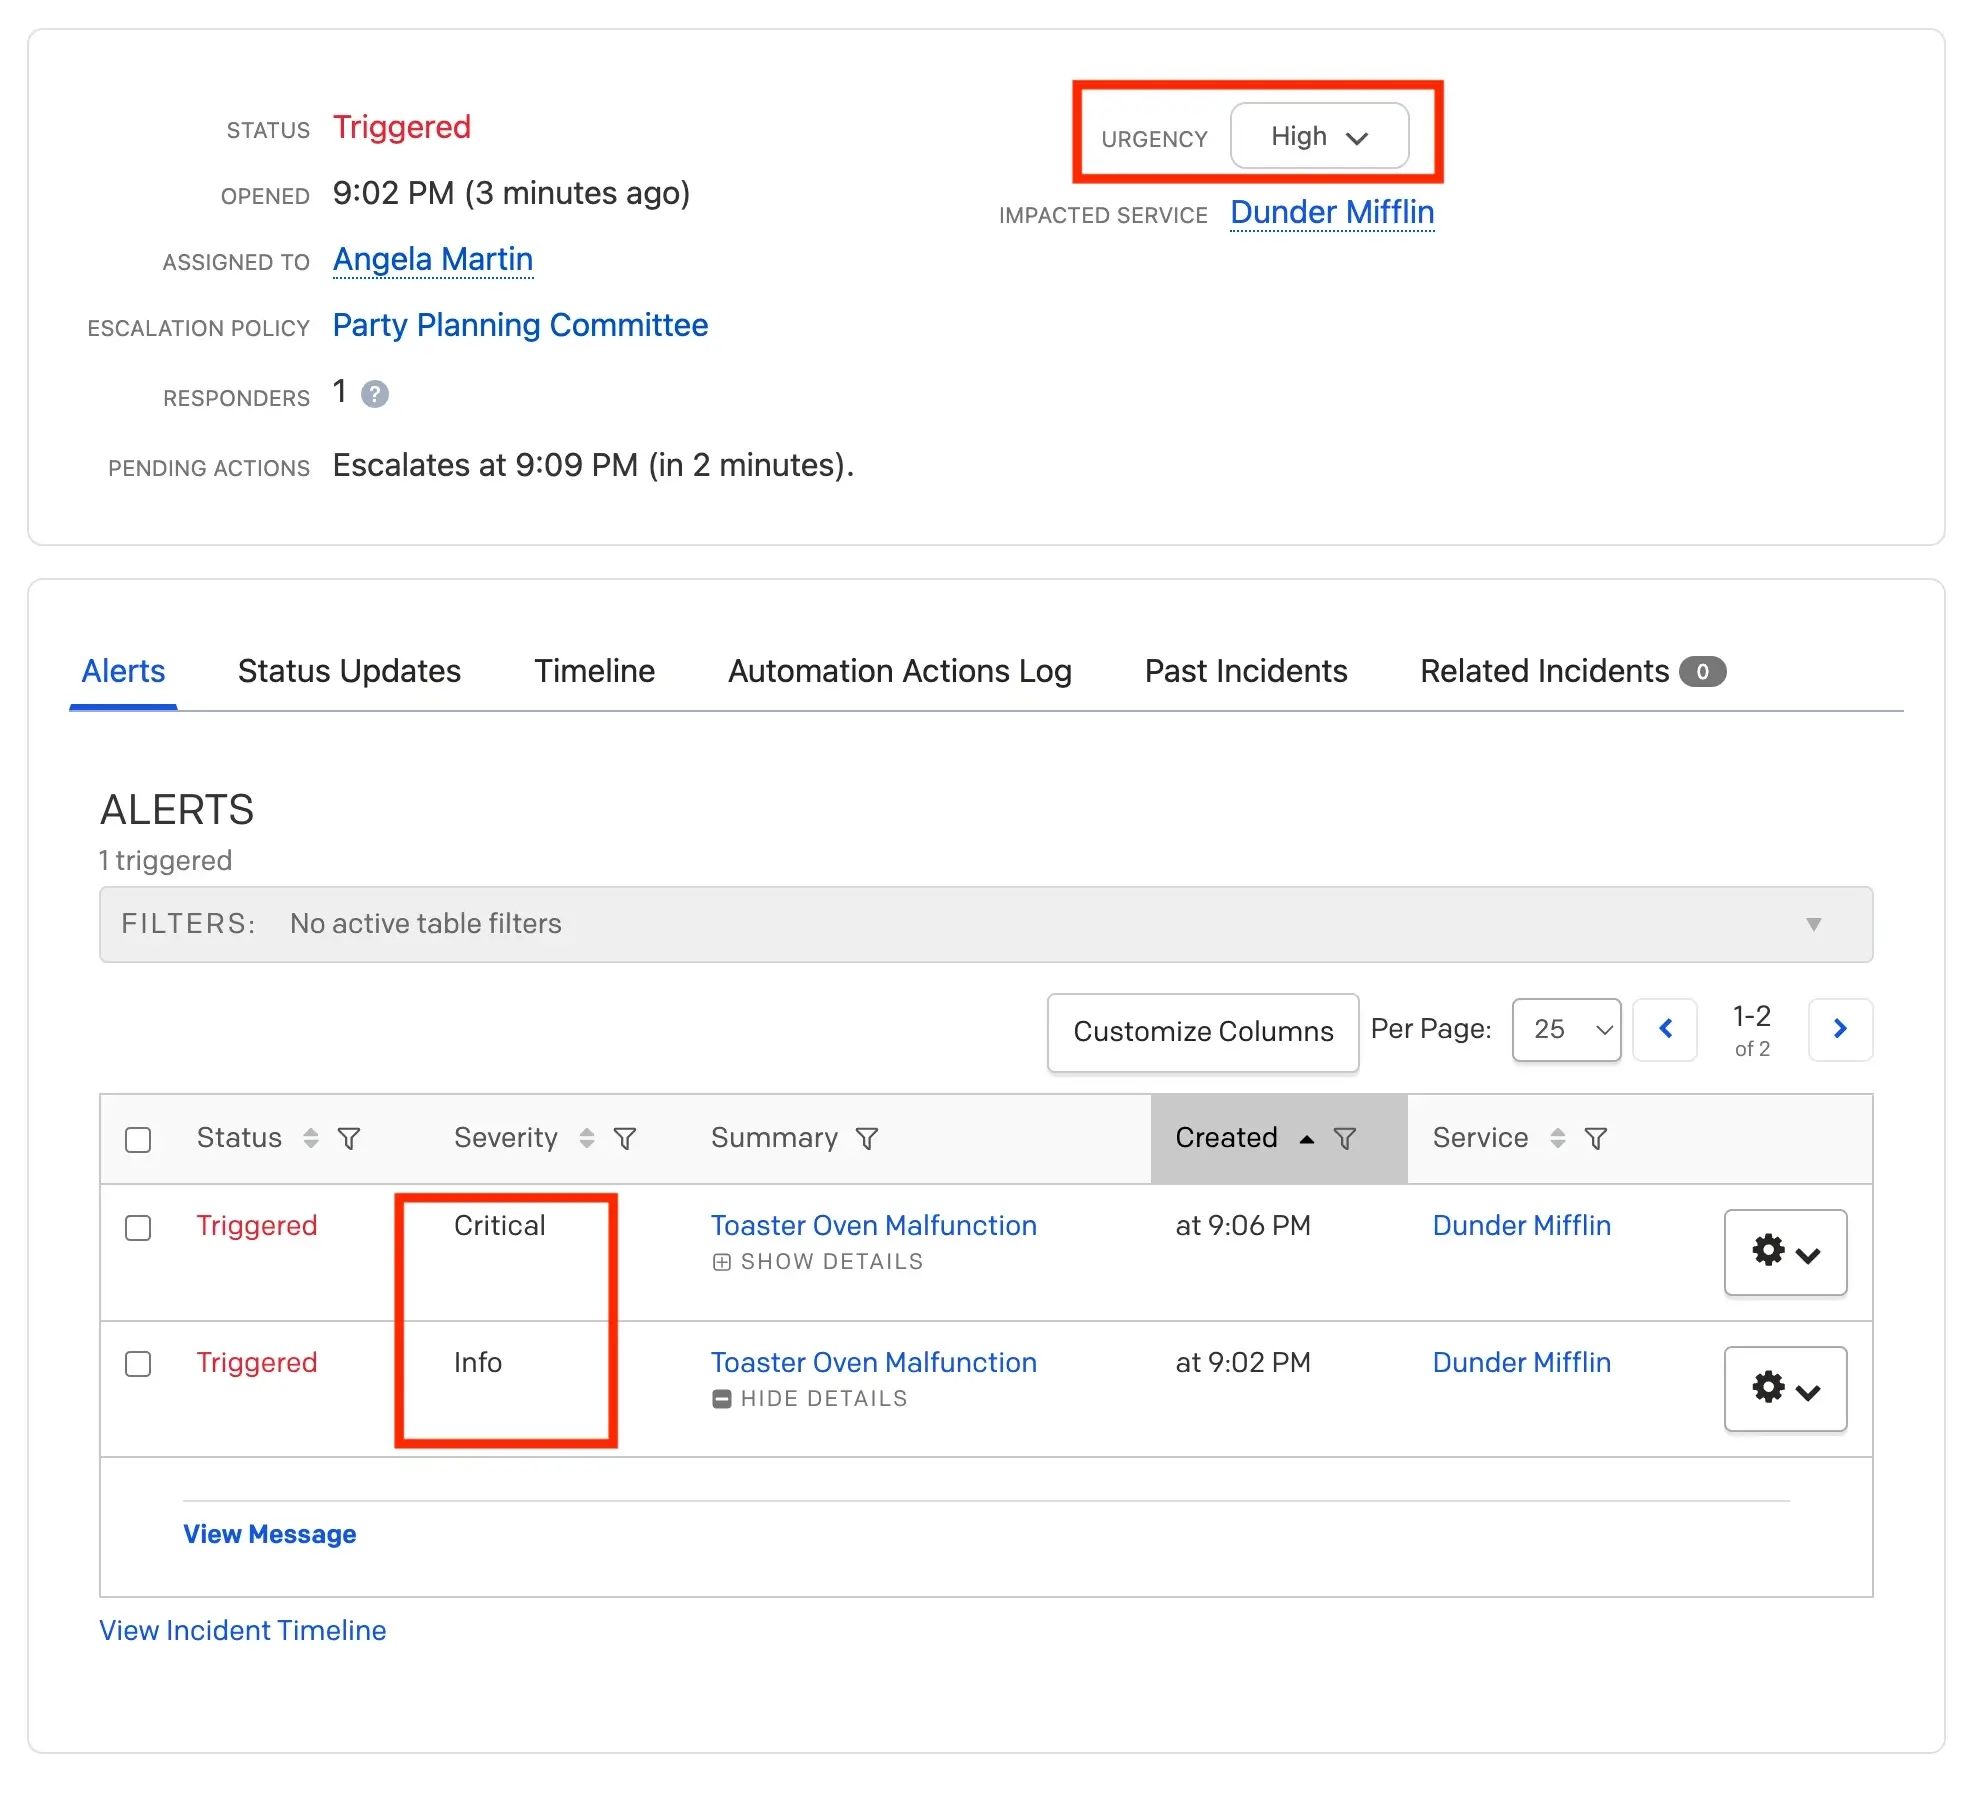 - **Using an alert `dedup_key`**: With this method, a subsequent alert trigger replaces an existing alert. ## PagerDuty Common Event Format For integrations already mapped to the [PagerDuty Common Event Format (PD-CEF)](/developer/api/pd-cef), alerts of varying severities may be generated by default. For most integrations, alerts are set to critical by default; you must use Event Orchestration to change the desired severity. 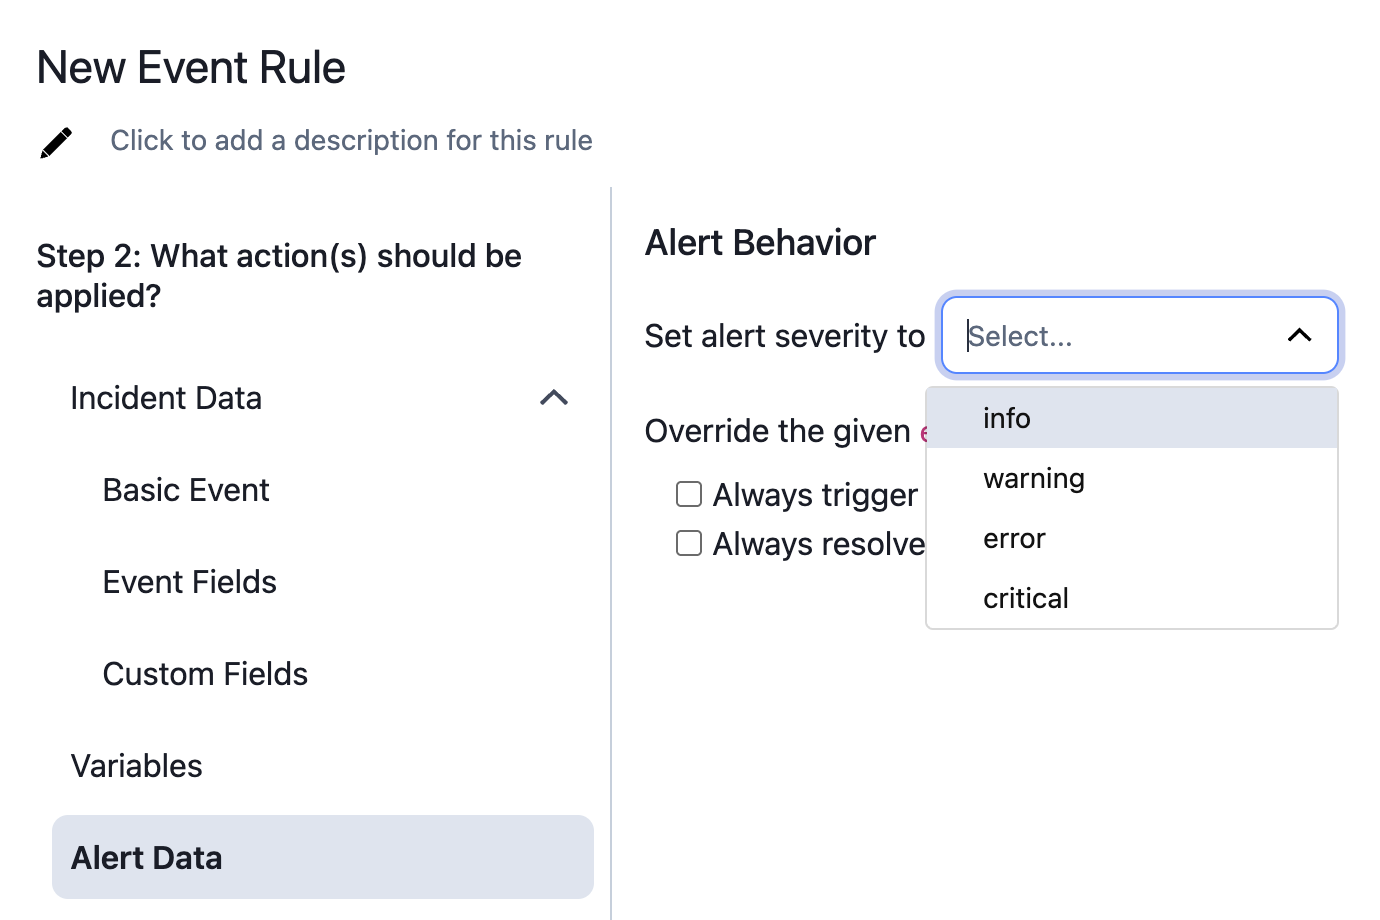 ## Recommended Practices - **For immediately actionable events, set a `critical` or `error` severity**: This ensures that any associated incidents use high-urgency notification channels and escalate if not acknowledged. - **For actionable events that do not require immediate attention, set a `warning` severity**: This creates a low-urgency incident that does not escalate. - **For non-actionable events, consider suppressing them and setting an `info` severity**: Non-actionable events do not require incident response, so in most cases you should suppress them. ## FAQ **How does the Dynamic Notifications feature interact with Incident Priority?** Incident Priority and Incident Urgency are separate properties that do not influence each other. Currently, you can set Priority manually on an existing incident or during manual incident creation using the [Incident Create API](/developer/api/reference/rest/incidents/create-incident) or [using Event Orchestration](/ai-automation/aiops/event-orchestration#incident-data). **What if an alert does not have a severity attached?** Alerts created before November 2016 may not have severity information attached. However, since then, all alerts are generated with severity. The alert severity defaults to **Critical** if the emitting system, event transformer, or Event Orchestration does not specify severity. Events sent to the Events API v2 must include a severity. **What about email integrations?** Service-level email integrations do not send severity. > **Tip:** You can send events to [Event > Orchestration](/ai-automation/aiops/event-orchestration)'s email integration > key to add severity and incident priority. **Can I customize the severity-to-urgency mapping?** Currently, mappings are not customizable. **How do I set urgency if monitoring tools do not send it to PagerDuty?** Use [Event Orchestration](/ai-automation/aiops/event-orchestration) to set severities for incoming alerts on a service. **How does the Dynamic Notifications feature relate to PagerDuty CEF (PD-CEF)?** Integrations mapped to [PagerDuty CEF (PD-CEF)](/developer/api/pd-cef) automatically send severity. You can always send the severity information using the [Events API v2](/developer/events-api-v2-overview). **How does the Dynamic Notifications feature relate to Alert Grouping?** You can group alerts into a single incident, either over a specific time period or for as long as the incident is open. As new alerts are added to an incident, its severity is set to the highest level. An incident's urgency is never downgraded. **Will Incident Log Entries (ILEs) update?** Yes, the Incident Log Entries (ILEs) are updated to indicate when severity sets incident urgency and when incident urgency is upgraded due to alert severity. --- URL: https://docs.pagerduty.com/incident-management/incidents/edit-incidents # Edit Incidents Merge, snooze, add Notes to incidents and more. When an incident triggers, there are a number of manual actions you may want to take, depending on your workflow or the specifics of the situation: - [Merge Incidents](#merge-incidents) - [Snooze an Incident](#snooze-an-incident) - [Edit Incident Title](#edit-incident-title) - [Edit Incident Priority](#edit-incident-priority) - [Edit Incident Urgency](#edit-incident-urgency) - [Reassign an Incident's Service](#reassign-an-incidents-service) - [Edit Incident Duration](#edit-incident-duration) - [Add a Note to an Incident](#add-a-note-to-an-incident) ## Merge Incidents Merging multiple incidents into a single incident streamlines the notification and resolution process. Merging incidents also consolidates alert information into a single incident, helping responders identify an issue's root cause and impact. > **Resolved Incidents:** The target incident must be **open**. You _cannot_ merge incidents into a resolved incident. There are three places to merge incidents in the web app: - [On the Incidents Page](#on-the-incidents-page) - [On an Incident's Details Page](#on-an-incidents-details-page) - [On a Service's Details Page](#on-a-services-details-page) ### On the Incidents Page 1. On the **Incidents** page, select the **checkboxes** next to the incidents you want to merge. 2. Click **Merge Incidents**. 3. In the modal, select the incident you want to group the alerts under. In the **Select the incident to merge into** field, sort incidents by **Selected Incidents**, **Assigned to me**, or **Assigned to my team**. 4. _(Optional)_ Update the **Incident Title** if a different title would better describe the issue. 5. Click **Merge incidents and \[X] Alerts**. 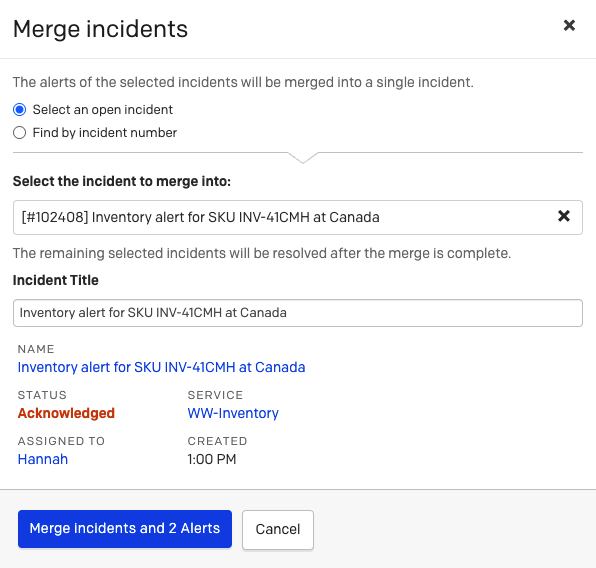 *Merge Incidents and 2 Alerts* The incident dashboard shows the merged incident. Select the incident to view alerts from all merged incidents under the **Alerts** section. 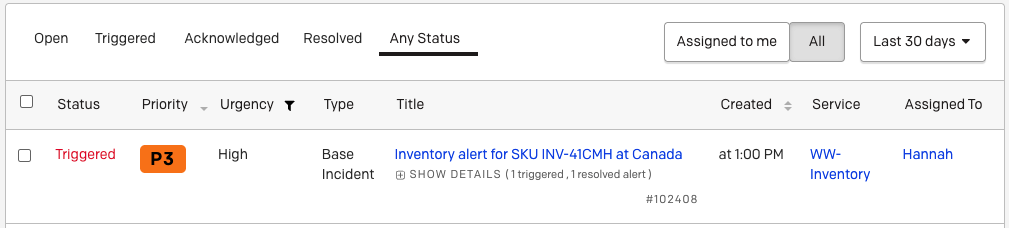 *Merged incident*
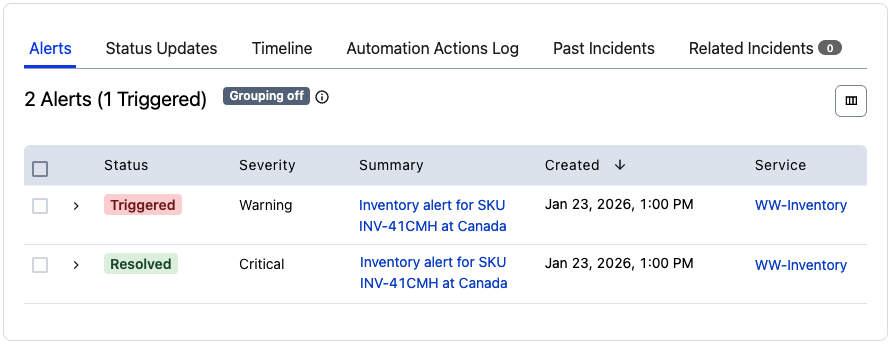 *Merged alerts* ### On an Incident's Details Page 1. Select an incident to view its details page. 2. Click **More** → **Merge with Another Incident**. 3. Enter an **incident number** and click **Find Incident**. 4. Click **Merge Incident and \[X] Alerts**. 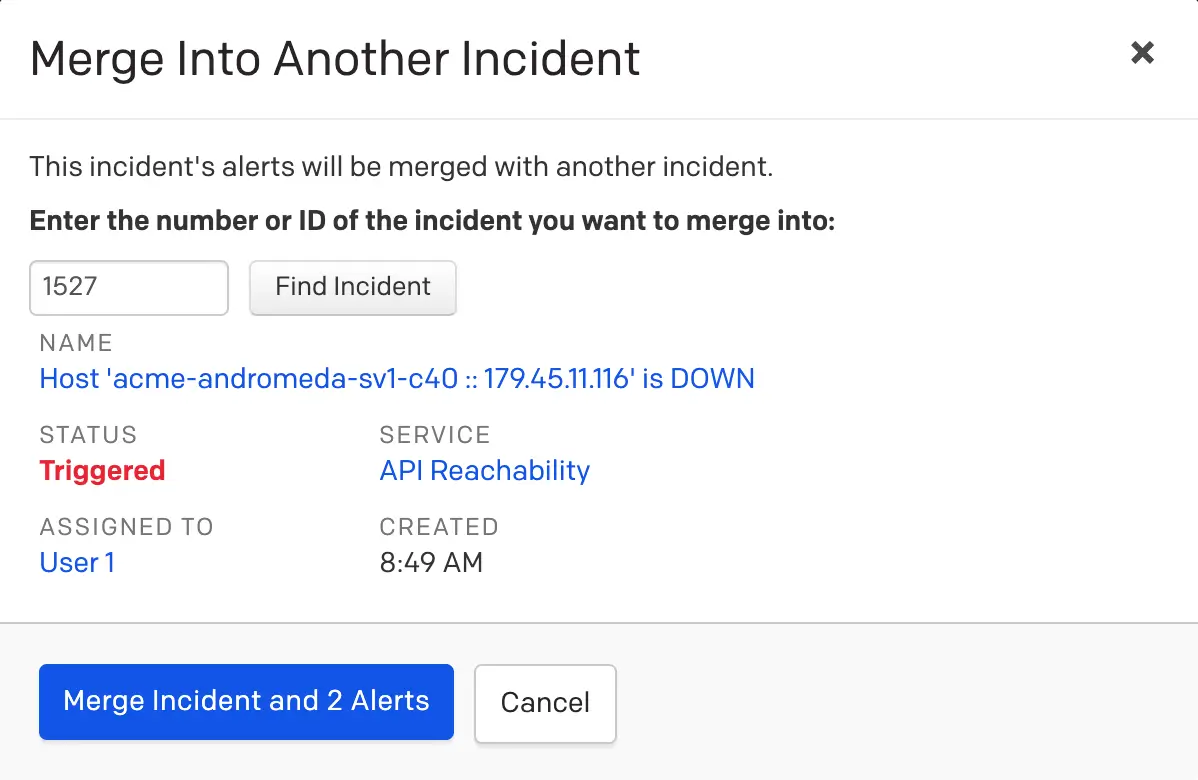 *Merge incidents on the details page* ### On a Service's Details Page 1. Navigate to **Services** → **Service Directory**. 2. Select the service to view its details page. 3. Select the **checkboxes** next to the incidents you want to merge. 4. Click **Merge Incidents**. 5. In the **Merge Incidents** modal, select the radio button of the incident you want to merge into. 6. Click **Merge**. The remaining selected incidents are resolved after the merge is complete. 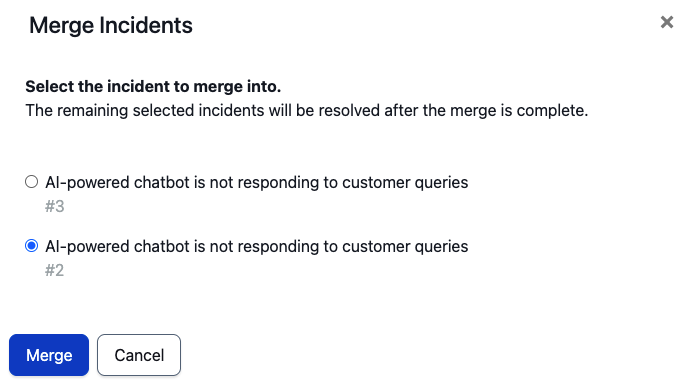 *Merge incidents on the service details page* 1. On the Open Incidents screen, tap (iOS) / (Android) in the top right and tap **Select Incidents**. 2. Select the radio buttons to the left of the incidents you want to merge, then tap **Change (X)** → **Merge X incidents** (iOS) _or_ → **Merge** (Android). 3. Select the **incident** you want to merge into. A confirmation dialog appears at the bottom of the screen indicating the incidents have been merged. > **Alert Maximum:** An incident cannot have more than 1,000 alerts. You cannot merge incidents if their combined total exceeds 1,000 alerts. ### Merge Behavior - When you merge multiple incidents, alerts are consolidated into the target incident. The other selected incidents are resolved with the resolution reason listed as **Merged**, and reference the target incident. 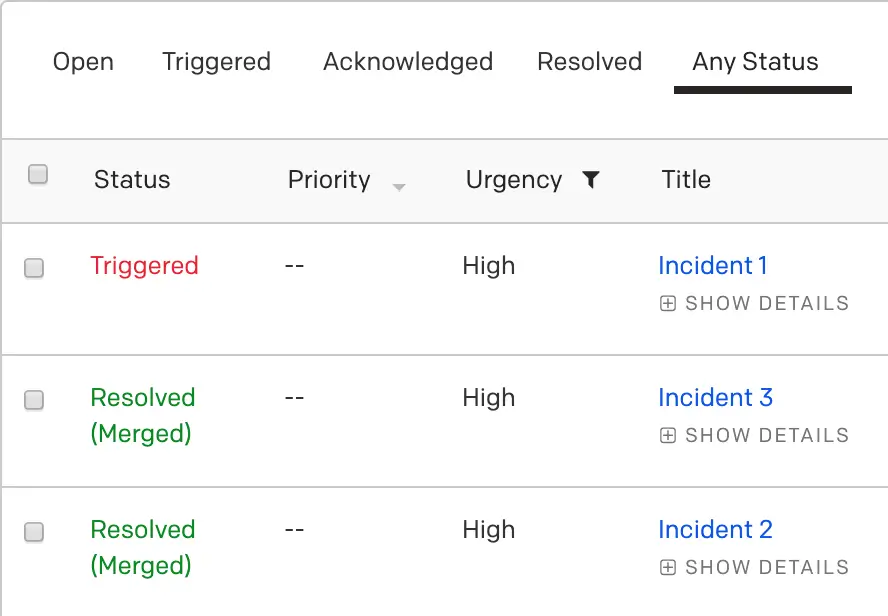 *Merged incidents* - The deduplication key (**Alert Key**) does not change, but moves so that it is under a single incident with other deduplication keys. - If you are using a bidirectional integration such as the Slack integration, merged incidents appear as resolved and reference the new target incident where all alerts are aggregated. 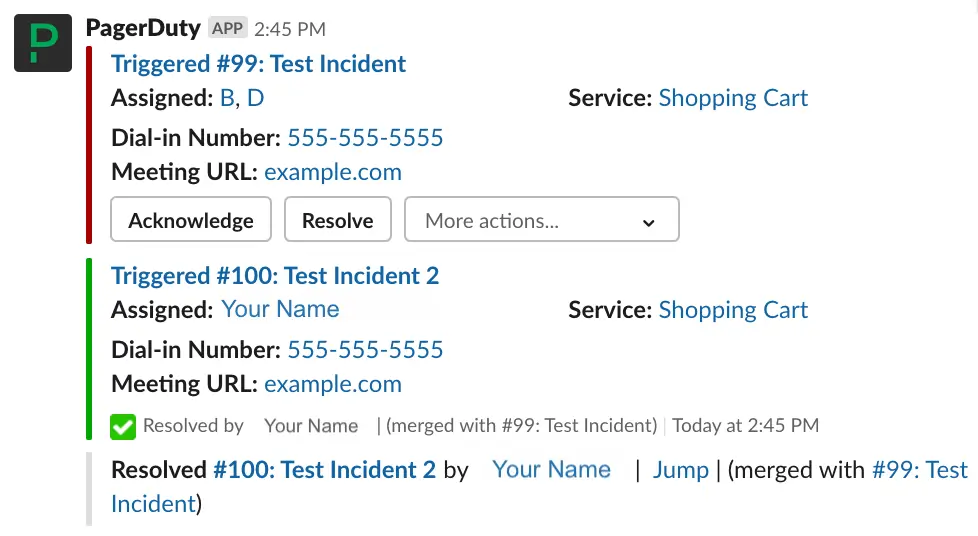 *Merged incident in Slack* - Responders from source incidents are not merged into the target incident. The target incident's responders are preserved, and all alerts are assigned to them. You can view these users in the **Timeline** tab on the incident's details page. - Subscribers from source incidents are not merged into the target incident. They must be [re-added](/incident-management/services/business-services/subscription#subscribe-to-incidents) to the target incident. ### Move Alerts to Another Incident If an alert is incorrectly merged, there are two ways to move it to a new or existing incident: 1. Navigate to an incident's details page and scroll to the **Alerts** section. 2. Select the **checkbox** of the alert you want to move. 3. In the **Move** dropdown, select **Create new incident**. 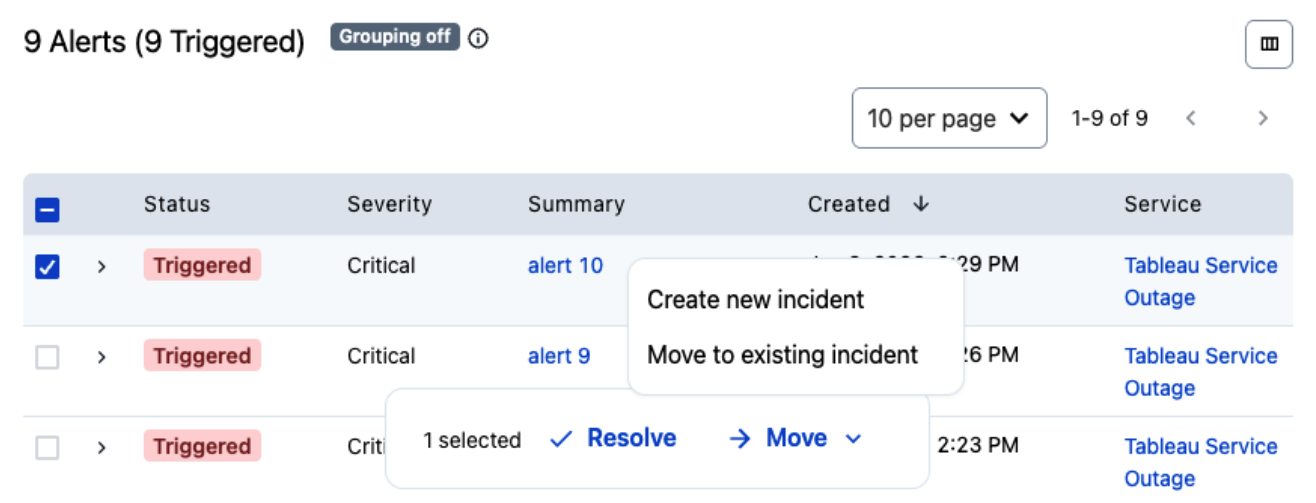 *Move alerts on the Incidents page* 4. _(Optional)_ Click **Edit Incident** to edit the incident details. 5. Click **Create Incident**. 1. Navigate to an incident's details page. 2. In the **Alerts** section, click an alert's **Summary** to navigate to its details page. 3. Click **Move to Another Incident**.  *Move alert to another incident* 4. Enter an **incident number** and click **Find Incident**. 5. Click **Move Alert**. ### Merged Incidents and Webhooks If you have configured [webhooks](/integrations/webhooks), merging alerts into another incident sends a webhook for the source incident with a `resolve_reason` of `merged`. Webhooks continue to update the target incident, but all incidents merged into it are marked as resolved. Webhook updates are only sent for services with open incidents. For example, if you merge an incident from Service A into an incident on Service B, updates are sent only on Service B webhooks. For incidents that were resolved when they merged into a target incident, resolve webhooks trigger if configured. These incidents contain a reference to the target incident. In the webhook body, the `resolve_reason` object provides detailed information about the target incident and indicates that the `type` is `merge_resolve_reason`. ## Snooze an Incident Responders can use the snooze feature to prevent an acknowledged incident from escalating while they are working on the issue. You can snooze an incident for the following intervals: **1 hour**, **4 hours**, **8 hours**, **24 hours**, or **Other**. If you choose **Other**, the maximum length is 168 hours (one week). Snooze is only available for acknowledged incidents. If you do not resolve the incident before the snooze timer expires, the incident returns to a triggered state and notifies you again according to your notification rules. If a different user has come on call since the incident was triggered — for example, due to a rotation on a [schedule](/incident-management/schedules/schedule-basics) — both users are notified. The incident log captures all snooze actions taken on an incident. 1. **Acknowledge** the incident. **Snooze** replaces the **Acknowledge** button. 2. Select **Snooze** and choose the length of time you want to snooze the incident. 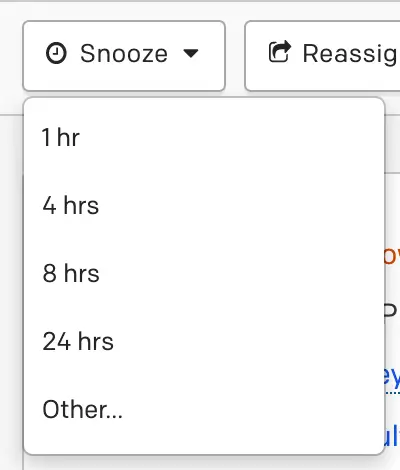 *Snooze an incident* > **Add an Escalation Policy as a Responder:** If you [add responders](/incident-management/incidents/add-responders#add-responders-to-an-incident) to an incident and select an escalation policy, snoozing does not prevent the incident from escalating. If you select **Other**, you can set a custom snooze time, snooze until a time tomorrow, or base your snooze on a service's [support hours](/incident-management/services/configurable-service-settings#step-one-configure-urgencies-on-a-service). 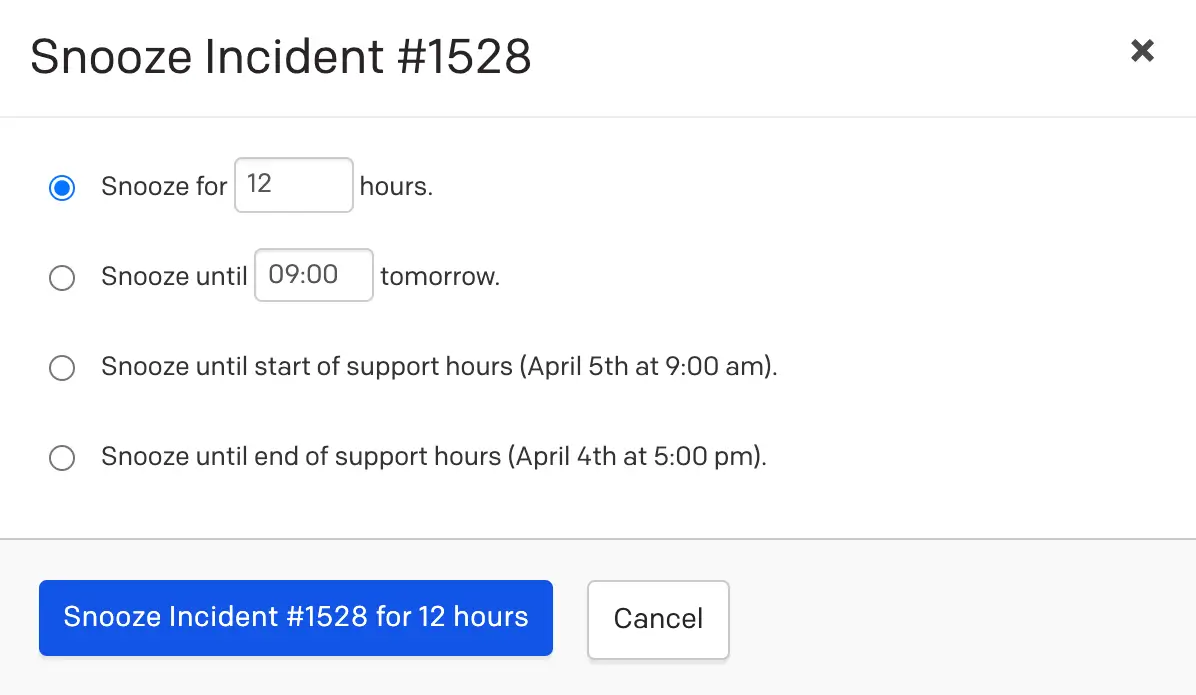 *Snooze an incident* 1. **Acknowledge** the incident. **Snooze** replaces the **Acknowledge** button. 2. Select **Snooze** and choose the length of time: - **1 hour** - **4 hours** - **24 hours** - **for** - **until** 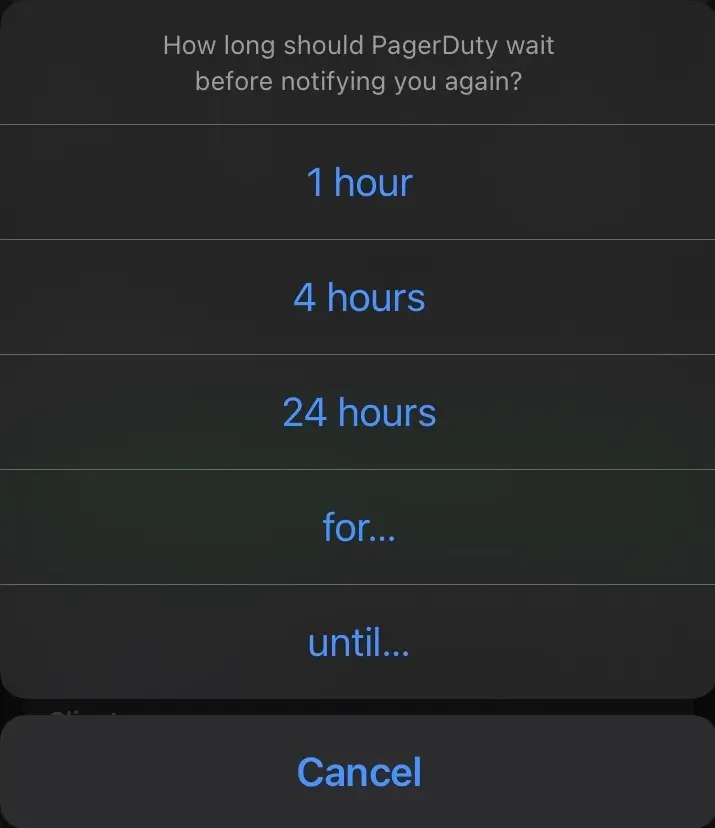 *Snooze an incident in the mobile app* ### Reassign a Snoozed Incident [Reassigning](/incident-management/incidents/reassign-incidents) a snoozed incident cancels the snooze timer. The [acknowledgement timeout](/incident-management/services/configurable-service-settings#acknowledgement-timeout) resets to the triggering service's default value. ### Acknowledge a Snoozed Incident If another user acknowledges a snoozed incident, the incident exits the snoozed state and the [acknowledgement timeout](/incident-management/services/configurable-service-settings#acknowledgement-timeout) resets. ### Auto-Resolution and Snooze You can configure services to automatically resolve an incident after a predetermined period of time — this is called [auto-resolution](/incident-management/services/configurable-service-settings#auto-resolution). If an incident is snoozed past the time when auto-resolution would have resolved it (for example, auto-resolution is set to six hours but the incident is snoozed for 12 hours), the incident remains snoozed and does not automatically resolve. When the incident returns to an acknowledged or triggered state, the auto-resolution timer resets. ## Edit Incident Title You can change an incident's title as it progresses or as the underlying issue becomes clearer. 1. Select an incident's **Title** to navigate to its details page. 2. Click **Edit** to the right of the incident's title. 3. Update the title. 4. Click **Save**. 1. Select an incident to navigate to its details page. 2. With the **Triage** tab selected, tap **Edit Title**. 3. Enter a new title. 4. Tap **Save**. ## Edit Incident Priority Incident priority indicates an incident's relative importance (for example, P-1, P-2). You can adjust an incident's priority if its impact grows or shrinks during the course of response. Refer to [Incident Priority](/incident-management/incidents/incident-priority#prioritize-an-incident) for more information. ## Edit Incident Urgency If it becomes clear during the course of an incident that the [urgency](/incident-management/services/configurable-service-settings#notification-urgency) should change, you can edit it. 1. Select an incident's **Title** to navigate to its details page. 2. Click the **Urgency** dropdown and select **High** or **Low**. 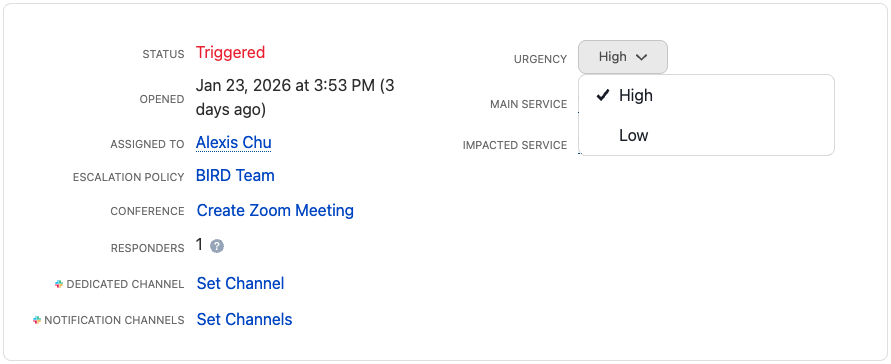 *Edit incident urgency* 1. Select an incident to navigate to its details page. 2. With the **Triage** tab selected, tap **Change to Low/High Urgency**. 3. Confirm your selection by tapping **Change Urgency**. > **Editing Urgency on Unacknowledged Incidents:** If you acknowledge an incident and change its urgency from low to high, it returns to an [unacknowledged](/incident-management/incidents/overview#unacknowledge-an-incident) state. Escalation then continues, notifying responders using their high-urgency notification rules. ## Reassign an Incident's Service Every PagerDuty incident has the following: - **Main Service**: The technical service the incident is assigned to. You can change an incident's main service by reassigning it to a different service. - **Impacted Services**: Services included in an incident's alert grouping. You cannot manually change or reassign these services. 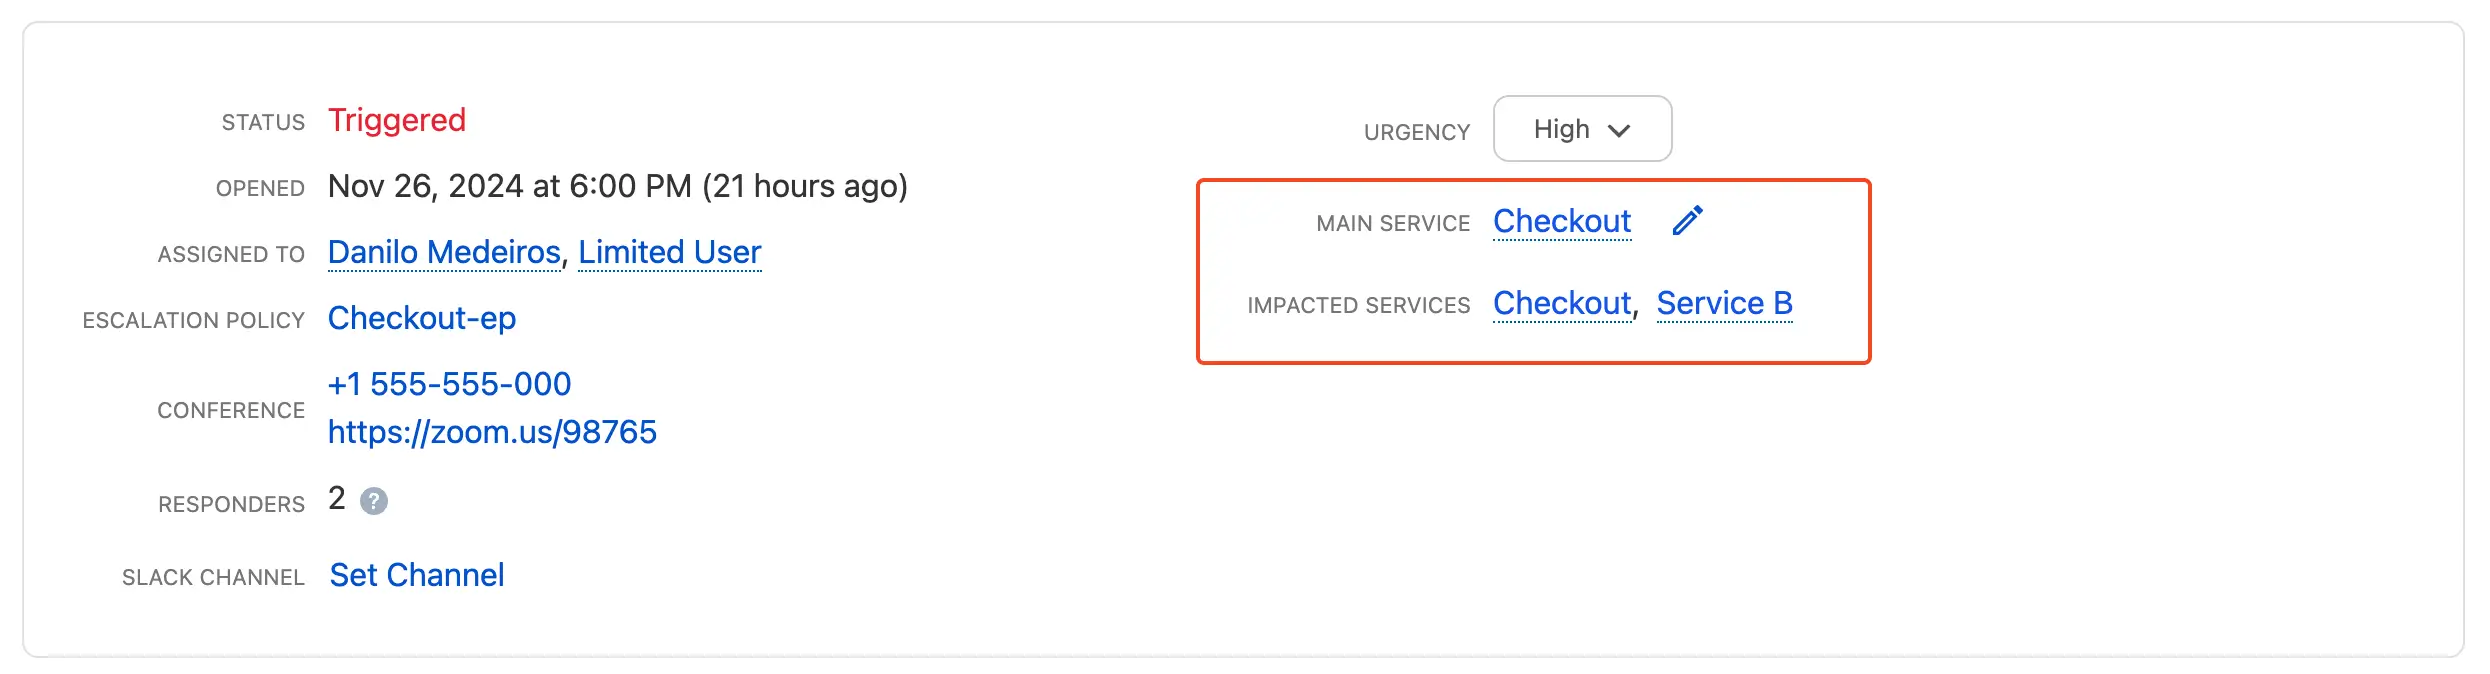 *An incident's main service and impacted services* A service is automatically included as an impacted service when one of the following three actions occurs: - [Merging incidents](#merge-incidents) that were created across multiple services into a single incident. - [Globally grouping alerts](/ai-automation/aiops/noise-reduction/alert-grouping/global-alert-grouping) across multiple services into a single incident. - Reassigning an incident's service. To ensure alert grouping continues after reassignment across services, the alert group (including the alert key or deduplication key) does not change. The original service remains as an impacted service because alerts from the original service continue feeding into the incident. > **Service Reassignment:** Consider the following when assigning an incident to a different service: > > - Acknowledged incidents return to a triggered state. > - If the new service uses a different escalation policy, the current incident's assignee is removed and replaced with the on-call responder from the new service. > - [Incident Roles](/incident-management/incidents/incident-roles), [Incident Tasks](/incident-management/incidents/incident-tasks), [Custom Fields](/incident-management/incidents/custom-fields-on-incidents), and [Incident Workflows](/ai-automation/automation/incident-workflows) are not altered. > - After reassigning the incident, it continues to participate in [Alert Grouping](/ai-automation/aiops/noise-reduction/alert-grouping) based on the originating service's alert grouping settings. > - A record of the reassignment appears in the incident's timeline, including the originating service and the user who made the change. **Incident Details Page** 1. Navigate to the **Incidents** page and click an incident's **title** to view its details. 2. In the **Main Service** field, click .  *Edit icon* 3. In the **Change Service** modal, select a service from the dropdown. 4. Click **Change Service**. **Operations Console** > **Availability:** The [Operations Console](/ai-automation/aiops/operations-console) is available with the [PagerDuty AIOps](/ai-automation/aiops/overview) add-on. To sign up for a trial of PagerDuty AIOps features, read [PagerDuty AIOps Trials](/ai-automation/aiops/overview#pagerduty-aiops-trials). 1. Navigate to **AIOps** → **Operations Console**. 2. Click the **Incident Title** or **Alert** to open the side panel. 3. In the **Main Service** field, click **Edit** to the right of the service's name. 4. In the modal, select a **different service** from the dropdown. 5. Click **Change Service**. 1. Navigate to **Incidents**. 2. Tap an **incident** to view its details page. 3. In the **Triage** tab, scroll left in the incident actions carousel and tap **Change Service**. 4. Tap a **service** to select it from the **My Teams** or **All** tab. A confirmation modal appears. 5. Tap **Confirm** to reassign the incident to the new service. > **Prerequisites:** - The [Service Reassignment](/integrations/servicenow-integration-guide/advanced-servicenow-configuration/sync-service-reassignment-with-servicenow) feature is available with [ServiceNow 8.2](/integrations/servicenow-integration-guide). [Upgrade to the latest version](/integrations/servicenow-integration-guide/servicenow-integration-details#upgrade-to-servicenow-v8) to realize the full feature value. > - To configure Service Reassignment, refer to [Sync Service Reassignment with ServiceNow](/integrations/servicenow-integration-guide/advanced-servicenow-configuration/sync-service-reassignment-with-servicenow). With [ServiceNow 8.2](/integrations/servicenow-integration-guide), the [Service Reassignment](/integrations/servicenow-integration-guide/advanced-servicenow-configuration/sync-service-reassignment-with-servicenow) feature enables bidirectional sync between ServiceNow and PagerDuty when incidents are reassigned to different Configuration Items (CIs) in ServiceNow or to different services in PagerDuty. To reassign in both systems, refer to the following documentation: - **ServiceNow**: [Associate CIs with Incident](https://www.servicenow.com/docs/bundle/yokohama-it-service-management/page/product/incident-management/task/associate-cis-with-incident.html) - **PagerDuty**: [Reassign an Incident's Service](/incident-management/incidents/edit-incidents#reassign-an-incidents-service) > **Service Reassignment Unavailability in Certain Integrations:** Service reassignment is not available for Jira Cloud, Jira Server, or Zendesk integrations. If you reassign a linked PagerDuty incident to a different technical service, the incident remains linked to the issue or ticket, but synchronization rules tied to the original technical service no longer apply. ## Edit Incident Duration > **Incident Status Requirement and Pricing Plan Availability:** You can edit an incident's duration only once it is resolved. This feature is not available while an incident is triggered or acknowledged. > > All pricing plans support editing resolved incident duration. You can view adjusted incident durations in [Insights](/incident-management/analytics/insights) reports by adding the **User Defined Response Effort** column to your table view. When you edit this value, it replaces the original **Response Effort** value and is used for **Total response effort** values in the [Service Performance](/incident-management/analytics/insights/service-performance), [Team](/incident-management/analytics/insights/team), and [Escalation Policy](/incident-management/analytics/insights/escalation-policy-insights) Insights reports. PagerDuty tracks incident duration to calculate [metrics](/incident-management/analytics/insights) such as **Response Effort** and **MTTR** (Mean Time To Resolve). Sometimes, the actual effort spent on an incident differs from the total time it was open. To provide more accurate metrics in your [Intelligent Dashboards](/incident-management/analytics/dashboard), you can adjust the incident duration to reflect the actual response effort required. > **Note:** The **User Defined Effort** metric in the [Incident Activity (Incidents List)](/incident-management/analytics/insights/incident-activity#incidents-list) report reflects adjusted incident duration times. 1. On a resolved incident's details page, click under **Duration**.  *Edit incident duration* 2. In the **Update Incident Times** modal, enter the **Actual effort** time in the following format: `xd xh xm`. 3. Click **Update Incident**. 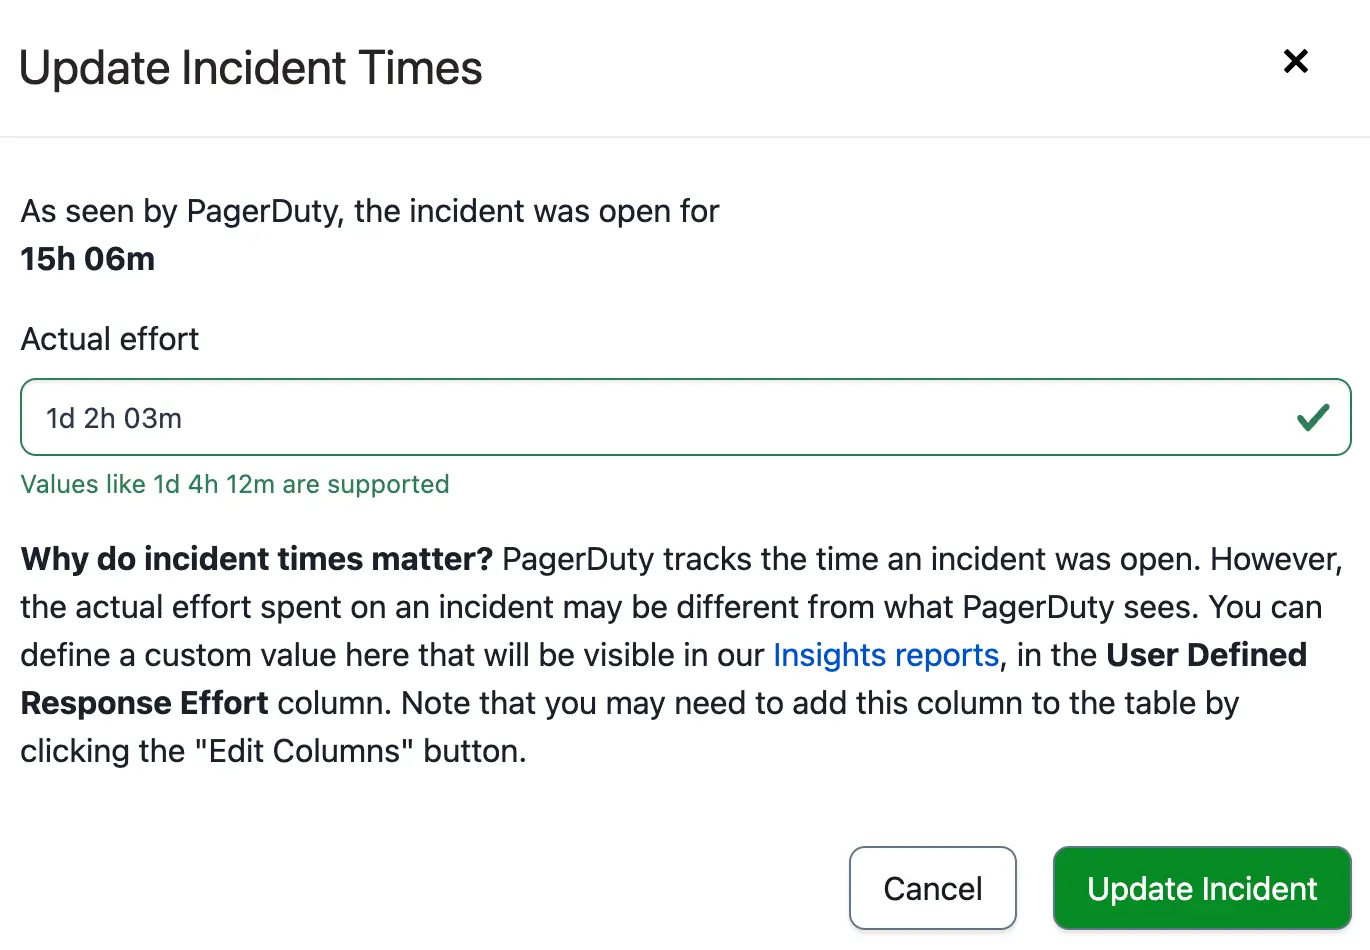 *Update incident times* > **Edited Incident Durations in Insights Reports:** The [Insights](/incident-management/analytics/insights) feature calculates **Response Effort** in the [Service Performance](/incident-management/analytics/insights/service-performance), [Team](/incident-management/analytics/insights/team), and [Escalation Policy](/incident-management/analytics/insights/escalation-policy-insights) reports using the edited incident duration, if it exists. > > The [Responder](/incident-management/analytics/insights/responder) report does not use edited incident durations, as response efforts are calculated based on responder activity rather than incident activity. ## Add a Note to an Incident Incident notes help responders resolve incidents faster by adding relevant information or links. Notes are useful for teams responding to active incidents and add helpful context for later reference. You can add notes to open and resolved incidents. > **Incident Note Limitations:** The following limitations apply to notes on both open and resolved incidents: > > - An incident can have up to 2,000 notes. > - Incident notes are limited to 65,535 single-byte characters (~16,000 characters of [UTF-8](https://en.wikipedia.org/wiki/UTF-8) encoded text). 1. On the **Incidents** page, select an incident's **Title** to navigate to its details page. 2. In the **Notes** section on the right-hand side, enter a note in the text field and click **Add Note**. 3. To edit or delete a note, open the more actions **(…)** menu next to the note. 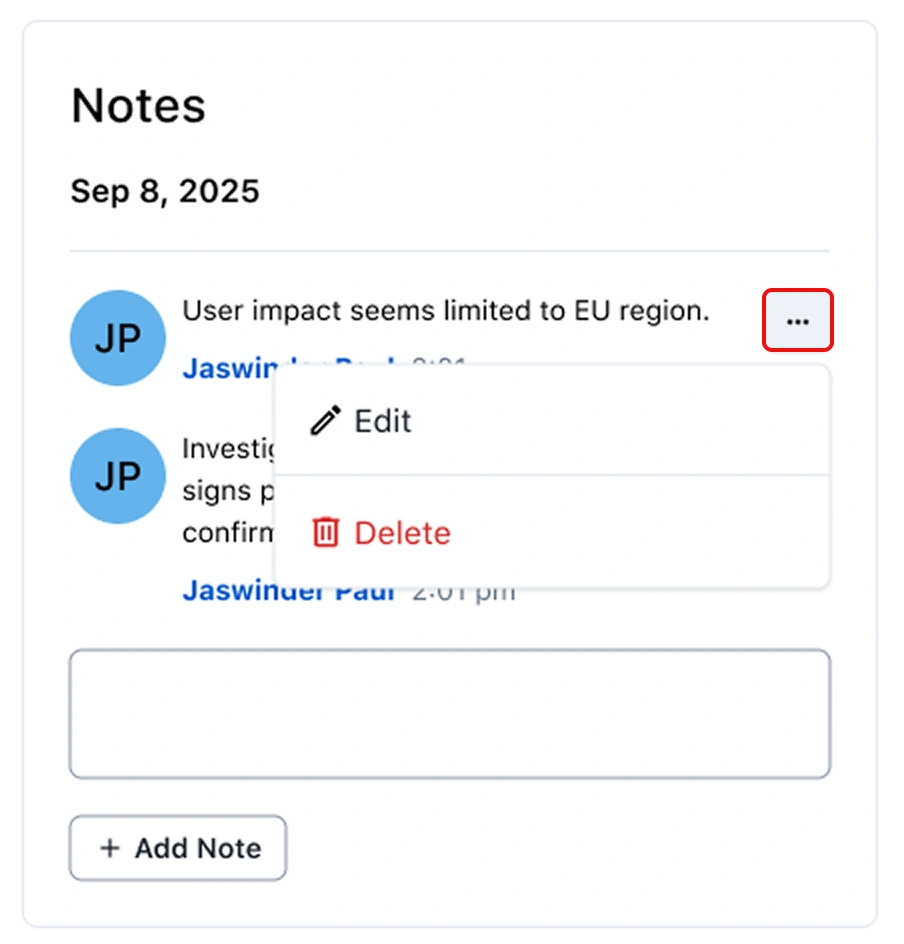 *Edit a note in the web app* 1. Navigate to **Open Incidents** or **Resolved Incidents** → select an incident to navigate to its details screen. 2. On iOS, tap **More** at the bottom of the screen and tap **Add Note**. On Android, under the **Triage** tab, tap **Add Note**. 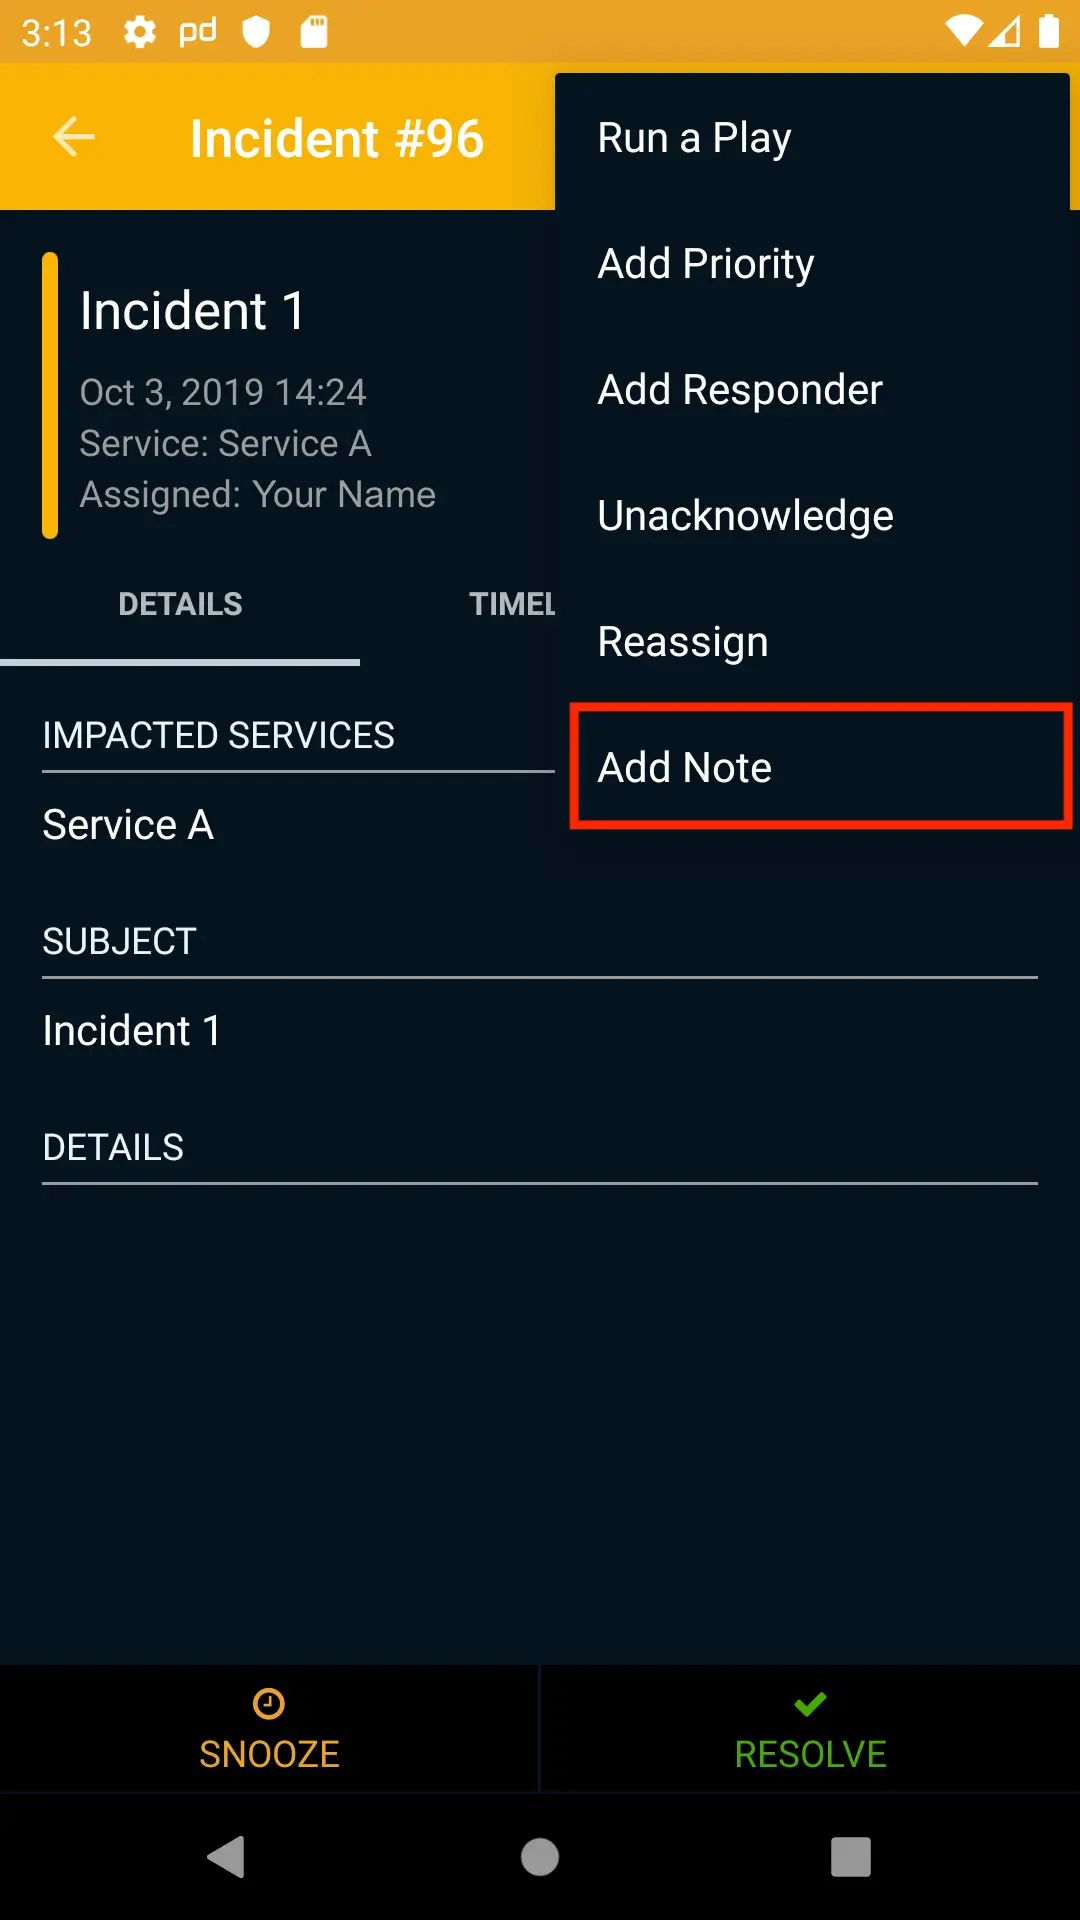 *Add a note in the mobile app* 3. Enter the text for your note and tap **Post Note**. [Incident Workflows](/ai-automation/automation/incident-workflows) allow you to automate your incident response processes. The following workflow actions add incident notes: - [Add Note to an Incident](/workflow-actions/pagerduty-incident-management/add-note-to-an-incident) - [Prompt to Add a Note to the Incident](/workflow-actions/slack/prompt-to-add-a-note-to-the-incident) (Slack) > **Availability:** Adding notes using Event Orchestration is available in [Advanced Event Orchestration](/ai-automation/aiops/event-orchestration/pricing-tiers#advanced-event-orchestration). Contact the [Sales team](https://www.pagerduty.com/contact-us/#contact-sales) to change your pricing tier. You can automate adding notes to incidents as part of [Event Orchestration](/ai-automation/aiops/event-orchestration). While [configuring a Global or Service Orchestration Rule](/ai-automation/aiops/event-orchestration#configure-a-global-or-service-orchestration-rule), select the **Incident Data** tab and enter your desired text in the **Add incident note** section. 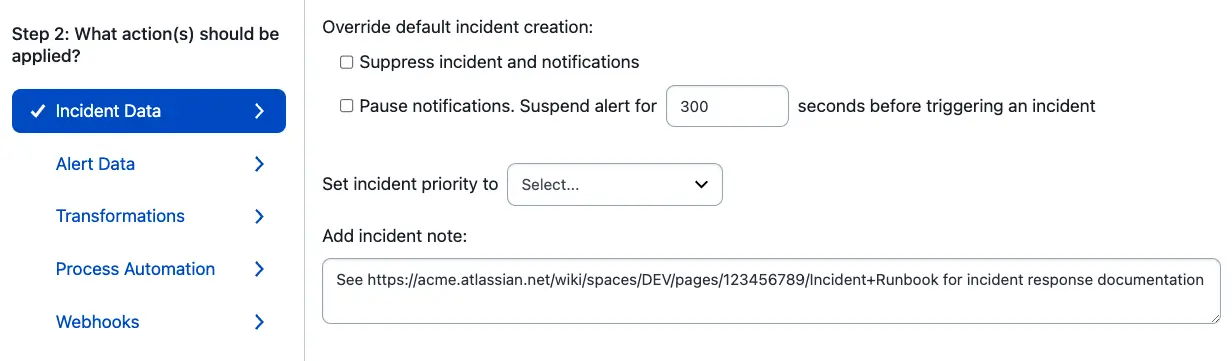 *Add a note using Event Orchestration* Notes added by Event Orchestration appear on an incident's details page under the **Notes** section, with **An Orchestration Event Rule** listed as the note's author.
--- URL: https://docs.pagerduty.com/incident-management/incidents/event-management # Event Management Methods to reduce unwanted alert noise. Event management reduces notification fatigue and helps your team focus on tackling the right issues at the right time. The following methods are effective ways to prevent notification fatigue: - [Deduplicate Alerts](#deduplicate-alerts): Services with Events API integrations deduplicate alerts with matching `dedup_key` values. - [Event Orchestration](#event-orchestration): Automatically deduplicate or suppress alerts. - [Dynamic Notifications](#dynamic-notifications): Notify responders based on an alert's severity. - [Email Management Settings](#email-management-settings): Configure email integrations to only trigger alerts when the conditions you specify are met. ## Deduplicate Alerts For services with an [Events API v2](/developer/events-api-v2-overview) integration, you can group related alerts into a single incident by including a `dedup_key` value, a case-sensitive string that identifies an alert, in the trigger event's body. Subsequent alerts with a matching `dedup_key` value deduplicates into the same incident, and the new event is appended to the incident's **Alerts** log as an additional **Trigger** log entry. If there are no open incidents with this key, PagerDuty will create a new incident. Additionally, if two events having the same `dedup_key` are sent to **two different integrations** within the same service, they will not be deduplicated, and separate incidents will trigger. If the event key field is blank or absent, PagerDuty will automatically create a new incident with a unique key. To learn more about deduplicating incidents, refer to the [Developer Documentation](/developer/send-alert-event#alert-de-duplication). 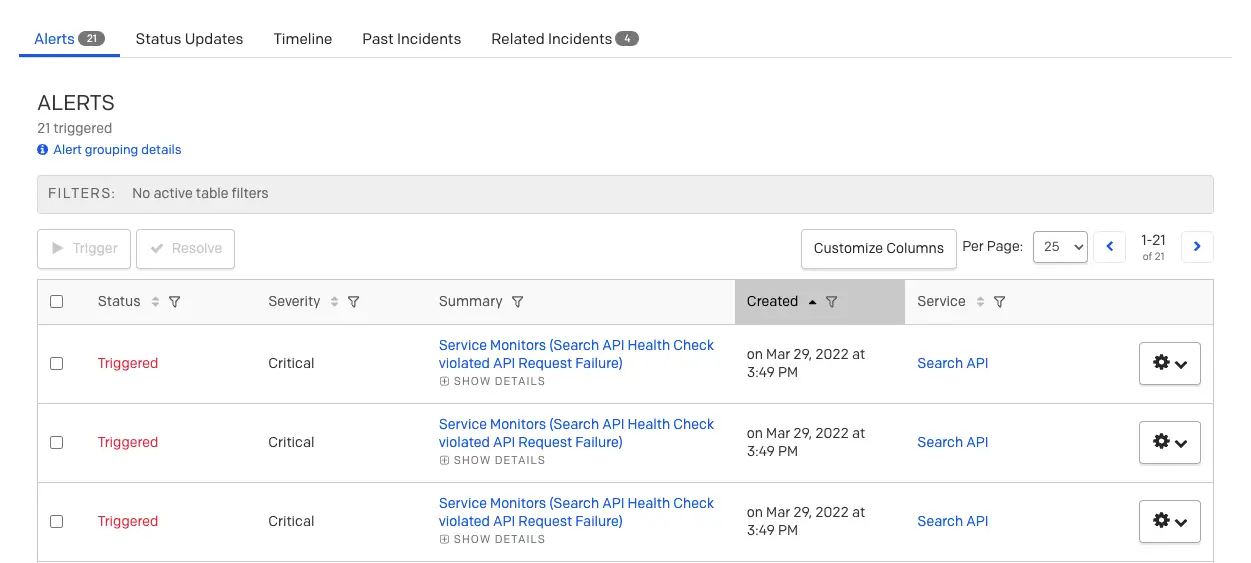 > **Events API v1:** The v1 version of the Events API also supports alert deduplication, but it uses the `incident_key` field. Refer to the [Events API v1](/developer/events-api-v1-overview#incident-de-duplication-and-incident_key) developer documentation for more information. ## Event Orchestration Event Orchestration allows users to define automated actions based on conditions that apply to the information in an inbound event's payload. Event Orchestration can perform actions such as deduplication and automatic alert suppression. Refer to [Event Orchestration](/ai-automation/aiops/event-orchestration) for more information. ### Alert Suppression > **Availability:** Alert Suppression is available on PD Reliability Platform Plus/Ultimate plans. It's also available on accounts with AIOps, or Enterprise for Incident Management and Digital Operations (Legacy) pricing plans. Contact the [Sales team](https://www.pagerduty.com/contact-us/#contact-sales) to upgrade to a plan with this feature. Alert suppression, as opposed to setting an alert's severity, allows you to send events to PagerDuty without triggering any notifications. Suppressed alerts are stored in PagerDuty for forensics, analysis, and context, but do not create incidents. You can view suppressed alerts in the [Alerts Table](/incident-management/incidents/alerts/alerts-table). To suppress an alert when it matches a given set of conditions, select **Suppress** as the [action to take when you are configuring an Event Orchestration](/ai-automation/aiops/event-orchestration#configure-a-global-or-service-orchestration-rule). #### View Suppressed Alerts You can view suppressed alerts in the [Alerts Table](/incident-management/incidents/alerts/alerts-table) under **Incidents** → **Alerts**. Suppressed alerts are filtered out of the incidents dashboard by default, including the incidents page for the service where they were triggered. Moreover, because suppressed events do not trigger incidents, they will not be visible in the mobile app. Below is an example of a suppressed alert. It looks very similar to other alerts, but has **Triggered (Suppressed)** in the **Current Status** field and is not assigned/assignable.  *Alert details* ## Dynamic Notifications Dynamic notifications allow you to generate alerts with a severity field. When an incident is generated from an alert, the alert’s severity field determines how responders are notified, where necessary. Refer to [Dynamic Notifications](/incident-management/incidents/dynamic-notifications) for more information. ## Email Management Settings If you use an [email integration](/integrations/email-integration-guide), you can adjust your incident creation settings to ensure incidents are triggered only when the specified condition is met. The following incident creation settings allow for alert deduplication and reduce the number of notifications responders receive: - **Open a new alert for each new trigger email subject**: Alerts are deduplicated based on trigger emails' subject line. For example, if two emails with the same subject are sent to this service's email address, the first creates a new incident, and the second incident is appended to it. - **Open a new alert only if an open incident does not already exist**: An email sent to the service's email address creates a new incident only if the service has no open incidents; otherwise, the email is appended to the open incident. - **Create and resolve alerts based on custom rules**: Use [regular expressions](/integrations/email-integration-guide/email-management-filters-and-rules#regular-expressions) to parse incident triggers and resolves. To configure these settings, refer to [Email Management: Filters and Rules](/integrations/email-integration-guide/email-management-filters-and-rules). ## FAQ **What is the difference between deduplication and suppression?** - **Deduplication**: Alerts with the same incident key are grouped into the same incident and do not generate multiple notifications. - **Suppression**: Alerts are filtered by the conditions defined in your Event Orchestrations; _those that match your criteria_ are suppressed and stored in PagerDuty to be available for forensics, analysis, and context. A significant difference between suppressed and deduplicated alerts is that suppressed alerts do not create _incidents_. You can view suppressed alerts in the [Alerts table](/incident-management/incidents/alerts/alerts-table). However, you can deduplicate suppressed alerts. **Will suppressed alerts still show up on a service with no one on call?** If you send an event to a service that has no on-call staff, the event does not create an incident. However, if the event is meant to be suppressed, it still goes to the service if no one is on call. --- URL: https://docs.pagerduty.com/incident-management/incidents/incident-priority # Incident Priority Establish an incident classification scheme and assign incident priorities for effective triage Incident priority allows you to classify incidents by priority levels. Just as alerts can have different [severity](/incident-management/incidents/dynamic-notifications#eventalert-severity-levels) levels and notifications can have different [urgency](/incident-management/services/configurable-service-settings#notification-urgency) levels, incidents can be classified into different priority levels. Priority labels are customized on a per-account basis, so you can configure the priority scheme in PagerDuty to match the scheme you may already be using in other tools. - [Establish an Incident Classification Scheme](#establish-an-incident-classification-scheme) - [Configure Incident Priority](#configure-incident-priority) - [Prioritize an Incident](#prioritize-an-incident) - [Disable Incident Priority](#disable-incident-priority) ## Establish an Incident Classification Scheme Before [configuring incident priority](#configure-incident-priority), establish an incident classification scheme. Your incident classification scheme establishes a common language and criteria for communicating about incident levels and response elements. This information is ideally shared organization-wide. Remember that this scheme is not just for technical responders and support staff; other parts of your organization may need to be aware of incidents and their assessed impact, and occasionally participate in incident response, as well. The following are the steps to establish an incident classification scheme: 1. **List the incident classification levels**: This is usually P1 through P5 (for priority), or SEV-1 through SEV-5 (for severity). Typically, the lower the number, the higher its impact (i.e., P1 is more important than P5). 2. **Define what each level means**: Describe the impact and characteristics that apply to each classification level. These guidelines must be clear and objective enough that responders can accurately assess an open incident and assign it to a level. That said, incidents may be upgraded or downgraded as the situation evolves. 3. **Define the expected response**: For each classification level, identify the expected scope and response urgency. Some organizations also have formal or informal service-level agreements at each level. For more information and examples, refer to [Severity Levels](/ops-guides/incident-response-guide/severity-levels) in the [Incident Response Guide](/ops-guides/incident-response-guide). If your organization does not have an incident classification scheme in place, defining a limited number of classification levels is essential for effective triage and major incident response processes. If, on the other hand, you have more than five classification levels, think critically about how many levels would benefit your organization in practice. The more levels you have, the more complex and time-consuming triage can become. > **Tip:** The Incident Priority feature does not allow any of the five levels to be blank. If your organization uses fewer than five classification levels, you can enter `---` for any unused levels. ## Configure Incident Priority After establishing your [incident classification scheme](#establish-an-incident-classification-scheme), the next step is to configure the levels in PagerDuty. > **Required User Permissions:** The Account Owner and Admins/Global Admins can configure and edit Incident Priority levels. To configure this feature, in the PagerDuty web app: 1. Navigate to **User Icon** → **Account Settings** → **Incident Settings** tab. 2. Toggle **Enable incident priority levels** to the **on** position. 3. Under **Incident Priority**, you can classify incidents with five different priority levels. Customize your levels with the following: | Field | More info | | :----------------------- | :--------------------------------------------------------------------------------------------------------------------------------------------------------------------------------------------------------------------------------------------------------------------------------------------------------------------------------------------------------- | | Priority Level | This is typically P1-P5 or SEV-1-SEV-5. | | Color | Color labels draw attention to the most important incidents in a dashboard or other view. Use distinctive colors for the levels corresponding to major incidents to enhance visibility of the most important incidents. For example, at PagerDuty, we use red and orange for our two highest levels, and blue and gray for lower-priority incident levels. | | Description (_optional_) | Describe the incident impact and characteristics that apply to each classification level. These guidelines must be clear and objective enough that responders can accurately assess an open incident and assign it exactly one level. | 3. Click **Save**.  *Configure incident priority* Priority is displayed on the **Incidents** page and on an incident's details page in both the web and mobile apps. ## Prioritize an Incident Prioritizing incidents helps drive decisions around the response process and provides valuable context for others. When looking at an incident, the priority provides an immediate, clear indication of the prior assessment that hass been performed. You can set the Incident priority at creation or after the incident has been triggered. The following is an incident with a priority level set, **SEV-1**:  *Prioritize an incident during triage* In addition, priority is clearly displayed on the incident dashboard, making it easy to see when critical issues are active. You can sort incidents by priority on this page, so that whether looking at incidents for a single team or across your whole organization, you can instantly see critical issues:  *View incident priority* You can set incident priority in multiple ways: **Set Incident Priority Using the Web App** ### At Incident Creation 1. Navigate to the **Incidents** page. 2. Click **New Incident**. 3. Select your desired **priority level** from the dropdown.  *Set priority at incident creation* 4. Enter the remaining incident details. 5. Click **Create Incident**. ### To an Existing Incident 1. Find the incident you want to prioritize and select its **Title** to navigate to its details page. 2. Click the **Priority** dropdown and select the desired **priority level**.  **Set Incident Priority Using the Mobile App** ### At Incident Creation 1. Navigate to the **Open Incidents** screen. 2. Tap in the top-right corner and select **New Incident...**.  *Priority in the mobile app* 3. Tap **Priority** and select the **priority level** from the list.  *Select priority* 4. Enter any remaining incident details. 5. Tap **Create**. The incident will then display a label displaying its priority level:  *View priority* ### To an Existing Incident 1. Find the incident that you want to prioritize. 2. Tap the incident’s **name** to navigate to its details screen. 3. With the **Triage** tab selected, tap **Add/Edit Priority**. 4. Select a **priority level**. 5. Tap **Confirm** in the confirmation dialog box. **Set Incident Priority via the REST API** In addition to the features available in the PagerDuty [web app](#in-the-web-app) and [mobile app](#in-the-mobile-app), automated systems can also interact with incident priority. You can use the [Incident REST API](/developer/api/reference/rest/incidents/create-incident) to specify an incident’s priority when it is created, and all relevant priority details are included when the API returns an incident object. Refer to the following developer documentation for more information about working with incident priority: - [List priorities](/developer/api/reference/rest/priorities/list-priorities) - [Create an incident (with priority)](/developer/api/reference/rest/incidents/create-incident). Additionally, incident webhooks include information about an incident’s priority. Refer to [Webhooks Overview](/developer/webhooks-overview) for more information. > **Events API:** You cannot set priority from the Events API currently. **Set Incident Priority via Event Orchestration** [Event Orchestration](/ai-automation/aiops/event-orchestration) supports adding priority when an incident is created. Refer to [Incident Actions](/ai-automation/aiops/event-orchestration#incident-data) for more information. ## Disable Incident Priority As an Account Owner, you can disable incident priority in the web app using the following steps: 1. Navigate to **User Icon** → **Account Settings** → **Incident Settings** tab. 2. Toggle **Enable Incident Priority Levels** to the **off** position. Once disabled, the **Priority** column on your Incidents page no longer appears. > **Retained Configuration Settings:** After disabling incident priority, PagerDuty retains your configuration settings. If you choose to re-enable incident priority later, toggle **Enable Incident Priority Levels** to the **on** position — your historical settings will be preserved, so you will not need to reconfigure them from scratch. --- URL: https://docs.pagerduty.com/incident-management/incidents/incident-roles # Incident Roles Define responder roles and responsibilities for efficient incident management. Incident roles allow you to customize a set of roles that you can assign during an incident. An established set of incident roles clearly defines incident responsibilities, promotes accountability, and enables efficient response.  *_Incident Roles in Responders list_* > **Availability by Plan:** | Role Type | Professional | Business | Enterprise | PD Reliability Platform Essential | PD Reliability Platform Plus/Ultimate | > | :---------------------------------------------------------- | :----------------- | :----------------- | :------------------------------------ | :--------------------------------- | :-------------------------------------- | > | **Predefined Roles** (Incident Commander, Customer Liaison) | ✓ | ✓ | ✓ | ✓ | ✓ | > | **Custom Roles** | — | one | 10 (for a total of 12 incident roles) | one | 10 (for a total of 12 incident roles) | > > Contact the Sales Team to upgrade or expand your incident roles feature set. > **Incident Response Guide:** For more information on how teams at PagerDuty use roles in their incident management process, refer to the [Incident Response Guide](/ops-guides/incident-response-guide/different-roles). ## Default Incident Roles There are two default incident roles: - Incident Commander - Customer Liaison Your account plan determines whether these roles are available. You can enable these roles to use them on incidents. For detailed configuration steps, see [Enable or Disable Incident Roles](#enable-or-disable-incident-roles).  *_Incident roles_* ## Create Incident Roles > **Required User Permissions:** Global administrators and the account owner can create, edit, and delete account-wide incident roles. > **Note:** Your pricing plan determines whether you can create roles. See the [Availability by Plan](#availability-by-plan) table. 1. Navigate to **Incidents** → **Incident Roles**. 2. Click **New Role**. 3. On the **New Role** screen, complete the following fields and click **Create Role**: | Field | Description | | :------------------------ | :--------------------------------------------------------------------------------------------------------------------------------------------------------------------------- | | **Display Name** | A role name to display on incidents. | | **Role Name** | A unique name for API use. This name can contain only lowercase letters, numbers, and underscores.
**Note**: You cannot change the Role Name after role creation. | | **Description** | Help responders understand the scope of the role and how they should use it. | | **Disable Incident Role** | Select **Enable** or **Disable**. Disabling a role removes it from future incidents. Existing incident roles and assignees remain unaffected. | 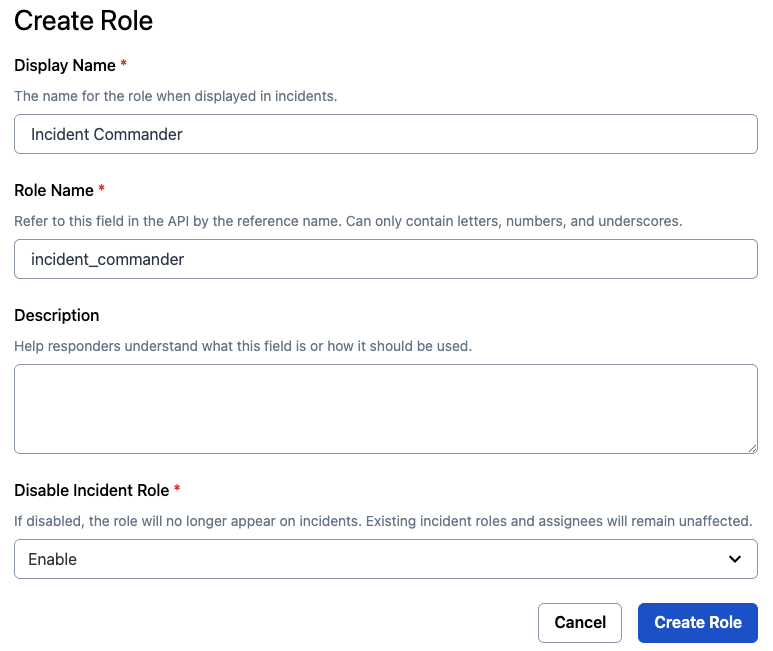 *Create role modal* ### Edit Incident Roles 1. Navigate to **Incidents** → **Incident Roles**. 2. Click the **role** you want to edit. 3. On the edit screen, modify the details using the following fields and click **Save Changes**: | Field | Description | | :------------------------ | :---------------------------------------------------------------------------------------------------------------------------------------------------------------------------- | | **Display Name** | Edit the role name. | | **Description** | Edit the description to help responders understand the scope of the role and how they should use it. | | **Disable Incident Role** | Select **Enable** or **Disable** depending on your preference. If disabled, the role no longer appears on incidents. Existing incident roles and assignees remain unaffected. | 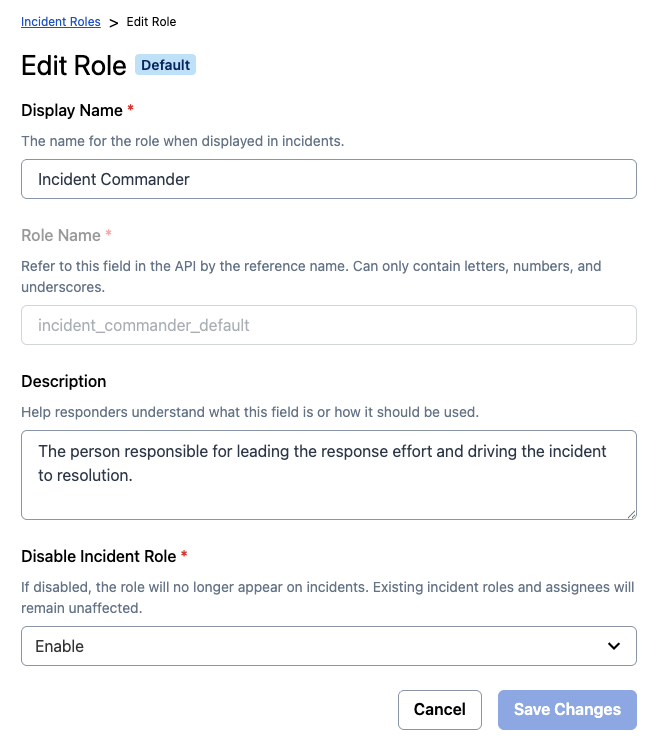 *_Edit incident roles_* ### Enable or Disable Incident Roles To enable or disable an existing incident role: 1. Navigate to **Incidents** → **Incident Roles**. 2. In the **Ellipsis Icon ()** overflow menu next to the role you want to disable or enable, click **Enable** or **Disable**. ### Delete Incident Roles > **Deletion Warning:** You cannot recover an incident role after deleting it. 1. Navigate to **Incidents** → **Incident Roles**. 2. In the **Ellipsis Icon ()** overflow menu next to the role you want to delete, click **Delete**. 3. In the confirmation modal, type **Delete** in the text box and click **Delete**. ## Assign an Incident Role Once you create an incident role, you can assign the role to an incident responder. > **Behavior When You Assign Roles to Non-Responders:** If you assign a role to a user who is not already a responder on the incident, this action adds them as a responder. For more information on managing responders, see [Add Responders to an Incident](/incident-management/incidents/add-responders#add-responders-to-an-incident). The responder request includes the role assigned to the user. You can assign an incident role in multiple ways: **Assign an Incident Role in the Web App** You can assign incident roles to individual users or to escalation policies. When you assign a role to an escalation policy, it sends a responder invite to the on-call responder. Once accepted, PagerDuty assigns them to the role. If they do not accept the responder request before the escalation timeout, PagerDuty escalates and notifies the next level of the escalation policy. > **Requirements:** - A user who can take action on the incident (Responder permissions or higher) can assign incident roles in the web app. > - You cannot assign roles to stakeholders. Follow these steps to assign an incident role: 1. When viewing an incident, in the **Responders** list on the right, click **Assign Roles**. 2. In the **Assign Roles** modal, complete the following field and click **Save**: | Field | Value | | :---------------------------- | :--------------------------------------------------------------------------------------------------------------------------------- | | **\[Incident Role Dropdown]** | Click the dropdown for your preferred role, select the **Escalation Policies** or **Users** tab, and select the desired responder. |  *Assign roles modal* _Assign or edit roles_  *_Responder request with Incident Role_* **Assign an Incident Role in Slack** You can assign incident roles from a PagerDuty incident notification in Slack. > **Requirements:** - You must configure the integration via the [Slack Integration Guide](/integrations/slack-integration-guide) to assign incident roles in Slack. > - You must have Responder permissions or higher to assign incident roles in Slack. Follow these steps to assign an incident role in Slack: 1. In a Slack workspace integrated via the [Slack Integration Guide](/integrations/slack-integration-guide), navigate to a PagerDuty incident notification. 2. Click **More Actions** → **Assign Roles**. 3. In the **Assign Roles** dialog, click the **Select** dropdown, select a **user**, and click **Save**.  *Manage incident roles modal in Slack* **Assign an Incident Role in Microsoft Teams** You can assign an incident role from a PagerDuty incident notification in Microsoft Teams. > **Requirements:** - You must configure the integration via the [Microsoft Teams Integration Guide](/integrations/microsoft-teams) to assign incident roles in Teams. > - You must have Responder permissions or higher to assign incident roles in Teams. Follow these steps to assign an incident role: 1. In a Microsoft Teams chat integrated via the [Microsoft Teams Integration Guide](/integrations/microsoft-teams), navigate to a PagerDuty incident notification. 2. Click the **Ellipsis Icon ()** overflow menu and select **Assign Roles**. 3. In the **Assign Roles** dialog, click the **Type to search for a user** dropdown, select a **user**, and click **Save**.  *_Select team roles in MS Teams_* **Assign an Incident Role With Incident Workflows** After you configure your roles, you can assign or unassign them using incident workflows. For more details, see [Create Incident Roles](#create-incident-roles) and [Incident Workflows](/ai-automation/automation/incident-workflows). This feature allows you to automate role assignments based on predefined workflow conditions, reducing manual work in your incident management processes. To learn more about automated actions, see [Assign a Role via Incident Workflows](/workflow-actions/roles/assign-a-role-eim) and [Incident Workflows Roles](/ai-automation/automation/incident-workflows#assign-an-incident-role-to-the-on-call-user). ## FAQ **Can I assign the same incident role to multiple responders?** No. You can only assign incident roles to a single responder at any given time. This promotes accountability during response by eliminating shared ownership. **Can I assign multiple roles to one user?** Yes, you can assign multiple roles to a single user. **Where are incident roles available in PagerDuty?** Incident roles are available in the web app, Slack, Microsoft Teams, and [incident workflows](/workflow-actions/pagerduty-incident-management/assign-incident-roles-to-an-escalation-policy). --- URL: https://docs.pagerduty.com/incident-management/incidents/incident-tasks # Incident Tasks Pre-define incident tasks or swiftly create new ones. Enhance your incident management process with Incident Tasks by assigning and tracking ad-hoc tasks directly from [Slack](/integrations/slack-integration-guide). Teams can rapidly create tasks ad hoc as an incident evolves, or they can predefine tasks through [Incident Workflows](/ai-automation/automation/incident-workflows). > **Availability:** Incident Tasks are included with PD Reliability Platform Plus/Ultimate plans. They're also included with the Enterprise Incident Management package. Contact the [Sales Team](https://www.pagerduty.com/contact-us/#contact-sales) to upgrade to a plan with Incident Tasks. > **Required User Permissions:** Incident Tasks' permissions match the permissions of the associated incident. You can assign tasks to users who have been added as a [Responder](/incident-management/incidents/add-responders) or are assigned to the incident. > > Users with a Responder role or higher can **create** and **update** Incident Tasks. ## Create Incident Tasks There are two ways to create Incident Tasks: - [Create an Ad-Hoc Task in Slack or Microsoft Teams](#create-an-ad-hoc-task-in-slack-or-microsoft-teams) - [Create a Task in Incident Workflows](#create-a-task-in-incident-workflows) ### Create an Ad-Hoc Task in Slack or Microsoft Teams Ad-hoc tasks provide a quick, easy way for responders to capture and assign work while responding to an incident. **Create Tasks in Slack** As a prerequisite, ensure you have configured the [Slack integration](/integrations/slack-integration-guide). To create an ad-hoc task in Slack: 1. On an incident's card, click the **More actions** dropdown and select **Add Task**. 2. Enter the following information: - **Task Name** - **Task Description** _(optional)_ - **Status**: Select an appropriate option from the drop-down list. - **Assign to**: You can leave it **Unassigned** or select a user associated with the incident. The list of eligible assignees includes the user(s) currently assigned to the incident and any [Responders](/incident-management/incidents/add-responders) added to the incident. > **Slack Integration:** Refer to the [Slack Integration Guide](/integrations/slack-integration-guide) for more information about configuring the integration with Slack. **Create Tasks in Microsoft Teams** As a prerequisite, ensure you have configured the [Microsoft Teams integration](/integrations/microsoft-teams). To create an ad-hoc task in Microsoft Teams: 1. On an incident's card, click and select **Add Task**. 2. Enter the following information: - **Task Name** - **Task Description** _(optional)_ - **Status**: Select an appropriate option from the drop-down list. - **Assign to**: You can leave it **Unassigned** or search for any PagerDuty user you want to assign this task to. ### Create a Task in Incident Workflows Pre-defined tasks in [Incident Workflows](/ai-automation/automation/incident-workflows) allow responders to add structure to response processes and capture the steps required for specific incident types. For example, you can add a task to ensure an incident's [priority](/incident-management/incidents/incident-priority) gets set. In the PagerDuty web app: 1. Navigate to **Automation** → **Incident Workflows**. 2. Select an existing workflow from the list, _or_ click **New Workflow**, enter the required information, and click **Create**. 3. In the **Actions** section, click **Add Action**. 4. Type **Create a Task** and select the action. 5. Enter a **Task name** and optionally update the **Status**, **Assignee**, and **Details**. 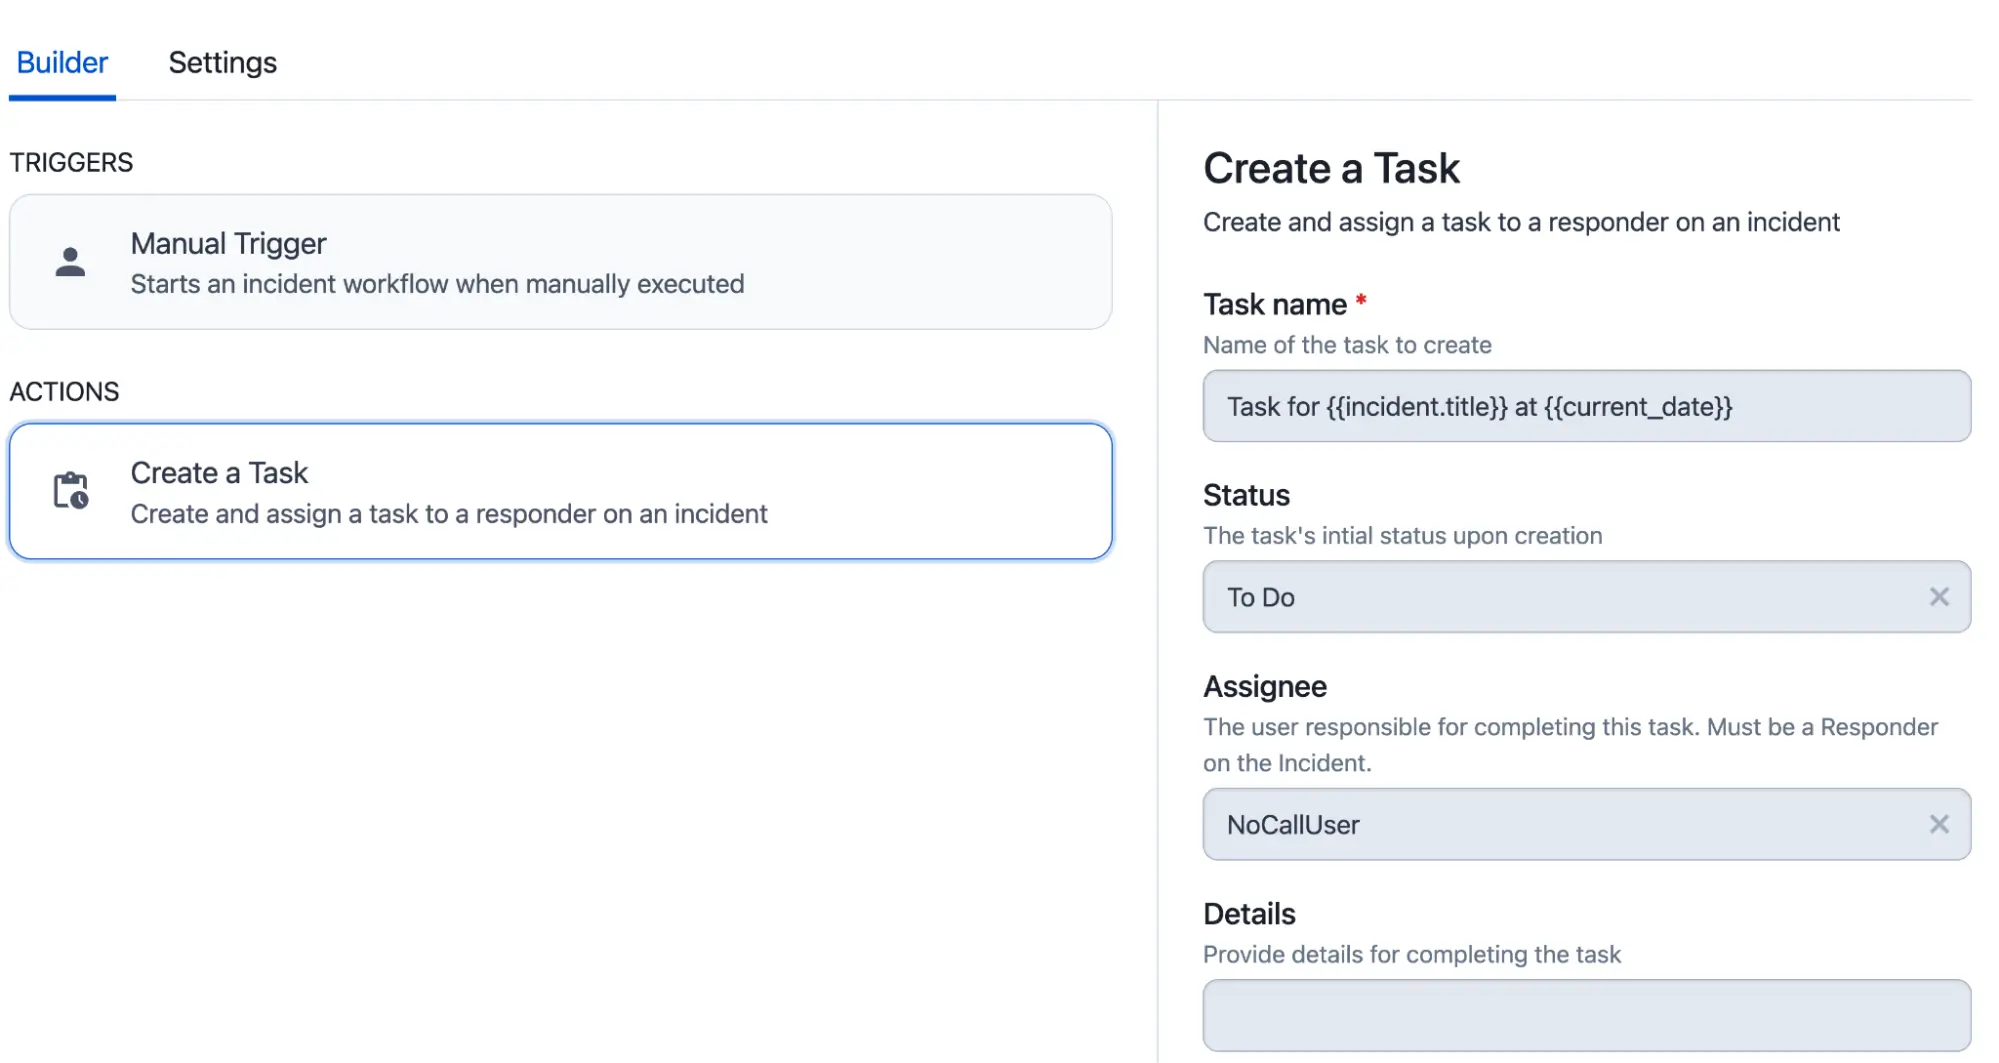 5. Click **Add Action**. 6. Click **Save**. 7. Click **Publish Changes** to commit the changes. #### Additional Incident Task Actions In addition to [creating Incident Tasks in Incident Workflows](#create-a-task-in-incident-workflows), you can also use Incident Workflows to automate tasks' other properties. While configuring an Incident Workflow, the following actions, in addition to **Create a Task**, are available: - **Update Task Assignee** - **Update Task Details** - **Update Task Name** - **Update Task Status** To update an Incident Task, enter its **Task ID**. Refer to [Action-Specific Field References](/ai-automation/automation/incident-workflows#action-specific-field-references) for more information about how to retrieve a value from an Incident Workflow action. ## Using Incident Tasks After [creating an Incident Task](#create-incident-tasks), you can view, edit, and update them in Slack: 1. On the incident card, click the **More actions** dropdown and select **View Tasks**. 2. Use the **Filter by** dropdown to display your desired task(s). 3. Make your required changes to the assignee and/or task status. 4. Click **Close**. ## FAQ **How many tasks can an incident have?** You can create up to 200 tasks for an incident. **Are task assignees notified when a task is created, assigned, or updated?** Task assignments will appear in the associated Slack channel. Users will not receive individual notifications. **Are Incident Tasks available in other parts of PagerDuty besides Slack and Incident Workflows?** There are plans to bring Incident Tasks to other parts of the web app later in the year. --- URL: https://docs.pagerduty.com/incident-management/incidents/incident-types # Incident Types Streamline and customize incident management with distinct Incident Types Within an organization, there are often many different types of incidents that require a unique response process. For example, a major incident typically follows a different process than a security incident or compliance incident. The Incident Types feature allows organizations to create custom types that determine the set of [Custom Fields](/incident-management/incidents/custom-fields-on-incidents) available on an incident, tailored to their diverse response processes. By categorizing incidents, teams can reduce confusion and ensure that they engage the right processes and responders for each incident type, leading to quicker resolution and minimized business impact. > **Availability:** | Pricing Plan | Base and Major Incident Types | Security Incident Type | Custom Incident Types | > | :------------------------- | :---------------------------- | :--------------------- | :------------------------------------- | > | **Legacy Plans** | ✓ | — | — | > | **Free** (current) | ✓ | ✓ | — | > | **Professional** (current) | ✓ | ✓ | — | > | **Business** (current) | ✓ | ✓ | Three | > | **Enterprise** (current) | ✓ | ✓ | 100 with up to three levels of nesting | > | **PD Reliability Platform Essential** | ✓ | ✓ | Three | > | **PD Reliability Platform Plus/Ultimate** | ✓ | ✓ | 100 with up to three levels of nesting | > > Contact the [Sales Team](https://www.pagerduty.com/contact-us/#contact-sales) to expand your account's Incident Types functionality. > **Required User Permissions:** - All users, except for Limited Stakeholders, can **view** Incident Types. > - Any user with permission to create an incident can **select** an Incident Type at incident creation. > - Users with Responder permissions on an incident can **update** its type. > - Admins and the Account Owner can **create** and **edit** Incident Types. > - Admins and the Account Owner can **set** the Default Incident Type. ## Incident Type Foundational Concepts ### Inheritance Incident Types use an inheritance model. When you add a new custom field to a type, that field is also added to all of the type's children. This model provides the flexibility to add custom fields to all incidents in an account, or to concentrate them to a specific incident type. While creating a new incident type, you will specify a **Parent Type**, which defines where in the hierarchy the new type will live. You can have at most three levels of inheritance on your account. 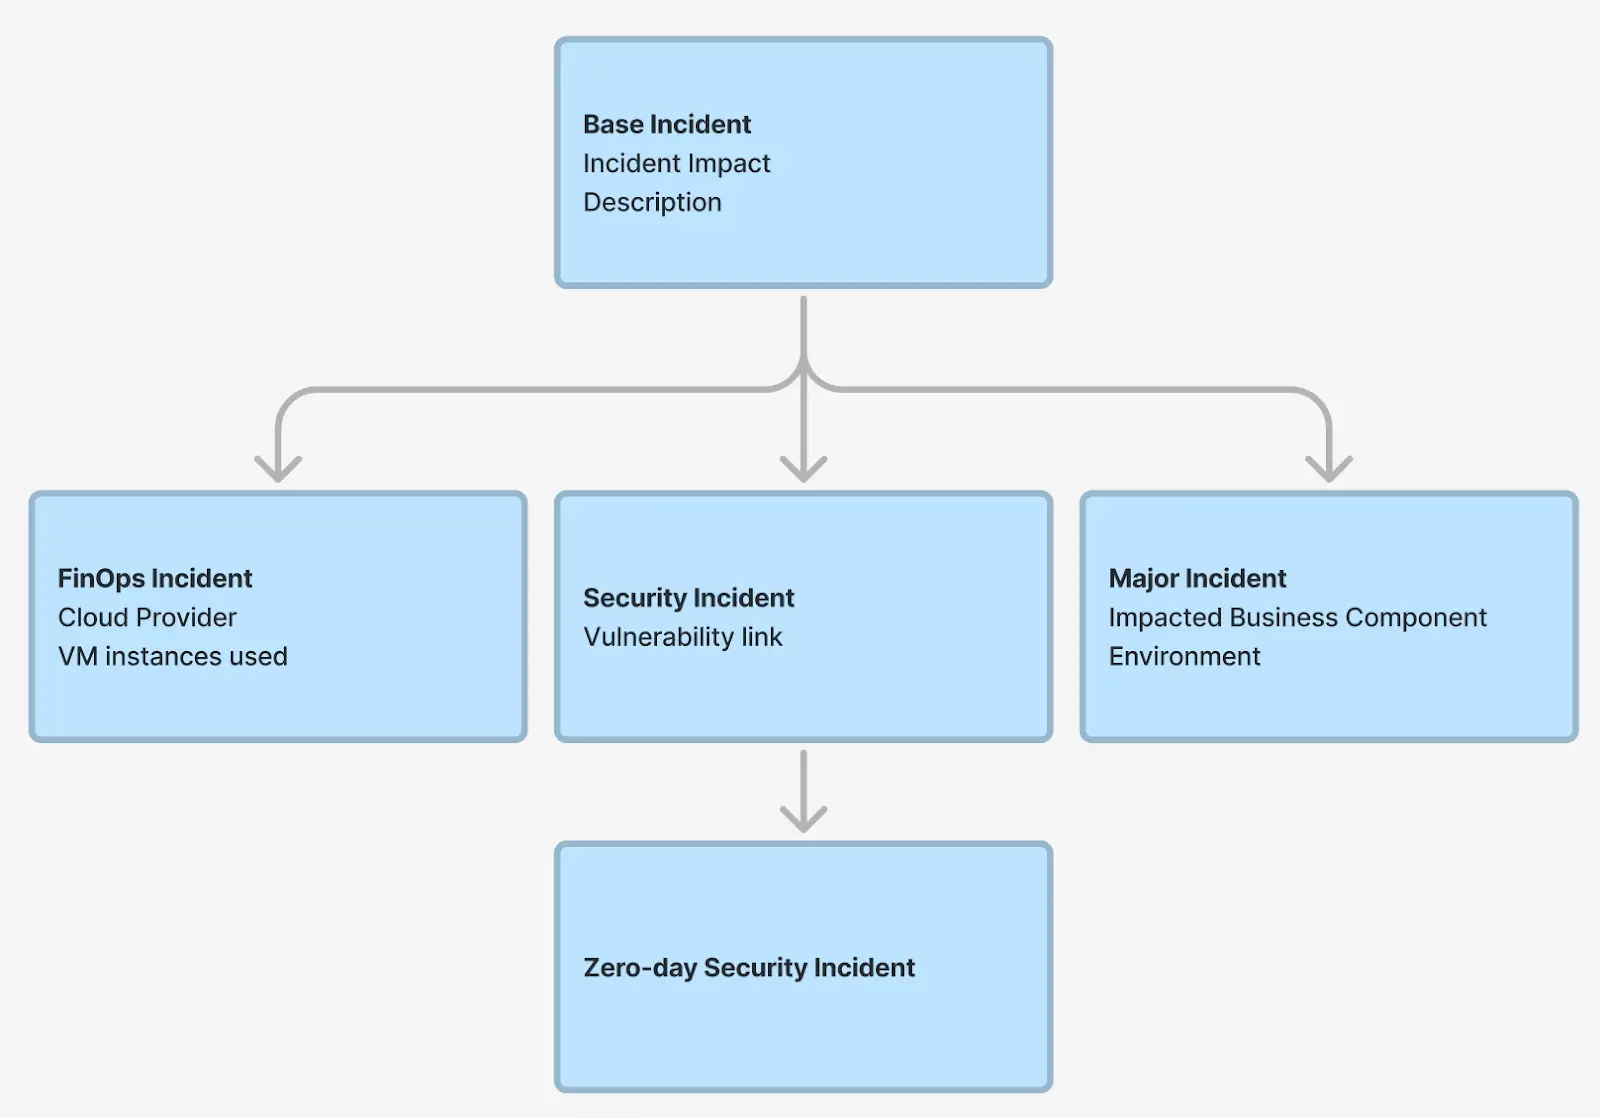 Click the **Display Inherited Fields** checkbox while [configuring an Incident Type](#configure-incident-types) to view which fields are inherited:  ### Out-of-the-Box Incident Types All pricing plans, including legacy plans, have access to the Base Incident and Major Incident default types. In addition, customers on current Free, Professional, Business, and Enterprise pricing plans have access to Security Incidents, a third default type. These are described below: - **Base Incident** - By default, all incidents created are a “Base Incident”. The Base Incident is also always at the top of the inheritance hierarchy. You can use the Base Incident to add fields that should apply globally to all incidents within PagerDuty. To have new incidents automatically use a specific type instead of Base Incident, refer to [Set the Default Incident Type](#set-the-default-incident-type). - **Major Incident** - The Major Incident is used for configuring your major incident response process. You can use this default incident type for tasks such as triggering a major incident workflow, creating custom fields specific to major incidents, and more. - **Security Incident** - An incident caused by a potential security threat that requires specialized investigation and response. Typically, these default incident types are configured to work out of the box. However, some customers may need to enable them to start creating incidents of that type. Refer to [Enable an Incident Type](#disable-or-enable-incident-types) for more information. ## Configure Incident Types ### Create an Incident Type To create an Incident Type in the PagerDuty web app: 1. Navigate to **Incidents** → **Incident Types**. 2. In the left pane, click **New Incident Type**. 3. Enter the following information: | Field | Instructions | | --- | --- | | **Parent Type** | Select an Incident Type to inherit from. | | **Display Name** | Enter a user-friendly name to display for this incident type — for example, "Security Incident", "Legal Incident", or "Billing Incident". | | **API Name** | Enter a unique name for use with the REST API. This field can only contain lowercase letters, numbers, and underscores. You cannot change this value after initial creation. | | **Description** | Enter a description for the Incident Type. | | **Enable Type** | Select **Enable** or **Disable**. | 4. Click **Create**. ### Add Custom Fields After creating an Incident Type, you can add custom fields to that type. Refer to the [Configure Custom Fields](/incident-management/incidents/custom-fields-on-incidents#configure-custom-fields) article for more information. ### Edit Incident Types 1. Navigate to **Incidents** → **Incident Types**. 2. Select your preferred Incident Type. 3. Make your desired changes (e.g., [Add Custom Fields](#add-custom-fields) _or_ adjust **Settings**). 4. Click **Save**. ### Set the Default Incident Type If your team marks confirmed or triaged incidents with a specific Incident Type — often to trigger [Incident Workflows](/ai-automation/automation/incident-workflows) such as creating a Jira issue or opening a dedicated Slack channel — you can set that type as the account default. Responders then do not have to change the Incident Type by hand on every declaration for those workflows to run. When a Default Incident Type is set, the **Incident Type** field is pre-filled with that type wherever an incident is declared: the web app, mobile app, and Slack. The responder can still change the type before creating the incident. Setting a default does not lock the Incident Type, and it does not change the type of any existing incidents. If no default is set, new incidents are created as a Base Incident, as they are today. Only Admins and the Account Owner can set the Default Incident Type. To set the Default Incident Type: 1. Navigate to **User Icon** → **Account Settings** → **Incident Settings**. 2. Under **Default Incident**, select the default Incident Type from the dropdown. 3. Click **Save**. ### Disable or Enable Incident Types > **Delete Incident Types:** Deleting Incident Types is not supported. You can disable an incident type to make it unavailable to responders when selecting a type on an incident. Perform the following steps to disable or enable incident types: 1. Navigate to **Incidents** → **Incident Types**. 2. Select any child of the **Base Incident** type. 3. Click the **Settings** tab. 4. Select **Disable** in the **Enable Incident Type** dropdown. 5. Click **Save**. **Note**: To disable an Incident Type, you must also disable any child types. ## Set Incident Type on an Incident By default, new incidents are created as a Base Incident at the top of the inheritance hierarchy. If your account has a [Default Incident Type](#set-the-default-incident-type) configured, the **Incident Type** field is instead pre-filled with that type when you declare an incident, and you can change it before the incident is created. ### Set or Change an Incident Type **Set or Change an Incident Type in the Web App** 1. Navigate to **Incidents**. 2. Select the incident you want to modify. 3. Above the incident title, select an **Incident Type** from the dropdown. A confirmation modal appears, prompting you to confirm whether the field should be added or removed from the incident.  *Select an Incident Type* 3. Click **Change Incident Type** to confirm. **Set or Change an Incident Type in the Mobile App** 1. Navigate to **Incidents**. 2. Select the incident you want to modify. 3. In the carousel menu under the **Triage** tab, tap **Set Type**. 4. Select the **Incident Type**. 5. Tap **Change Type** to confirm. **Set or Change an Incident Type Using Slack** 1. In a dedicated incident channel, enter the `/pd type` command, or click **More Actions** on an incident notification and select **Change Type**. 2. Select the **Incident Type**. 3. Click **Save** to confirm. **Set or Change an Incident Type Using Microsoft Teams** 1. On a PagerDuty incident's card, click and select **Change Type**. 2. Select the **Incident Type**. 3. Click **Save**. **Set or Change an Incident Type Using ServiceNow** You can change the incident’s type from the incident actions menu in ServiceNow after enabling this feature in the integration. Refer to the [Sync Incident Types with Service](/integrations/servicenow-integration-guide/advanced-servicenow-configuration/sync-incident-types-with-servicenow#update-an-incidents-type) article for more information. **Set or Change an Incident Type Using the API** You can update an incident’s type using the [Update Incident API](/developer/api/reference/rest/incidents/update-incident) endpoint. **Set or Change an Incident Type Using Incident Workflows** You can update an incident's type using [Incident Workflows](/ai-automation/automation/incident-workflows) with the [Update Incident Type](/workflow-actions/pagerduty-incident-management/update-incident-type) action. ## View Incident Types on Incidents You can view Incident Types in multiple ways: **View Incident Types in the Web App** Incident Types are viewable on: - The **Incidents** page under the **Type** column. - The incident details page directly above the incident title.  *Incident Type on the Web App Incidents page*  *Incident Type on the Web App incident details page* **View Incident Types in the Mobile App** Incident Types are viewable on: - The **Incidents** page directly above the incident status (e.g., above “Triggered” or “Acknowledged”). - The incident details page directly above the incident status.  *Incident Type on the Mobile Incidents page*  *Incident Type on the Mobile incident details page* **View Incident Types Using Slack** Incident Types are viewable on incident notifications under the **Type** heading.  *Incident Type on Slack incident notification* **View Incident Types Using Microsoft Teams** Incident Types are viewable on an incident notification under the **Type** heading.  *Incident Type on Microsoft Teams incident notification* **View Incident Types Using ServiceNow** Incident Types are viewable on the ServiceNow incident after enabling this feature in the integration. Refer to [Advanced ServiceNow Configuration](/integrations/servicenow-integration-guide/advanced-servicenow-configuration#incident-types-and-custom-field-mappings) for enablement and configuration steps.  *Incident Type on ServiceNow incident record* ## FAQ **When is a good time to use Incident Types?** A good time to use Incident Types is whenever there is a unique incident process to follow. Your organization's process for major incidents, including required metadata to capture and remediation steps, is likely very different from the one for lower-severity incidents. Incident Types are ideal for guiding responders through these differences and capturing variations in response processes. There are two main categories for when different processes (i.e., Incident Types) are relevant: - **Organizational structure**: Within scaled companies, organizational structure frequently defines where one process ends and another begins. Within these businesses, one part of the organization may look to follow a different process than other areas of the company. In these scenarios, it often makes sense to define an Incident Type that aligns with each business unit's processes. - **Business impact**: Another common use case for an Incident Type is a security incident. Unlike in the organizational structure example above, security incidents may follow a consistent process across all parts of the organization. However, their process may differ from other incidents, such as a major incident. **Can I trigger Incident Workflows conditionally based on Incident Type?** Yes. From [Incident Workflows](/ai-automation/automation/incident-workflows#create-an-incident-workflow-from-scratch), you can use the [Conditional Trigger](/ai-automation/automation/incident-workflows#conditional-triggers) to trigger a workflow for specific Incident Types. For example, you could trigger a Major Incident Workflow whenever a Major Incident triggers. **Does setting a Default Incident Type change existing incidents?** No. A Default Incident Type applies only to incidents created after you set it. Existing incidents keep their current type. **Can a responder change the pre-filled Incident Type when declaring an incident?** Yes. The Default Incident Type pre-fills the **Incident Type** field, but the responder can select a different type before creating the incident. --- URL: https://docs.pagerduty.com/incident-management/incidents/overview # Incidents Trigger, acknowledge, and resolve incidents created by service integrations. An incident represents a problem or an issue that needs to be addressed and resolved. Incidents trigger on services, and a service's escalation policy prompts notifications to on-call responders to remediate the issue. ## Incident Statuses - **Triggered**: An active [service](/incident-management/services/services-and-integrations) (i.e., someone is on call and the service is not disabled or in maintenance mode) triggers an incident when it receives an event. The incident escalates in accordance with the service's [escalation policy](/incident-management/schedules/escalation-policies). By default, PagerDuty sends [notifications](/incident-management/notifications/notification-content-and-behavior) when an incident is triggered, but not when it is acknowledged or resolved. Users can create their own [notification rules](/account-admin/user-profile/notification-rules) — or use [webhooks](/developer/webhooks-overview) — to receive notifications when an incident is acknowledged or resolved. - **Acknowledged**: An acknowledged incident that is being worked on, but is not yet resolved. The user who acknowledges an incident claims ownership of the issue and halts the escalation process. While an incident is acknowledged, notifications are not sent until the [acknowledgement timeout](/incident-management/services/configurable-service-settings#acknowledgement-timeout) is reached. If the acknowledgement timeout is reached, the incident returns to the triggered status, and the escalation process resumes. - **Resolved**: A acknowledged incident has been fixed. Once an incident is resolved, no additional notifications are sent. You can [reopen it](/incident-management/incidents/reopen-incidents) if further work is needed. ## Priority, Urgency, and Severity - **Priority** is tied to **_incidents_**, and it specifies the order in which incidents must be addressed (e.g., P1, Sev-1). Refer to [Incident Priority](/incident-management/incidents/incident-priority) for more information. - **Urgency** is tied to **_incidents_** and determines how are notified when an incident is assigned to you (high or low). Refer to [Notification Urgency](/incident-management/services/configurable-service-settings#notification-urgency) for more information. - **Severity** is tied to **_alerts_** and describes the impact on a specific service or piece of infrastructure (e.g., critical, warning, error). Refer to [Event/Alert Severity Levels](/incident-management/incidents/dynamic-notifications#eventalert-severity-levels) for more information. > **How Do I Page Someone?:** Paging is the result of an incident triggering on a service and escalating through that service's [escalation policy](/incident-management/schedules/escalation-policies). Whoever is on call on that policy — a user, team, or a schedule — is notified, or "paged." > > To page someone, [trigger or declare an incident](#triggerdeclare-an-incident) on the relevant service. To control who gets paged, add the appropriate users or schedules to the service's [escalation policy](/incident-management/schedules/escalation-policies). To pull a specific person into an incident that is already open, [add them as a responder](/incident-management/incidents/add-responders). ## Incident Lifecycle ### 1\. Received through Services PagerDuty receives events from monitoring systems via [integrations](/integrations). An event creates an alert and an associated incident in PagerDuty. > **Note:** Use [Suppress alert](/ai-automation/aiops/event-orchestration#incident-data) to collect data without triggering an incident or notifying responders. ### 2\. Assignment via Escalation Policies and Schedules Unlike an alert or a suppressed event, an incident must be assigned to a user. The escalation policy determines to whom an incident is assigned. An escalation policy has one or more levels and can target either a schedule or a user. An incident escalates through the layers of an escalation policy until it reaches someone on call who is notified and assigned the incident. If the user fails to acknowledge the incident before the [escalation timeout](/incident-management/schedules/escalation-policies#escalation-timeout), the incident escalates to the next escalation level. Incidents are only created when an escalation policy has an on-call user. In other words, if there is no one to assign an incident to when an event is sent to PagerDuty (due to a [coverage gap on a schedule](/incident-management/schedules/schedule-basics#schedule-restrictions), for example), no incident is created. ### 3\. Notifications via Push, Phone, Slack, Email, or SMS Each user configures notification rules in their [user profile](/account-admin/user-profile). PagerDuty contacts users according to their [notification rules](/account-admin/user-profile/notification-rules) until the incident is acknowledged, resolved, or escalated, either manually or due to escalation timeout. ### 4\. Acknowledging and Resolving Notifications allow responders to acknowledge that they are working on an incident or that it has been resolved. Depending on a their permissions, users who are not currently assigned to an incident can acknowledge or resolve it on the **Incidents** dashboard in the web app. Resolving an incident closes the incident, while acknowledging only halts escalation. If the incident is not resolved before the service's acknowledgement timeout expires, it retriggers and continues to escalate. > **Note:** [Alerts](/incident-management/incidents/alerts) cannot be acknowledged; they can only be triggered or resolved. If all alerts in an incident are resolved, the incident gets resolved. Similarly, when an incident is resolved, all associated alerts are also resolved. ## Incident Timeline Each incident has a **Timeline** tab in the incident details page, showing timestamps of each [incident status](/incident-management/incidents/overview#incident-statuses) along with all other actions taken and notifications sent from the incident. 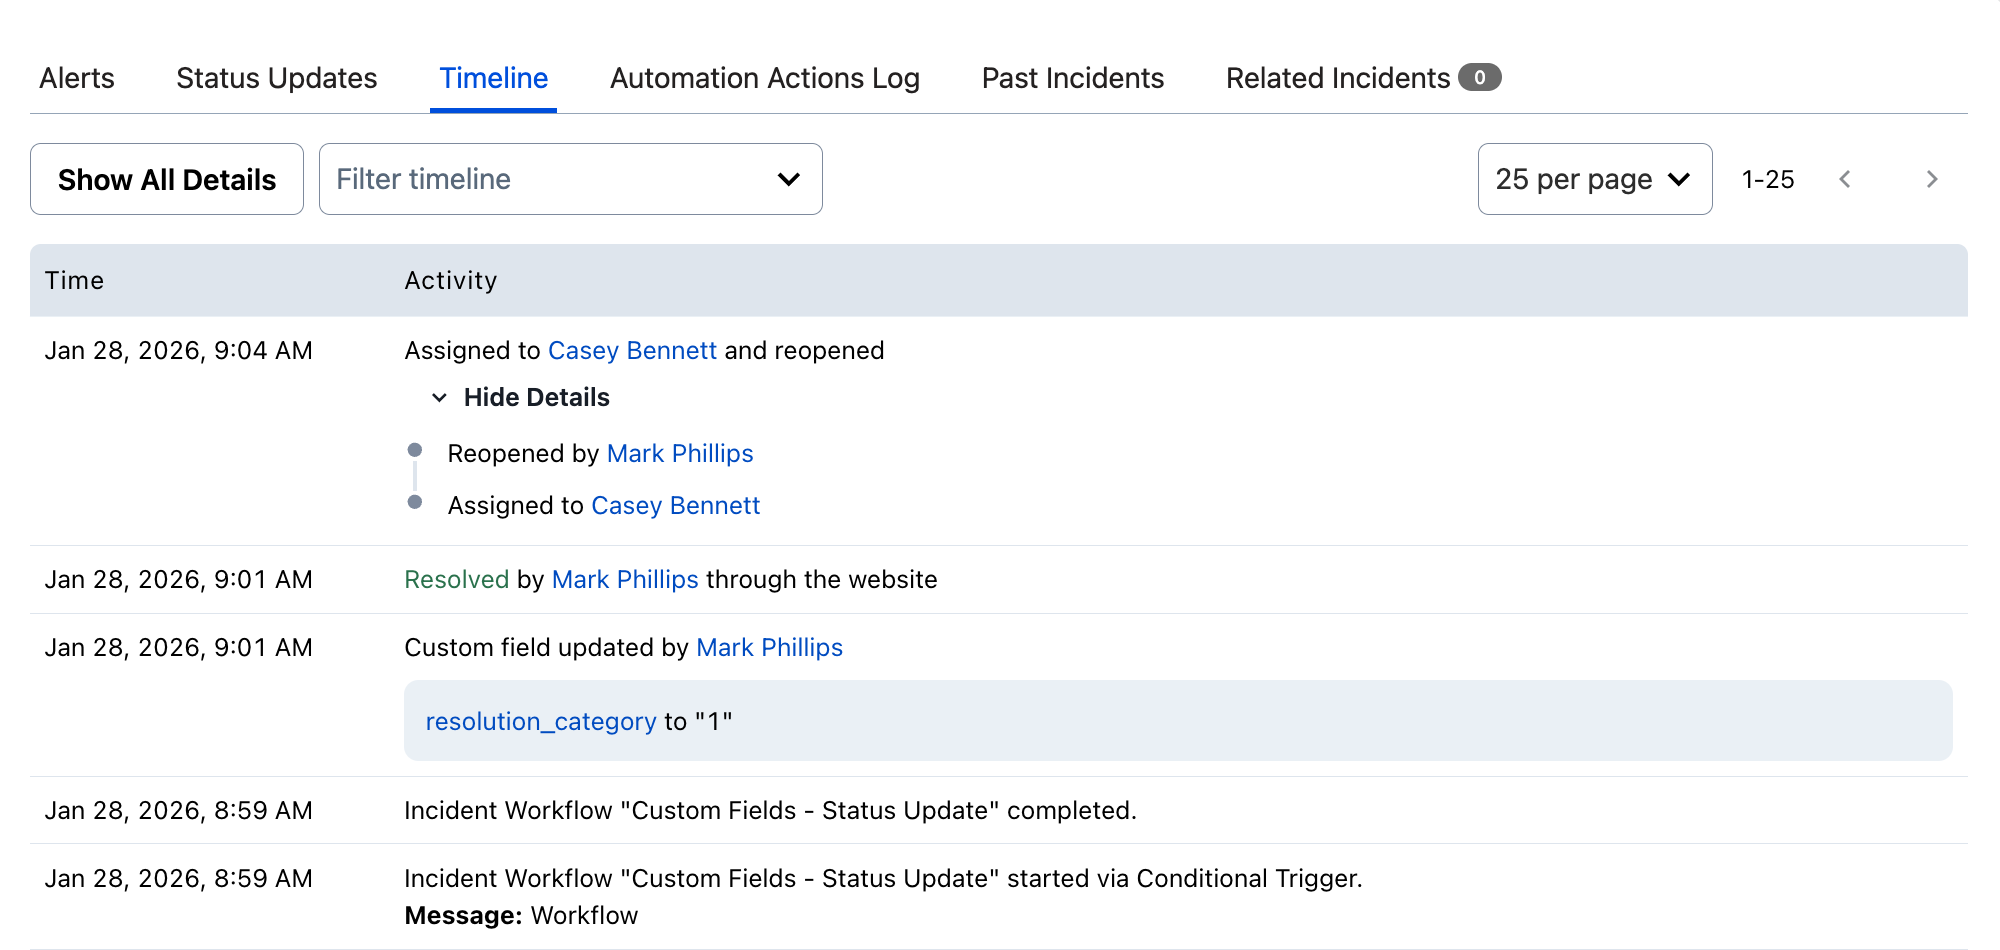 *Incident timeline* You can filter the incident timeline by specific events and actions, making it easier to track particular types of updates or changes and review patterns throughout the incident. 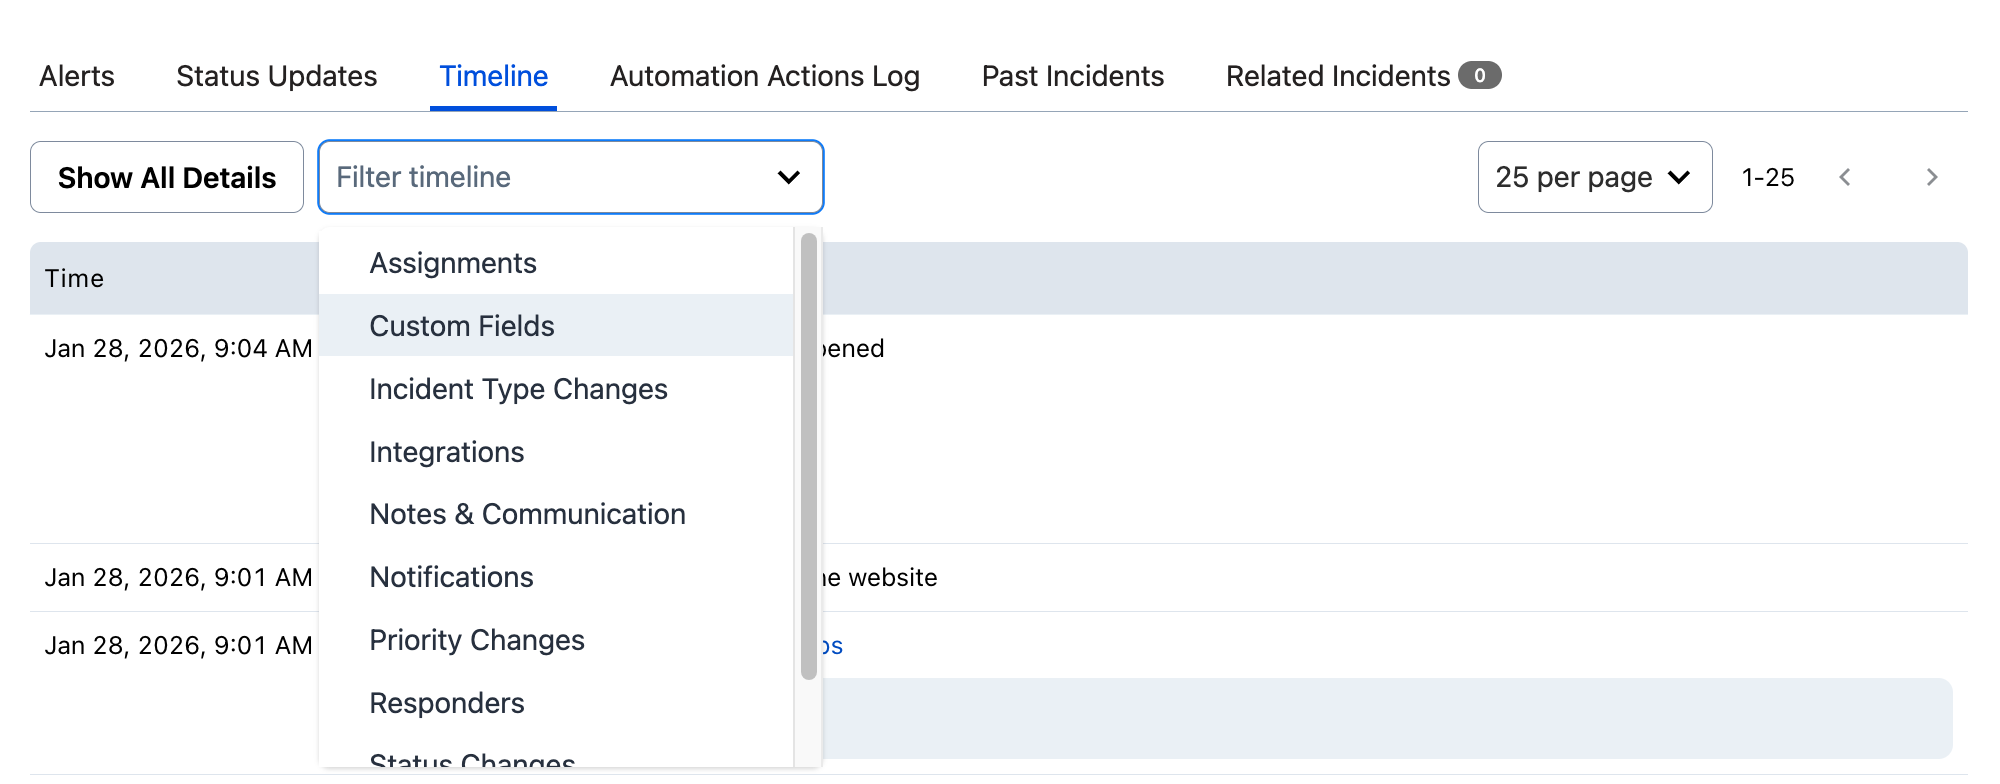 *Incident timeline filter* ## Trigger/Declare an Incident > **Note on Terminology:** Throughout PagerDuty documentation, you may see incidents referred to as being **triggered** or **declared**. While both terms describe the creation of a new incident in PagerDuty, their usage reflects different contexts: > > - Triggered refers to incidents created automatically via integrations, monitoring tools, or event-driven workflows. > - Declared refers to incidents created manually by users through the PagerDuty interface or API. > > **Important**: Regardless of how an incident is created, its initial status is always **Triggered**. There are multiple ways to trigger PagerDuty incidents depending on your use case: **Trigger an Incident via Integration** It is a common workflow to integrate with a third-party platform (e.g., a monitoring tool) and to configure the integration to trigger an incident in PagerDuty when specific criteria are met. Visit the [Integrations library](/integrations) for more information on integrating the products in your tool chain with PagerDuty. > **Event Orchestration:** [Event Orchestration](/ai-automation/aiops/event-orchestration) centralizes your integrations by sending all your events to a single endpoint and routes alerts to the appropriate service based on the logic that you provide. **Declare an Incident via Web App** You can manually create an incident from anywhere in the PagerDuty web app. Manually opening an incident triggers an incident and notifies the on-call responder(s). A common use case is to test notification rules or contact the on-call person inform them about an issue on a particular service. > **Required User Permissions:** All users, except Limited Stakeholders and Full Stakeholders, can manually trigger incidents. > > Restricted Access and Observer users can only trigger incidents for [Teams](/account-admin/teams) they are associated with. > **Availability:** Depending on your account's pricing plan, the following features may not be available. Contact the [Sales Team](https://www.pagerduty.com/contact-us/#contact-sales) to upgrade your pricing plan. 1. From the Incidents page, click **+ New Incident**. 2. In the **Create New Incident** dialog, enter the following: | Field | Description | | :--- | :--- | | **Title** _(Required)_ | Enter a title for the incident. | | **Incident Type** _(Required)_ | Pre-filled with your account's [Default Incident Type](/incident-management/incidents/incident-types#set-the-default-incident-type), or **Base Incident** if no default is set. Select a different type if needed. | | **Impacted Service** _(Optional)_ | Select the impacted service for the incident.
**Note:** Impacted service is _optional_ by default. You can set it to _required_ by [allowing default mobilization](/incident-management/incidents/quick-declare#disable-default-mobilization). | | **Description** _(Optional)_ | Enter an incident description. | | **Urgency** _(Optional)_ | Assign an urgency level: **High** or **Low**. If you have configured [support hours](/incident-management/services/configurable-service-settings#urgency-use-case-support-hours) for the service, leave this blank to use the default urgency setting, or select an option to override it. Urgency can only be selected for enabled services. Refer to [notification urgencies](/incident-management/services/configurable-service-settings#notification-urgency) for more information. | | **Priority** _(Optional)_ | Assign an incident priority. Priority can only be selected for enabled services. Refer to [incident priority](/incident-management/incidents/incident-priority) for more information. | | **Assignee** _(Required)_ | Assign the incident by selecting an **escalation policy** or a **user** from their respective tabs. This selection overrides the service's escalation policy, and the incident notifies the selected escalation policy or user. | | **Add additional responders to help** _(Optional)_ | Add additional responders to the incident by selecting **escalation policies** and/or **users** from their respective tabs. | | **Add a conference bridge** _(Optional)_ | Add a conference bridge by selecting a preconfigured [Conference Bridge](/incident-management/incidents/conference-bridge) from the dropdown. | | **Dial-in number** _(Optional)_ | Enter a dial-in number. | | **Meeting URL** _(Optional)_ | Enter a meeting URL. | 3. Click **Create Incident**. > **Self-Assigned Incidents:** If you assign a manually declared incident to yourself, PagerDuty will not notify you. The incident will be in an Acknowledged state, as you are aware of it and working to resolve it. **Declare an Incident via Mobile App** Refer to [declaring incidents in the mobile app](/get-started/mobile-app#trigger-or-declare-an-incident) for more information. **Trigger an Incident via API** ### Events API If a service has an API integration, you can trigger an incident via Events API by sending a [properly-formatted `POST` request](/developer/api/reference/events-v2/send-event/create-v2-event) with your integration key. You can find the integration keys by navigating to **Services** → **Service Directory** → selecting the **service** where the integration is configured → **Integrations** tab → click the to the right of the integration. > **Developer Documentation:** For more information, refer to [Events API v2 Overview](/developer/events-api-v2-overview). Visit [PagerDuty Samples](https://github.com/PagerDuty-Samples/) site for code samples in Ruby, Python, and PHP. ### REST API You can also [trigger incidents using the REST API](/developer/api/reference/rest/incidents/create-incident). **Declare an Incident via Email Integration** If a service has an email integration, you can trigger an incident by sending an email to the integration's email address. To view an email integration's address, go to **Services** → **Service Directory**, select the service, click the service's **Integrations** tab, and click the to the right of the integration. When you send an email to the integration address, an incident is triggered on that service. The incident appears in the **Incidents** tab. **Declare an Incident via Slack** If your account has the [Slack integration](/integrations/slack-integration-guide) configured, you can also declare an incident using the [Slack slash commands](/integrations/slack-integration-guide/slack-user-guide#slash-commands). > **Incident Trigger Limitations:** - An incident stops accepting new trigger events after receiving 100 events with the same deduplication key. After receiving 100 triggers, the **Alerts Log** stops showing more events. If you want to send more events, you must first resolve the incident. > - For an incident to trigger, at least one person must be on-call per the service's escalation policy. If no one is on-call an incident will not trigger. > **High Open Incident Volume:** For services with over 100K open incidents, the [auto-resolve feature](/incident-management/services/configurable-service-settings#auto-resolution) will automatically be enabled. With this feature enabled, all new incidents for that particular service are auto-resolved after 24 hours, and no further notifications will be sent for those incidents. > > You cannot disable this feature for the service in question unless the service's open incident count is reduced to under 100K. To reduce the open incident count, use the [update an incident API](/developer/api/reference/rest/incidents/update-incident) to bulk resolve incidents. Additionally, you can use the [mass_update_incidents.py](https://github.com/PagerDuty/public-support-scripts/blob/master/mass_update_incidents/mass_update_incidents.py) script to automate and bulk resolve incidents. ## Acknowledge an Incident There are multiple ways to acknowledge PagerDuty incidents depending on your use case: **Acknowledge an Incident via Web App** There are two ways to acknowledge an incident in the web app: - [On the Open Incidents page](#acknowledge-an-incident-on-the-open-incidents-page) - [On the incident details page](#acknowledge-an-incident-on-the-incident-details-page) ### Acknowledge an Incident on the Open Incidents Page 1. Navigate to **Incidents** to view the Open Incidents page. 2. Select the **checkbox** to the left of the triggered incident to acknowledge. 3. Click the **Acknowledge** button in the actions menu bar. ### Acknowledge an Incident on the Incident Details Page 1. Click an open incident's title to enter the incident details page. 2. Click the **Acknowledge** button in the actions menu bar. **Acknowledge an Incident via Mobile** Refer to [acknowledging incidents in the mobile app](/get-started/mobile-app#acknowledge-an-incident) for more information. **Acknowledge an Incident via API** Refer to the [API Reference](/developer/api/reference/rest/incidents/update-incidents) guide for more information. **Acknowledge an Incident via Slack** Refer to the [Slack Integration User Guide](/integrations/slack-integration-guide/slack-user-guide#incident-card-actions) for more information. > **Incident Acknowledgement Limitations:** Each incident is limited to 100 acknowledgements. However, the limit for [added responders](/incident-management/incidents/add-responders#add-responders-to-an-incident) is 1000. So, if many responders need to be involved in an incident, this may be a better approach. ### Unacknowledge an Incident If you accidentally acknowledge an incident, you can undo it by clicking the **More...** button in the incident details page and selecting **Unacknowledge Incident**. Unacknowledging an incident returns it to a **Triggered** state and causes notifications to be sent again. The escalation process also resumes. ## Resolve an Incident There are multiple ways to resolve PagerDuty incidents depending on your use case: **Resolve an Incident via Web App** There are two ways to resolve an incident in the web app: - [On the Open Incidents page](#resolve-an-incident-on-the-open-incidents-page) - [On the incident details page](#resolve-an-incident-on-the-incident-details-page) ### Resolve an Incident on the Open Incidents Page 1. Navigate to **Incidents** to view the **Open Incidents** page. 2. Select the checkbox to the left of the incident to resolve. 3. Click **Resolve** in the actions menu bar. ### Resolve an Incident on the Incident Details Page 1. Click an open incident's title to enter the incident details page. 2. Click **Resolve** in the actions menu bar. **Resolve an Incident via Mobile** Refer to [resolving incidents in the mobile app](/get-started/mobile-app#resolve-an-incident) for more information. **Resolve an Incident via API** Refer to the [API Reference](/developer/api/reference/rest/incidents/update-incidents) guide for more information. **Resolve an Incident via Slack** Refer to the [Slack Integration User Guide](/integrations/slack-integration-guide/slack-user-guide#incident-card-actions) for more information. ## Redact an Incident > **Required User Permissions:** This action is only available to the Account Owner. Redaction cannot be undone, not even by PagerDuty Support. If an incident contains sensitive information, the **Account Owner** can permanently delete the incident's details by selecting **More...** and clicking the **Redact Incident** button. After confirming that you want to redact an incident's name and details, the page reflects who redacted the data and when it was redacted. > **Incident Redaction and Analytics:** Redacting deletes the incident description and incident key, but does not affect [Analytics metrics](/incident-management/analytics/insights) associated with the incident. ## FAQ **Why was an incident number skipped?** In the past, incidents started at #1 and never skipped a number. There are rare cases, however, in which PagerDuty is unable to create incidents quickly enough. To address this, you might notice "missing" incident numbers. PagerDuty never deletes incidents, so a skipped number means it was skipped at creation time. This does not indicate a problem. --- URL: https://docs.pagerduty.com/incident-management/incidents/post-incident-reviews-and-postmortems # Jeli Post-Incident Reviews and Postmortems Document and learn from past major incident responses. > **Jeli End-of-Life:** As of December 22, 2026, the Jeli UI will reach end-of-life. Post-incident review capabilities will be integrated directly into PagerDuty's Post-Incident Reviews in the PagerDuty web app. > > Sign up for [Early Access](https://www.pagerduty.com/early-access/) and select **Post-Incident Reviews in PagerDuty UI** to try the integrated experience before its general release. ## Post-Incident Reviews [Jeli Post-Incident Reviews](#jeli-post-incident-reviews) are a structured evaluation process conducted after an incident or crisis to analyze what happened, why it happened, and how to prevent recurrence. They are a valuable tool for learning from mistakes, improving response procedures, and enhancing overall resilience in the face of future challenges. [Postmortems](#create-a-postmortem) are reports that allow you to learn from major incidents by providing a summary of events, how the response was handled, and what resolution steps were taken. Post-incident reviews curate a timeline of activity in PagerDuty and Slack, which teams can analyze to determine follow-up actions for similar situations in the future. ## Jeli Post-Incident Reviews Accounts on Enterprise for Incident Management or Customer Service Operations pricing plans can create a post-incident review in Jeli. > **Availability:** - Accounts on Enterprise for Incident Management pricing plans can create unlimited Jeli Opportunities. > - Accounts on Professional and Business pricing plans can create up to 300 Opportunities per year. This is a rolling 365-day window. Review the number of Opportunities you have created in the past year using the date filters on the Opportunity list in the Jeli web app. ### Configure Jeli Before you can create post-incident reviews, you must enable them in your account. Refer to [Enable Post-Incident Reviews](/incident-management/after-incident/get-started-with-jeli-post-incident-reviews/configure-post-incident-reviews-jeli#enable-post-incident-reviews) for more information. ### Create a Jeli Post-Incident Review 1. From any resolved PagerDuty incident, click **Jeli Post-Incident Review**. 2. Review the **Create a Jeli Post-Incident Review** prompt and click **Accept & Continue to Jeli**.  *Create a Jeli Post-Incident Review* 3. When prompted, sign in to Jeli using **Continue with PagerDuty**. 4. In the Jeli Opportunity, review all events from your PagerDuty timeline by clicking **Narrative**. Refer to [Post-Incident Reviews](/incident-management/after-incident/post-incident-reviews) for more information. ## Create a Postmortem > **Pricing Plan:** The Postmortems feature is available on PD Reliability Platform plans. It's also available on Business, Enterprise for Incident Management, and Digital Operations (Legacy) plans. > **Required User Permissions:** Observers, Limited Users, Users, Admins, and the Account Owner (or their respective [Advanced Permissions base roles](/account-admin/advanced-permissions#migration-role-mapping)) can create, edit, and delete postmortems. > **Postmortem End-of-Life:** As of **October 31, 2026**, the Postmortems feature reaches end-of-life and will be removed from the PagerDuty web app. 1. Navigate to **Incidents** → **Postmortems** and click **New Report**, or click **New Postmortem Report** on a resolved incident. 2. Complete one of the following based on how you created the postmortem: - **If you created a new postmortem from the overview page**: Enter a **Report Name** and **Owner of Review Process**. Optionally, enter an **Impact Start Time** and **Impact End Time**. A postmortem can only have a single owner. Click **Create Report** to continue. - **If you created a new postmortem from a resolved incident**: Your report details are auto-populated and you are assigned as the **Owner of Review Process**. Optionally, edit these details as needed. Click **Create Report** to continue. 3. In the **Data Sources** section, build a timeline of incident log entries and Slack messages related to the incident: - **PagerDuty**: To link incidents to this postmortem, select **Select incident between impact start and end times** from the dropdown, or select **Find by incident number**, enter incident numbers one at a time, and click **Add This Incident**. - **Slack**: To include discussions from public Slack channels, click **Connect to Slack**. After authorizing PagerDuty to access your Slack account, search and select **Channels** to include in your report. Click **Save Data Sources** to continue. > **Slack Data Source:** To include Slack content in a postmortem, a contributor must authorize PagerDuty to access Slack on their behalf, which allows that contributor to see Slack content in the **Available Data** listing. Each PagerDuty user must authorize with Slack individually. > > If your Slack user account does not have permission to add apps to your team, ask a Slack admin to go to Slack's App Directory and authorize the [PagerDuty Postmortems app](https://pagerduty.slack.com/marketplace/A51BZ1FCG-pagerduty-postmortems) first. 4. In the **Analysis** section, summarize and reflect on the curated timeline, including incident root cause analysis and potential steps to prevent or mitigate future incidents. Complete the following fields: | Field | Description | | :--- | :--- | | **Overview** | Include a short sentence or two summarizing the contributing factors, timeline summary, and impact — for example, "On the morning of August 14th, we suffered a 14-minute SEV-1 due to a runaway process on our primary database machine. This slowness caused roughly 3% of reports generated during this time to be completed out of SLA." | | **What Happened** | Include a short description of what happened, usually based on the timeline. | | **Resolution** | Include a description of what solved the problem. If a temporary fix was in place, describe that along with the long-term solution. | | **Root Causes** | Include a description of any conditions that contributed to the issue. If any actions taken exacerbated the issue, include them here with the intention of learning from mistakes made during the resolution process. | | **Impact** | Be specific. Include numbers such as the number of customers affected, cost to the business, and other measurable outcomes. | | **What Went Well?** | List anything that went well and is worth calling out. This field can be left blank. | | **What Didn't Go So Well?** | List anything that did not go well. The intent is to follow up on all points here to improve processes. | | **Action Items** | Include action items such as: fixes required to prevent the issue in the future, preparedness tasks that could help mitigate a similar incident, and remaining postmortem steps such as an internal follow-up email or updating the public status page. | | **Add Section** | Add a new custom section here if needed. | > **Customized Postmortem Templates:** The fields above reflect the default Postmortem Template. Some fields may differ based on how your postmortems have been [customized](#customize-the-postmortem-template). Each analysis field can be edited by clicking on the right and selecting one of the following options: - Edit Section Title - Move to Top - Move Up - Move Down - Move to Bottom - Delete Section Click **Add Section** to add new sections. 5. In the **Timeline** section, all Slack messages and incident log entries from the data sources above appear in the **Available Data** column on the left. The incident Trigger and Resolve log entries appear by default in the **Included in Timeline** column on the right. - **To add Slack messages or incident log entries to the timeline**: Select the event and click , or click to the left of the event. Hold the **Shift** key and press to move multiple items at once. To add freeform entries, click **New Timeline Entry**. Any Slack entries moved into the **Timeline** are visible to anyone viewing the postmortem. 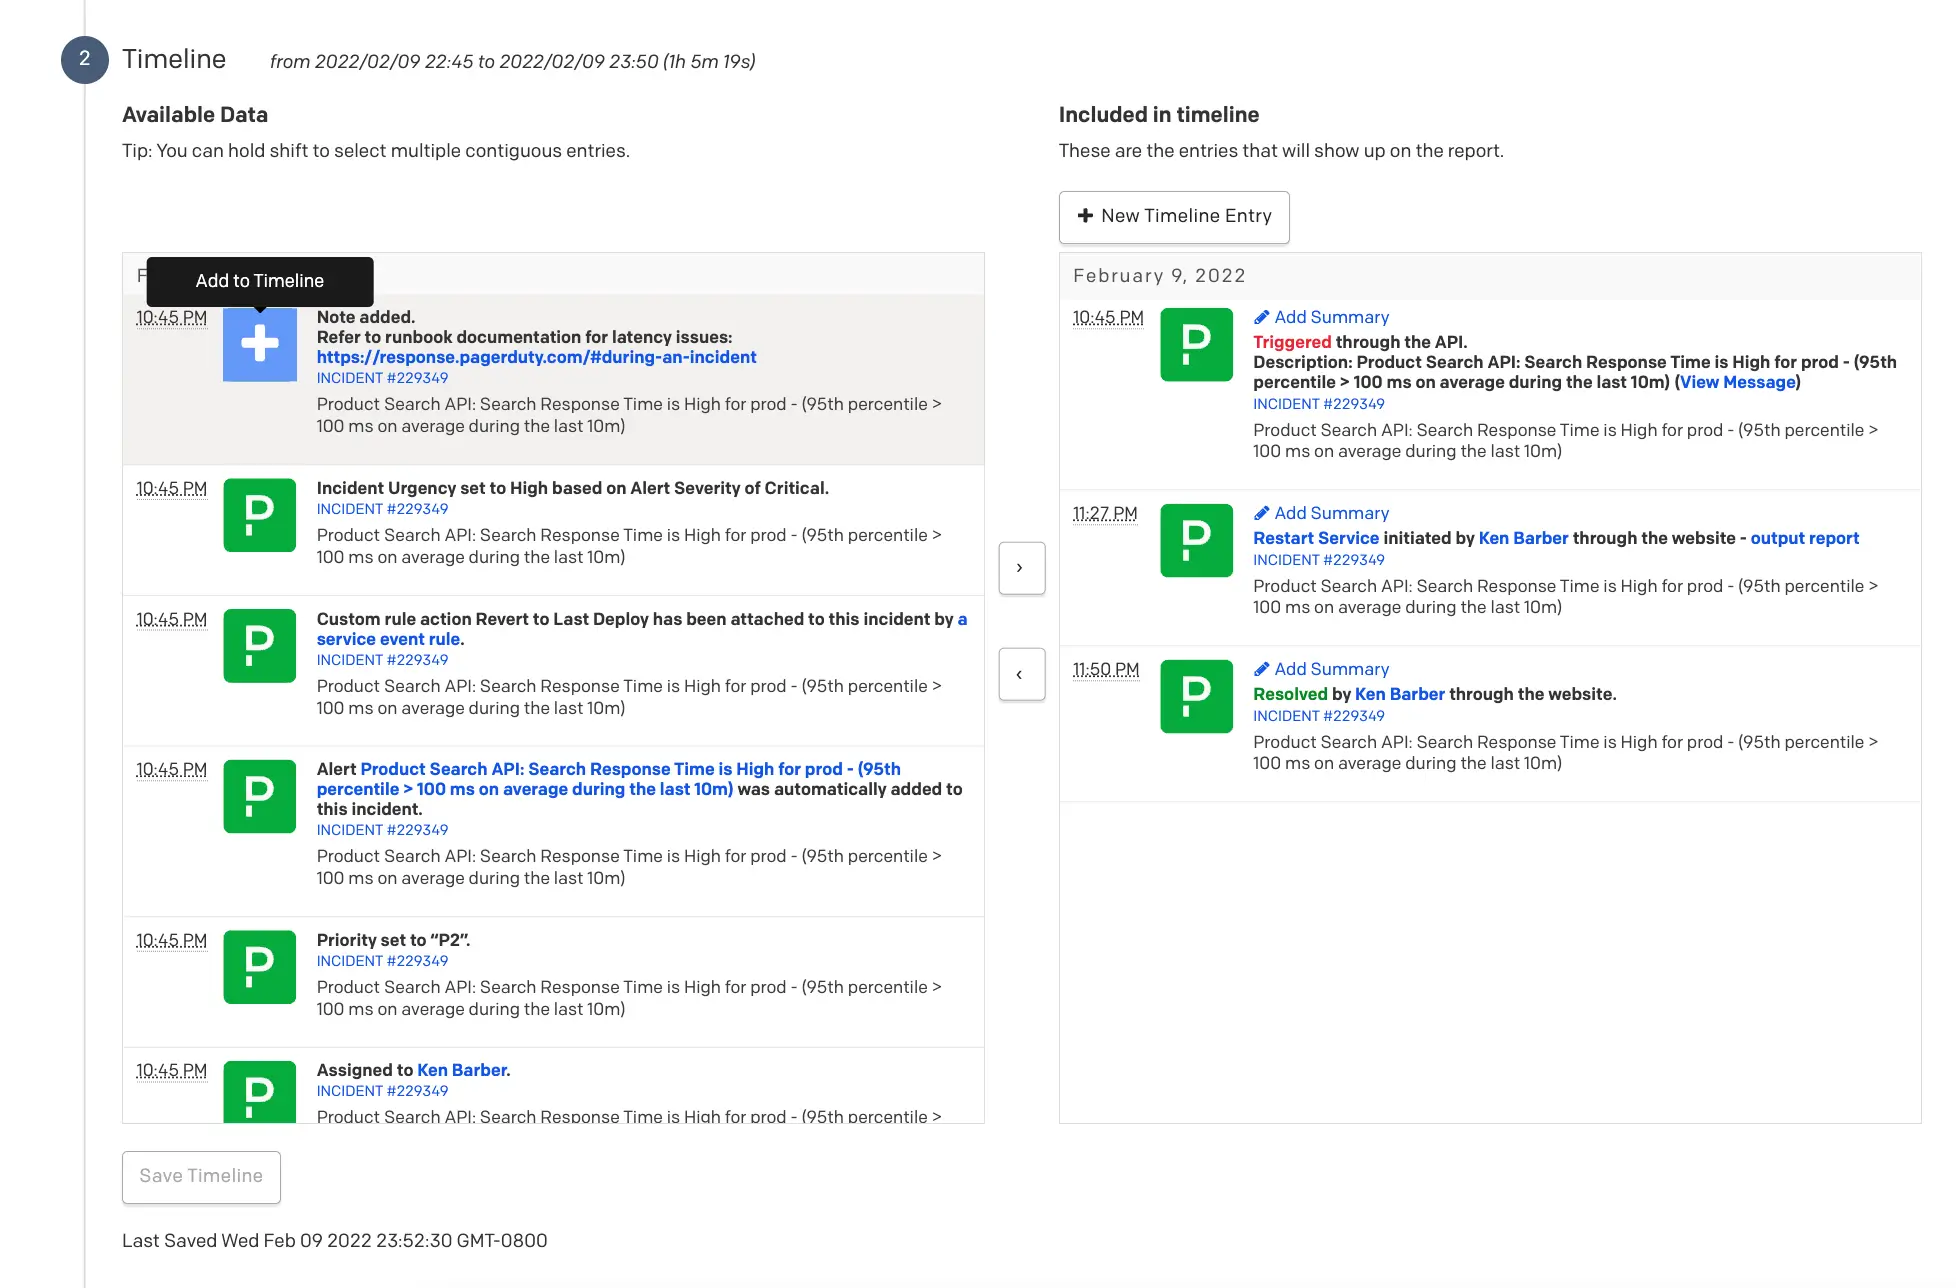 *Add to timeline* - **To remove an event from the timeline**: Select the event and click , or click to the left of the event. 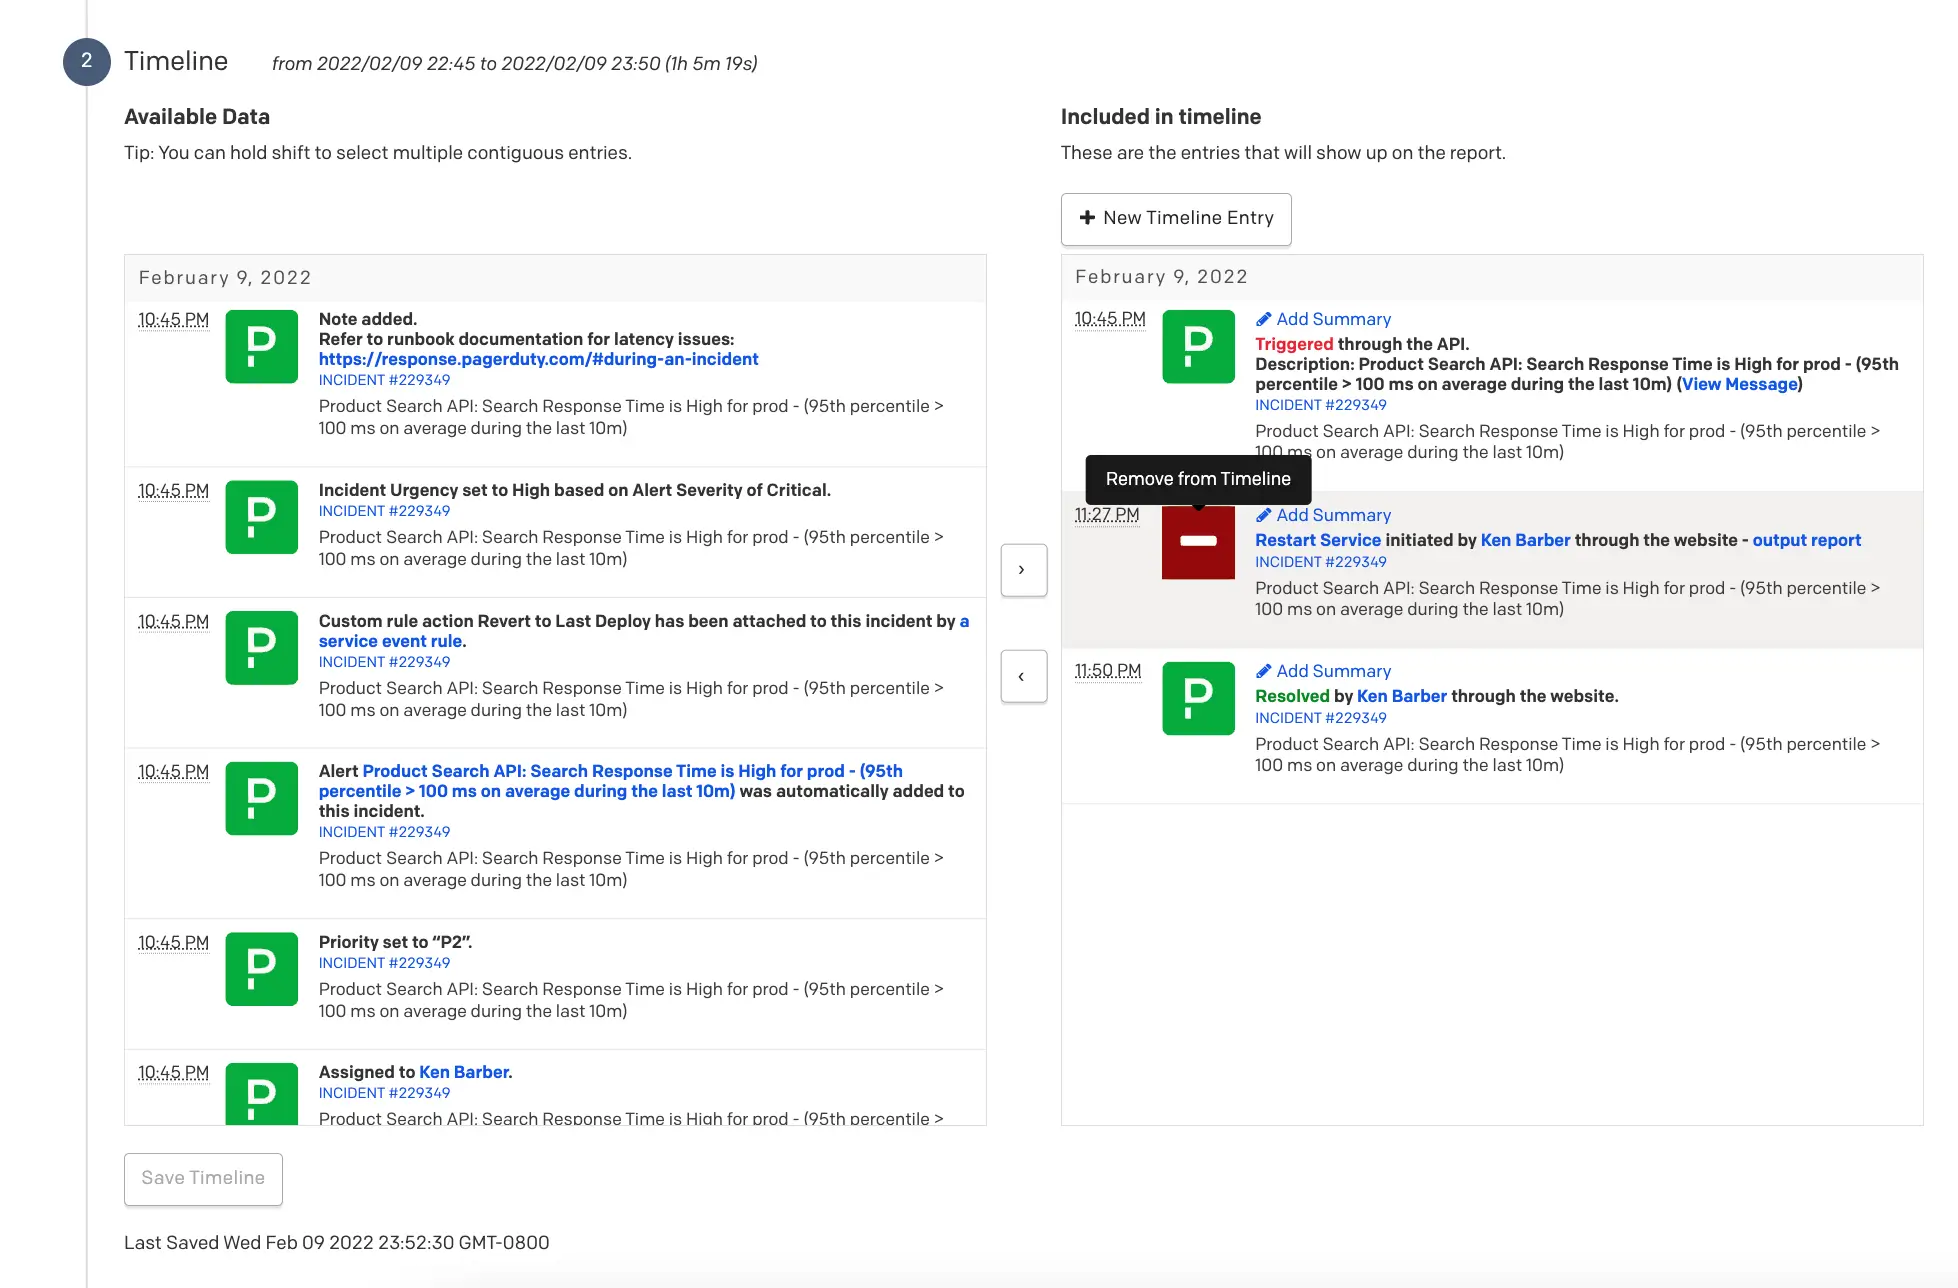 *Remove from timeline* Click **Save Timeline** to proceed. 6. Once you have completed and reviewed your report, click **Save & View Report**. ### Edit a Postmortem 1. Navigate to **Incidents** → **Postmortems** and select → **Edit** to the right of your desired postmortem, or select the postmortem's **Name** and click **Edit Report**. 2. Edit the postmortem's details as needed and click **Save & View Report**. ### Delete a Postmortem > **Permanent Deletion:** Deleting a postmortem is permanent and cannot be undone. 1. Navigate to **Incidents** → **Postmortems** and select → **Delete** to the right of the postmortem you want to delete, or select the postmortem's **Name** and select → **Delete**. 2. In the confirmation dialog, click **Delete**. ### Export a Postmortem Once you have completed your postmortem report, you can export it as a PDF. 1. Navigate to **Incidents** → **Postmortems** and select your desired postmortem's **Name**. 2. Click → **Save as PDF**. 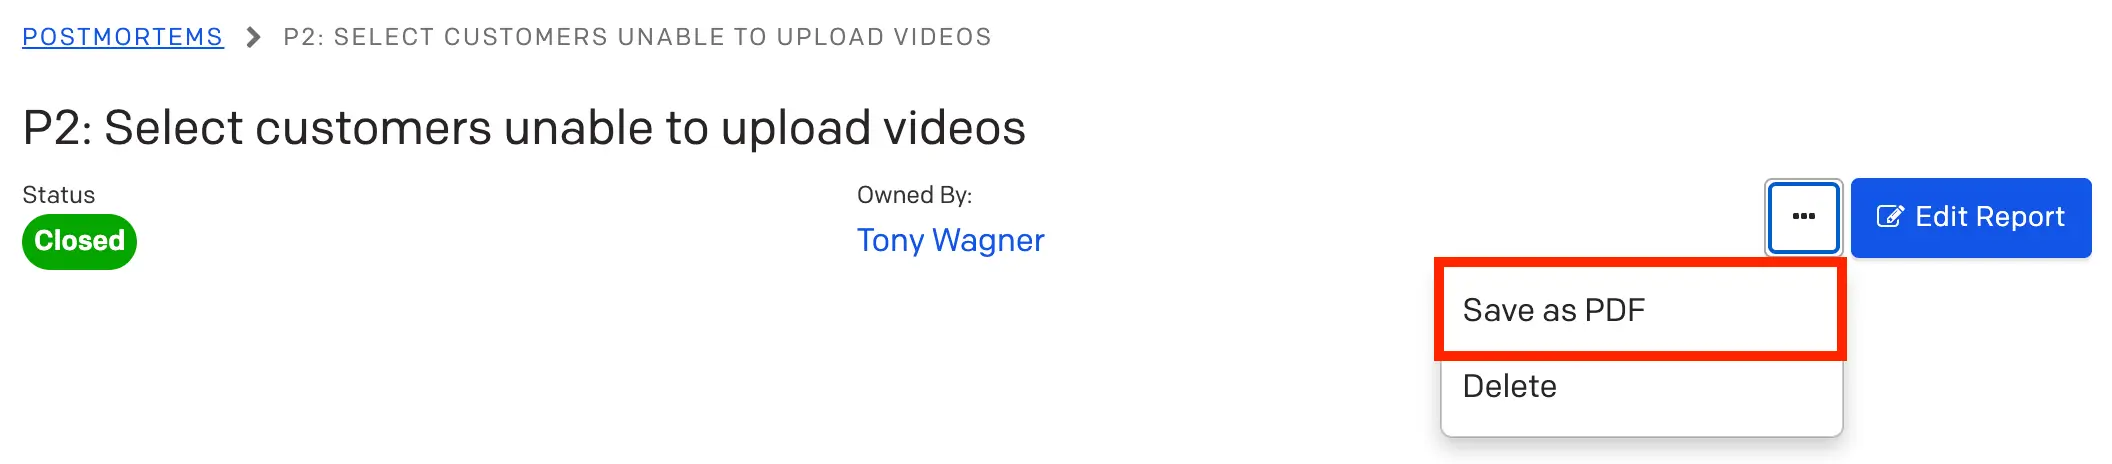 *Save as PDF* ## Customize the Postmortem Template You can customize your postmortem report by adding or removing sections that apply to your team's specific use case.  *Customize the Postmortem template* 1. Navigate to **Incidents** → **Postmortems** and select the **Settings** tab. 2. Complete one or more of the following: - **To add a new section**: Scroll to the default **New Section**, click on the right, and select **Edit Section**. Enter a new section **Title** and **Description**, then click **Save**. To add additional sections, click **Add Section** at the bottom of the page. - **To edit an existing section**: Click to the right of the section and select **Edit Section**. Make any edits and click **Save**. - **To delete a section**: Click to the right of the section and select **Delete**. In the confirmation dialog, click **Yes, Delete Section**. ### Reset the Postmortem Template You can reset your postmortem template to the default sections if needed. > **Resetting Templates:** Resetting your Report Template to default only affects future postmortem reports. Existing reports are not affected. 1. Navigate to **Incidents** → **Postmortems** and select the **Settings** tab. 2. Click **Reset Template** at the top of your Report Template. In the confirmation dialog, click **Yes, Reset Template**. ## FAQ **How can I change the Slack user associated with Postmortems?** To change the associated Slack user account, revoke and replace the current Slack authentication for the Postmortems feature only. > **Slack User Limitations:** It is not currently possible to choose more than one Slack user specifically for the Postmortems feature. 1. Within your Slack user account, access the [My Authorizations](https://api.slack.com/tokens) section in the Slack API. 2. Locate the **PagerDuty Postmortems** app under the **Application & Scopes** column. 3. Click to the right of the **PagerDuty Postmortems** app to remove it from your chosen Slack user account.  *Remove PagerDuty Postmortems app* 4. While [editing a postmortem](#edit-a-postmortem) in PagerDuty, click **Connect to Slack** under the **Data Sources** section to authenticate a different Slack user account. **Is it possible to add images or documents to a postmortem?** You can insert an external link or URL in any postmortem field that hosts the image or document externally. Insert the link or URL into the section text, timeline entry summary, or the description of a manual timeline entry. When the link or URL is clicked, the image or document opens in a new tab. It is not currently possible to insert an image directly into a postmortem. --- URL: https://docs.pagerduty.com/incident-management/incidents/quick-declare # Quick Declare Open an incident before you know which technical service owns it, then assign the impacted service once it's identified. Quick Declare lets you declare an incident without first selecting an impacted technical service. It is designed for incident responders and on-call engineers who know something is wrong but do not yet know which service or team owns the problem — for example, a suspected major issue where selecting the wrong technical service could mobilize the wrong team. Quick Declare _removes the service requirement_ so you can open an incident, pull in responders, and start coordinating right away, then set the impacted service once you know it. By removing this early decision, teams can assemble faster, validate impact sooner, and route the incident to the correct team with confidence. > **Availability:** Quick Declare is available on PD Reliability Platform plans. It's also available on Free, Professional, Business, and Enterprise Incident Management (EIM) plans. It is not available for legacy Digital Operations plans. > **User Permissions:** Any user with permission to create an incident can use Quick Declare. Setting or reassigning the impacted service after declaration follows the same permissions as a standard service reassignment. ## Configuration Quick Declare does not require any configuration. It is available on the incident creation form in the web app and in Slack — the **Impacted Service** field is optional, and incidents declared without a service route through the built-in Default Mobilization Service. 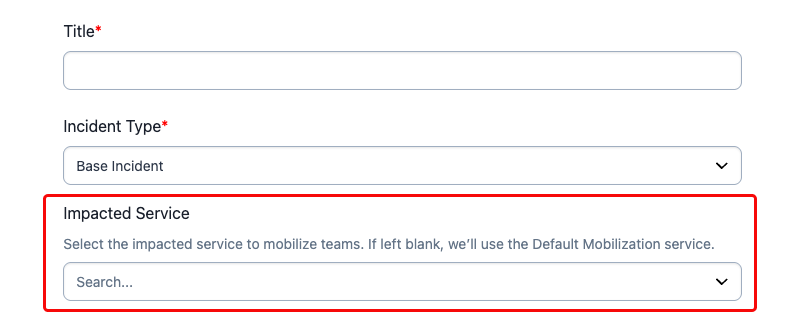 *Impacted service field*
### Disable Default Mobilization Default Mobilization is enabled by default. An administrator can disable it by navigating to **Account Settings** → **Incident Settings** and deselecting **Allow default mobilization**. By disabling this, the **Impacted Service** field will be required when declaring incidents. 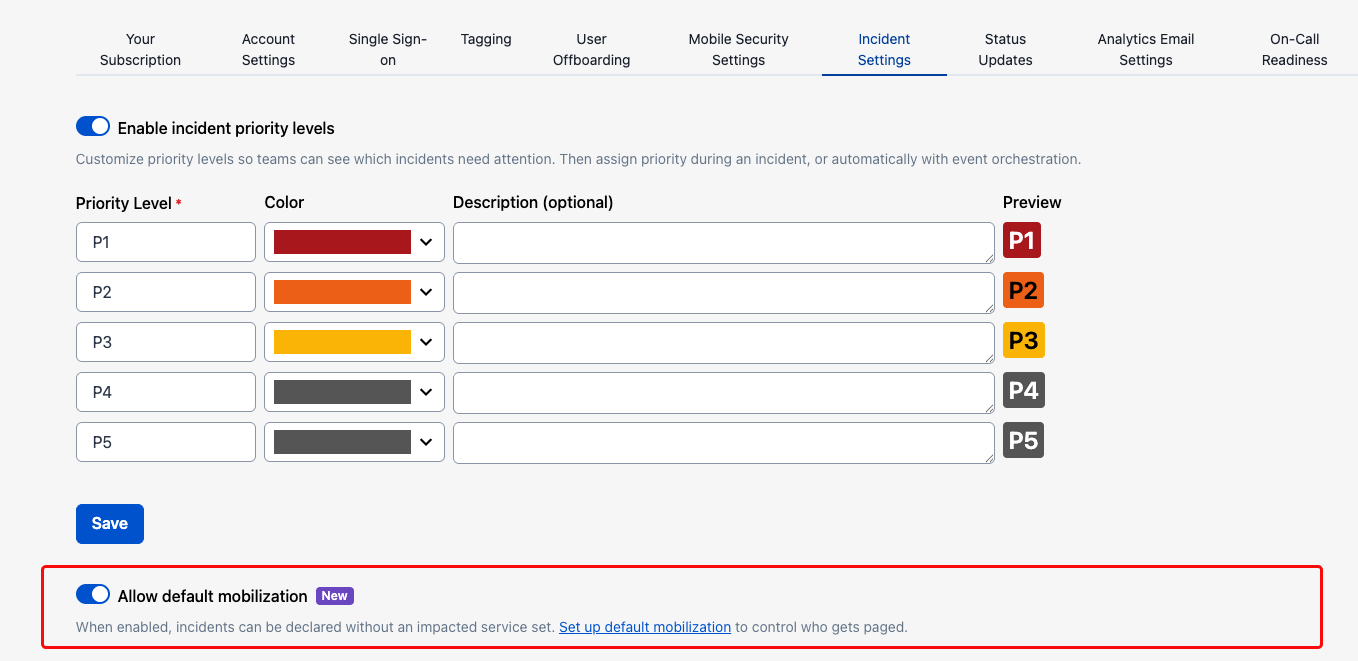 *Allow default mobilization toggle* ## Core Concepts ### The Default Mobilization Service When you declare an incident without selecting a technical service, PagerDuty routes it to a built-in service called the Default Mobilization Service, so a serviceless incident never goes unassigned. What happens next depends on whether its escalation policy has responders assigned: by default the policy is empty, so no one is paged automatically — you become the incident owner and the incident is acknowledged. If an administrator has assigned responders, they are notified as the first responders. Either way, setting the impacted service is always the next step toward resolving the incident. For how the Default Mobilization Service is structured, how to configure its escalation policy, and full behavior details, see [Default Mobilization Service](/incident-management/services/default-mobilization-service). ### Impacted Service Display When an incident is declared without a technical service, its Impacted Service shows as `--` (not set) on the incident details page and in the incident list, so it is clear that a service has not yet been assigned.  *Impacted service display*
## Use Quick Declare ### Declare an Incident in the Web App 1. Click **+ New Incident**. 2. Enter an incident title. 3. Leave the **Impacted Service** field blank. The field is optional, and there is no required-field indicator. 4. Click **Declare**. The incident is created and routed through the Default Mobilization Service, and a call to action appears to add responders and set the impacted service. ### Declare an Incident in Slack 1. In your Slack channel, run `/pd declare`. 2. Enter the incident name. 3. Leave **Impacted Service** unselected. The field is optional. 4. Click **Declare**. A confirmation card appears; its content depends on how the Default Mobilization Service escalation policy is configured. | Escalation Policy Configuration | Confirmation Card | | :------------------------------ | :--------------------------------------------------------------------------------------------------------- | | Responders configured | Confirms that responders were notified, and exposes **Page** and **Set Impacted Service**. | | No responders configured | Notes that no responders were notified, and offers the same **Page** and **Set Impacted Service** actions. | > **Note:** To declare an incident from Slack, your Slack account must be linked to a PagerDuty user. Unlinked Slack users cannot declare an incident and see an error message. ### Set the Impacted Service or Add Responders Once the incident is open, you have two primary next steps. - **Set the impacted service.** Setting the impacted service on an open Quick Declare incident works as a standard service reassignment — it routes the incident to the correct team and triggers that service's escalation path. Once set, the incident behaves like any other incident tied to that service. - **Add responders.** You can page additional users or escalation policies into the incident at any time, whether or not a service has been set. ### Resolve a Quick Declare Incident Sometimes an early signal turns out to be a false positive. You do not need to assign a technical service before resolving. An incident still assigned to the Default Mobilization Service can be resolved normally — there is no block and no requirement to pick a service first. > **Example:** A report comes in that login is broken. You declare an incident (Impacted Service shows `--`), quickly determine it is a false positive, and resolve it without ever assigning it to a service or mobilizing a team. > **Mobile:** On the mobile app, the Default Mobilization Service is hidden from service selection. Existing incident workflows are unaffected. Declaring an incident without a service from mobile may be added in a later release. ## FAQ **Do I have to select a service to declare an incident?** No. The impacted service is optional. If you do not select one, the incident routes through the Default Mobilization Service and its Impacted Service shows as `--`. **Will declaring without a service page anyone?** Only if an administrator has configured responders on the Default Mobilization Service escalation policy. By default, that policy is empty, so no one is paged automatically. You become the owner and the incident is acknowledged. **How do I get the incident to the right team?** Set the impacted service on the open incident. This performs a standard service reassignment and routes the incident to that service's on-call responders. **Can I resolve an incident that never had a service assigned?** Yes. You can resolve directly from the Default Mobilization Service without assigning a technical service first. **Can an administrator require a service on incident creation?** An account-level setting to require a service on incident creation preserves the previous behavior for accounts that want it. When that setting is off, Quick Declare is enabled. See [Disable Default Mobilization](/incident-management/incidents/quick-declare#disable-default-mobilization). --- URL: https://docs.pagerduty.com/incident-management/incidents/reassign-incidents # Reassign Incidents Reassign incidents to escalation levels, escalation policies, or specific users. If the assigned responder cannot respond to a PagerDuty incident, you may choose to reassign the incident to the next user on the current escalation level, to a different escalation policy, or to a specific user. ## Reassign an Incident There are three methods of reassigning an incident: - **Reassign to an Escalation Level (Recommended)**: Reassigning an incident to an [escalation level](/incident-management/schedules/escalation-policies#escalation-rules) means escalating the incident to the next user in its current escalation policy. This method is preferred because the escalation policy continues to cycle through escalation rules until a user acknowledges the incident. - **Reassign to an Escalation Policy (Recommended)**: Reassigning the incident to a different [escalation policy](/incident-management/schedules/escalation-policies) than the one currently being used is also ideal. The escalation policy continues to cycle through escalation rules until a user acknowledges the incident. - **Reassign to a User**: Reassigning the incident to an individual [user](/account-admin/manage-users) only notifies that user. The incident’s escalation policy will no longer be used, and other users will not be notified if the selected user does not acknowledge the incident. > **Low-Urgency Incidents:** You cannot reassign [low-urgency](/incident-management/services/configurable-service-settings#notification-urgency) PagerDuty incidents to a specific escalation level. You can, however, reassign them to an escalation policy or a user. **Reassign an Incident in the Web App** 1. Click an incident’s **title** to go to its detail page and click **Reassign**. 2. Select the desired **Escalation Policy**, **User**, or **Escalation Level** from their respective tabs in the dropdown. 3. Click **Reassign**. ### Reassign Multiple Incidents 1. Navigate to the **Incidents** page. 2. Select the checkbox to the left of each incident and click **Reassign**.  *Reassign multiple incidents* 4. Select the desired **Escalation Policy**, **User**, or **Escalation Level** from their respective tabs in the dropdown. 5. Click **Reassign**. **Reassign an Incident in the Mobile App** 1. Tap the **incident** that you want to reassign. 2. Tap **More** in the bottom right and tap **Reassign**, or scroll through the incident actions in the Triage tab and tap **Reassign**. 3. Select one of the following based on your preferences: - **To reassign to a different escalation policy**: In the **Escalation Policies** tab, select your preferred **escalation policy**. - **To reassign to the next user on the escalation level**: In the **Users** tab, select a user under **This Policy**. - **To reassign to a different user**: In the **Users** tab, select a user under **All Users**. 4. Tap **Reassign** to confirm. ### Reassign Multiple Incidents 1. On the **Open Incidents** screen, tap in the top right and select **Select Incidents**. 2. Select the radio buttons to the left of each incident you want to reassign, tap again, and select **Reassign**. 3. Select one of the following based on your preferences: - **To reassign to a different escalation policy**: In the **Escalation Policies** tab, select your preferred **escalation policy**. - **To reassign to the next user on the escalation level**: In the **Users** tab, select a **user** under **This Policy**. - **To reassign to a different user**: In the **Users** tab, select a **user** under **All Users**. 4. Tap **Reassign** to confirm. **Reassign an Incident via API** To learn more about reassigning incidents via API, refer to the [Manage Incidents API Documentation](/developer/api/reference/rest/incidents/update-incidents). ## Escalate an Incident Escalation assigns the incident to another user on the incident's current escalation policy. You may select the next user from the [escalation level](/incident-management/schedules/escalation-policies#escalation-rules) you are on, or from a different escalation level. Escalating is the same as [reassigning to an escalation level](#reassign-an-incident), but this action is also available for quick and easy use under the **Escalate** button on PagerDuty incidents. > **Low-Urgency Incidents:** You cannot escalate [low-urgency](/incident-management/services/configurable-service-settings#notification-urgency) PagerDuty incidents. You can escalate an incident in multiple ways: **Escalate an Incident in the Web App** 1. Click an incident’s **Title** to go to its detail page. 2. Click **Escalate**. 3. Select the desired **user** from the dropdown. The incident automatically escalates to that user. **Escalate an Incident in the Mobile App** 1. Tap the **incident** that you want to escalate. 2. Tap **More** in the bottom right and tap **Escalate**, or scroll through the incident actions in the Triage tab and tap **Escalate**. 3. Select the desired **user** from the list and tap **Escalate** in the confirmation dialog that appears. **Escalate an Incident via SMS** To escalate an incident via SMS, use the code in your SMS notification (see example below). Escalating via SMS assigns an incident to the next user on call in the escalation policy. You can only escalate to the next on-call user in the escalation policy. To escalate to another user, you must reassign the incident in the PagerDuty mobile or web app.  *Escalate an incident via SMS* > **Response Numbers:** The response numbers to acknowledge, resolve, and escalate incidents via SMS may change depending on the number of incidents in your account and any notifications you have already received. Check the SMS carefully for the correct response numbers for your incidents, as the response number shown in the example screenshot may not be valid for your incidents. **Escalate an Incident via API** To learn more about escalating incidents via API, refer to the [Manage Incidents API Documentation](/developer/api/reference/rest/incidents/update-incidents). --- URL: https://docs.pagerduty.com/incident-management/incidents/renotify-a-responder # Renotify a Responder Re-send a notification to a specific requested responder, or cancel a notification still pending, without paging others. Renotify responders after an incident has started. - [Renotify a requested responder with a new notification](#renotify-a-responder) - [Cancel a notification that is still pending](#cancel-a-notification) Each action is recorded in the incident timeline so that the audit trail remains complete. > **Availability:** This feature is available on PD Reliability Platform plans. It's also available on Business, Enterprise for Incident Management and Digital Operations (Legacy) plans. Contact the [Sales Team](https://www.pagerduty.com/contact-sales/) to upgrade to a plan that includes this feature. ## Renotify a Responder Use Renotify to send a new notification to one or more responders who were already requested for the incident. This allows you to re-engage specific responders without disrupting other team members. 1. On the **Incidents** page, select the incident title to open the incident details. 2. In the **Responders** section, locate the responder you want to renotify and select **(…)** → **Renotify**. 3. Add a message to include with the notification. 4. (Optional) Add a dial-in number and meeting URL if needed. 5. Click **Renotify**. ## Cancel a Notification Use Cancel Notification to stop delivery attempts for a request that is still in progress. This allows you to cancel a notification to a specific responder without disrupting other team members. 1. On the **Incidents** page, select the incident title to open the incident details. 2. In the **Responders** section, select **(…)** → **Cancel Notification**. > **Cancelled Notification:** If a notification has been cancelled, the overflow menu **(...)** will be replaced with a **Renotify** button. --- URL: https://docs.pagerduty.com/incident-management/incidents/reopen-incidents # Reopen Incidents Reopen previously-resolved incidents You can reopen an incident if an issue reoccurs or requires further action after resolution. Reopening an incident eliminates the need to create duplicate incidents when work resumes on previously-resolved issues. A reopened incident retains all incident context, notes, and history while enabling flexible assignment options. > **Availability:** Reopen Incidents is available to all pricing plans, except Digital Operations (Legacy). ## ITSM Integration Support | Integration | Support Status | Behavior | | --- | --- | --- | | Jira Server | Supported _(Configuration Needed)_ | Reopen is an event you can map to a Jira status. Configure the **Reopen** step to the corresponding Jira status field. Jira project workflows must allow a transition from Closed to Open or In Progress based on your integration status mapping. If this transition is not enabled, the Jira issue does not reopen when the PagerDuty incident is reopened. Refer to [Jira: Allow issues to be reopened](https://support.atlassian.com/jira/kb/how-to-modify-your-workflow-to-allow-issues-to-be-reopened/). | | Jira Cloud | Partial | When you reopen an incident, the linked Jira work item moves to the status mapped to **Triggered**. All other mapped incident fields, including notes, priority, and subsequent status changes, continue to sync to the associated Jira tickets after reopening. Jira project workflows must allow a transition from Closed to Open or In Progress. If this transition is not enabled, the Jira issue does not reopen. Refer to [Jira: Allow issues to be reopened](https://support.atlassian.com/jira/kb/how-to-modify-your-workflow-to-allow-issues-to-be-reopened/). | | ServiceNow | Not Yet Supported | This integration has the feature disabled by default within [Account Settings](#manage-reopen-incidents-settings). Linked ServiceNow incidents only reflect the earliest resolution date of the PagerDuty incident and the original assignee even after a reopen. Reopening a ServiceNow incident creates a new, linked PagerDuty incident. | | ServiceNow CSM | Partial | Does not yet support reopening as an action from the ServiceNow CSM side. Incident status and other synced data continue to sync after reopening. | | Salesforce | Partial | Does not yet support reopening as an action from the Salesforce side. Incident status correctly reflects within the Salesforce integration after a reopen. Syncing mapped fields continues to work after a reopen. | | Zendesk | Partial | Does not yet support reopening as an action from the Zendesk side. Incident status correctly reflects within the Zendesk integration after a reopen. Syncing mapped fields continues to work after a reopen. | ## Reopen an Incident To reopen a resolved incident: 1. Navigate to the desired incident in PagerDuty. - You can find a resolved incident by navigating to **Incidents** → **All Incidents** → **Resolved** tab and using the available filters to locate the incident. - You can also find a resolved incident by navigating to the [service](/incident-management/services/service-directory) the incident belongs to and locating it in the **Resolved Incidents** list. 2. From the incident’s details page, click **Reopen**. 3. In the modal that appears, under **Assignee**, select a **user** or **escalation policy** to assign the incident to. **Note**: The **Assign to** dropdown defaults to the service’s assigned escalation policy if you do not make a selection. When an incident is reassigned, it defaults to the most recently assigned escalation policy.  *Select an assignee for the reopened incident* 4. Click **Reopen** to reopen and reassign the incident. Once reopened, the following occurs: - If you assigned the incident to yourself, the incident's [status](/incident-management/incidents/overview#incident-statuses) updates to **Acknowledged**. Otherwise, the incident’s [status](/incident-management/incidents/overview#incident-statuses) updates to **Triggered**, and it notifies the assigned users according to their notification rules. - A **Reopened** label appears above the incident’s title while the incident remains open. - The [incident timeline](/incident-management/incidents/overview#incident-timeline) includes an entry stating the incident was reopened and assigned.  *Reopened incident label above the incident title* ## Manage Reopen Incidents Settings You can manage account-wide access to the Reopen Incidents feature in your Account Settings. > **Required User Permissions:** Responder, manager, global admin, and account owner roles can manage access to the Reopen Incidents feature. 1. Navigate to **User Icon** → **Account Settings** → **Incident Settings**. 2. Under **Reopen Incidents**, you can toggle **Allow reopening incidents** to the **on** or **off** position. --- URL: https://docs.pagerduty.com/incident-management/incidents/required-fields-on-resolve # Required Fields on Resolve Customize incident resolution forms to capture critical incident data, ensure consistency, and streamline post-incident analysis. The Required Fields on Resolve feature allows you to tailor the incident resolution experience to your team's needs. By configuring which fields appear, adding custom options, and setting required fields, you can ensure every incident captures the most relevant and structured information. This streamlines the resolution process and guarantees consistent data collection for post-incident analysis and reporting. The Required Fields on Resolve feature includes: - Customized fields in the order you specify on the [Incident Resolution Form](#configure-an-incident-resolution-form) - Clearly marked required fields (**Enterprise for Incident Management plan only**) - Optional fields for additional context - The standard resolution notes field > **Required User Permissions:** Global Admins and Account Owners can configure Incident Resolution Forms. > **Supported Interfaces:** Required fields on resolution are supported in the web app, Slack, and mobile app only. They are not supported in the following cases, where the Incident Resolution Form does not appear and incidents resolve without required details being captured: > > - Resolving incidents via SMS or voice notifications. > - Manually resolving an incident's alerts from the Alerts section of the incident's details page. This resolves the underlying incident automatically, and you will not be prompted for required fields or a resolution note. ## Configure an Incident Resolution Form > **Prerequisites:** You must first [configure Incident Types](/incident-management/incidents/incident-types#configure-incident-types) with [Custom Fields](/incident-management/incidents/custom-fields-on-incidents#configure-custom-fields) before configuring an Incident Resolution Form. 1. Navigate to **Incidents** → **Incident Types**. 2. Select the **Forms** tab. 3. Click **Add Field** to add fields to the resolve form. 4. Select the field(s) you want to add. Available fields include: - Fields specific to your incident type (for example, Root Cause, Customer Impact) - Inherited fields from base types (for example, Environment URL) - System fields (for example, Priority) 5. _(Optional, Enterprise for Incident Management plans only)_ Select the **Required** checkbox to make the field(s) required to resolve the incident. 6. Click **Add Fields** to confirm your selection. ## Edit Field Order You can edit the order in which fields appear on your Incident Resolution Form. 1. Navigate to **Incidents** → **Incident Types**. 2. Select the **Forms** tab. 3. Click to the right of the field you want to move. 4. Select **Move Up** or **Move Down** to arrange fields in your preferred order. > **Tip:** Position the most important fields at the top of the form. ## Test Incident Resolution Form User Experience To preview the form: 1. Navigate to an open incident. 2. Click **Resolve** to preview how the form appears to end users. 3. Verify that required fields are properly marked and that the field order meets your needs. > **Notes:** - Field visibility and requirements are configured in the PagerDuty web app. Keep those definitions up to date to ensure consistent behavior on mobile. > - The mobile experience mirrors the web app configuration. > - Any field marked with a red asterisk is required before an incident can be resolved.
--- URL: https://docs.pagerduty.com/incident-management/incidents/visibility-console # Visibility Console Monitor real-time digital operations health through customizable, filterable modules covering incidents, services, and priorities. The Visibility Console provides users a centralized location to monitor their digital operations in real time. This feature provides NOC teams and technical stakeholders with context on their technical environment at a glance, allowing them to quickly understand the health of their digital operations. > **Availability:** This feature is available with our [PagerDuty AIOps](/ai-automation/aiops/overview) add-on. If you would like to sign up for a trial of PagerDuty AIOps features, please read [PagerDuty AIOps Trials](/ai-automation/aiops/overview#pagerduty-aiops-trials). > **End-of-Life:** Beginning October 31, 2025 for month-to-month accounts and January 31, 2026 for term accounts with active usage, Visibility Console will reach end-of-life and be removed from the PagerDuty web app. > > Please see the [FAQ](#faq) below for more information. In the PagerDuty web app, navigate to **Incidents** → **Visibility Console**. Each user has access to their own real-time Visibility Console, which is unique to their account. The console offers several [modules](#visibility-console-modules) with [global filtering](#global-filtering), which allows users to filter modules by a combination of [Teams](/account-admin/teams), services, and incident priorities. ## Configure the Visibility Console [Modules](#visibility-console-modules) can be added, moved, edited or removed from the Visibility Console. > **Personalized View:** Each user has access to a personalized Visibility Console. This means changes and adjustments in one user's account will not affect other users' views. ### Add a Module 1. Navigate to **Incidents** → **Visibility Console**. 2. Click **Add Module** and select a module. 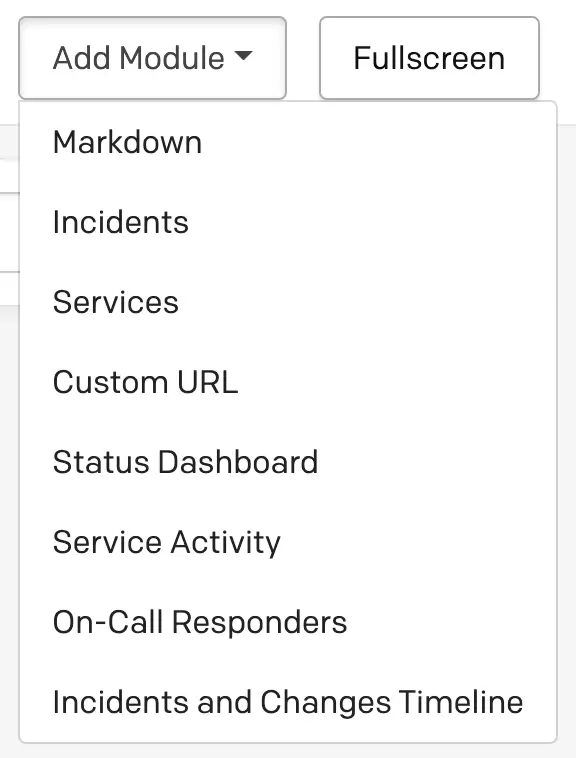 *Add module* ### Move a Module 1. Navigate to **Incidents** → **Visibility Console**. 2. Click a module’s icon and drag-and-drop to a different location in the Visibility Console.  *Move a module* #### Resize a Module You can resize a module by clicking and dragging the bottom right corner.  *Resize a module* ### Edit a Module 1. Navigate to **Incidents** → **Visibility Console**. 2. Click a module’s icon and make your desired edits. 3. Click **Save**.  *Edit a module* ### Remove a Module 1. Navigate to **Incidents** → **Visibility Console**. 2. Click a module’s icon.  *Remove a module* 3. Confirm your selection in the dialog window that appears. ### Global Filtering To show a specific group of services or incidents, you can add filter tags to the global filter bar. Click the filter bar dropdown and select your preferred tags: - **Team:** The Team tag will add all the services owned by a Team to the group of services shown. - **Service:** The service tag will add the specific service to the group of services shown. - **Priority:** The priority tag will filter the incidents module to only show incidents that have an [Incident Priority](/incident-management/incidents/incident-priority). **Note**: The priority tag only filters the Incidents module.  *Global filtering* > **Tip:** Filtering only impacts the [Incidents](#incidents), [Services](#services), [Service Activity](#service-activity), and [On-Call Responders](#on-call-responders) modules. ## Visibility Console Modules The Visibility Console is made up of many smaller modules. Data flows into the Visibility Console in real-time and each module auto-refreshes every 30 seconds. The [Incidents](#incidents), [Services](#services) and [Service Activity](#service-activity) modules load the 100 most-recent results. However, you can use a number of [global filters](#global-filtering) to narrow searches to more relevant results. ### Markdown The Markdown module allows users to add any text or notes to their console. This could be used to display instructions, add hyperlinks to frequently used documentation, link to runbooks, or take general notes during an on-call shift or investigation. ### Incidents The Incidents module displays a real-time list, based on the filters selected, of the most recent open incidents that have triggered. It sorts the incidents by most recent trigger time and shows the status, priority, title of the incident, the service impacted, and the assigned responders. The module can be filtered by **All Incidents**, **High Urgency** and **Low Urgency**.  #### Incident Actions in the Incidents Module To take action on incidents in the Incidents module, select the checkbox to the left of the incident(s) and click your desired action: **Acknowledge**, **Resolve**, **Snooze**, **Change Priority** or **Add Note**.  *Incident actions in the Incidents module* ### Services The Services module is ordered similarly to the [Service Activity](#service-activity) module and offers additional context on a service’s current state. Each service will display the associated [Team](/account-admin/teams) (if configured), the number of open incidents, the time of the last incident, and the current state of the service. 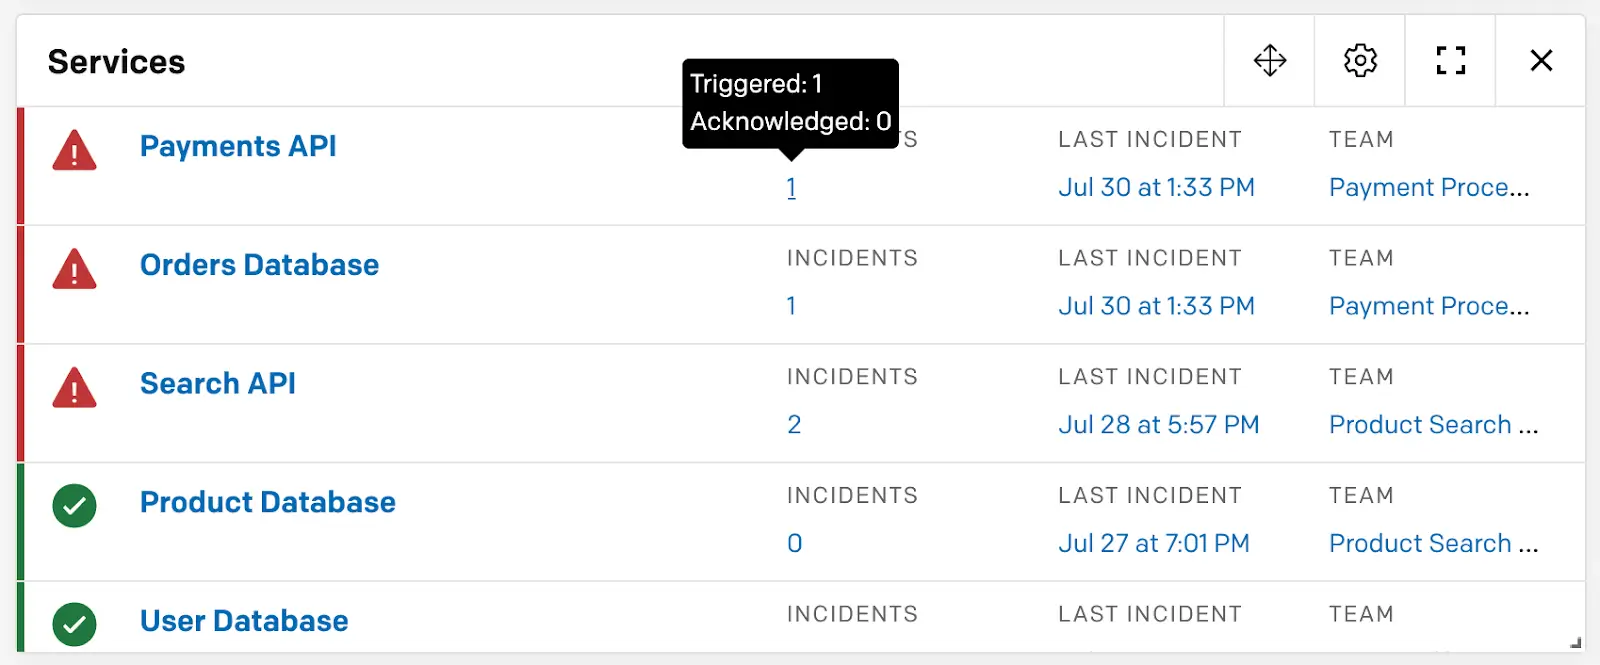 Definitions of different technical service states: - **Awaiting Response**: The service currently has one or more incidents in a triggered state waiting on a response. - **Response in Progress**: The service currently has one or more incidents in an acknowledged state waiting on resolution. - **Maintenance Window**: The service is currently in a [Maintenance Window](/incident-management/services/maintenance-windows) or is disabled, meaning any incoming events on the service will not trigger an incident. - **Without Open Incidents**: The service currently has zero open incidents. ### Custom URL The Custom URL module allows users to embed external web pages in an iframe, in order to add external monitoring to the Visibility Console. Any PagerDuty webpage is embeddable, as well as many external status pages and public dashboard URLs.  #### Security Limitations Not all web pages can be embedded, and the Custom URL module has some limitations in place to ensure security. ##### Custom URL Requirements Please ensure the following for any URL that you would like to embed: - You must use the `Content-Security-Policy: frame-ancestors` in the response header for the URL. - Xframe is obsolete in most modern browsers, but if you are running into this issue, you may need to [set the `ALLOW-FROM` field](https://developer.mozilla.org/en-US/docs/Web/HTTP/Headers/X-Frame-Options). ##### Troubleshooting URLs That Will Not Load Some URLs may not load for the following reasons: - The page has [restricted CSP](https://content-security-policy.com/). - The page explicitly [blocks Xframes](https://developer.mozilla.org/en-US/docs/Web/HTTP/Headers/X-Frame-Options). - The page cannot be served over HTTPS (PagerDuty only serves over HTTPS). ### Status Dashboard The Status Dashboard module brings in some information from the [Internal Status Page](/incident-management/communicate/internal-status-page) and adds that context to the console so users can monitor the status of their business services in one place. Click to expand a business service and show its description. If a supporting technical service is experiencing an incident, you can select the business service’s name to view a list of impacting incidents. This ensures stakeholders and response teams are always up to date with the live status of system health. 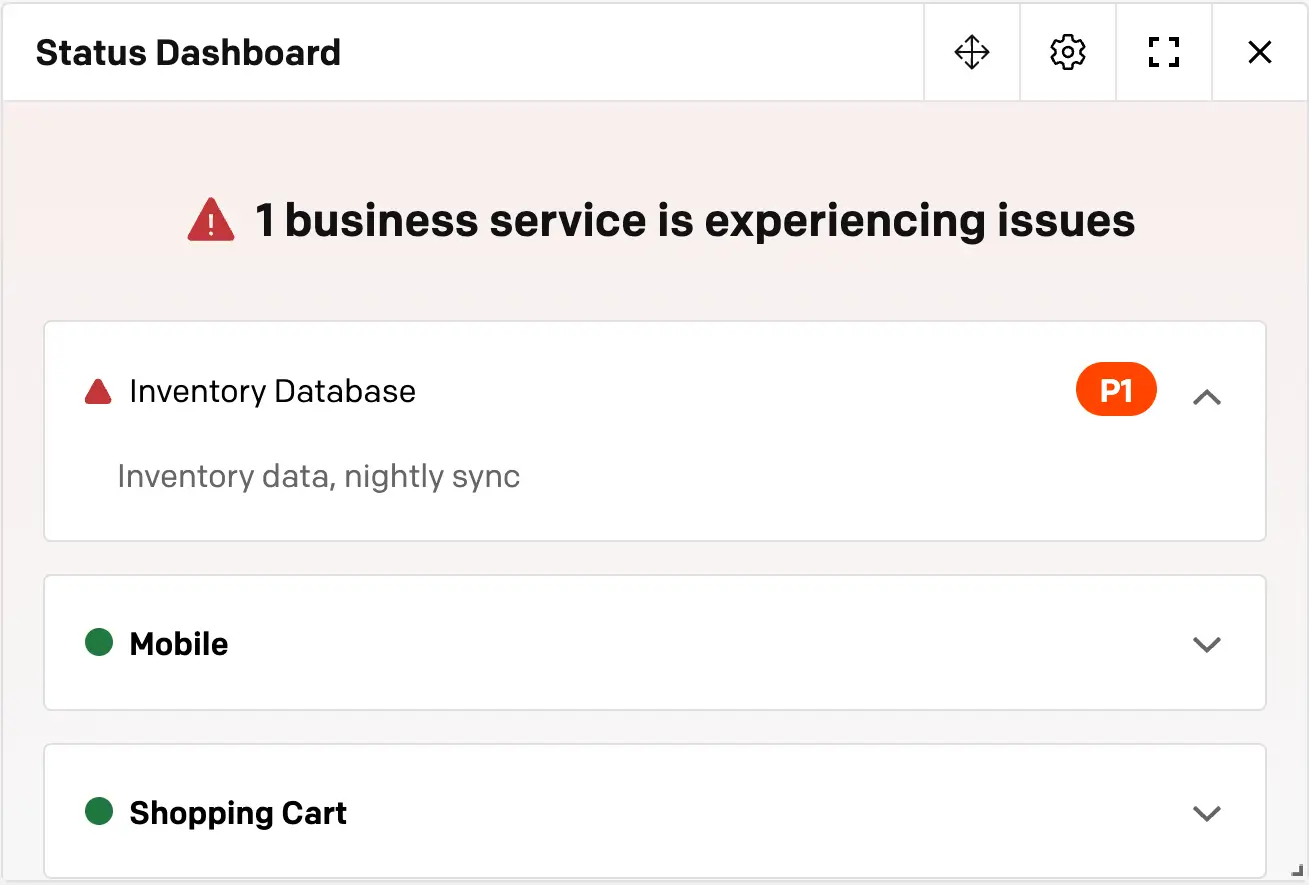 > **Tip:** The Status Dashboard module is only available to accounts who have Visibility and [Internal Status Page](/incident-management/communicate/internal-status-page) features. ### Service Activity The Service Activity module allows users to see incident activity across many of their services at once, so that they can quickly understand their digital operations health, and identify if there is a widespread major incident. This module is ordered by most recently impacted service, and will reorder itself when new incidents trigger. It has different time windows so monitoring teams can observe their digital operations in real-time, but can also see service activity in the last **7 days, 24 hours, 12 hours, 6 hours** or **1 hour**. Click each cell for more details about the incidents affecting service activity. This module can be filtered to any set of Teams and services. 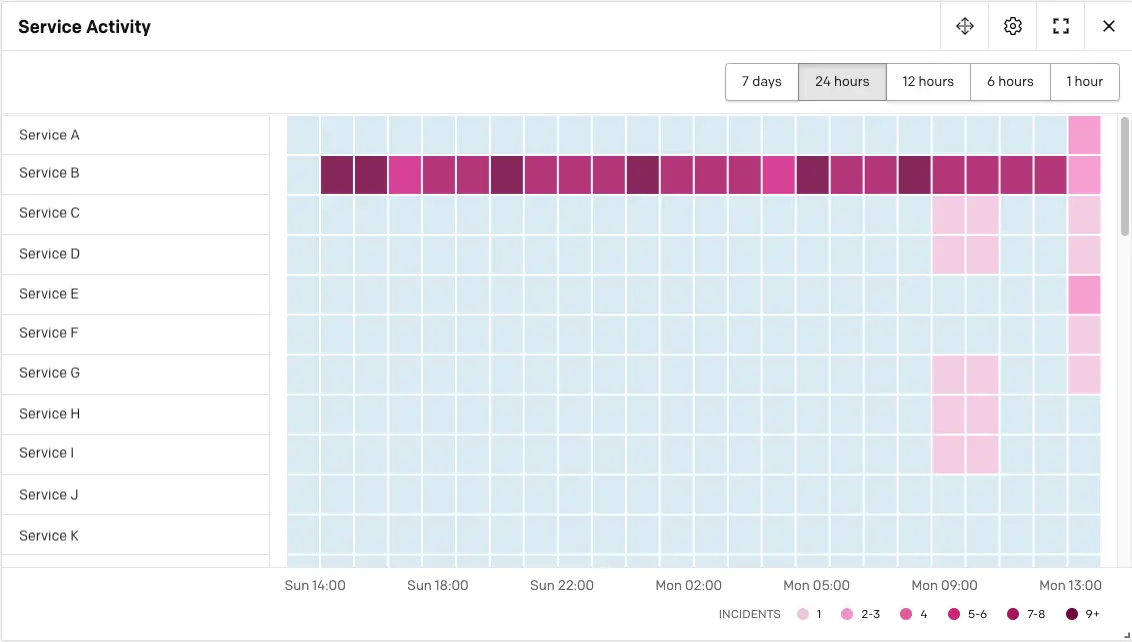 ### On-Call Responders The On-Call Responders module provides a quick and easy way to search which users are on call across all escalation policies. Use the search field or select your desired escalation policy from the list and click to view more details about the users that are currently on call. 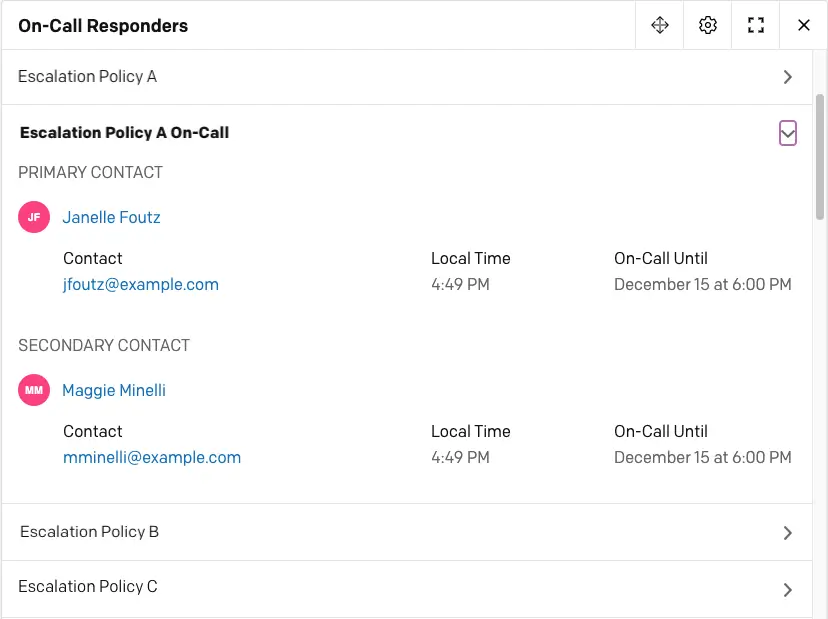 ### Incidents and Changes Timeline The Incidents and Changes Timeline module displays a timeline of incidents and change events across all services. The module can be filtered by the last **7 days, 24 hours, 12 hours, 6 hours** or **1 hour**. 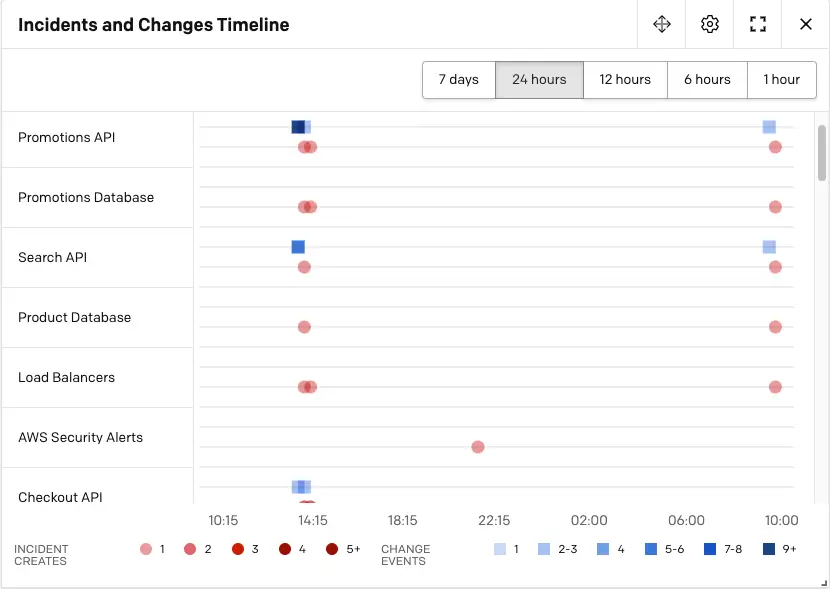 ## FAQ **What is happening to the Visibility Console?** PagerDuty is sunsetting the Visibility Console to better align our platform with evolving customer needs and deliver a unified operational experience. The core capabilities are being replaced by the [Operations Console](/ai-automation/aiops/operations-console). **When will the Visibility Console be discontinued?** - **Month-to-month accounts**: October 31, 2025 - **Term accounts with inactive usage**: January 31, 2026 - **Term accounts with active usage**: TBD **What happens after the end date?** After the sunset date, you will lose access to Visibility Console. To maintain similar functionality, you'll need to access [Operations Console](/ai-automation/aiops/operations-console), which is part of the AIOps SKU. **How do I get access to Operations Console?** - **Minimal/no usage accounts**: You must opt in by submitting your request to [this form](https://docs.google.com/forms/d/e/1FAIpQLSeGxluEYR8dcXBL7_bv2nlpm45MD9hw6H_qH4tBlTmsHX-_cg/viewform) to get Operations Console access. - **Active users**: We will provide more information, including the actual EOL date, before the end of fiscal year 2025. If you're not currently on the AIOps SKU, you'll be receiving trial access to Operations Console until the end of your current contract term. After that, you will need to purchase AIOps to ensure a seamless experience. **What replaces the Visibility Console?** The [Operations Console](/ai-automation/aiops/operations-console) replaces most Visibility Console functionality. Here's what's available: | Visibility Console Module | Replacement | | --- | --- | | Incident | Operations Console | | Service Activity | Operations Console — filter by a list of technical services and see the incident list and details. | | Service | Operations Console — filter by a list of technical services and see the incident list and details. Service Directory — equivalent incident and Team information by technical service. | | Status Dashboard | Status Page | | On-Call Responder | Schedule | | Recent Changes | AIOps → Recent Changes | | Incident Change Timeline | AIOps → Recent Changes | | Custom URL | Operations Console (via external references) | | Text/Markdown | Users can export content manually. The account team can assist with this process upon request. | **Will I lose my historical data?** Most data will transfer to the replacement modules automatically, but you will want to start using Operations Console now to match your current Visibility Console setup. **Exception**: Data in the Markdown Module must be manually copied if you want to preserve it. **Do I need to update integrations or APIs?** For most use cases, no changes are required. If you have custom workflows built around Visibility Console, contact your account team for a technical review. **What happens after my current contract term ends?** To maintain access to Operations Console after your contract term, you'll need to purchase or renew the AIOps SKU. **Will there be additional charges?** There are no additional charges for replacement functionality during your existing contract. If you choose to upgrade to AIOps, AIOps pricing applies. **What support is available during the transition?** - Operations Console Guided [Product Tour](https://pagerduty.navattic.com/operations-console) - Live demos with Solution Consultants - Direct support from your account team **What should I do to prepare?** 1. Start using Operations Console now to configure it to match your current Visibility Console setup. 2. Export any Markdown Module data you want to preserve. 3. Contact your account team with questions or for migration assistance. 4. Consider upgrading to AIOps to ensure continued access beyond your current contract term. **Where can I learn more about Operations Console?** - [Knowledge Base article](/ai-automation/aiops/operations-console) - [Product Tour](https://pagerduty.navattic.com/operations-console) - Contact your account team for personalized assistance **How does this affect compliance requirements?** Operations Console is FedRAMP-Low-authorized, providing better compliance alignment than the legacy Visibility Console. **How can I request more help?** Contact your PagerDuty account team for personalized migration support and to discuss your specific requirements. --- URL: https://docs.pagerduty.com/incident-management/incidents/why-incidents-fail-to-trigger # Why Incidents Fail to Trigger Troubleshooting common issues related to incident trigger failures There are a few reasons why an incident would fail to trigger: - [A Service Was Disabled or in a Maintenance Window](#a-service-was-disabled-or-in-a-maintenance-window) - [Event Orchestration is Configured to Suppress Certain Alerts](#event-orchestration-is-configured-to-suppress-certain-alerts) - [Email Integration Filters](#email-integration-filters) - [Email Management Rules Were Appending Triggers to Existing Incidents](#email-management-rules-were-appending-triggers-to-existing-incidents) - [No One Was On-call](#no-one-was-on-call) ## A Service Was Disabled or in a Maintenance Window When a service is disabled or in a [Maintenance Window](/incident-management/services/maintenance-windows), new incidents are not triggered or created on that service. Because an incident is not created, PagerDuty does not send notifications to the service's on-call responders. ## Event Orchestration is Configured to Suppress Certain Alerts If you have [Event Orchestration](/ai-automation/aiops/event-orchestration) configured on your account, you may have rules to suppress alerts that meet certain criteria. In those cases, an incident is not triggered. Navigate to **AIOps** → **Event Orchestration** and select the **orchestration** that contains the action rule that you would like to check. While reviewing which actions are taken, check **Incident Data** → **Basic Event** to see if the checkbox **Suppress incident and notifications** is enabled. ## Email Integration Filters If you have regex filters set up on your email integration service, check whether your email filters are [filtering out emails](/integrations/email-integration-guide/email-management-filters-and-rules#email-filters) that you want to trigger incidents. For example, if you have the following regex filter: `Trigger an alert if All of the following conditions apply: The email subject matches the regular expression CRITICAL` 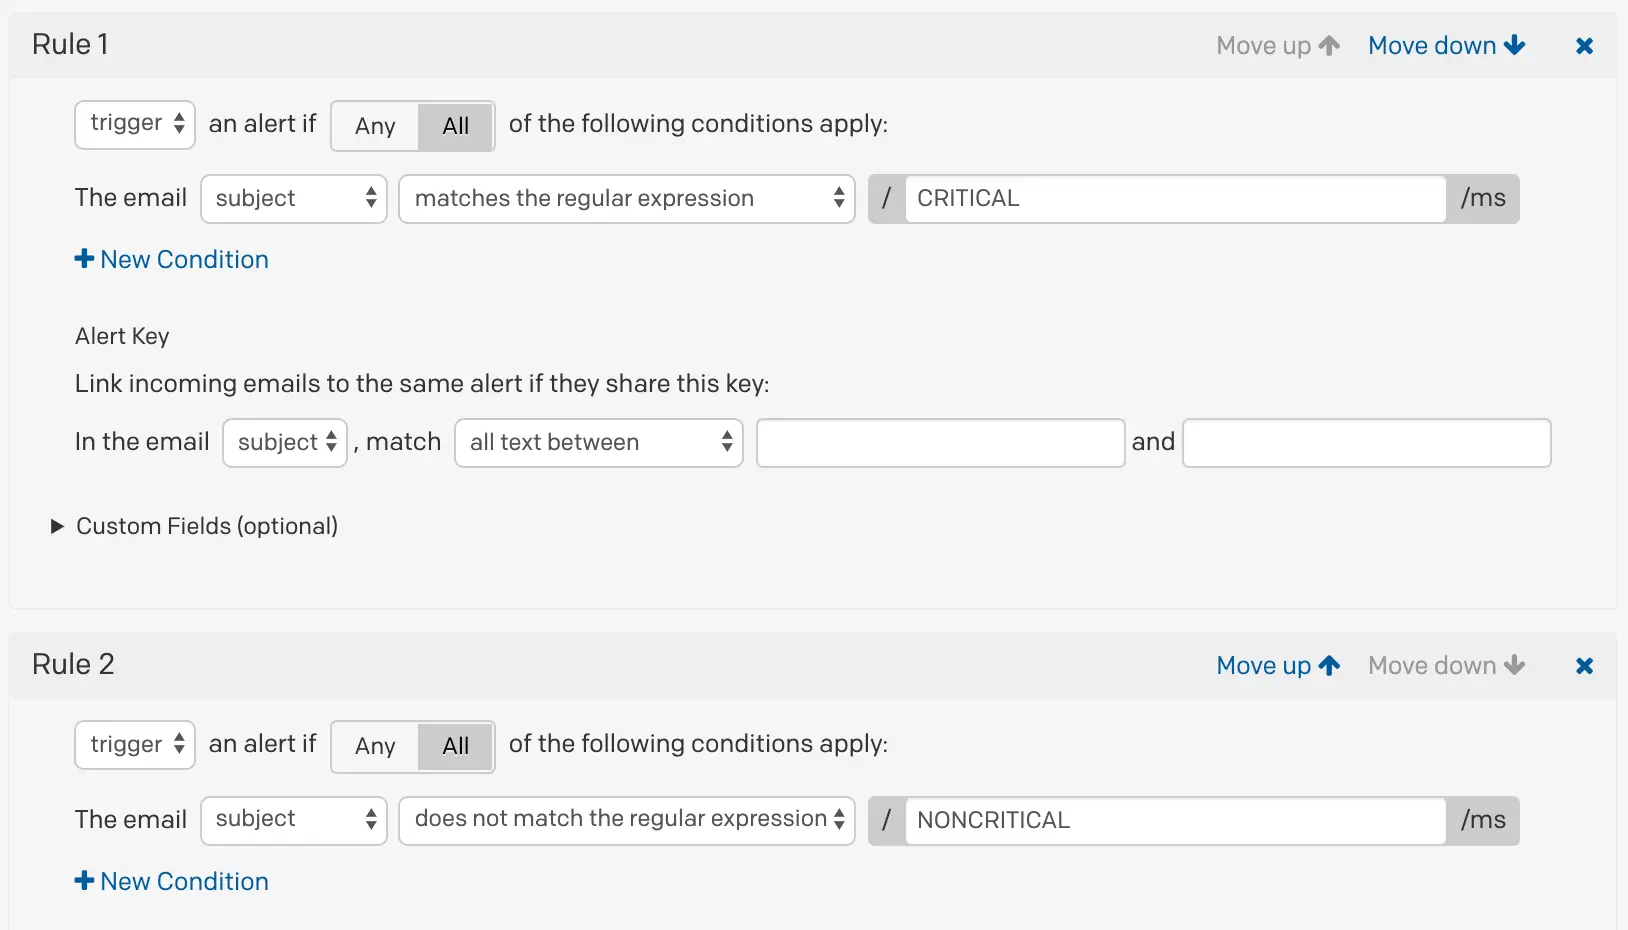 Then, emails with the subject line "PROBLEM" will not trigger incidents in PagerDuty because they are filtered out by your regex rules. - [Regex Examples](/incident-management/services/regular-expressions#examples) - [Test your regular expressions with Regex101](https://regex101.com/) (Use the Golang flavor with the `m` and `s` flags to see exactly how PagerDuty will interpret your regex). ## Email Management Rules Were Appending Triggers to Existing Incidents Email integration settings have email management rule settings, which are separate from [email filters](/integrations/email-integration-guide/email-management-filters-and-rules#email-filters). While email filters determine which emails trigger incidents for your service, incident creation settings determine how emails create new incidents. If you have either of these two email management rules for your email integration service: - **Open a new alert only if an open incident does not already exist** - **Open and resolve alerts based on custom rules** ...then, an incident was most likely appended to an existing incident, which could explain why a new incident was not created. When a trigger event is appended to an incident, it appears in the incident's timeline. [Learn more about incident creation settings](/integrations/email-integration-guide/email-management-filters-and-rules#trigger-and-resolve-alertsincidents). ## No One Was On-call If no one is on-call under a service's escalation policy, PagerDuty cannot assign a user to an incident, and **it will not create a new incident**. For example, if your escalation policy only has the following schedule associated with it, where one user is on-call from 00:00 - 08:00, and if a trigger event comes in between 08:01 - 23:59, PagerDuty will not create an incident, as no one is on call during that time. To address this issue, check the [Escalation Policy](/incident-management/schedules/escalation-policies) for your service and ensure someone is on-call when incidents are triggered. > **Trigger an Incident in the Web App:** If you try to trigger an incident through the [web app](/incident-management/incidents/overview#triggerdeclare-an-incident) while no one is on-call on the escalation policy associated with that service, you will receive the error **Incident could not be assigned**. --- URL: https://docs.pagerduty.com/incident-management/notifications # Notification Content and Behavior PagerDuty notifications sent via push, email, phone call, and SMS PagerDuty sends notifications to on-call users when an incident is assigned to them. These notifications are most commonly sent when an incident triggers or escalates. Depending on the features in your account's pricing plan, users may also receive notifications when they are added as a [responder](/incident-management/incidents/add-responders) or [subscriber](/incident-management/communicate/communicate-with-stakeholders), or when a [conference bridge](/incident-management/incidents/conference-bridge) is added to an incident. The specific [content](#notification-content) and [behavior](#notification-behavior) of these notifications are detailed below. ## Notification Content Select from the articles below for more information about a specific notification channel: - [Push Notifications](/incident-management/notifications/notification-content-and-behavior/push-notifications) - [Email Notifications](/incident-management/notifications/notification-content-and-behavior/email-notifications) - [Phone Notifications](/incident-management/notifications/notification-content-and-behavior/phone-notifications) - [SMS Notifications](/incident-management/notifications/notification-content-and-behavior/sms-notifications) - [WhatsApp](/incident-management/notifications/notification-content-and-behavior/whatsapp-notifications) ## Notification Behavior PagerDuty bundles multiple notifications together to reduce noise for users. In certain circumstances, PagerDuty may send a generic message for incident notifications. You can also test and respond to notifications. ### Notification Bundling When a user is assigned to multiple incidents, PagerDuty bundles notifications into a single summary message in an effort to reduce alert fatigue and distractions. All notification methods ([push](/incident-management/notifications/notification-content-and-behavior/push-notifications), [email](/incident-management/notifications/notification-content-and-behavior/email-notifications), [phone](/incident-management/notifications/notification-content-and-behavior/phone-notifications), and [SMS](/incident-management/notifications/notification-content-and-behavior/sms-notifications)) support notification bundling. Bundled notifications include information about all triggered incidents (i.e., incidents that are not acknowledged or resolved). The following examples assume a service named "Nagios-Shopping-Cart" has triggered five incidents within the previous minute. Here is what bundled notifications would look like for each notification method: #### Email ``` You are assigned 5 triggered incidents in PagerDuty: Please visit the following URL to manage these incidents. https://your-subdomain.pagerduty.com/incidents 1) Incident #100 Opened on: Jan 1 at 12:00pm PST Service: Nagios-Shopping-Cart Description: Emergency in the server room Link: https://service-name.pagerduty.com/i/100 ``` #### Phone `You have 5 triggered incidents on Nagios-Shopping-Cart. Press 4 to acknowledge all incidents. Press 6 to resolve all incidents. Press 0 for help or press * to repeat this message.` > **Minimize Notifications:** You can reduce the overall number of notifications that you receive by adding a delay to your [notification rules](/account-admin/user-profile/notification-rules). For example, adding a few-minutes delay allows more time for incidents to aggregate, and you can expect to receive fewer notifications during periods of high incident volume. #### SMS `ALRT: #100,#101,#102,#103,#104 on Nagios-Shopping-Cart. Reply 14:Ack all, 16:Resolv all` ### Generic Message Delivery When PagerDuty encounters issues generating the full contents of an incident notification, it sends a generic message instead. This ensures any on-call users are still alerted and can respond to incidents even if the expected details are not available in the notification. This generic message only applies to incident notifications and does not apply to other notification types. The generic message states: `You have a new incident update in PagerDuty. Open the mobile app or log in to view the full details.` ### Send Test Notifications See our [Test a Contact Method](/account-admin/user-profile/contact-information#test-a-contact-method) section for more information. ### Respond to Incident Notifications #### Respond from the Mobile App For more information about taking action on incidents in the mobile app, see [Respond to Incidents in the Mobile App](/get-started/mobile-app#respond-to-incidents-in-the-mobile-app). #### Respond to an Email Notification Responding to an email notification to acknowledge or resolve an incident is not supported. We recommend using one of the following methods to take action on an incident: - Web app ([acknowledge](/incident-management/incidents/overview#acknowledge-an-incident), [resolve](/incident-management/incidents/overview#resolve-an-incident)) - [Mobile app](/get-started/mobile-app#respond-to-incidents-in-the-mobile-app) - [Phone notification](#respond-to-a-phone-notification) - [SMS notification](#respond-to-an-sms-notification) #### Respond to a Phone Notification Similar to [SMS notifications](#respond-to-an-sms-notification), you can respond to phone notifications to acknowledge, resolve, or escalate an incident. An example phone notification states: `PagerDuty Alert: You have one triggered incident on Signal Sciences. The failure is "Check outside normal range - Warning". Press 4 to acknowledge. Press 6 to resolve. Press 8 to escalate to the level 2 on call, User 2`. Enter the appropriate number on your phone's keypad to take one of the following actions: - **Acknowledge** - **Resolve** - **Escalate**. This option is available if there is another level in the service's [escalation policy](/incident-management/schedules/escalation-policies). #### Respond to an SMS Notification When you receive an SMS incident notification, you are prompted to **Ack**, **Resolv**, or **Escal8** it. The specific code you receive for each action may vary, but **Ack** will always end in `4`, **Resolv** will always end in `6`, and **Escal8** will always end in `8`. The following example assumes there is an incident on a service named "Signal Sciences": 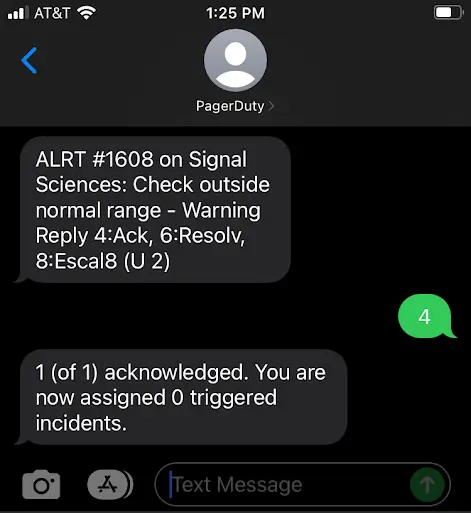 *Acknowledge an incident via SMS notification* --- URL: https://docs.pagerduty.com/incident-management/notifications/notification-content-and-behavior # Notification Content and Behavior PagerDuty notifications sent via push, email, phone call, and SMS PagerDuty sends notifications to on-call users when an incident is assigned to them. These notifications are most commonly sent when an incident triggers or escalates. Depending on the features in your account's pricing plan, users may also receive notifications when they are added as a [responder](/incident-management/incidents/add-responders) or [subscriber](/incident-management/communicate/communicate-with-stakeholders), or when a [conference bridge](/incident-management/incidents/conference-bridge) is added to an incident. The specific [content](#notification-content) and [behavior](#notification-behavior) of these notifications are detailed below. ## Notification Content Select from the articles below for more information about a specific notification channel: - [Push Notifications](/incident-management/notifications/notification-content-and-behavior/push-notifications) - [Email Notifications](/incident-management/notifications/notification-content-and-behavior/email-notifications) - [Phone Notifications](/incident-management/notifications/notification-content-and-behavior/phone-notifications) - [SMS Notifications](/incident-management/notifications/notification-content-and-behavior/sms-notifications) - [WhatsApp](/incident-management/notifications/notification-content-and-behavior/whatsapp-notifications) ## Notification Behavior PagerDuty bundles multiple notifications together to reduce noise for users. In certain circumstances, PagerDuty may send a generic message for incident notifications. You can also test and respond to notifications. ### Notification Bundling When a user is assigned to multiple incidents, PagerDuty bundles notifications into a single summary message in an effort to reduce alert fatigue and distractions. All notification methods ([push](/incident-management/notifications/notification-content-and-behavior/push-notifications), [email](/incident-management/notifications/notification-content-and-behavior/email-notifications), [phone](/incident-management/notifications/notification-content-and-behavior/phone-notifications), and [SMS](/incident-management/notifications/notification-content-and-behavior/sms-notifications)) support notification bundling. Bundled notifications include information about all triggered incidents (i.e., incidents that are not acknowledged or resolved). The following examples assume a service named "Nagios-Shopping-Cart" has triggered five incidents within the previous minute. Here is what bundled notifications would look like for each notification method: #### Email ``` You are assigned 5 triggered incidents in PagerDuty: Please visit the following URL to manage these incidents. https://your-subdomain.pagerduty.com/incidents 1) Incident #100 Opened on: Jan 1 at 12:00pm PST Service: Nagios-Shopping-Cart Description: Emergency in the server room Link: https://service-name.pagerduty.com/i/100 ``` #### Phone `You have 5 triggered incidents on Nagios-Shopping-Cart. Press 4 to acknowledge all incidents. Press 6 to resolve all incidents. Press 0 for help or press * to repeat this message.` > **Minimize Notifications:** You can reduce the overall number of notifications that you receive by adding a delay to your [notification rules](/account-admin/user-profile/notification-rules). For example, adding a few-minutes delay allows more time for incidents to aggregate, and you can expect to receive fewer notifications during periods of high incident volume. #### SMS `ALRT: #100,#101,#102,#103,#104 on Nagios-Shopping-Cart. Reply 14:Ack all, 16:Resolv all` ### Generic Message Delivery When PagerDuty encounters issues generating the full contents of an incident notification, it sends a generic message instead. This ensures any on-call users are still alerted and can respond to incidents even if the expected details are not available in the notification. This generic message only applies to incident notifications and does not apply to other notification types. The generic message states: `You have a new incident update in PagerDuty. Open the mobile app or log in to view the full details.` ### Send Test Notifications See our [Test a Contact Method](/account-admin/user-profile/contact-information#test-a-contact-method) section for more information. ### Respond to Incident Notifications #### Respond from the Mobile App For more information about taking action on incidents in the mobile app, see [Respond to Incidents in the Mobile App](/get-started/mobile-app#respond-to-incidents-in-the-mobile-app). #### Respond to an Email Notification Responding to an email notification to acknowledge or resolve an incident is not supported. We recommend using one of the following methods to take action on an incident: - Web app ([acknowledge](/incident-management/incidents/overview#acknowledge-an-incident), [resolve](/incident-management/incidents/overview#resolve-an-incident)) - [Mobile app](/get-started/mobile-app#respond-to-incidents-in-the-mobile-app) - [Phone notification](#respond-to-a-phone-notification) - [SMS notification](#respond-to-an-sms-notification) #### Respond to a Phone Notification Similar to [SMS notifications](#respond-to-an-sms-notification), you can respond to phone notifications to acknowledge, resolve, or escalate an incident. An example phone notification states: `PagerDuty Alert: You have one triggered incident on Signal Sciences. The failure is "Check outside normal range - Warning". Press 4 to acknowledge. Press 6 to resolve. Press 8 to escalate to the level 2 on call, User 2`. Enter the appropriate number on your phone's keypad to take one of the following actions: - **Acknowledge** - **Resolve** - **Escalate**. This option is available if there is another level in the service's [escalation policy](/incident-management/schedules/escalation-policies). #### Respond to an SMS Notification When you receive an SMS incident notification, you are prompted to **Ack**, **Resolv**, or **Escal8** it. The specific code you receive for each action may vary, but **Ack** will always end in `4`, **Resolv** will always end in `6`, and **Escal8** will always end in `8`. The following example assumes there is an incident on a service named "Signal Sciences":  *Acknowledge an incident via SMS notification* --- URL: https://docs.pagerduty.com/incident-management/notifications/notification-content-and-behavior/email-notifications # Email Notifications See sample subject lines and body content PagerDuty sends by email for incident triggers, responses, and status updates. PagerDuty can notify users via email when various incident lifecycle events occur. This article details what such notifications may look like, though the exact content may vary. PagerDuty sends email notifications from `no-reply@pagerduty.com`. > **Contact Information and Notification Rules:** For more information about adding contact methods and configuring notification rules, see [Contact Information](/account-admin/user-profile/contact-information) and [Notification Rules](/account-admin/user-profile/notification-rules) in the [User Profile](/account-admin/user-profile) article. ## Email Notification Content | PagerDuty Action | Subject Line | Body | | --- | --- | --- | | An incident triggers and notifies the on-call user | **One incident assigned:** "\[PagerDuty Alert] You have 1 TRIGGERED Incidents (`[4cb96]`)" **If you are assigned multiple incidents, PagerDuty will bundle incident notifications into one email:** "\[PagerDuty Alert] You have `[3]` TRIGGERED Incidents (`[db97d]`)" | **HTML Email:** "Hello `[User Name]`, you have `[#]` open incident(s) assigned to you: `[Incident Number]`, `[Incident Title]`, `[View Incident Link]`, `[Details]`, `[Meeting URL]`, `[Dial-In Number]`, `[Status]`, `[Urgency]`, `[Assigned To]`, `[Opened On]`, `[Service]`, `[Escalation Policy]`" **Plain Text Email:** "Hello `[User Name]`, You are assigned `[#]` triggered incident in PagerDuty. Please visit the following URL to manage this incident: `https://[subdomain].pagerduty.com/incidents`. `[Incident Number]`, `[Opened On]`, `[Service]`, `[Description]`, `[Incident Link]`, `[Escalation Policy]`, `[Meeting URL]`, `[Dial-In Number]`, `[Details]`. You can disable these messages by adjusting your notification methods: `https://[subdomain].pagerduty.com/users/PXXXXXX`" \* _If applicable_ | | A user is added as a [responder](/incident-management/incidents/add-responders) upon incident trigger | "PagerDuty response requested" | "Your response is requested: Please help with "\[#`[Incident Number]`] `[Incident Title]`" `https://[subdomain].pagerduty.com/incidents/XXXXXXXXXX`" | | A user is added as a [responder](/incident-management/incidents/add-responders) to an _existing_ incident | "PagerDuty response requested" | "Your response is requested: Please help with "`[Incident Title]`" `https://[subdomain].pagerduty.com/incidents/XXXXXXXXXX` `[Meeting URL]`\* `[Dial-In Number]`_"_ _If applicable_ | | A user receives a [Status Update](/incident-management/communicate/communicate-with-stakeholders) to an incident they are assigned or subscribed to | "\[PagerDuty Status] `[incident status]`: `[incident name]`" | "`[user]` updated: `[incident number]`, `[incident title]`, `[trigger date and time]`, `[service name]`, `[user(s) assigned to the incident]`, `[View Incident link]`, `[incident status]`, `[status update]`, `[View Status Page link]`" | | A user is about to go on call ([On-Call Handoff Notification](/incident-management/schedules/escalation-policies)) | "\[PagerDuty] `[user name]` is going on call for `[escalation policy]` (Level `[X]` - `[schedule name]`)" | "`[user name]` is going on call for the following escalation policy in 1 hour: Escalation Policy: `[escalation policy]` (used by X services) Level 1 (`[schedule name]`) `[date and time]` Override here: `https://subdomain.pagerduty.com/schedules/PXXXXXX`" | ### HTML Email Notifications Users can choose whether they’d like to receive HTML notifications in their web app user profile: 1. Go to **User Icon** → **My Profile** → **Contact Information** tab. 2. In the **Email** section, click to edit your desired email address, _or_ **Add Email Address** if you would like to add a new one. 3. Check the **Send HTML Emails** checkbox. - If this option is unselected, PagerDuty will send email notifications in plain text. 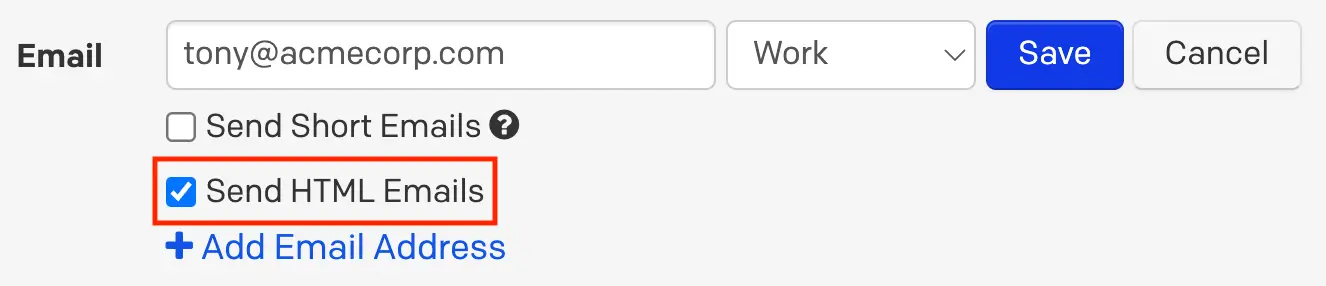 *Enable or disable HTML emails* 4. Click **Save**. Here is an example of a PagerDuty HTML email notification: 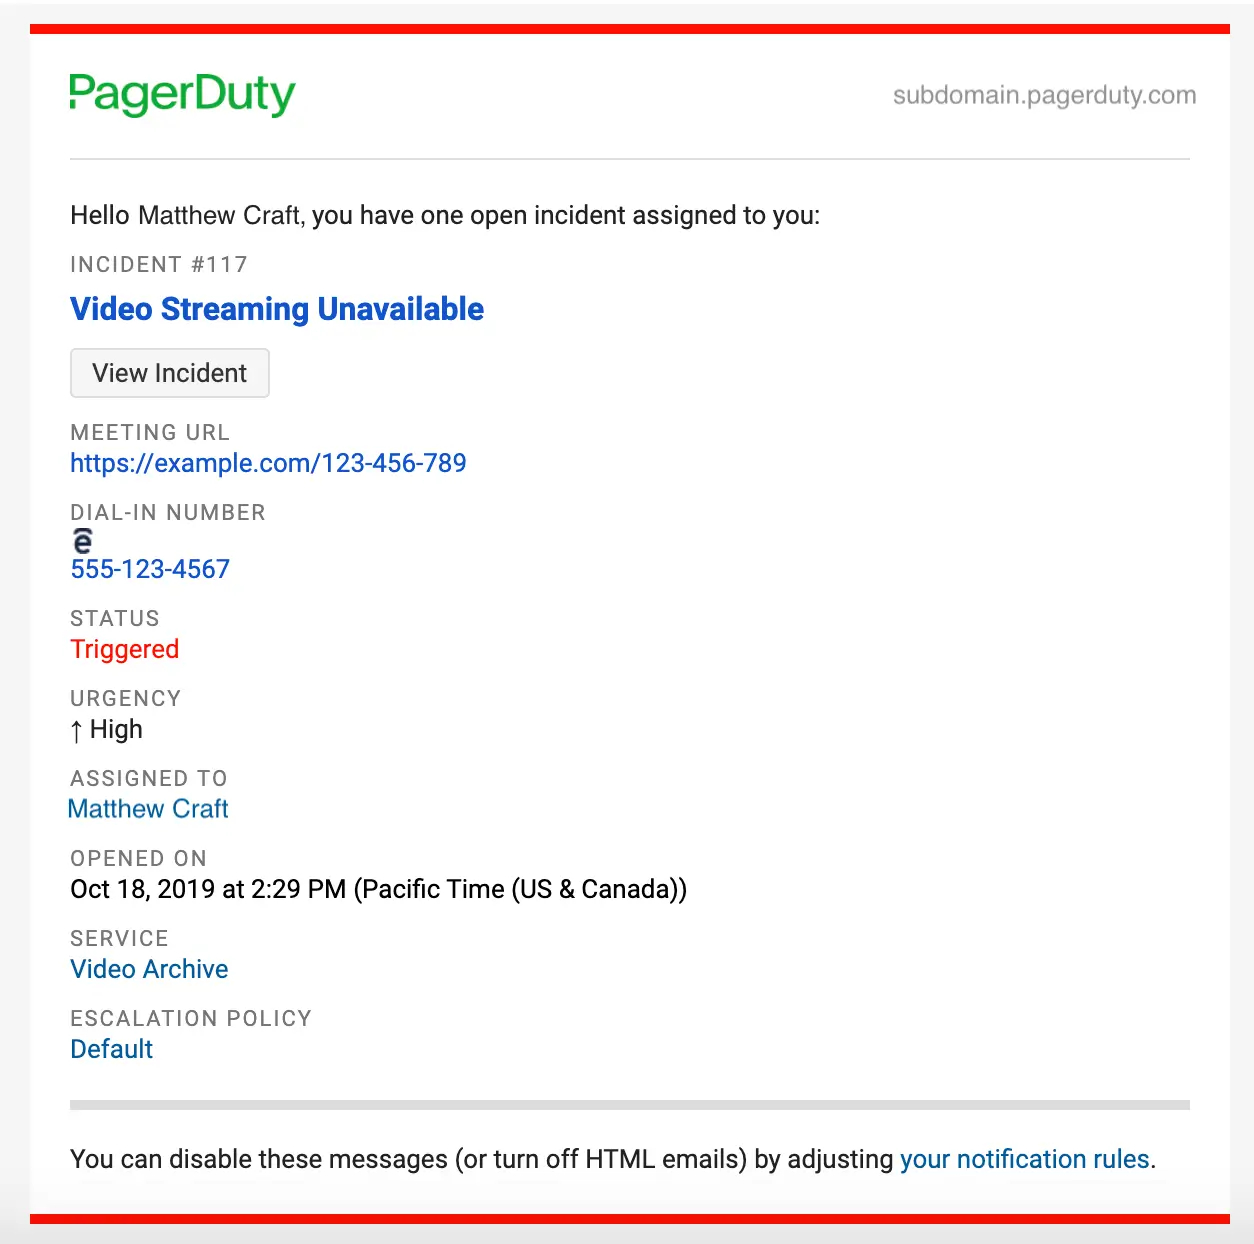 *HTML email notification* Here is an example of a PagerDuty plain text email notification: 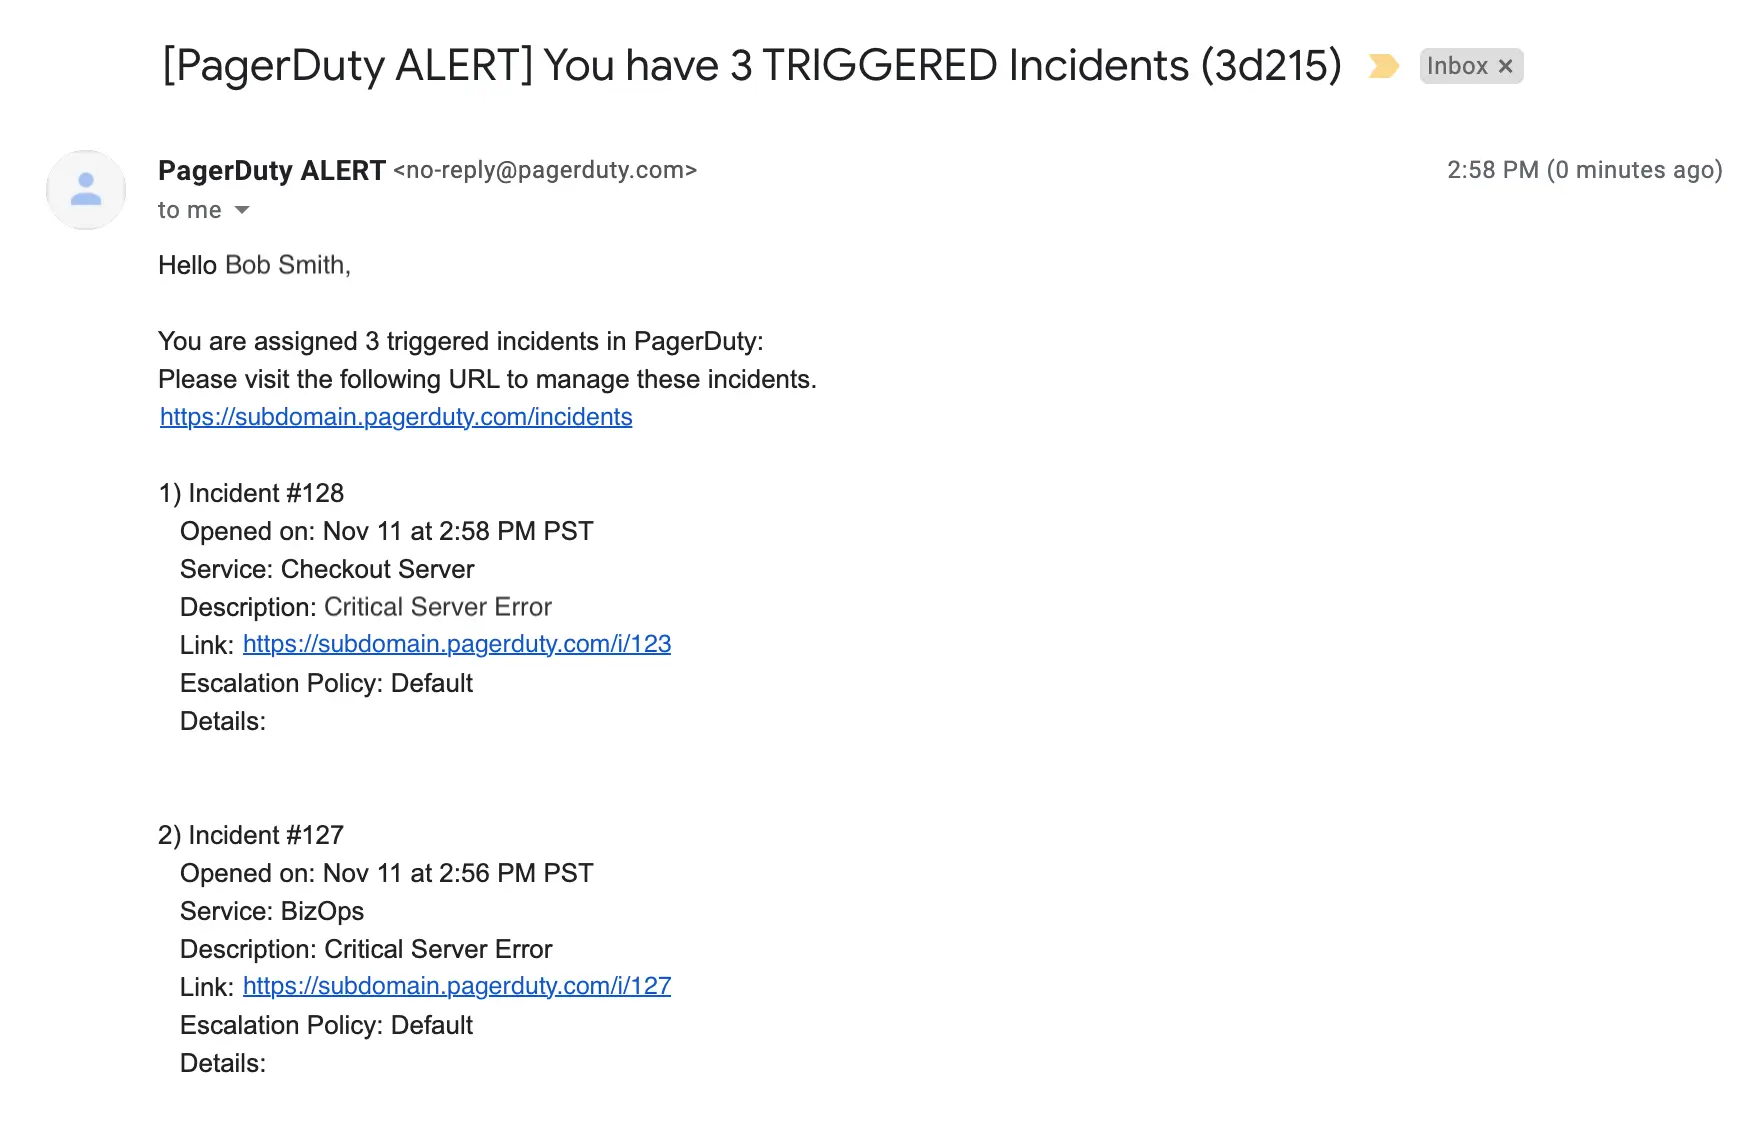 *Plain text email notification* ## Email Truncation and Attachments When you receive a PagerDuty email notification, the incident’s **Details** section will be truncated after 500 characters. You can include clickable links in this truncated message. The rest of the email body is accessible either in the web app on the incident’s details page, or in the [mobile app](/get-started/mobile-app#mobile-app-walkthrough). PagerDuty removes attachments from email notifications and incident logs. To view the original attachment, please refer to the system that sent the original attachment. ## Email Digests PagerDuty adds a digest to the end of email notification subject lines so that related messages are grouped together in your inbox, for example: `[PagerDuty Alert] You have 2 TRIGGERED Incidents (4bc68)`. This digest is not displayed in the PagerDuty web app, however it will help your email client know that subsequent messages are related to a specific incident. --- URL: https://docs.pagerduty.com/incident-management/notifications/notification-content-and-behavior/phone-notifications # Phone Notifications PagerDuty Phone Notifications PagerDuty can notify users via phone when various incident lifecycle events occur. Many factors, such as laws and regulations in your region, may affect the content in phone notifications. The phone notifications you receive may vary slightly from the examples given below. Phone notifications may come from any of the numbers in the [PagerDuty vCard](/incident-management/notifications/notification-phone-numbers). > **Contact Information and Notification Rules:** For more information about adding contact methods and configuring notification rules, see [Contact Information](/account-admin/user-profile/contact-information) and [Notification Rules](/account-admin/user-profile/notification-rules) in the [User Profile](/account-admin/user-profile) article. ## Select Phone Call Notification Language You have the option to select a language for phone notifications. The default language is English. Once you save your choice, you will receive the notifications in the chosen language. To change your phone notification language: 1. Navigate to **User Icon** → **My Profile**. 2. In the **My Profile** tab, under **Voice Notification Language**, select your preferred **language** from the dropdown. 3. Click **Save**. > **Acronyms in Phone Notifications:** When using multiple languages for phone notifications, you should use dots in acronyms (e.g. `N.O.C.`) so that they will be read out as acronyms. ## Phone Notification Content | Scenario | Recorded Phone Message | | :------------------------------------------------------------------------------- | :--------------------------------------------------------------------------------------------------------------------------------------------------------------------------------------------------------------------------------- | | An incident triggers and notifies the on-call user | “You have `[#]` triggered incidents on `[service name]`. The failure is `[incident title]`. Press `[#]` to Acknowledge, Press `[#]` to Resolve, Press `[#]` to Escalate, Press `[#]` for help or Press \* to repeat this message.” | | A user is added as a [responder](/incident-management/incidents/add-responders) to a _new_ incident | “PagerDuty Alert. `[user]` requested your response. Please help with \[`[incident number]`] `[incident description]`. Press `[#]` to accept the request, Press `[#]` to decline the request" | | A user is added as a [responder](/incident-management/incidents/add-responders) to an _existing_ incident | “PagerDuty Alert. `[user]` requested your response. `[custom message]`. Press `[#]` to accept the request, Press `[#]` to decline the request” | > **Live Call Routing:** Please read our [Live Call Routing](/integrations/live-call-routing) article for more information on how Live Call Routing messages may be formatted. ## Français ### PagerDuty Notifications Par Téléphone PagerDuty peut notifier les utilisateurs par téléphone lorsque divers événements du cycle de vie de l'incident se produisent. De nombreux facteurs, tels que les lois et réglementations en vigueur dans votre région, peuvent affecter le contenu des notifications téléphoniques. Les notifications téléphoniques que vous recevez peuvent différer légèrement des exemples donnés ci-dessous. Les notifications téléphoniques peuvent provenir de n'importe quel numéro figurant dans la [PagerDuty vCard](/incident-management/notifications/notification-phone-numbers). > **Coordonnées et Règles de Notification:** Pour plus d'informations sur l'ajout de méthodes de contact et la configuration des règles de notification, veuillez consulter les sections suivantes de l'article [Profil de l'utilisateur](/account-admin/user-profile): > > - [Coordonnées](/account-admin/user-profile/contact-information) > - [Règles de notification](/account-admin/user-profile/notification-rules) ### Sélectionnez la Langue de Notification des Appels Téléphoniques > **Accès Anticipé:** La fonctionnalité de langue de notification des appels téléphoniques est actuellement en phase d'accès anticipé. Les fonctionnalités et la documentation sont susceptibles de changer. Vous avez la possibilité de sélectionner une langue pour les notifications téléphoniques. La langue par défaut est l'anglais. Une fois votre choix enregistré, vous recevrez les notifications dans la langue choisie. Pour modifier la langue des notifications téléphoniques : 1. Accédez à **Icône utilisateur** → **My Profile**. 2. Dans l'onglet **Contact Information**, sous **Langue de notification vocale**, sélectionnez votre **langue** préférée dans le menu déroulant. 3. Cliquez sur **Save**. 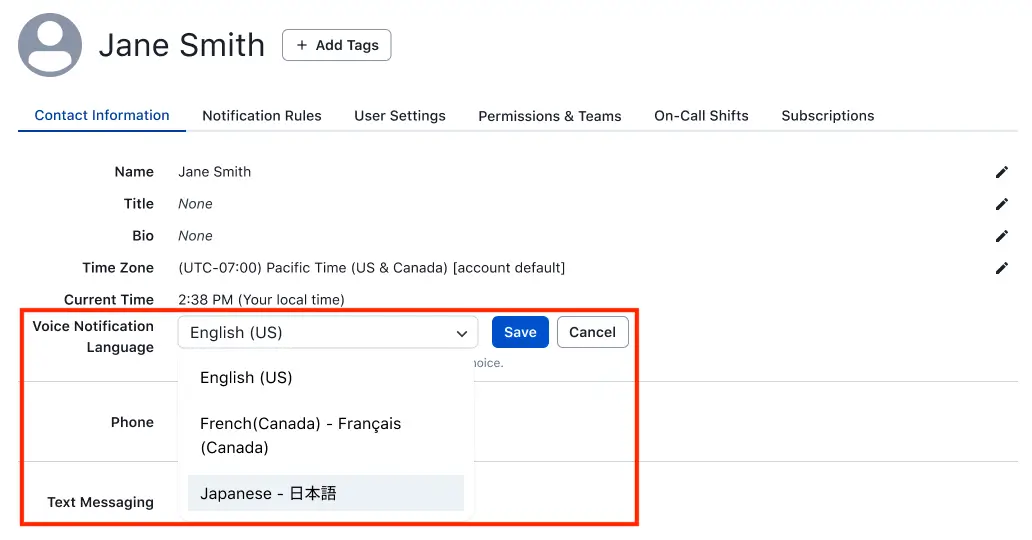 *Sélectionnez la langue de notification de votre téléphone* ### Contenu des Notifications par Téléphone | Scénario | Message téléphonique enregistré | | :-------------------------------------------------------------------------------------------------------------------------------- | :---------------------------------------------------------------------------------------------------------------------------------------------------------------------------------------------------------------------------------------------------------------------------------------------------------- | | Un incident est déclenché et une notification est envoyée à l'utilisateur de service | « Vous avez `[#]` incidents déclenchés pour `[service name]`. La panne est la suivante :`[incident title]`. Appuyez sur `[#]` pour constater, Appuyez sur `[#]` pour résoudre, Appuyez sur `[#]` pour faire remonter, Appuyez sur `[#]` pour obtenir de l’aide ou Appuyez sur \* pour répéter ce message. » | | Un utilisateur est ajouté en tant qu’[intervenant](/incident-management/incidents/add-responders) à un nouvel incident | « PagerDuty Alerte. `[user]` a demandé votre intervention. Aidez-nous à \[`[incident number]`] `[incident description]`. Appuyez sur `[#]` pour accepter cette demande, Appuyez sur `[#]` pour refuser cette demande » | | Un utilisateur est ajouté en tant qu’[intervenant](/incident-management/incidents/add-responders) à un incident existant | « PagerDuty Alerte. `[user]` a demandé votre intervention. `[custom message]`. Appuyez sur `[#]` pour accepter cette demande, Appuyez sur `[#]` pour refuser cette demande » | > **Live Call Routing:** Veuillez lire notre [Live Call Routing](/integrations/live-call-routing) article pour en savoir plus sur la manière dont les Live Call Routing messages peuvent être formatés. ### Divulgations Relatives aux Notifications par Téléphone Les utilisateurs qui utilisent les services téléphoniques certifient et reconnaissent ce qui suit : - Ils sont l'abonné ou l'utilisateur habituel autorisé du numéro de téléphone spécifié. - Ils ont le pouvoir de consentir à recevoir des appels téléphoniques au numéro de téléphone spécifié. - Les données personnelles des utilisateurs seront traitées selon les modalités décrites dans la [PagerDuty Politique de confidentialité](https://www.pagerduty.com/privacy-policy/). - Des tarifs d'appel et d'autres frais de connexion peuvent s'appliquer. - La fréquence des notifications envoyées peut varier en fonction de plusieurs facteurs, notamment le taux d'occurrence des incidents, la réponse aux incidents et la résolution des incidents. Les utilisateurs peuvent recevoir plusieurs notifications par incident. - L'utilisation des services de notification doit être conforme à la [PagerDuty politique d'utilisation acceptable](https://www.pagerduty.com/acceptable-use-policy/). - PagerDuty se réserve le droit d'enquêter sur toute utilisation suspecte ou potentiellement problématique, et d'empêcher, de ralentir ou de bloquer toute notification abusive ou ayant des effets préjudiciables ou déloyaux sur notre activité ou sur nos clients. Les mesures prises à la suite d'utilisations abusives, préjudiciables ou déloyales ne seront pas comptabilisées comme des échecs de livraison dans le cadre de l'[Accord de niveau de service relatif à la livraison des notifications](https://www.pagerduty.com/standard-service-level-agreement/), s'il s'applique. - PagerDuty compte sur les fournisseurs de services et, en fin de compte, sur les transporteurs publics sous-jacents, pour acheminer les appels téléphoniques. Les notifications peuvent être retardées ou bloquées en fonction des conditions et politiques applicables de ces fournisseurs de services ou transporteurs. - Les opérateurs ne sont pas responsables des appels retardés ou non connectés. - Pour toute question concernant ces services, vous pouvez [contacter le PagerDuty service d'assistance](https://www.pagerduty.com/contact-us/). --- URL: https://docs.pagerduty.com/incident-management/notifications/notification-content-and-behavior/phone-notifications/phone-notification-disclosures # Phone Notification Disclosures Review the consent, carrier liability, and delivery terms that users accept when receiving PagerDuty phone call notifications. Users who use phone services certify and acknowledge the following: - They are the subscriber or customary authorized user of the specified phone number. - They have the authority to consent to receiving phone calls at the specified phone number. - The users’ personal data will be processed as described in the [PagerDuty Privacy Policy](https://www.pagerduty.com/privacy-policy/). - Messages may be sent by: PagerDuty, Inc. (United States); PagerDuty, Inc. (Canada); PagerDuty KK (Japan); PagerDuty Ltd. (United Kingdom); PagerDuty Pty Ltd. (Australia); PagerDuty Switzerland GmbH (Switzerland); PagerDuty Portugal, Unipessoal Lda (Portugal); PagerDuty Chile SpA (Chile). - Call rates and other connection charges may apply. - The frequency of notifications sent may vary, depending on multiple factors, including the rate of incident occurrence, incident response and incident resolution. Users may receive multiple notifications per incident. - Use of the notification services must abide by the [PagerDuty Acceptable Use Policy](https://www.pagerduty.com/acceptable-use-policy/). - PagerDuty reserves the right to investigate suspicious or potentially problematic use, and prevent, throttle, or block any notifications that are abusive, or have detrimental or unfair effects on our business or on our customers. Actions taken based on abusive, detrimental or unfair uses will not be counted as delivery failures under the [Notification Delivery SLA](https://www.pagerduty.com/standard-service-level-agreement/), if it applies. - PagerDuty relies on service providers, and ultimately, underlying common carriers, to deliver phone calls. Notifications may be delayed or blocked based on the applicable terms and policies of these service providers or carriers. - Carriers are not liable for delayed or unconnected calls. - For all questions about these services, you can [contact PagerDuty Support](https://www.pagerduty.com/contact-us/). --- URL: https://docs.pagerduty.com/incident-management/notifications/notification-content-and-behavior/push-notifications # Push Notifications PagerDuty Push Notifications PagerDuty can notify users via push notification when various incident lifecycle events occur. > **Contact Information and Notification Rules:** For more information about adding contact methods and configuring notification rules, see [Contact Information](/account-admin/user-profile/contact-information) and [Notification Rules](/account-admin/user-profile/notification-rules) in the [User Profile](/account-admin/user-profile) article. ## Push Notification Content | Scenario | Body | | :--------------------------------------------------------------------------------------------------------------------------------------------------------------- | :--------------------------------------------------------------------------------------------------------------- | | An incident triggers and notifies the on-call user | “ALRT `[incident number]` on `[service name]` `[incident title]`” | | A user is added as a [responder](/incident-management/incidents/add-responders) to a _new_ incident | “PagerDuty `[incident number]` (`[user]`): Please help with "\[`[incident number]`] `[incident title]`" | | A user is added as a [responder](/incident-management/incidents/add-responders) to an _existing_ incident | "`[user]` requested your response. `[custom message]`" | | A user receives a [Status Update](/incident-management/communicate/communicate-with-stakeholders#status-updates) to an incident that they are assigned or subscribed to | "`[user]` has published an update to incident `[incident number]`: `[custom message]`" | | A user is about to go on call ([On-Call Handoff Notification](/incident-management/schedules/escalation-policies#on-call-handoff-notification-settings)) | "Went on call on `[date and time]` for escalation policy `[escalation policy]` (Level `X` - `[schedule name]`)." | ### Push Notification Example Here is an example of a PagerDuty push notification: 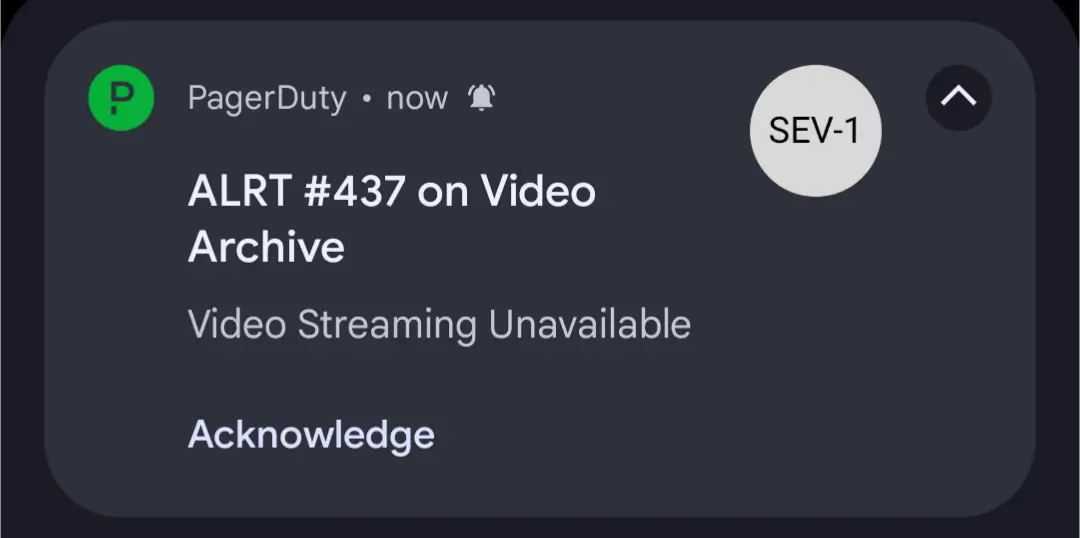 *Push notification* --- URL: https://docs.pagerduty.com/incident-management/notifications/notification-content-and-behavior/sms-notifications # SMS Notifications PagerDuty SMS Notifications PagerDuty can notify you via SMS when various incident lifecycle events occur. Many factors, such as laws and regulations in your region, may affect the content in SMS notifications. The SMS notifications you receive may vary slightly from the examples given in the following section. SMS notifications may come from any of the numbers in the [PagerDuty vCard](/incident-management/notifications/notification-phone-numbers). > **Contact Information and Notification Rules:** For more information about adding contact methods and configuring notification rules, see [Contact Information](/account-admin/user-profile/contact-information) and [Notification Rules](/account-admin/user-profile/notification-rules) in the [User Profile](/account-admin/user-profile) article. You opt in and consent to receiving SMS notifications regarding incidents, status updates, and on-call shifts by configuring SMS contact methods on your [user profile](/account-admin/user-profile). After adding contact methods, you indicate how frequently you would like to receive SMS notifications by configuring your [notification rules](/account-admin/user-profile/notification-rules). ## SMS Notification Content The examples in the following section are common SMS notifications that you can expect to receive while using PagerDuty. You can take action on SMS messages (such as acknowledging or resolving an incident) by replying with the numeric code indicated in the message. | Scenario | Message Body | | :-------------------------------------------------------------------------------------------------------------------------------------------------------- | :------------------------------------------------------------------------------------------------------------------ | | An incident triggers and notifies you when you are on call | ALRT `[incident number]`: You were assigned to an incident. Go to PagerDuty to learn more. Reply 4: Ack, 6: Resolve | | You are added as a [responder](/incident-management/incidents/add-responders) | PagerDuty `[incident number]`: Please help with incident `[incident number]` | | You receive a [status update](/incident-management/communicate/communicate-with-stakeholders#status-updates) to an incident that you are assigned or subscribed to | `[user]` has published an update to incident #`[incident number]`: `[custom message]` | > **End of Life: OCHONs via SMS:** As of December 10, 2024, we no longer support delivery of On-Call Handoff Notifications (OCHONs) via SMS for new users. PagerDuty SMS incident responder notifications are truncated to 160 characters. The following image displays an example of a PagerDuty SMS incident responder notification: 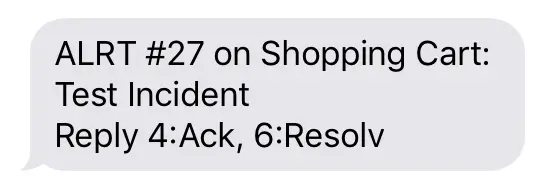 *SMS incident notification* If multiple incidents are assigned to you, PagerDuty may bundle all notifications into a single SMS notification, listing out the incident numbers and giving you the option to acknowledge all or resolve all incidents at once. > **SMS Responses:** You can respond to [SMS notifications](#respond-to-an-sms-notification) by entering a context-specific numerical code. Due to regional restrictions, you may not be able to respond to SMS notifications in some countries. If you are in one of these countries, the SMS notifications you receive may differ from the information outlined in the previous section. Refer to [Supported Countries](/incident-management/notifications/supported-countries#text-notifications) for more information. [Status update](/incident-management/communicate/communicate-with-stakeholders) stakeholder notifications are truncated to 450 characters. ## Call to Action Prompts You can get help, opt out of receiving SMS notifications, or opt back in by replying with the following action prompts: | SMS Action | Message Body | | :---------------------- | :------------------------------------------------------------------------------------------------------------------------------------------------------------------------------------------------------------------------------------------------------------------------------------------------------------------------------------------------------------------------------------------------------------------------------------------------------------------------------------------------------------------------------------------------------------------------ | | `HELP` | **English**: To receive help from PagerDuty please email [support@pagerduty.com](mailto:support@pagerduty.com) or visit [support.pagerduty.com](/get-started/introduction). Message and Data rates may apply. Message frequency varies. Text STOP to cancel.
**French**: Pour recevoir de l’aide de PagerDuty, veuillez envoyer un e-mail à [support@pagerduty.com](mailto:support@pagerduty.com) ou visiter support.pagerduty.com. Des messages et débits de données peuvent être appliqués. La fréquence des messages varie. Envoyez STOP pour annuler. | | `STOP` | **English**: PagerDuty: You will no longer receive any messages. Message and Data rates may apply. Message frequency varies. Reply HELP for help or email [support@pagerduty.com](mailto:support@pagerduty.com)
**French**: PagerDuty: Vous ne recevrez plus aucun message. Des messages et débits de données peuvent être appliqués. La fréquence des messages varie. Respondez AIDE pour obtenir de l’aide ou envoyez un e-mail à [support@pagerduty.com](mailto:support@pagerduty.com) | | `START` | Welcome to PagerDuty. Please reply YES to confirm your phone number. Message and Data rates may apply. Message frequency varies. Text HELP for help. Text STOP to cancel.
Privacy policy: [https://www.pagerduty.com/privacy-policy](https://www.pagerduty.com/privacy-policy/)
Terms of Service: [https://www.pagerduty.com/website-terms-of-use](https://www.pagerduty.com/website-terms-of-use/) | | `YES` (confirm `START`) | You are subscribed to PagerDuty notifications. Message and Data rates may apply. Message frequency varies. Text HELP for help. Text STOP to cancel.
Privacy policy: [https://www.pagerduty.com/privacy-policy](https://www.pagerduty.com/privacy-policy/)
Terms of Service: [https://www.pagerduty.com/website-terms-of-use](https://www.pagerduty.com/website-terms-of-use/) | ## SMS Notification Disclosures PagerDuty requires your consent before sending SMS notifications, with the acknowledgment that message rates may apply and delivery depends on third-party carriers. You can opt out at any time by texting `STOP` or by changing your notification settings. For detailed information, refer to [SMS Notification Disclosures](/incident-management/notifications/notification-content-and-behavior/sms-notifications/sms-notification-disclosures). --- URL: https://docs.pagerduty.com/incident-management/notifications/notification-content-and-behavior/sms-notifications/sms-notification-disclosures # SMS Notification Disclosures Review the opt-in, opt-out, and carrier liability terms that users accept when receiving PagerDuty text message notifications. ## User Opt-In As indicated in the PagerDuty [terms of service](https://www.pagerduty.com/terms-of-service/) (or applicable negotiated customer terms), PagerDuty users must provide the appropriate consent to receive SMS notifications. The PagerDuty Account Owner and Admins must obtain appropriate consent from their users to receive SMS notifications before adding their users’ numbers to the service. By [configuring](/account-admin/user-profile/notification-rules) the SMS notifications sent and received, PagerDuty customers and users authorize PagerDuty to send the requested SMS notifications. To begin receiving PagerDuty SMS notifications, users must provide their phone number and agree to receive notifications using text messages. 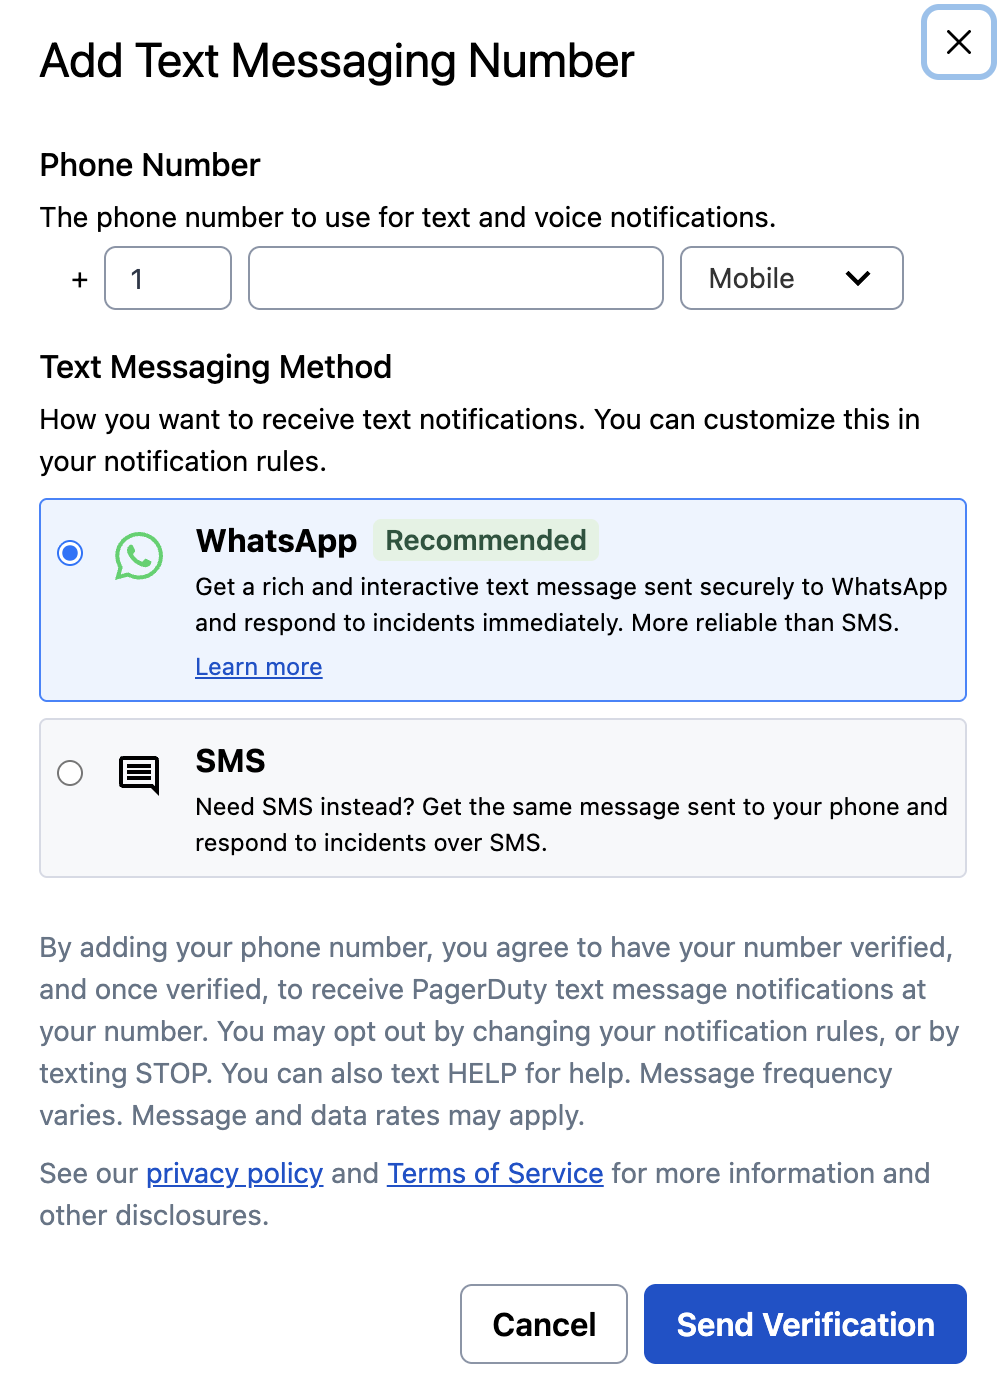 *Add SMS number* ## User Opt-Out Users can opt out by [changing their notification rules](/account-admin/user-profile/notification-rules) at any time, or by texting `STOP`, to stop receiving SMS messages to the specified phone number. Users can also text `HELP` to obtain instructions on how to use our service as well as how to unsubscribe. ## User Acknowledgments Users who use the service certify and acknowledge the following: - They are the subscriber or customary authorized user of the specified phone number. - They have the authority to consent to receiving text messages at the specified phone number. - The users’ personal data will be processed as described in the [PagerDuty Privacy Policy](https://www.pagerduty.com/privacy-policy/). - Messages are only sent by any of these: PagerDuty, Inc. (United States); PagerDuty, Inc. (Canada); PagerDuty KK (Japan); PagerDuty Ltd. (United Kingdom); PagerDuty Pty Ltd. (Australia); PagerDuty Switzerland GmbH (Switzerland); PagerDuty Portugal, Unipessoal Lda (Portugal); PagerDuty Chile SpA (Chile). - Message and data rates may apply. - The frequency of notifications sent may vary, depending on multiple factors, including the rate of incident occurrence, incident response and incident resolution. Users may receive multiple notifications per incident. - Use of the notification services must abide by the [PagerDuty Acceptable Use Policy](https://www.pagerduty.com/acceptable-use-policy/). - PagerDuty reserves the right to investigate suspicious or potentially problematic use, and prevent, throttle, or block any notifications that are abusive, or have detrimental or unfair effects on our business or on our customers. Actions taken based on abusive, detrimental or unfair uses will not be counted as delivery failures under the [Notification Delivery SLA](https://www.pagerduty.com/standard-service-level-agreement/), if it applies. - PagerDuty relies on service providers, and ultimately, underlying common carriers, to deliver text messages. Notifications may be delayed or blocked based on the applicable terms and policies of these service providers or carriers. - Carriers are not liable for delayed or undelivered messages. - For all questions about the services provided by this short code, you can [contact PagerDuty Support](https://www.pagerduty.com/contact-us/). --- URL: https://docs.pagerduty.com/incident-management/notifications/notification-content-and-behavior/whatsapp-notifications # WhatsApp Notifications Add or switch a contact method to WhatsApp and see sample message content and actions for common PagerDuty incident scenarios. ## Add a WhatsApp Contact Method For global organizations where SMS is not ideal, you can configure WhatsApp as a notification method. WhatsApp numbers must be verified prior to receiving notifications; unverified numbers cannot receive WhatsApp notifications. > **Notes:** - You cannot use the same number for SMS and WhatsApp; select one or the other. With multiple numbers, you can use one for SMS and another for WhatsApp. > - You can switch an existing SMS number to WhatsApp. When switching, notification rules are automatically replaced by the selected method. > - Where messages cannot be delivered on WhatsApp, the fallback message is sent via SMS. > - **Admins**: to block WhatsApp as a notification channel for your organization, contact [support@pagerduty.com](mailto:support@pagerduty.com). To add a WhatsApp contact method: 1. Navigate to **User Icon** → **My Profile**, and the **Contact Information** tab. 2. Go to **Text Messaging** and click **Add Text Messaging**. 3. Enter your phone number and select the phone number type from the dropdown. If supported, the WhatsApp option appears as an applicable notification method. 4. Click **Send Verification**. 5. Once you receive a notification from PagerDuty in WhatsApp, tap **Verify** to complete the setup.  *Add WhatsApp Contact Method* [Find out more](/incident-management/notifications/notification-content-and-behavior/whatsapp-notifications#whatsapp-notification-content) on the types of notifications you can receive with WhatsApp. ## Switch an Existing Contact Method to WhatsApp 1. Navigate to **User Icon** → **My Profile** and select the **Contact Information** tab. 2. Switch to WhatsApp by either: - Clicking **Switch to WhatsApp** on the banner, or  *Switch to WhatsApp banner* - Clicking the **Switch to WhatsApp** button beside your SMS contact, under **Text Messaging**.  *Switch to WhatsApp in Text Messaging* 3. Click **Send Verification**. 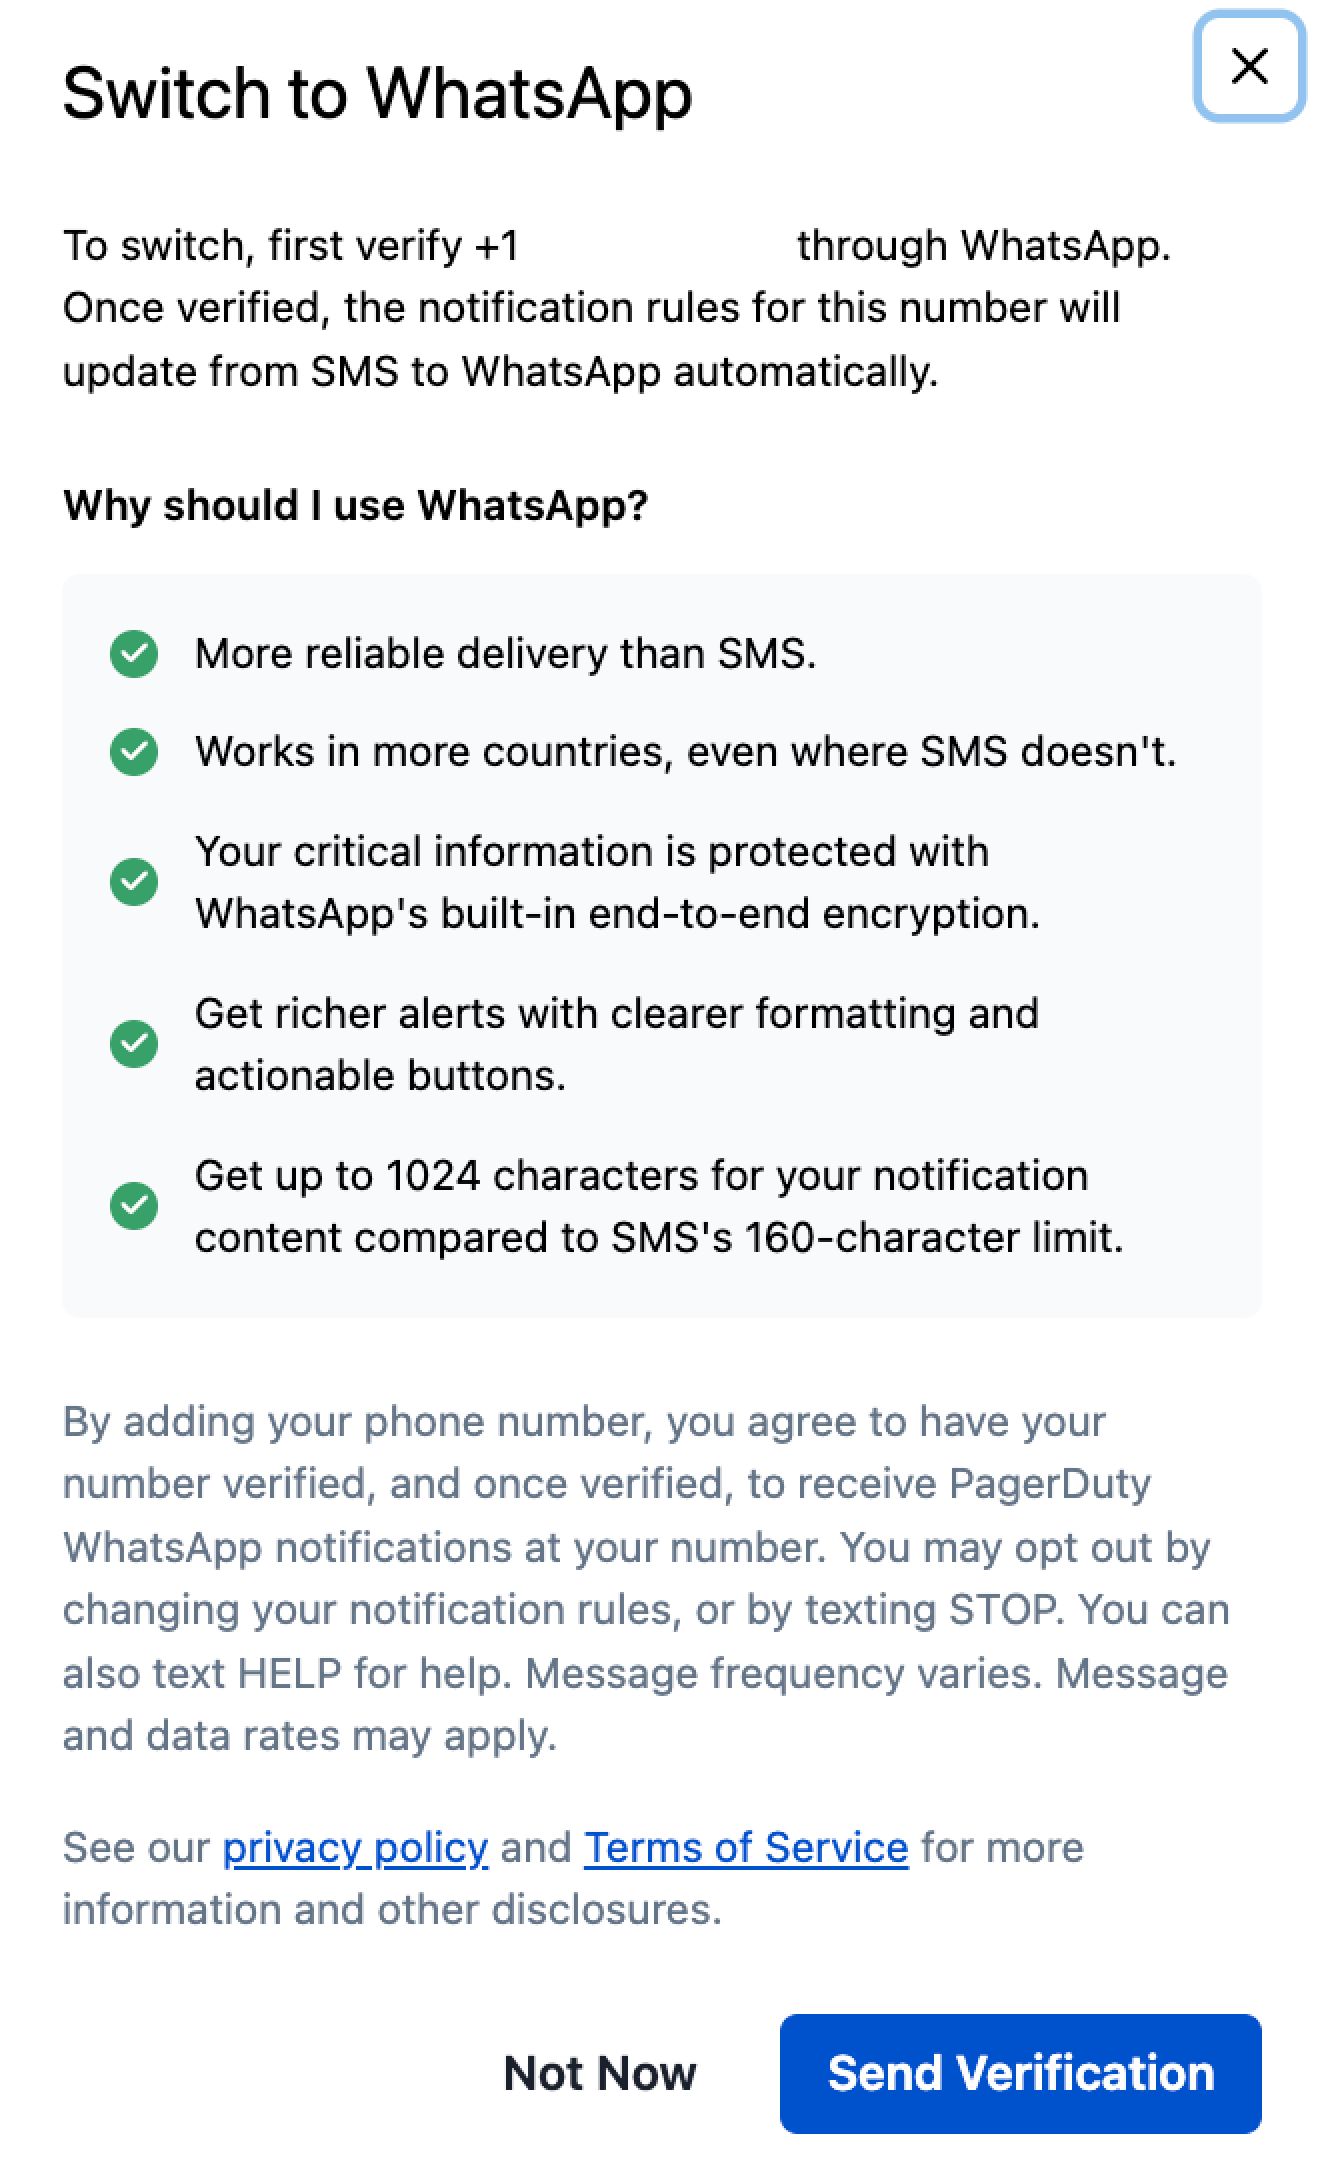 *WhatsApp - Send Verification* 4. Once you receive a notification from PagerDuty on WhatsApp, tap **Verify** to complete the setup. ## Switch from WhatsApp Back to SMS 1. Navigate to **User Icon** → **My Profile** and select the **Contact Information** tab. 2. Click beside the contact method you would like to edit. 3. Select **SMS** → **Continue with SMS**. 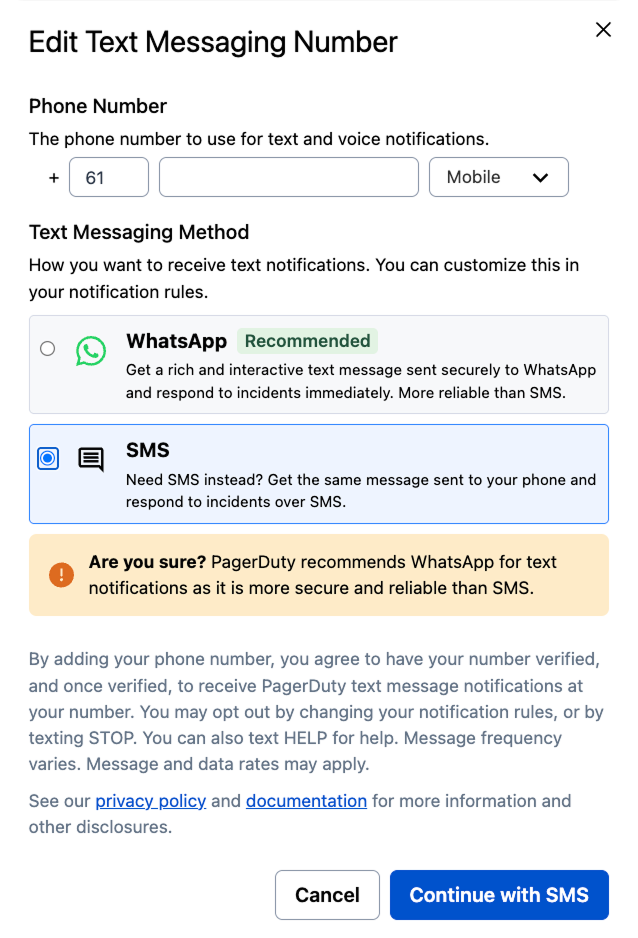 *Switch back to SMS from WhatsApp* 4. Once you receive the verification code, enter the six-digit code and click **Verify**. ## WhatsApp Notification Content The following are common WhatsApp notifications you may receive when using PagerDuty. Most users can take action on WhatsApp messages — such as acknowledging or resolving an incident — by tapping the desired action. | Scenario | Message Body | | :---------------------------------------------------------------------------------------------------------------------- | :------------------------------------------------------------------------------------------------------------------------------------------------------------------------------------------------------------------------------------------------------------------------------------------------------------------------ | | An incident triggers and notifies the on-call user. | Incident: `[incident number]` - `[incident title]` Service: `[service name]` Priority: `[incident priority]` Urgency: `[incident urgency]` Responder: `[responder name]` Incident Type: `[incident type]` Incident Link: `[link to incident]` Select one of the options below: **Acknowledge**, **Resolve**, **Escalate** | | A user is added as a [responder](/incident-management/incidents/add-responders). | You have been requested to assist with an incident. Incident `[incident number]`: Please help with "`[incident title]`" Priority: `[incident priority]` Incident Link: `[link to incident]` Select one of the options below: **Accept**, **Decline** | | A user receives a [status update](/incident-management/communicate/communicate-with-stakeholders) to an incident they are assigned or subscribed to. | A new status update was published on incident `[incident number]` - `[incident title]` Published by: `[responder name]` Responder: `[responder name]` Incident Link: `[link to incident]` Status Update: `[status update]` Log in to PagerDuty for more information. | ## Supported Countries For countries that support WhatsApp, see the [Text Notifications table](/incident-management/notifications/supported-countries) in Supported Countries. ## FAQ **Why am I not receiving my WhatsApp verification code?** If you previously replied **STOP** to opt out of WhatsApp messages from PagerDuty, you will not receive any new messages, including verification codes, until you opt back in. Reply **START** in the WhatsApp conversation and follow the prompts, then try verification again. If you have not opted out and still are not receiving a code, [contact PagerDuty Support](https://www.pagerduty.com/contact-us/) for help troubleshooting.
--- URL: https://docs.pagerduty.com/incident-management/notifications/notification-content-and-behavior/whatsapp-notifications/whatsapp-notification-disclosures # WhatsApp Notification Disclosures Review the consent and opt-out terms, including the STOP and START reply keywords, for PagerDuty alerts sent via WhatsApp. As indicated in the PagerDuty [terms of service](https://www.pagerduty.com/terms-of-service/) (or applicable negotiated customer terms), you must provide appropriate consent to receive WhatsApp notifications. To begin receiving PagerDuty WhatsApp notifications, provide a supported phone number and agree to receive notifications using WhatsApp in [Contact Information](/account-admin/user-profile/contact-information). 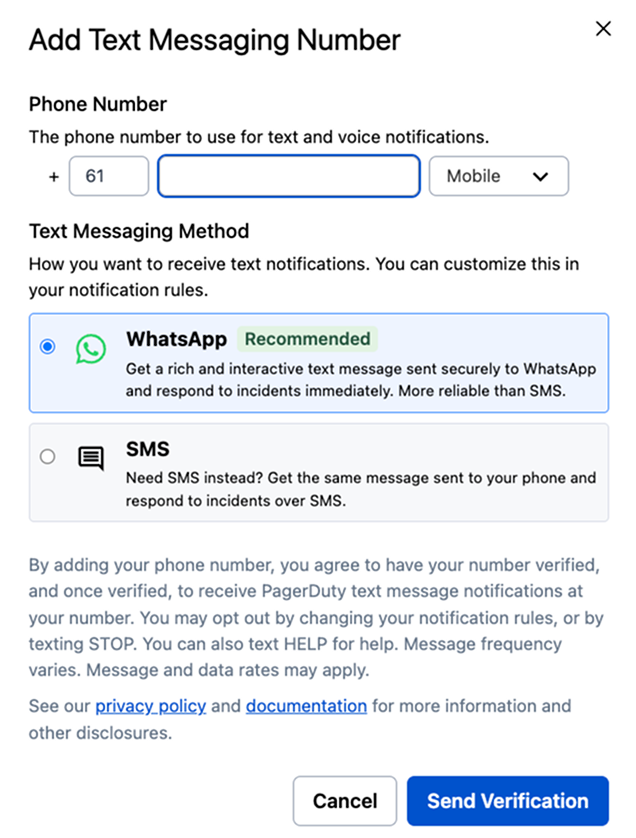 *Add WhatsApp as a notification method* > **Block WhatsApp:** Admins can contact [support@pagerduty.com](mailto:support@pagerduty.com) to block WhatsApp as a notification channel for your organization. ## Opt Out To opt out or stop receiving PagerDuty notifications via WhatsApp, perform one of the following actions: - Reply **STOP** in the WhatsApp conversation. - To opt back in after opting out, reply **START** in the WhatsApp conversation and follow the prompts. - [Switch back to SMS](/incident-management/notifications/notification-content-and-behavior/whatsapp-notifications#switch-from-whatsapp-back-to-sms). - Delete the WhatsApp contact method from your profile. > **Not Receiving a Verification Code?:** If you previously opted out by replying **STOP**, you will not receive new messages — including verification codes — until you reply **START** in the WhatsApp conversation and complete the opt-back-in prompts. PagerDuty cannot manually remove this block; opting back in must be done from the WhatsApp conversation itself.
--- URL: https://docs.pagerduty.com/incident-management/notifications/notification-phone-numbers # Notification Phone Numbers Add all PagerDuty phone and SMS notification numbers to your contacts Download the PagerDuty vCard to add all phone and SMS notification numbers to your contacts. ## PagerDuty vCard PagerDuty phone and SMS notifications can come from varying numbers based on your country and other factors. The best way to ensure that you receive PagerDuty notifications is to download the PagerDuty vCard. The vCard is an up-to-date file containing the numbers that PagerDuty notifications can come from, and you can import it into your computer or smartphone contacts. It will appear in your contacts as **PagerDuty Outgoing Numbers**. We highly recommend downloading the vCard and keeping it updated, as it is subject to change. ### Automatically Update vCard in the PagerDuty Mobile App The PagerDuty mobile app for iOS and Android offers automatic vCard management to ensure you always have the latest version. [
](https://apps.apple.com/us/app/pagerduty/id594039512) [ ](https://play.google.com/store/apps/details?id=com.pagerduty.android&hl=en_US&pcampaignid=MKT-Other-global-all-co-prtnr-py-PartBadge-Mar2515-1)
To update the vCard in the mobile app (version 5.72 and above):
1. Select **More** in the bottom navigation bar and tap in the upper right.
2. Tap **Automatic Contact Card Management**. Once updated, you will be able to see the date and time it was last updated for future reference.
> **Contacts Access:** You may be prompted to enable access to your contacts in your device's settings to use this feature.
### Update the vCard via Web Download
If you do not have the PagerDuty mobile app, you can also download the vCard using the link below:
[Download the PagerDuty vCard](https://s3.amazonaws.com/pdpartner/PagerDuty+Outgoing+Numbers.vcf)
#### Latest vCard Update
- 2026-07-28
If you are using the web download, your local file will not stay automatically up-to-date when notification phone numbers change. Update it periodically, or install the mobile app for [automatic updates](#automatically-update-vcard-in-the-pagerduty-mobile-app).
> **SMS Short Codes:** If you are experiencing issues receiving SMS messages from short codes, your phone may be blocking short code messages, or your carrier may need to [enable short code messaging](/incident-management/notifications/notification-troubleshooting/sms-notification-troubleshooting#short-code-messaging-restrictions) for you.
](https://play.google.com/store/apps/details?id=com.pagerduty.android&hl=en_US&pcampaignid=MKT-Other-global-all-co-prtnr-py-PartBadge-Mar2515-1)
To update the vCard in the mobile app (version 5.72 and above):
1. Select **More** in the bottom navigation bar and tap in the upper right.
2. Tap **Automatic Contact Card Management**. Once updated, you will be able to see the date and time it was last updated for future reference.
> **Contacts Access:** You may be prompted to enable access to your contacts in your device's settings to use this feature.
### Update the vCard via Web Download
If you do not have the PagerDuty mobile app, you can also download the vCard using the link below:
[Download the PagerDuty vCard](https://s3.amazonaws.com/pdpartner/PagerDuty+Outgoing+Numbers.vcf)
#### Latest vCard Update
- 2026-07-28
If you are using the web download, your local file will not stay automatically up-to-date when notification phone numbers change. Update it periodically, or install the mobile app for [automatic updates](#automatically-update-vcard-in-the-pagerduty-mobile-app).
> **SMS Short Codes:** If you are experiencing issues receiving SMS messages from short codes, your phone may be blocking short code messages, or your carrier may need to [enable short code messaging](/incident-management/notifications/notification-troubleshooting/sms-notification-troubleshooting#short-code-messaging-restrictions) for you.
--- URL: https://docs.pagerduty.com/incident-management/notifications/notification-troubleshooting # Notification Troubleshooting Troubleshoot issues with notifications ## Pre-Checks A variety of factors may affect your ability to receive notifications from PagerDuty. If you are not receiving notifications as expected, please check the following items first: - Was Do Not Disturb (DND) enabled on your phone at the time you were expecting the notification? - For push notifications, do you have any Focus profiles or work profiles enabled? - Were you in a location with poor cell service at the time? - Are there any missed calls from PagerDuty in your call logs or voicemail logs? - Do you have any settings enabled, which would block or silence notifications from unknown numbers? - Do you have any safety features which would disable notifications on your mobile device while driving? - Have you configured the PagerDuty app's permissions to allow notifications? - Have you downloaded PagerDuty’s [vCard](/incident-management/notifications/notification-phone-numbers#pagerduty-vcard)? - Does the issue occur after restarting your mobile device? ## Confirm the Expected Behavior There are some scenarios where you may expect to receive a notification, but the criteria for triggering a notification were not met. When this happens, it is expected behavior that you will not receive notifications. Please read [Expected Notification Behavior](/incident-management/notifications/notification-troubleshooting/expected-notification-behavior) for more information. ## Next Steps If the issue persists after verifying the items above, please refer to the following articles for more specific troubleshooting steps: - [Push Notification Troubleshooting](/incident-management/notifications/notification-troubleshooting/push-notification-troubleshooting) - [Email Notification Troubleshooting](/incident-management/notifications/notification-troubleshooting/email-notification-troubleshooting) - [Phone Notification Troubleshooting](/incident-management/notifications/notification-troubleshooting/phone-notification-troubleshooting) - [SMS Notification Troubleshooting](/incident-management/notifications/notification-troubleshooting/sms-notification-troubleshooting) --- URL: https://docs.pagerduty.com/incident-management/notifications/notification-troubleshooting/email-notification-troubleshooting # Email Notification Troubleshooting Troubleshoot issues with email notifications > **Pre-Checks:** Please complete the [Notification Troubleshooting Pre-Checks](/incident-management/notifications/notification-troubleshooting) before proceeding with this article. Email, a seemingly simple tool, can occasionally present issues with message delivery. This includes duplicate messages, unreceived messages, and message delays. This article addresses common email issues, and how to address them. ## Check Your Email Provider Settings If you are not receiving email notifications as expected, you may have configured inbox settings that affect message delivery. You can check the following settings in your email provider. ### POP3 Protocols like POP3, while convenient, can lead to duplicate messages if they are configured to "leave a copy on the server." POP3 can also be configured to delete or archive messages when they are accessed within the other email client. If POP3 is enabled, please check your configuration to see if this is causing any issues. ### Syncing Across Devices and Accounts Your email provider may have settings to configure how messages are synced for multiple devices or accounts, which can inadvertently lead to duplicate messages. ### Email Filters and Folders Overly aggressive email filters, either set by you or your email administrator, can inadvertently discard or redirect desired messages. Your email provider may also have rules that cause an email to bypass the primary inbox. If you are missing an email notification, you should always check the following locations: - Spam - Trash - Folders or labels - Other inboxes or tabs (e.g., “Promotions” or “Social”) > **Searching Tips:** Try searching your emails for details relevant to the notification you are looking for. You can refer to our article on [Email Notifications](/incident-management/notifications/notification-content-and-behavior/email-notifications#email-notification-content) to see email notification content. ### Forwarding Loops A forwarding loop occurs when an email is forwarded to an address that forwards the message back to the original address. This creates an infinite email forwarding loop. You should check your email provider’s **settings** for any forwarding configurations as well as any **filters** that are configured to forward emails. ### Group Emails If you are sending email notifications to a group list, you may receive duplicate messages if the same email address has been added multiple times as a recipient. Please check your group lists for duplicate email addresses. ### Auto-Delete Messages You may have settings or rules that automatically delete messages based on content or time frames If you are missing messages, check your email’s **Trash** as well as any settings that can automatically delete messages. ## Check With Your Company Your company may have policies in place that affect email delivery. If you experience issues with receiving email notifications, consider reaching out to the team that manages your email platform for assistance. > **Email Server Logs:** Your email administrator may be able to review the email server logs, to check if there are any records related to the email issue that you are experiencing. ### Blocked Emails Some company policies could cause email delivery issues. You can ask your IT team or email administrator about the following: - **Firewall Security Rules**: While they are essential for security, they can sometimes block incoming emails, particularly from unfamiliar senders. - **Domain Restrictions**: Some email systems can be configured to only allow incoming messages from specific domains. You may need to ask your email administrator to add PagerDuty as a trusted domain. - **Anti-Virus/Spam Filters**: Email messages may be delayed while the anti-malware software scans the message for threats. ### System Issues There are times where email delivery from PagerDuty to your email platform can be disrupted due to system issues. Your email administrator may be able to help you determine if there was a system-wide issue causing message delivery failures. Some of these scenarios are listed below. - **Overloaded Server**: The email server might be busy or overloaded, or there may not be enough system resources to process incoming emails. Server outages and disruptions can also cause email delays. - **Network Issues**: When there is a network connectivity issue, many email delivery protocols take a cautious approach, i.e., if the system sending the message is unsure whether the email was successfully delivered, it will re-attempt the delivery. If it turns out the initial delivery attempt was successful, the second attempt will produce a duplicate email message. - **Send/Receive Cycle**: Some email platforms can be configured to check the email server at specific intervals (i.e., send and receive intervals). If your email platform isn't set to check the email server regularly for new messages, there may be a delay in receiving incoming messages. --- URL: https://docs.pagerduty.com/incident-management/notifications/notification-troubleshooting/expected-notification-behavior # Expected Notification Behavior Troubleshoot missed notifications caused by service settings, notification rules, unsupported countries, or assignment gaps. There are some scenarios where you may expect to receive a notification, but the criteria for sending a notification were not met. Some of these situations are outlined in the sections below. ## Supported Countries PagerDuty can send notifications to many, but not all, countries around the world. Please see [Supported Countries](/incident-management/notifications/supported-countries) to confirm whether PagerDuty supports notifications to your region. **SMS Responses**: Even if PagerDuty can send SMS notifications to your country, SMS responses may not be supported. Please see the section [SMS Notifications](/incident-management/notifications/supported-countries#text-notifications) to confirm whether SMS responses are supported. ## Service Settings Depending on how your services are configured, it may be expected that incidents do not trigger. You can read more information on the following sections in [Configurable Service Settings](/incident-management/services/configurable-service-settings). - **Service is Disabled or in a Maintenance Window**: If a service is [disabled](/incident-management/services/services-and-integrations#disable-a-service) or in a [Maintenance Window](/incident-management/services/maintenance-windows), incidents will not trigger. As a result, incident notifications, including push notifications, will not go out. - **Support Hours**: If the service has [support hours](/incident-management/incidents/dynamic-notifications#defined-support-hours) enabled, PagerDuty will send incident notifications according to these settings. Support hours settings will determine how incidents are triggered during and outside of support hours. - **Notification Settings**: A service's default [notification urgency](/incident-management/services/configurable-service-settings#notification-urgency) may not align with the notification urgency you were expecting. For example: - High-urgency incidents triggered on the service will override low-urgency service settings. - If high-urgency notifications are the default for the service, then you will be notified according to your high-urgency notification rules. Your low-urgency notification rules would not apply to incidents triggered on this service. - **Alert Grouping**: With [alert grouping](/ai-automation/aiops/overview#noise-reduction) enabled, alerts will group into an open incident to reduce notification noise. You will not receive a separate notification for subsequent alerts that group into the open incident. - **Acknowledgement Timeout**: With the [acknowledgement timeout](/incident-management/services/configurable-service-settings#acknowledgement-timeout) feature enabled, an acknowledged incident will **re-trigger** after a specified amount of time. When the incident re-triggers, it re-notifies assigned responders and, if on-call responsibilities have rotated since the incident triggered, the current on-call user, too. - **Auto-Resolution**: With the [auto-resolution](/incident-management/services/configurable-service-settings#auto-resolution) feature enabled, incidents triggered on the service will automatically resolve after a given amount of time, thereby halting any further notifications from being sent. ## Notification Rules When an incident triggers and is assigned to you, PagerDuty will notify you depending how you have configured notification rules in your [User Profile](/account-admin/user-profile). If you are not receiving notifications as expected, please check the following items to confirm your notification rules are configured correctly: - **Notification Rules**: Navigate to **User Profile** → **Notification Rules** tab, and confirm that your [notification rules](/account-admin/user-profile/notification-rules) match the expected behavior. - **Notification Timing**: [Staggering your notification rules](/account-admin/user-profile/notification-rules#when-a-high-urgency-incident-is-assigned-to-me) can help with delays that sometimes occur when a large volume of notifications are delivered at once. ## Incident Assignment Notifications On-call responders can expect to receive notifications when an incident is assigned to them. In addition to the following points, the sections [Escalation Targets](/incident-management/schedules/escalation-policies#escalation-targets) and [Notification Behavior](/incident-management/schedules/escalation-policies#notification-behavior) contain additional details about how PagerDuty determines who is on call (i.e., who to notify) when an incident triggers. - **Check That You Were On Call**: Check the user and schedule targets in the services' escalation policy, to determine who was on call at the time the incident triggered. - **Check the Escalation Policy**: Verify that the impacted service is [associated with the correct escalation](/incident-management/services/configurable-service-settings#assign-to-escalation-policy) policy, and that the appropriate schedule(s) are associated with that escalation policy. - **No One was On Call**: Incidents will not trigger on a service during times when [no one is on call](/incident-management/incidents/why-incidents-fail-to-trigger#no-one-was-on-call). - **Check the Escalation Path**: Review the [incident timeline](/incident-management/incidents/overview#incident-timeline) to confirm if the incident was resolved or acknowledged before it would have escalated to you. - **Inbound Events**: The event may not have made it through to PagerDuty, or there may have been an issue with the payload's header or body. Review the [Alerts Table](/incident-management/incidents/alerts/alerts-table) to confirm if PagerDuty created an alert associated with the event. - **Acknowledge/Resolve**: PagerDuty will not send incident notifications while an incident is in the acknowledged or resolved state. Find the acknowledge and resolve timestamps in the incident timeline, and compare the timestamps to the notification delivery timing configured in your [Notification Rules](/account-admin/user-profile/notification-rules). The incident may have been acknowledged or resolved before the notification was scheduled for delivery. - **Event Orchestration**: If an inbound event matches a [Suppress incident and notifications](/ai-automation/aiops/event-orchestration#incident-data) condition set in a global or service orchestration, no notifications will go out. - **Snooze/Suspend**: Review the incident timeline to confirm if the incident was snoozed or suspended at the time you were expecting the incident notification. ## Responder Notifications When a user is [added as a Responder](/incident-management/incidents/add-responders) to an incident, they will receive notifications about the request. - **Responders List**: Check the **Responders** section on the incident page to verify if you were requested as a Responder, or [included in the escalation policy](/incident-management/schedules/escalation-policies#escalation-targets) that was requested as a Responder. - **Requesting an Escalation Policy**: A Responder from the escalation policy may have already joined the incident, which halts Responder requests from being sent to users on higher levels of the escalation policy. - **Incident Resolved**: Review the [incident timeline](/incident-management/incidents/overview#incident-timeline), to confirm if the incident was resolved before the Responder request would have escalated to you. - **High Urgency Notification Rules**: Responder requests are sent in accordance with your high-urgency notification rules. Low-urgency notification rules do not apply to Responder notifications. ## Stakeholder Notifications Please read more information about the points listed below in [Communicate with Stakeholders](/incident-management/communicate/communicate-with-stakeholders). - **Subscribe to an Incident**: To confirm that you are subscribed to an incident, on an incident's details page navigate to the **Status Updates** tab → **Manage Subscribers** and scroll to the **Subscribers** section. - **Post a Status Update**: Stakeholders will receive a subscriber notification when a [status update is published](/incident-management/communicate/communicate-with-stakeholders#status-updates). Check an incident's **Status Updates** tab or the [incident timeline](/incident-management/incidents/overview#incident-timeline), to confirm which status updates, if any, you should have received. - **Status Updates vs. Incident Assignment** : Stakeholders do not receive notifications when a user is assigned to an incident. - **Multiple Subscriptions**: Review an incident's **Subscribers** section to check if you appear in the list more than once. This may cause the same status update to be delivered to you multiple times, or cause notification deliverability issues or delays, which will impact your ability to receive the status updates. ## On-Call Handoff Notifications PagerDuty can send On-Call Handoff Notifications (OCHONs) when a user is about to go on or off call. Please read [On Call Handoff Notification Settings](/incident-management/schedules/escalation-policies#on-call-handoff-notification-settings) for more information. - **Check the Schedule**: Check the [schedule](/incident-management/schedules/schedule-basics), to confirm that you are scheduled to go on call. - **Check the Escalation Policy**: Check that the schedule is associated to an escalation policy, and verify that the escalation policy is associated to an enabled service. - **Requirements**: - You must have on-call handoff notifications configured in your [User Profile](/account-admin/user-profile/notification-rules#on-call-handoff-notifications). - You must be a target on an escalation policy, either as a user in the escalation policy, or on a schedule in the escalation policy. - The escalation policy must either have [OCHONs enabled always](/incident-management/schedules/escalation-policies#on-call-handoff-notification-settings) or be in use by a service that is not in a disabled state. - **Restrictions**: - PagerDuty only sends on-call handoff notifications via push notifications and email. - PagerDuty can only send on-call handoff notifications up to 48 hours in advance of a user going on or off call. --- URL: https://docs.pagerduty.com/incident-management/notifications/notification-troubleshooting/phone-notification-troubleshooting # Phone Notification Troubleshooting Troubleshoot issues with phone notifications > **Pre-Checks:** Please complete the [Notification Troubleshooting Pre-Checks](/incident-management/notifications/notification-troubleshooting) before proceeding with this article. Depending on the country where you are located and which cellular provider you use, a variety of issues may affect your ability to receive and respond to PagerDuty phone notifications. For these reasons, PagerDuty does not have full control over the deliverability of phone notifications. We highly recommend using [push notifications](/account-admin/user-profile/contact-information#view-mobile-app-devices) and [Slack](/account-admin/user-profile/contact-information#add-a-slack-contact-method) as your primary notification methods, as these mechanisms are 99.99% reliable. [Staggering your notification rules](/account-admin/user-profile/notification-rules) can also help deliverability. If other notification methods are not a viable option, the following sections provide troubleshooting tips for phone notification delivery issues. > **Toll-Free Numbers:** Toll-free numbers are not supported as a contact method. Toll-free numbers are subject to additional regulations and restrictions that differ by region/country, and reliable delivery cannot be guaranteed. ## Check Country Availability There may be regulatory policies or carrier restrictions preventing PagerDuty from delivering phone notifications to your location. You can review the full list of countries that are able to receive phone notifications from PagerDuty in [Supported Countries](/incident-management/notifications/supported-countries#phone-notifications). Check this list before conducting further troubleshooting. Countries marked with an asterisk (`*`) indicate **Partial Support** due to local restrictions and regulations in the region. ## Duplicate Phone Notifications PagerDuty relies on third-party vendors to deliver phone notifications. These vendors, in turn, rely on several phone partners and carriers to deliver phone calls to end users. PagerDuty relies on a delivery receipt from carriers and providers to determine if a phone notification was delivered. In cases where a delivery receipt is not received, PagerDuty takes a cautious approach and sends the notification again. If the first notification was successful, this will result in a duplicate notification. Consider reaching out to your provider if you are experiencing issues with duplicate notifications. Notifications may also appear as duplicates if there are duplicated incidents, or if you have configured your [notification rules](/account-admin/user-profile/notification-rules) to send multiple notifications. ## Phone Notification Not Received ### Check PagerDuty Check the incident and user configuration in PagerDuty to determine if a notification should have been sent. - **Notification Rules**: A phone call is only placed if your [notification rules](/account-admin/user-profile/notification-rules) include a phone contact method for the incident's urgency. Navigate to **User Icon** → **My Profile** → **Notification Rules** tab and confirm you have a rule that notifies you by phone. - **Incident Timeline**: An incident's timeline keeps a log of all attempted incident notifications. If you do not see an entry for the expected phone notification, review [Expected Notification Behavior](/incident-management/notifications/notification-troubleshooting/expected-notification-behavior) to determine why a notification was not sent. - **Incorrect or Inactive Number**: Navigate to your [user profile](/account-admin/user-profile/contact-information) and confirm your phone number for errors or missing digits. Inactive and invalid numbers will result in delivery failure. ### Check Mobile Device Settings Check if any [mobile device settings](/get-started/mobile-app-settings) are enabled that may prevent you from receiving the notification. - **Blocked Number**: Check your mobile device to confirm if any settings are enabled to block calls from unknown numbers. - **Third-Party Apps**: Issues may occur when delivering phone notifications to virtual numbers from third-party messaging apps. In the event of an application outage or service degradation, you may not be able to receive calls to your virtual number. We recommend sending phone notifications to your primary mobile device instead. ### Check for Provider Issues Check if there were any local or provider issues that affected your ability to receive phone calls. - **Carrier Outage**: Check with your mobile service provider to confirm if there was an outage or service issue at the time you were expecting to receive the notification. - **Roaming**: Prior to traveling, check with your mobile service provider to confirm if there are any additional requirements or restrictions when traveling. - **Cell Service**: Phone notifications may not be delivered to areas with poor cell service, such as inside a building with thick walls, remote areas with limited service coverage, or underground. - **Do Not Call Registry**: Your phone number may be registered in a do-not-call registry, which may prevent you from receiving calls from certain numbers. - **Call Routing**: The call may have gone through a call routing or call transfer system that did not route the call properly. ## Response Did Not Action the Incident - [Touch-Tone Multi-Frequency (DTMF) Issues](#touch-tone-multi-frequency-dtmf-issues) - [Performing an Incident Action on an Old Notification](#performing-an-incident-action-on-an-old-notification) ### Touch-Tone Multi-Frequency (DTMF) Issues Touch-tone multi-frequency (DTMF) signals are the beeping tones generated from keypad responses. They let you navigate menus, select options, and input information. When the signal is interrupted or unclear, unintended behavior may occur. - **Connection Issues**: A weak signal, data packet loss, or overloaded infrastructure can disrupt the clear transmission of DTMF signals. - **Carrier Issues**: Compatibility issues, misconfigured system settings, or outdated equipment can sometimes cause DTMF signals to be misinterpreted. This can be more common with older phones or specific VoIP services. - **Keypad Buttons**: Worn-out or sticky buttons on your device's keypad may not register presses accurately. Try cleaning them or using a different device. - **Audible Touch Tones**: If you turn off audible touch tones, the signal cannot be sent back to our providers and the keypad response will not update the incident. - **Android Devices**: Navigate to **Settings** → **Sound & Notification** → **Audible touch tones/Dial pad tones** → **Enable Audible Touch Tones**. - **WiFi Calling**: DTMF tones may not work when WiFi calling is enabled. ### Performing an Incident Action on an Old Notification PagerDuty takes a cautious approach to notifications so that older notifications do not overwrite newer, important [incident state](/incident-management/incidents/overview) changes. The following are examples of incident state changes: - Escalations - Resolves - Reassigning an incident Once an incident changes state, you can no longer take action on it using older notifications that were generated prior to the state change. ## Phone Numbers with Extensions To send phone notifications to a number with an extension, refer to the following article sections: - [Phone Contact Methods with an Extension or Delay](/account-admin/user-profile/contact-information#phone-contact-methods-with-an-extension-or-delay) - [Phone Number Formatting](/account-admin/user-profile/contact-information#phone-number-formatting) ## Call Length Restrictions Phone notifications are limited to two minutes and 30 seconds. After that point, the call will end, which may cause some calls to be cut short. --- URL: https://docs.pagerduty.com/incident-management/notifications/notification-troubleshooting/push-notification-troubleshooting # Push Notification Troubleshooting Troubleshoot issues with push notifications > **Pre-Checks:** Please complete the [Notification Troubleshooting Pre-Checks](/incident-management/notifications/notification-troubleshooting) before proceeding with this article. Push notifications are the most reliable and robust method of notification delivery. - 99.99% reliability backed by Apple and Google’s world class data centers - Push notifications are not subject to local regulations that SMS and phone notification have - Push notifications do not rely on aging and unreliable carrier networks for SMS and phone notifications - Providers filter/drop SMS notifications based on the content in the SMS notification - Data suggests 6x faster MTTA when responders have push notifications enabled - We highly recommend push notifications as a 0-minute rule. For more information regarding best practices for setting up notification rules, please read the section [Stagger Notification Rules](/account-admin/user-profile/notification-rules#when-a-high-urgency-incident-is-assigned-to-me). ## General Troubleshooting - [Download the Most Recent Version of the Mobile App](#download-the-most-recent-version-of-the-mobile-app) - [In-App Troubleshooting](#in-app-troubleshooting) - [Enable Push Notifications in the Mobile App](#enable-push-notifications-in-the-mobile-app) - [Perform a Reset](#perform-a-reset) - [Send a Test Notification in the Web App](#send-a-test-notification-in-the-web-app) - [Check Push Notifications for Other Apps](#check-push-notifications-for-other-apps) - [Check Firewall and Network Connection](#check-firewall-and-network-connection) - [Check Blocked Devices on the User Profile Page](#check-blocked-devices-on-the-user-profile-page) ### Download the Most Recent Version of the Mobile App In some cases, there may be issues receiving push notifications if the mobile app version is out-of-date. You can download the most recent version of the PagerDuty mobile app from [Google Play](https://play.google.com/store/apps/details?id=com.pagerduty.android) or the [App Store](https://apps.apple.com/us/app/pagerduty/id594039512). Please see our [System Requirements](/get-started/system-requirements#mobile-apps) for supported app versions and platforms. ### In-App Troubleshooting You can test notifications in the mobile app: 1. Navigate to **More** → **Settings**. 2. Tap **Troubleshoot Notifications**. Tests will automatically begin, with green check marks indicating success. If an issue is identified, an error message will suggest troubleshooting steps. ### Enable Push Notifications in the Mobile App In the mobile app, navigate to **More** → **Settings** and verify that you have the following settings configured in the **Notifications** section: - Confirm that **Push Notifications** have been enabled/toggled on (iOS). - Under **High-Urgency**, select a sound that will play when you receive push notifications for high-urgency incidents. - _Optional_: Under **Low-Urgency**, deactivate the **Mute Sound** toggle and select a sound that will play when you receive push notifications for low-urgency incidents. ### Perform a Reset **In the PagerDuty app:** You may wish to reset your push notification settings and preferences. 1. Remove the Account: 1. **On Android**: Navigate to **More**, tap the menu to the right of the account, and tap **Remove this account**. 2. **On iOS**: Navigate to **More** → **User Icon** (top-left). Tap **Edit**, then tap next to the desired account. Tap **Delete** to confirm your selection. 2. Force close the app. 3. Open the app and [log in to your PagerDuty account](/get-started/log-in-to-pagerduty#log-in-via-the-web-or-mobile-app). **In the Settings app:** 4. You can also reset the app in your device’s settings app: 1. **On Android**: Open the **Settings** app and navigate to **Apps** → **All Apps** → **PagerDuty** → **Storage & Cache**, then select **Clear Cache**. 2. **On iOS**: Open the **Settings** app, select **PagerDuty**, then turn the **Reset** toggle to the on position. ### Send a Test Notification in the Web App These steps outline how to send a test notification to the mobile app from the web app: 1. [Add your device as a contact method](/account-admin/user-profile/contact-information#add-a-contact-method) and [add a notification rule](/account-admin/user-profile/notification-rules) for the device. 2. Enable notifications for the PagerDuty app in your phone's Settings. 3. Confirm you have the [most recent version of the mobile app](#download-the-most-recent-version-of-the-mobile-app). 4. In the web app, navigate to **User Icon** → **My Profile**. With the **Contact Information** tab selected, click **Test** to the right of your device’s name. ### Check Push Notifications for Other Apps In rare circumstances, Apple may block specific devices from its Apple Push Notification Service. If you have any other apps that use push notifications, verify whether those apps are able to receive push notifications. Also please check your Notification Center to see when you were last able to receive a push notification. For Android, updating your phone may change the device ID. This can affect push notification delivery. ### Check Firewall and Network Connection You'll need an internet connection to register the PagerDuty app. If the device is connected to Wi-Fi (and no cellular connection is available), inbound and outbound TCP packets need to be sent over port `5223`. Check to see whether a firewall is blocking these requests. To work around a firewall that is blocking push notification registration, turn your device's Wi-Fi off, log out of the PagerDuty app, and log in again while using a cellular data connection. You can confirm that registration was successful in the web app on your user profile page; your device should appear in the **Mobile App** section. ### Check Blocked Devices on the User Profile Page If you uninstall and reinstall the PagerDuty mobile app, you may find multiple instances of the same device listed in the **Mobile App** section. Only one device can be registered at a time, and some entries may show **Blocked** next to them. You can remove a **Blocked** device by clicking to the right of the device. This will also remove any [notification rules](/account-admin/user-profile/notification-rules) associated with the device. ## Other Common Issues - **Opt Out**: This is a common reason, especially on iOS devices where apps must explicitly ask for permission to allow notifications. - **Do Not Disturb (DND)**: Certain notifications may be silenced when DND or Focus mode is enabled. - **Low App Usage**: Some manufacturers will restrict notifications from infrequently used apps. - **Battery Optimization or Power Saving Mode**: Aggressive battery optimization may limit background app activity, affecting notification delivery. - **Internet Connection**: Service outages or degradation may impact the deliverability of push notifications. - **Limited Resources**: Push notifications cannot be delivered if the device does not have enough resources to receive and store notifications. - **Outdated Operating System**: Older operating systems might have compatibility issues with some notification systems. ## Troubleshoot Push Notification Sounds - **Volume Muted or Low**: The expected notification sound may not play if your device is silenced, or the volume is too low. - **Notification Sound Disabled**: Check if you have sound enabled for PagerDuty app notifications. - **Competing Sounds**: Other audio sources (e.g., loud music) can mask notification sounds. - **Headphones or Bluetooth Audio Connected**: Audio may be directed to a different output than expected. - **Notification Tone**: It can be hard to hear soft or non-distinctive notification sounds. - **Decibel Limits**: Some devices include settings that limit the decibel of incoming notifications. This may cause unexpected behavior if there are any sound settings that would cause notification sounds to exceed the limit. ## Android Device Troubleshooting This guide covers common troubleshooting steps for notification issues specific to Android devices. Please see the section [General Troubleshooting](#general-troubleshooting) before using this guide. - [Enable Push Notifications](#enable-push-notifications) - [Battery-Saving Mode](#battery-saving-mode) - [Override System Volume](#override-system-volume) - [Sound Issues](#sound) - [Configure Override Do Not Disturb Manually](#manually-configure-override-do-not-disturb-for-pagerduty-contact) ### Enable Push Notifications In order to receive push notifications on your Android device, [Google Play Services](https://play.google.com/store/apps/details?id=com.google.android.gms&hl=en_US&gl=US) must be enabled. If Google Play Services are enabled and the [General Troubleshooting](#general-troubleshooting) steps have not resolved the issue, you can try resetting the app. To reset the app, navigate to **Settings** → **Apps** → **All apps** → **PagerDuty** and tap **Clear Storage**. ### Battery-Saving Mode Some users have reported delayed notifications while using a battery-saving mode. You can adjust this setting for PagerDuty by going to **Settings** → **Battery** → **Battery usage** → **PagerDuty** and selecting **Unrestricted**. Other phones may have this setting labeled as **Don't wake for notifications**, which you can disable to prevent notification delays. ### Override System Volume > **Limitation:** PagerDuty cannot override the volume for phone calls and SMS. Recent versions\* of our Android app offer a feature called Override System Volume. This feature is enabled by default but can be disabled by deselecting the checkbox. \*\*_OnePlus devices on Android 10 and higher do not support Override System Volume for the PagerDuty app._ 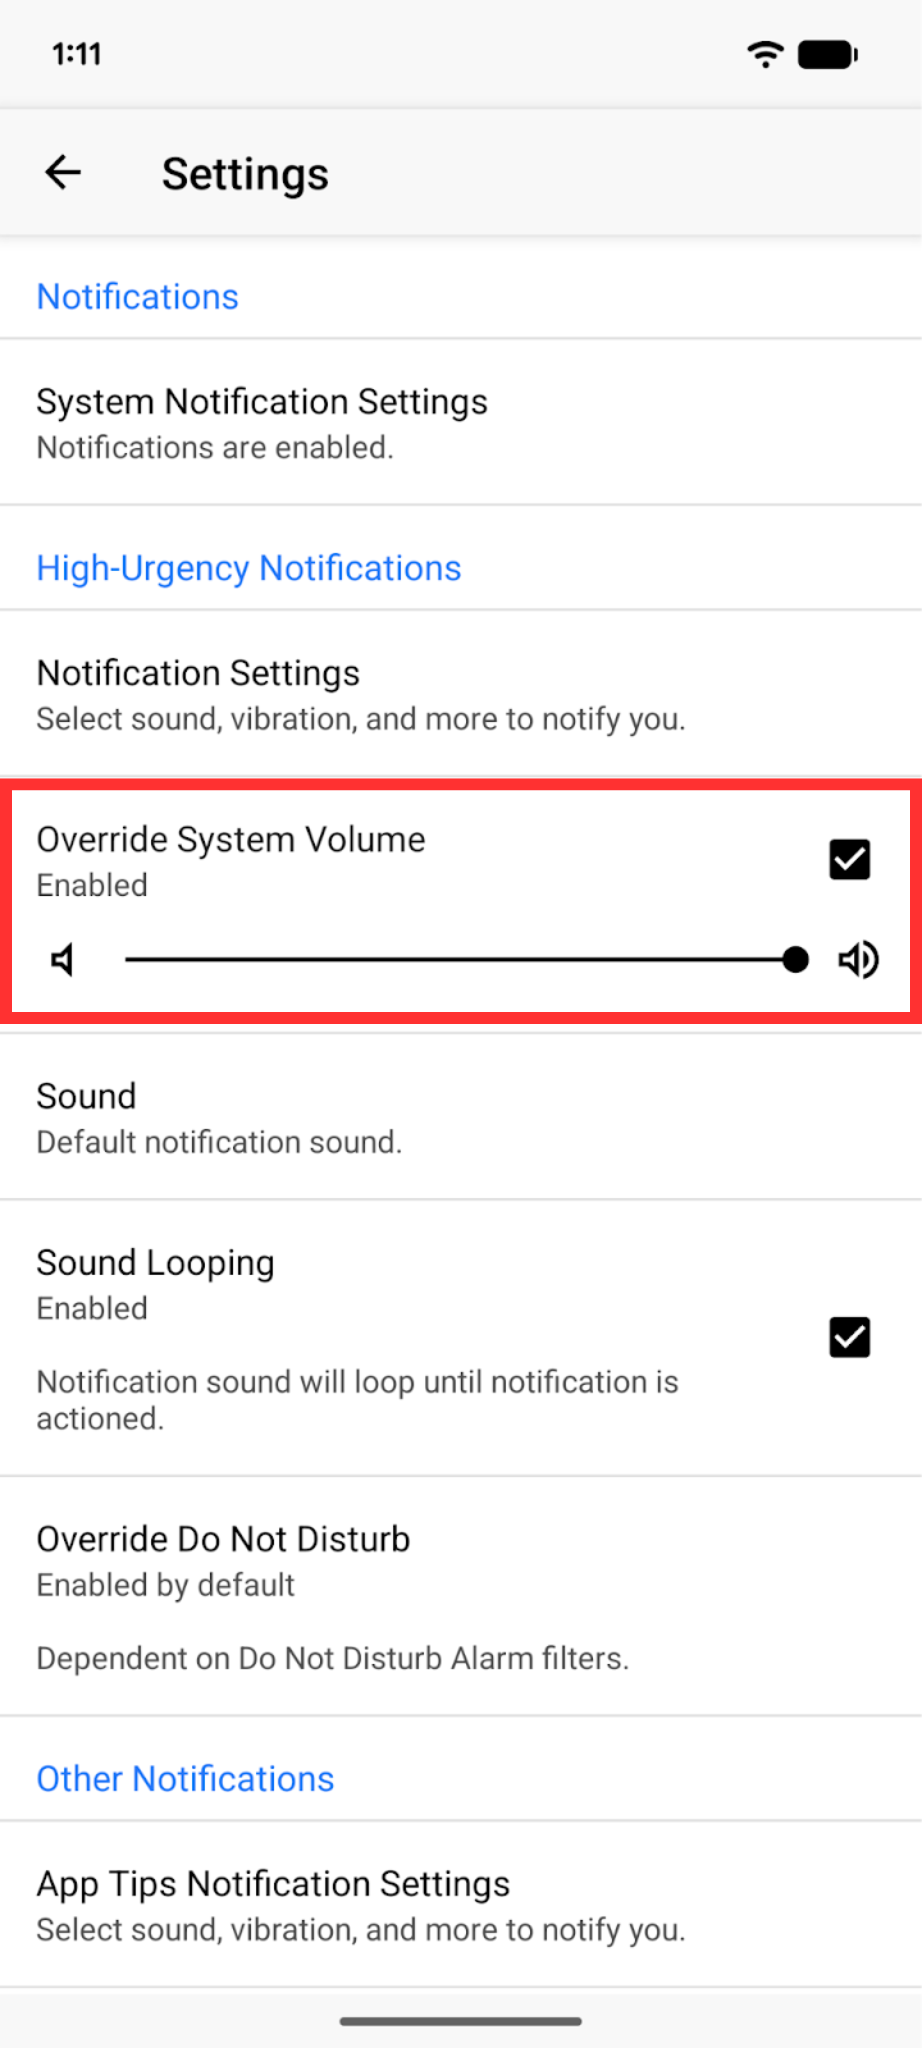 *Override System Volume setting* ### Sound > **Notification Channel Settings:** The sound in your device's High-Urgency Notification Channel settings must be set to "None". If a sound is set here, you will hear two notification sounds. The app will display a warning if this is detected. If Override System Volume is enabled for High-Urgency Notifications, it will play as an Alarm sound by default. To change the sound, open **Settings → Sound**. Additionally, ensure that **Settings → Notification Settings → Select Sound** is set to **None**. Sound Looping allows the notification sound to loop until the notification is actioned. If disabled, the notification sound will play once and the alarm volume will be reset after a short period of time. 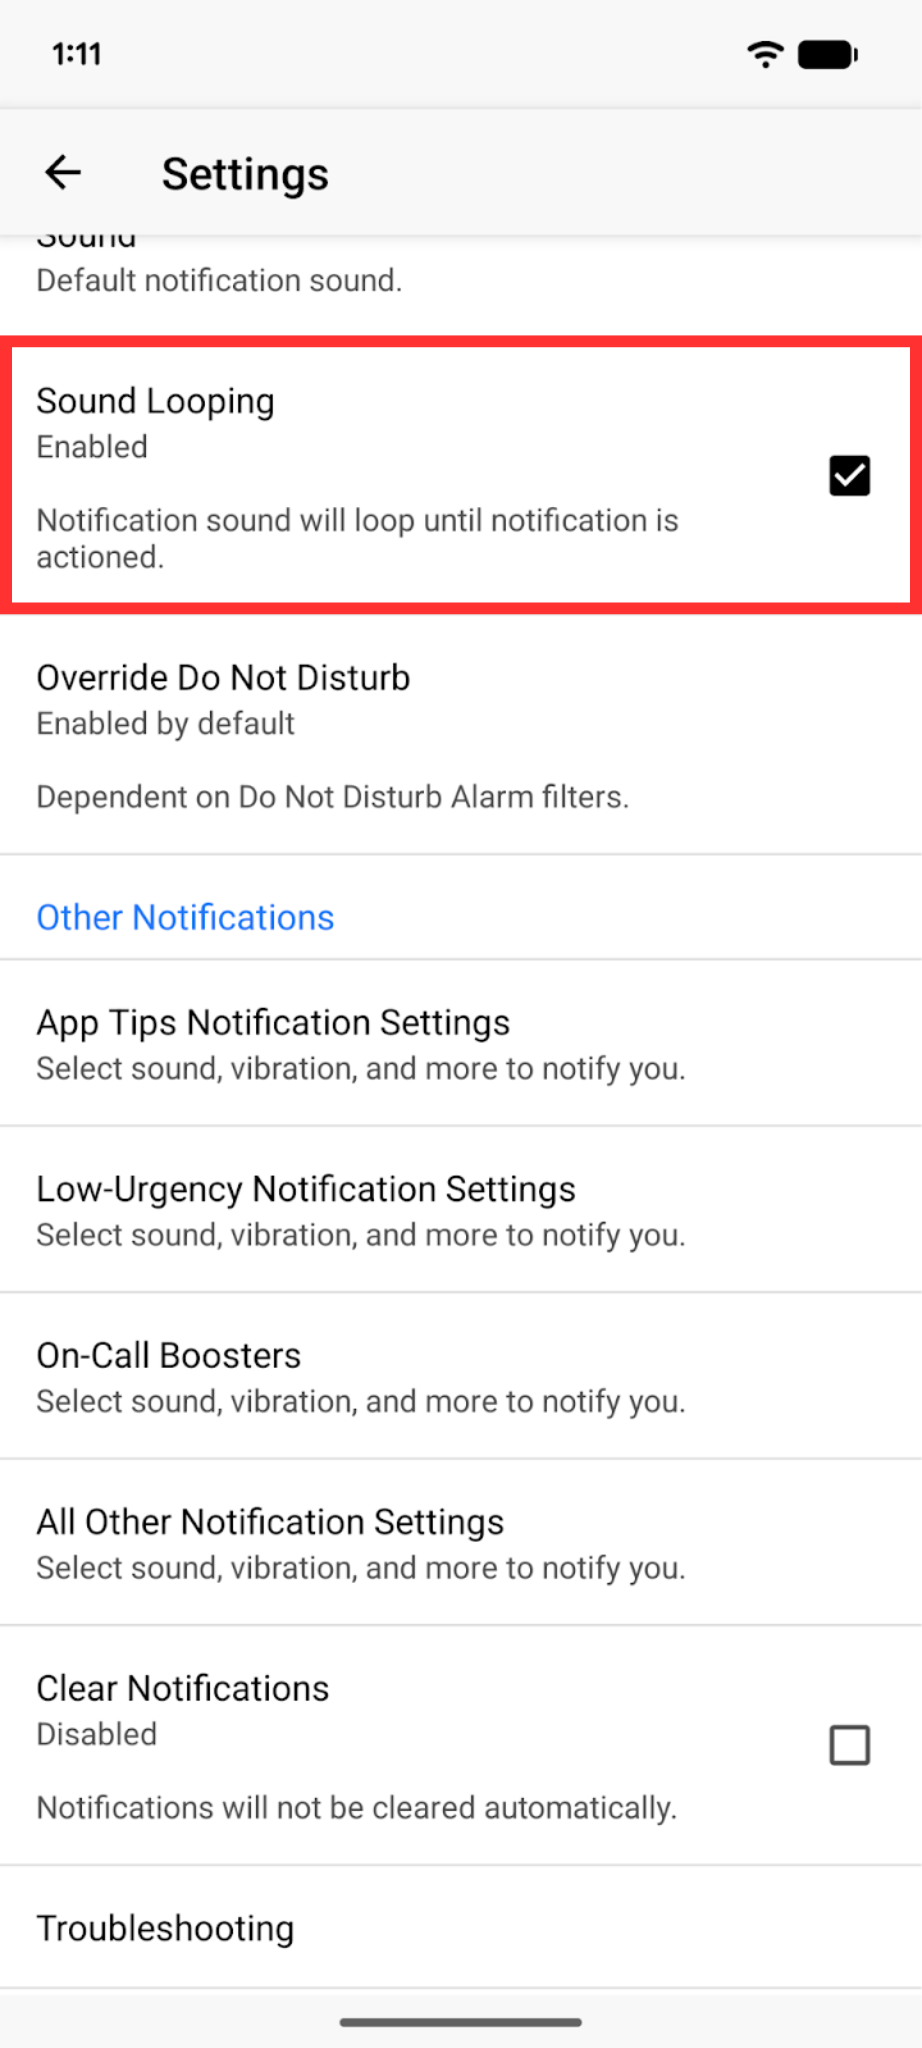 *Sound Looping setting* ### Other Sound Issues If you are receiving push notifications but are unable to hear a sound, please confirm the following: - Android requires a sound to be selected for push notifications. Select a sound under **Settings** → **Sound & vibration** → **Default notification sound**. - Check to see if any other volume-manipulating apps are running. ### Manually Configure Override Do Not Disturb for PagerDuty Contact On some Android devices, the mobile app cannot automatically read from your Do Not Disturb (DND) settings. You can manually add PagerDuty to your DND settings, though: 1. Navigate to your phone's **Settings** and select **Notifications**. 2. Tap **Do not disturb**. 3. Tap **App notifications**. 4. Add the PagerDuty app to **Allow during Do not disturb**. 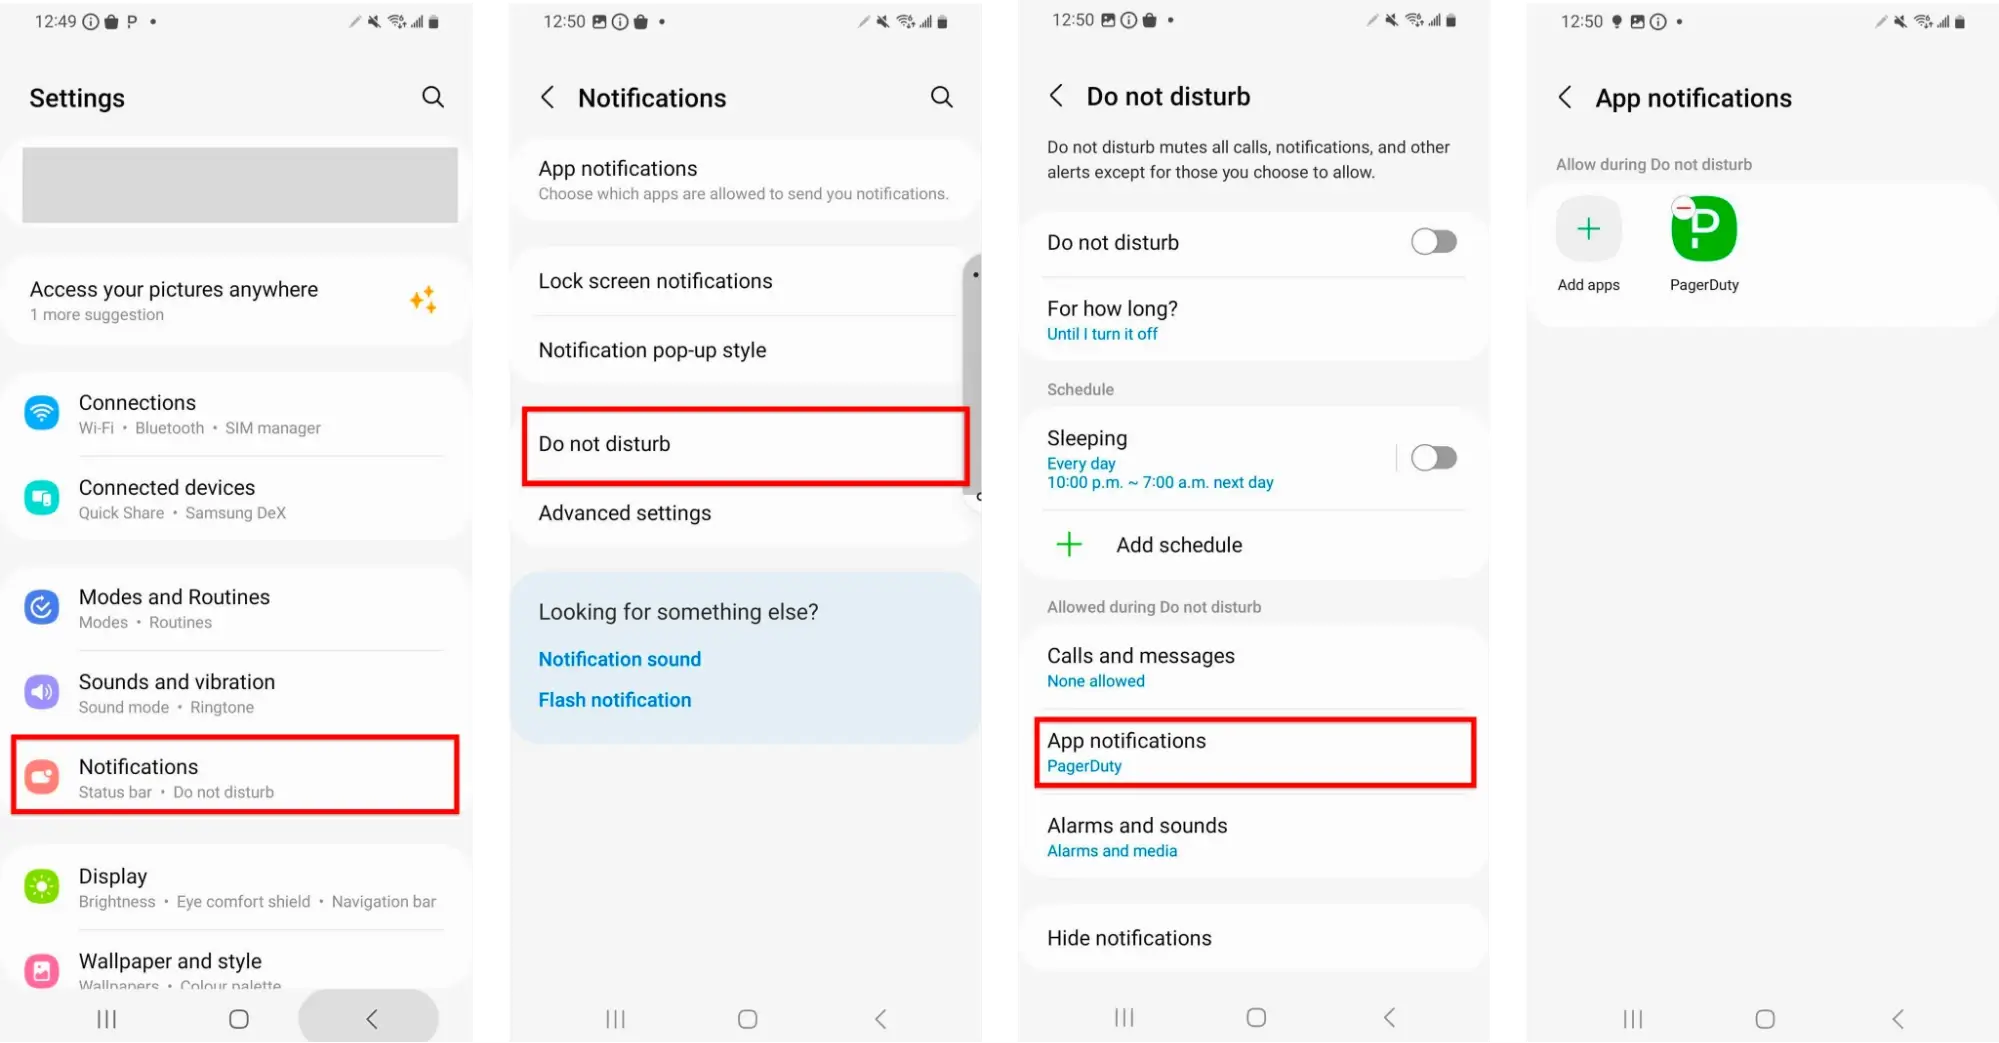 *Manually configure override Do Not Disturb* If you are using Android's **Modes** feature to enable Do Not Disturb, you must edit the Mode's settings to allow notifications from PagerDuty. Each Mode has its own **Allow during Do not disturb** list. > **Allow the PagerDuty Contact to Override Do Not Disturb:** To have phone call and SMS notifications override Do Not Disturb, you will first need to allow the PagerDuty contact to override Do Not Disturb. Please see [High-Urgency Override Do Not Disturb](/get-started/mobile-app-settings#high-urgency-override-do-not-disturb). ## Apple Device Troubleshooting This guide covers common troubleshooting steps for notification issues specific to Apple devices. Please see the section [General Troubleshooting](#general-troubleshooting) for initial troubleshooting steps. - [Enable Notifications](#enable-notifications) - [Verify Your Device is Registered with PagerDuty](#verify-your-device-is-registered-with-pagerduty) - [Push Notification Doesn't Produce Sound](#push-notification-doesn't-produce-sound) - [Apple Watch Notification Troubleshooting](#apple-watch-notification-troubleshooting) ### Enable Notifications In iOS, it is possible to turn off notifications for individual apps. In the Settings app, tap Notifications and make sure the PagerDuty app is listed and enabled to play sounds and show Alerts or Banners. These are the app's default settings. If you don't see the PagerDuty app in Notifications, it is possible you didn’t allow PagerDuty to send push notifications when installing the app. Apple suggests following these steps to enable notifications: 1. Delete the PagerDuty app from your device. 2. Turn off your device completely and turn it back on. 3. Go to **Settings** → **General** → **Date & Time** and set the date ahead a day or more. 4. Turn the device off completely again and turn it back on. 5. Reinstall PagerDuty and tap **Allow** when prompted to allow push notifications. ### Verify Your Device is Registered with PagerDuty After logging in, PagerDuty registers your device's push notification token to our system. This allows us to send push notifications. In the PagerDuty web app, confirm that your device is listed on your [user profile](/account-admin/user-profile/contact-information) under Contact Information. If it is not in this section, or you see multiple devices, you'll need to allow notifications when opening the app for the first time. You may also delete and reinstall the app to re-register your device. For more information, please read [Log in to the Mobile App](/get-started/mobile-app#log-in-to-the-mobile-app). ### Push Notification Doesn't Produce Sound If push notifications come through, but do not make a sound, in addition to checking sound settings, [make sure that your device's Ring/Silent switch is set to Ring](https://support.apple.com/en-us/HT203794). If your device is on silent or vibrate, then PagerDuty notifications will also be on silent or vibrate. Lastly, check that you are signed in to your Apple ID on your iOS device. Go to **Settings** → **Apple Account** and enter your Apple ID and password. ### Apple Watch Notification Troubleshooting If there is an issue receiving notifications on your Apple Watch, make sure that you've [logged in to the PagerDuty app](/get-started/mobile-app#log-in-to-the-mobile-app) on your iPhone. Then please check the following: 1. Your Apple Watch must be on your wrist to receive notifications. 2. Your iPhone must be locked to receive watch notifications. 3. On your iPhone, notifications must be turned on for the PagerDuty app _and_ the Apple Watch app. 1. You can find this under **Settings** → **Notifications** → **PagerDuty** → **Allow Notifications**. --- URL: https://docs.pagerduty.com/incident-management/notifications/notification-troubleshooting/sms-notification-troubleshooting # SMS Notification Troubleshooting Troubleshoot issues with SMS notifications > **Pre-Checks:** Please complete the [Notification Troubleshooting Pre-Checks](/incident-management/notifications/notification-troubleshooting) before proceeding with this article. ## Not Receiving Your SMS Verification Code Before you can receive SMS notifications, you must verify your phone number with a six-digit code sent by SMS. If the verification code does not arrive when you [add an SMS contact method](/account-admin/user-profile/contact-information#add-an-sms-contact-method), the cause is usually the same as for any other undelivered SMS: - **Resend the code.** In the verification modal, click **Resend code** to send a new one. Verification codes are delivered only to the number being added — they cannot be sent to a different number or user. - **Confirm your country is supported.** Verification codes are subject to the same regional restrictions as all SMS. If your country is marked with an asterisk (`*`) in [Supported Countries](/incident-management/notifications/supported-countries#text-notifications), partial support may block the code. Countries with no SMS support cannot receive verification codes at all. - **Check the number and its format.** A number entered with a trunk prefix or in the wrong format can fail silently. See [Phone Number Formatting](/account-admin/user-profile/contact-information#phone-number-formatting). - **Rule out the same blockers as any SMS.** Carrier filtering, blocked or unknown-number settings, short-code restrictions, VoIP or virtual numbers, and roaming can all stop a verification code. See [Other Common Causes](#other-common-causes) and [SMS Restrictions](#sms-restrictions) below. If the code still does not arrive, PagerDuty recommends using the [PagerDuty Mobile App](/get-started/mobile-app) with push notifications as your primary contact method — push does not require SMS verification and is significantly more reliable. > **Unverified Numbers:** If you leave a contact method unverified for an hour or longer, PagerDuty sends a reminder email (once per contact method). Users added via the REST API must verify their number manually in the web app. SMS notification delivery is affected by your country, cellular provider, and carrier restrictions. PagerDuty does not have full control over SMS deliverability. Push notifications are the recommended primary contact method. Push notifications are configured automatically when you [log in to the mobile app](/get-started/mobile-app#log-in-to-the-mobile-app). You can also add a [notification rule](/account-admin/user-profile/notification-rules) for your mobile device. If push notifications are not a viable option, the sections below provide troubleshooting steps for SMS delivery issues. ## Countries Eligible for SMS Notifications Review [Supported Countries](/incident-management/notifications/supported-countries#text-notifications) for the full list of countries that can receive SMS notifications from PagerDuty. Confirm your country is on this list before troubleshooting further. Countries marked with an asterisk (`*`) indicate **Partial Support** due to local restrictions and regulations. PagerDuty cannot guarantee delivery of SMS notifications to the following number types: - Landlines, including those with Text-to-Landline (TTL) services. - Voice Over Internet Protocol (VoIP) or virtual numbers. ## Duplicate SMS Notifications PagerDuty relies on third-party vendors to deliver SMS notifications. Those vendors rely on SMS partners and carriers to deliver messages to end recipients. PagerDuty depends on a delivery receipt from carriers and providers to confirm whether an SMS was delivered. If no delivery receipt is received, PagerDuty resends the notification. If the original notification was delivered successfully but no receipt was returned, this results in a duplicate notification. ## Regulatory Policies and Carrier Restrictions SMS content and format are heavily regulated by governments and carriers due to concerns around fraud, abuse, and aging SMS infrastructure. Vendors drop SMS messages for regulatory non-compliance and policy violations. The list below does not represent an exhaustive or deterministic set of filtering criteria, as carriers and governments do not publish or provide feedback on their policies. | Cause | Recommended Action | | :--------------------------------------------------------------------------- | :---------------------------------------------------------------------------------------------------------------------------------------------------------------------------------------------------------------------------------------------------------------------------- | | Messages containing URLs are highly likely to be filtered. | Do not include URLs in [stakeholder updates](/incident-management/communicate/communicate-with-stakeholders#status-updates) or in service logs that may appear in incident notifications. Public URL shorteners are not supported due to carrier restrictions. This applies to all SMS notification types. | | Messages containing words that resemble fraud, spam, or marketing campaigns. | Avoid words such as "banking," "finance," "marketing," and "sale" where possible. | ### Messages Without Sensitive Content If your SMS notifications do not contain sensitive content but are still being filtered: - Submit a request to your mobile service provider asking them to allow all SMS messages from PagerDuty numbers. You can download the most recent PagerDuty numbers from the [PagerDuty vCard](/incident-management/notifications/notification-phone-numbers#pagerduty-vcard). - Use [push notifications](/get-started/mobile-app#log-in-to-the-mobile-app) as your primary contact method. For more information about the SMS regulatory landscape and why PagerDuty recommends switching to modern channels such as push notifications. ## Other Common Causes - [Incorrect or Inactive Number](#incorrect-or-inactive-number) - [Blocked Number](#blocked-number) - [Third-Party Apps](#third-party-apps) - [Carrier Outage](#carrier-outage) - [Roaming](#roaming) - [Mobile Device Settings](#mobile-device-settings) ### Incorrect or Inactive Number Navigate to your user profile's [Contact Information](/account-admin/user-profile/contact-information) and confirm your phone number for errors or missing digits. Inactive and invalid numbers result in delivery failure. ### Blocked Number Your mobile device may have settings that block messages from unknown numbers, or you may have sent an opt-out reply such as "STOP" that blocked further SMS communications. Some carriers also restrict SMS messages from certain number types. ### Third-Party Apps Delivering SMS notifications to virtual numbers from third-party messaging apps may cause issues. During an application outage or service degradation, you may not receive messages sent to a virtual number. Send SMS notifications to your primary mobile device instead. ### Carrier Outage Check with your mobile service provider to confirm whether there was an outage or service issue at the time you expected to receive the notification. ### Roaming Before traveling, check with your mobile service provider to confirm whether there are any additional requirements or restrictions while roaming. ### Mobile Device Settings Check whether any [mobile device settings](/get-started/mobile-app-settings) prevented you from receiving the notification. ## SMS Response Did Not Action the PagerDuty Incident - [Dual-Tone Multi-Frequency (DTMF) Issues](#dual-tone-multi-frequency-dtmf-issues) - [Performing an Incident Action on an Old Notification](#performing-an-incident-action-on-an-old-notification) - [SMS Notification Responses](#sms-notification-responses) ### Dual-Tone Multi-Frequency (DTMF) Issues Dual-tone multi-frequency (DTMF) signals are the tones generated by keypad responses. They allow you to navigate menus, select options, and input information. When a signal is interrupted or unclear, unintended behavior may occur. | Cause | Description | | :---------------- | :-------------------------------------------------------------------------------------------------------------------------------------------------------------------------------------- | | Connection issues | A weak signal, data packet loss, or overloaded infrastructure can disrupt DTMF signal transmission. | | Carrier issues | Compatibility issues, misconfigured system settings, or outdated equipment can cause DTMF signals to be misinterpreted. This is more common with older phones or certain VoIP services. | | Keypad buttons | Worn-out or sticky buttons may not register presses accurately. Clean the keypad or try a different device. | ### Performing an Incident Action on an Old Notification PagerDuty takes a cautious approach to notifications so that older notifications do not overwrite newer [incident state](/incident-management/incidents/overview) changes. The following incident state changes prevent action on prior notifications: - Escalations - The incident is resolved - The incident is reassigned Once an incident changes state, you can no longer take action on it using notifications generated before the state change. ### SMS Notification Responses Due to a variety of factors, some countries may not support responding to SMS messages to acknowledge or resolve an incident, even if you can receive SMS notifications. See the full list in [Supported Countries](/incident-management/notifications/supported-countries#text-notifications). ## SMS Restrictions - [Short Code Messaging Restrictions](#short-code-messaging-restrictions) - [Provider-Specific Issues with Short Codes](#provider-specific-issues-with-short-codes) - [Geographic Restrictions](#geographic-restrictions) - [Message Length Restrictions](#message-length-restrictions) ### Short Code Messaging Restrictions Some mobile carriers restrict messages from or to short codes. If you are not receiving SMS notifications from PagerDuty and your phone number meets any of the conditions below, contact your provider to verify that your account is allowed to receive SMS from short codes: - Pay-as-you-go numbers. - Any number that was pay-as-you-go and is now on a standard plan. - Any number that is or was used by a business. ### Provider-Specific Issues with Short Codes - T-Mobile USA has a default content filter enabled. To remove the content filter, call T-Mobile and authorize PagerDuty's short code numbers: `73889`, `42752`, and `43105`. - If you recently upgraded your device with T-Mobile, a block may have been placed on the account that prevents it from receiving short code messages. ### Geographic Restrictions #### SMS URL Content Restrictions To comply with local laws and regulations, URLs in SMS messages are replaced with the words `URL redacted` in the following countries: - Malaysia - Philippines - Thailand #### India's Do Not Disturb (DND) Registry The Telecom Regulatory Authority of India (TRAI) maintains a Do Not Disturb (DND) registry. If your number is on this registry, it may cause issues receiving PagerDuty notifications. See TRAI's documentation at [Unsolicited Commercial Communication](https://trai.gov.in/preference-registration) for information about managing your contact preferences. ### Message Length Restrictions The following maximum length constraints apply by notification type: | Notification Type | Maximum Length | | :------------------------------------------------------------------------------------------------------ | :------------- | | [Incident response](/incident-management/notifications/notification-content-and-behavior#respond-to-an-sms-notification) notifications | 160 characters | | [Status update stakeholder](/incident-management/communicate/communicate-with-stakeholders#sms-status-update) notifications | 450 characters | If you use a custom [Status Update Template](/incident-management/communicate/status-update-templates) and notice messages are truncated, update your templates to keep the message length under 450 characters. ## Best Practices Push notifications and Slack are significantly more reliable than SMS and are the recommended primary [contact methods](/account-admin/user-profile/contact-information). [Staggering your notification rules](/account-admin/user-profile/notification-rules#when-a-high-urgency-incident-is-assigned-to-me) may also improve SMS deliverability. --- URL: https://docs.pagerduty.com/incident-management/notifications/supported-countries # Supported Countries Countries that PagerDuty supports for SMS, WhatsApp, and phone call notifications PagerDuty offers multiple [notification options](/incident-management/notifications/notification-content-and-behavior). You can receive email, Slack, and push notifications anywhere in the world; however, the availability of [SMS](#text-notifications) and [phone notifications](#phone-notifications) varies depending on your country and your PagerDuty account's status (paid or trial). If you plan to receive SMS or phone notifications in a country that is not listed in the previous section (for example, while traveling), functionality may be limited and delivery is not guaranteed. If your PagerDuty account was created prior to February 12, 2024, you may have [legacy access](https://support.pagerduty.com/main/docs/supported-countries-legacy) to SMS and/or phone notifications in additional countries not listed in the previous section. ## Text Notifications > **Tip:** Most PagerDuty users can take action on an incident by [responding to an SMS notification](/incident-management/notifications/notification-content-and-behavior#respond-to-an-sms-notification). Due to a variety of factors, such as local carrier restrictions, government regulation, and/or fraud prevention measures, this may not be the case for all users. If you live in a region where SMS responses are not supported, where there is only Partial Support (indicated by a \* below), or where SMS notifications are currently unsupported, use the [PagerDuty mobile app](/get-started/mobile-app) (available for iOS and Android), which makes use of push notifications, to take action on incidents. > **Message and Data Rates:** In some countries, message and data rates may apply to messages sent to you and your replies to these messages. > **Reading This Table:** A country marked with an asterisk (\*) has **Partial Support**: the ability to receive and/or respond to notifications may be limited. PagerDuty sends notification requests to its provider partners in these countries, however local SMS carrier restrictions and/or government regulation may limit delivery. In these regions, PagerDuty strongly recommends removing URLs from all user-generated content, reviewing content for sensitive categories, and setting up push notifications as your primary notification method. Countries with no asterisk have full support. | Country | Country Code | Paid Account | Trial Account | Responses Supported | WhatsApp Supported | | :------------------------------- | :----------- | :----------- | :------------ | :------------------ | :----------------- | | Afghanistan\* | 93 | ✓ | | ✓ | | | Algeria\* | 213 | ✓ | | ✓ | | | Argentina | 54 | ✓ | | | ✓ | | Armenia | 374 | ✓ | | ✓ | ✓ | | Aruba\* | 297 | ✓ | | ✓ | | | Australia | 61 | ✓ | | | ✓ | | Austria | 43 | ✓ | | | ✓ | | Bahamas\* | 1242 | ✓ | | ✓ | | | Bahrain\* | 973 | ✓ | | ✓ | | | Bangladesh\* | 880 | ✓ | | ✓ | | | Barbados\* | 1246 | ✓ | | ✓ | | | Belarus | 375 | ✓ | | | ✓ | | Belgium | 32 | ✓ | | ✓ | ✓ | | Belize\* | 501 | ✓ | | ✓ | | | Bermuda\* | 1441 | ✓ | | ✓ | | | Bolivia | 591 | ✓ | | ✓ | ✓ | | Botswana\* | 267 | ✓ | | ✓ | | | Bosnia and Herzegovina | 387 | ✓ | | ✓ | | | Brazil | 55 | ✓ | ✓ | ✓ | ✓ | | Bulgaria | 359 | ✓ | | ✓ | ✓ | | Cambodia\* | 855 | ✓ | ✓ | ✓ | | | Cameroon\* | 237 | ✓ | | ✓ | | | Canada | 1 | ✓ | ✓ | ✓ | | | Cayman Islands\* | 1345 | ✓ | | ✓ | | | Chile | 56 | ✓ | | ✓ | ✓ | | China\* | 86 | ✓ | ✓ | | | | Colombia | 57 | ✓ | ✓ | ✓ | | | Costa Rica | 506 | ✓ | | ✓ | | | Croatia | 385 | ✓ | | ✓ | | | Cyprus\* | 357 | ✓ | | ✓ | | | Czech Republic | 420 | ✓ | ✓ | | | | Denmark | 45 | ✓ | | ✓ | | | Dominica\* | 1767 | ✓ | | ✓ | | | Ecuador | 593 | ✓ | | ✓ | ✓ | | Egypt | 20 | ✓ | | ✓ | ✓ | | El Salvador\* | 503 | ✓ | | ✓ | | | Equatorial Guinea\* | 240 | ✓ | | ✓ | | | Estonia | 372 | ✓ | | ✓ | ✓ | | Ethiopia\* | 251 | ✓ | | ✓ | | | Finland | 358 | ✓ | | | ✓ | | France | 33 | ✓ | ✓ | | | | Georgia | 995 | ✓ | | ✓ | ✓ | | Germany | 49 | ✓ | | ✓ | | | Ghana\* | 233 | ✓ | | ✓ | | | Gibraltar\* | 350 | ✓ | | ✓ | | | Greece | 30 | ✓ | ✓ | | ✓ | | Grenada\* | 1473 | ✓ | | ✓ | | | Guam\* | 1671 | ✓ | ✓ | ✓ | | | Guatemala | 502 | ✓ | | ✓ | ✓ | | Guinea\* | 224 | ✓ | | ✓ | | | Haiti\* | 509 | ✓ | | ✓ | | | Honduras\* | 504 | ✓ | | ✓ | | | Hong Kong | 852 | ✓ | ✓ | | ✓ | | Hungary | 36 | ✓ | ✓ | ✓ | ✓ | | Iceland\* | 354 | ✓ | ✓ | ✓ | | | India | 91 | ✓ | ✓ | ✓ | ✓ | | Indonesia | 62 | ✓ | ✓ | | ✓ | | Ireland | 353 | ✓ | ✓ | ✓ | ✓ | | Israel | 972 | ✓ | ✓ | ✓ | ✓ | | Italy | 39 | ✓ | | ✓ | ✓ | | Ivory Coast\* | 225 | ✓ | | | | | Jamaica\* | 1876 | ✓ | | ✓ | | | Japan | 81 | ✓ | | ✓ | ✓ | | Jordan\* | 962 | ✓ | | ✓ | | | Kazakhstan | 7 | ✓ | | ✓ | ✓ | | Kenya\* | 254 | ✓ | | ✓ | | | Kuwait\* | 965 | ✓ | | | | | Kyrgyzstan\* | 996 | ✓ | | ✓ | | | Laos\* | 856 | ✓ | | ✓ | | | Lebanon\* | 961 | ✓ | | ✓ | | | Libya\* | 218 | ✓ | | ✓ | | | Luxembourg | 352 | ✓ | | ✓ | ✓ | | Macau\* | 853 | ✓ | | ✓ | | | Macedonia\* | 389 | ✓ | | ✓ | | | Malaysia\* | 60 | ✓ | ✓ | | | | Malta\* | 356 | ✓ | | ✓ | | | Mauritius\* | 230 | ✓ | | ✓ | | | Mexico | 52 | ✓ | ✓ | ✓ | ✓ | | Moldova\* | 373 | ✓ | | ✓ | | | Monaco | 377 | ✓ | | ✓ | ✓ | | Montenegro\* | 382 | ✓ | | ✓ | | | Morocco\* | 212 | ✓ | | ✓ | | | Mozambique\* | 258 | ✓ | | ✓ | | | Nepal | 977 | ✓ | | ✓ | ✓ | | Netherlands | 31 | ✓ | | ✓ | | | New Zealand | 64 | ✓ | ✓ | ✓ | ✓ | | Nicaragua\* | 505 | ✓ | | ✓ | | | Nigeria\* | 234 | ✓ | | | | | Norway | 47 | ✓ | ✓ | | ✓ | | Oman\* | 968 | ✓ | | ✓ | | | Pakistan | 92 | ✓ | | ✓ | ✓ | | Palestinian National Authority\* | 970 | ✓ | | ✓ | | | Panama\* | 507 | ✓ | | ✓ | | | Paraguay\* | 595 | ✓ | | ✓ | | | Peru | 51 | ✓ | ✓ | ✓ | ✓ | | Philippines | 63 | ✓ | | | | | Poland | 48 | ✓ | | ✓ | | | Portugal | 351 | ✓ | | ✓ | ✓ | | Puerto Rico | 1787, 1939 | ✓ | ✓ | ✓ | | | Qatar\* | 974 | ✓ | | ✓ | | | Romania | 40 | ✓ | ✓ | | | | Rwanda\* | 250 | ✓ | | | | | St. Kitts and Nevis\* | 1869 | ✓ | ✓ | ✓ | | | St. Lucia\* | 1758 | ✓ | | ✓ | | | St. Pierre and Miguelon\* | 508 | ✓ | | ✓ | | | St. Vincent Grenadines\* | 1784 | ✓ | | ✓ | | | Saudi Arabia | 966 | ✓ | | ✓ | ✓ | | Serbia | 381 | ✓ | | | ✓ | | Seychelles\* | 248 | ✓ | | ✓ | | | Singapore | 65 | ✓ | ✓ | ✓ | ✓ | | Slovakia | 421 | ✓ | | ✓ | ✓ | | Slovenia\* | 386 | ✓ | | ✓ | | | South Africa | 27 | ✓ | | ✓ | ✓ | | South Korea | 82 | ✓ | ✓ | ✓ | | | Spain | 34 | ✓ | | | | | Sri Lanka | 94 | ✓ | | | ✓ | | Sweden | 46 | ✓ | | | ✓ | | Switzerland | 41 | ✓ | | ✓ | ✓ | | Taiwan | 886 | ✓ | | ✓ | | | Tajikistan\* | 992 | ✓ | | ✓ | | | Tanzania\* | 255 | ✓ | | ✓ | | | Thailand\* | 66 | ✓ | ✓ | ✓ | | | Trinidad and Tobago\* | 1868 | ✓ | | ✓ | | | Tunisia\* | 216 | ✓ | | ✓ | | | Turkey | 90 | ✓ | | | | | Uganda\* | 256 | ✓ | | ✓ | | | Ukraine\* | 380 | ✓ | | | ✓ | | United Arab Emirates | 971 | ✓ | | ✓ | ✓ | | United Kingdom | 44 | ✓ | ✓ | ✓ | | | United States of America | 1 | ✓ | ✓ | ✓ | | | Uruguay | 598 | ✓ | | ✓ | ✓ | | U.S. Virgin Islands\* | 1340 | ✓ | ✓ | ✓ | | | Uzbekistan\* | 998 | ✓ | | ✓ | | | Venezuela\* | 58 | ✓ | ✓ | | | | Vietnam | 84 | ✓ | | ✓ | ✓ | | Yemen\* | 967 | ✓ | | ✓ | | | Zambia\* | 260 | ✓ | | | | ## Phone Notifications > **Toll-Free Numbers:** Toll-free numbers are not supported as a contact method. Toll-free numbers are subject to additional regulations and restrictions that differ by region/country, and reliable delivery cannot be guaranteed. > **Phone Notification Responses:** Taking action on an incident by [responding to a phone notification](/incident-management/notifications/notification-content-and-behavior#respond-to-a-phone-notification) is supported in all countries listed below. However, note the countries listed as "Partial Support" via the \* designator, as responding to notifications via phone may not be as reliable there. > **Reading This Table:** A country marked with an asterisk (\*) has **Partial Support**: the ability to receive and/or respond to notifications may be limited due to local regulations and restrictions. In these regions, PagerDuty strongly recommends setting up push notifications as your primary notification method. Countries with no asterisk have full support. > > A double asterisk (\*\*) indicates that, due to local regulations, voice calls are anonymized. Do not rely on caller ID to display "PagerDuty," even after downloading the [vCard](/incident-management/notifications/notification-phone-numbers#pagerduty-vcard). This currently applies to Germany. | Country | Country Code | Paid Account | Trial Account | | :----------------------- | :----------- | :----------- | :------------ | | Argentina | 54 | ✓ | | | Armenia | 374 | ✓ | | | Australia | 61 | ✓ | | | Austria | 43 | ✓ | | | Bahrain | 973 | ✓ | | | Bangladesh\* | 880 | ✓ | | | Belarus\* | 375 | ✓ | | | Belgium | 32 | ✓ | | | Bermuda | 1441 | ✓ | | | Bolivia | 591 | ✓ | | | Bosnia and Herzegovina | 387 | ✓ | | | Brazil\* | 55 | ✓ | ✓ | | Bulgaria\* | 359 | ✓ | | | Canada | 1 | ✓ | ✓ | | Cayman Islands | 1345 | ✓ | | | Chile | 56 | ✓ | | | China\* | 86 | ✓ | | | Colombia | 57 | ✓ | ✓ | | Costa Rica | 506 | ✓ | | | Croatia | 385 | ✓ | | | Cyprus | 357 | ✓ | | | Czech Republic | 420 | ✓ | ✓ | | Denmark | 45 | ✓ | | | Dominica | 1767 | ✓ | | | Dominican Republic | 1809 | ✓ | | | Ecuador | 593 | ✓ | | | Egypt | 20 | ✓ | | | Estonia | 372 | ✓ | | | Finland | 358 | ✓ | | | France | 33 | ✓ | ✓ | | Georgia | 995 | ✓ | | | Germany \*\* | 49 | ✓ | | | Greece | 30 | ✓ | ✓ | | Guam\* | 1671 | ✓ | ✓ | | Honduras | 504 | ✓ | | | Hong Kong | 852 | ✓ | ✓ | | Hungary | 36 | ✓ | ✓ | | Iceland | 354 | ✓ | ✓ | | India | 91 | ✓ | ✓ | | Indonesia | 62 | ✓ | ✓ | | Ireland | 353 | ✓ | ✓ | | Israel | 972 | ✓ | ✓ | | Italy | 39 | ✓ | | | Jamaica | 1876 | ✓ | | | Japan | 81 | ✓ | | | Jordan | 962 | ✓ | | | Kazakhstan | 7 | ✓ | | | Kenya | 254 | ✓ | | | Kyrgyzstan\* | 996 | ✓ | | | Lebanon | 961 | ✓ | | | Luxembourg | 352 | ✓ | | | Macedonia | 389 | ✓ | | | Malaysia | 60 | ✓ | ✓ | | Malta | 356 | ✓ | | | Mauritius | 230 | ✓ | | | Mexico | 52 | ✓ | ✓ | | Moldova | 373 | ✓ | | | Monaco | 377 | ✓ | | | Morocco | 212 | ✓ | | | Nepal | 977 | ✓ | | | Netherlands | 31 | ✓ | | | New Zealand | 64 | ✓ | ✓ | | Nigeria | 234 | ✓ | | | Northern Mariana Islands | 1670 | ✓ | ✓ | | Norway | 47 | ✓ | ✓ | | Pakistan | 92 | ✓ | | | Panama | 507 | ✓ | | | Paraguay | 595 | ✓ | | | Peru | 51 | ✓ | ✓ | | Philippines | 63 | ✓ | | | Poland | 48 | ✓ | | | Portugal | 351 | ✓ | | | Puerto Rico | 1787, 1939 | ✓ | ✓ | | Qatar | 974 | ✓ | | | Romania | 40 | ✓ | ✓ | | Russia | 7 | ✓ | | | Saudi Arabia | 966 | ✓ | | | Serbia | 381 | ✓ | | | Singapore | 65 | ✓ | ✓ | | Slovakia | 421 | ✓ | | | Slovenia | 386 | ✓ | | | South Africa | 27 | ✓ | | | South Korea | 82 | ✓ | ✓ | | Spain | 34 | ✓ | | | Sri Lanka | 94 | ✓ | | | Sweden | 46 | ✓ | | | Switzerland\* | 41 | ✓ | | | Taiwan | 886 | ✓ | | | Thailand | 66 | ✓ | ✓ | | Trinidad and Tobago | 1868 | ✓ | | | Turkey | 90 | ✓ | | | United Arab Emirates | 971 | ✓ | | | United Kingdom | 44 | ✓ | ✓ | | United States of America | 1 | ✓ | ✓ | | Uruguay | 598 | ✓ | | | U.S. Virgin Islands | 1340 | ✓ | ✓ | | Venezuela\* | 58 | ✓ | ✓ | | Vietnam | 84 | ✓ | | | Yemen\* | 967 | ✓ | | ## Test Notifications You can send [test notifications](/account-admin/user-profile/contact-information#test-a-contact-method) to make sure your contact methods are configured correctly. To mitigate fraud and abuse, test notifications for SMS and phone contact methods are not allowed in the following countries. > **Reading This Table:** The countries below have restrictions on test notifications to mitigate fraud and abuse. A country marked with an asterisk (\*) has a **Partial Restriction**: the restriction applies only to SMS test notifications. Countries with no asterisk have the restriction applied to both SMS and phone test notifications. | Country | Country Code | | :---------------- | :----------- | | Algeria | 213 | | Belarus | 375 | | Botswana | 267 | | Bulgaria | 359 | | Cameroon | 237 | | Czech Republic | 420 | | Egypt\* | 20 | | Equatorial Guinea | 240 | | Estonia | 372 | | Ethiopia | 251 | | Ghana | 233 | | Guinea | 224 | | Hungary\* | 36 | | Ivory Coast | 225 | | Kenya | 254 | | Latvia | 371 | | Lebanon | 961 | | Libya | 218 | | Lithuania | 370 | | Moldova | 373 | | Morocco | 212 | | Mozambique | 258 | | Nigeria | 234 | | Poland | 48 | | Romania | 40 | | Rwanda | 250 | | Senegal | 221 | | Serbia | 381 | | Seychelles | 248 | | Slovakia | 421 | | Slovenia | 386 | | South Africa | 27 | | Tanzania | 255 | | Tunisia | 216 | | Uganda | 256 | | Ukraine | 380 | | Uzbekistan\* | 998 | | Zambia | 260 |
--- URL: https://docs.pagerduty.com/incident-management/schedules/edit-schedules # Edit Schedules Add users or create overrides on a schedule. Pause a schedule or restore previous versions. As people join and leave your on-call rotations, you must edit your schedules so that the right people are on-call and notified at the right times. > **Create a Schedule:** If you are creating a schedule for the first time, visit our article on [Schedule Basics](/incident-management/schedules/schedule-basics). > **Schedule Changes:** Any changes made to a schedule (including adding and removing people) do not affect the historical record of that schedule — changes apply only to future dates and times. When adding or removing people, check the effective date to rotate schedules on the right date and time. > > If you want to revert a schedule to a previous version, see the section [Restore a Schedule to a Previous Version](#restore-a-schedule-to-a-previous-version). > **Required User Permissions:** You can add any role to schedules, with the exception of Limited and Full Stakeholders. > > The following roles can add or remove [Teams](/account-admin/teams) while editing: > > - Global Admin > - Account Owner > > The following roles can make other edits to on-call schedules: > > - User role > - Admin/Global Admin > - Manager base roles and team roles. > - Manager Team roles can only manage schedules associated with their Team. > - Account Owner ## Add Users to Existing Schedules To add additional people to an existing on-call schedule: 1. Navigate to **People** → **Schedules**. Click the **** icon to the right of your desired schedule and select **Edit**. 2. In the **Select a user** dropdown, find and select a person. 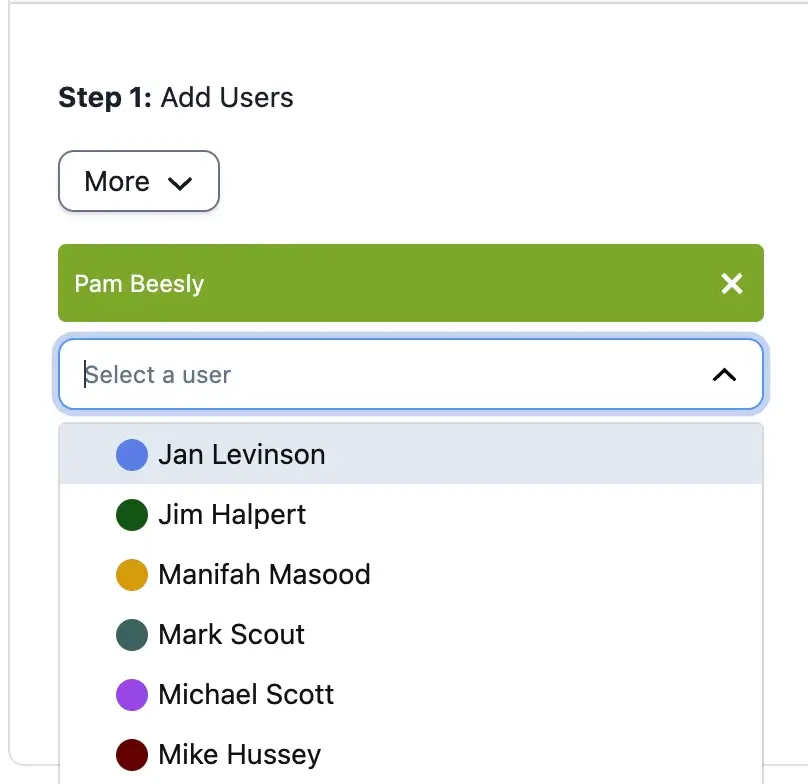 *Select a user* 3. Repeat the previous step until the required people are in the rotation. People move through the rotation in top-to-bottom order. You can drag and drop names to adjust the rotation order. 4. Click **Save Schedule** in the bottom right corner of the screen. > **Inactive Users:** If you see "inactive" next to a person's name on a schedule, it means that their account is deleted. To add this person to a schedule, create a new account for them in [Users](/account-admin/manage-users#add-users) and then add the new account to the rotation. ### Copy Users If you use the same people in multiple layers, you can copy a layer’s participants and paste them into another layer. 1. Navigate to **People** → **Schedules**. Click the **** icon to the right of your desired schedule and select **Edit**. 2. Under **Step 1: Add Users**, click **More** and select **Copy Users**. 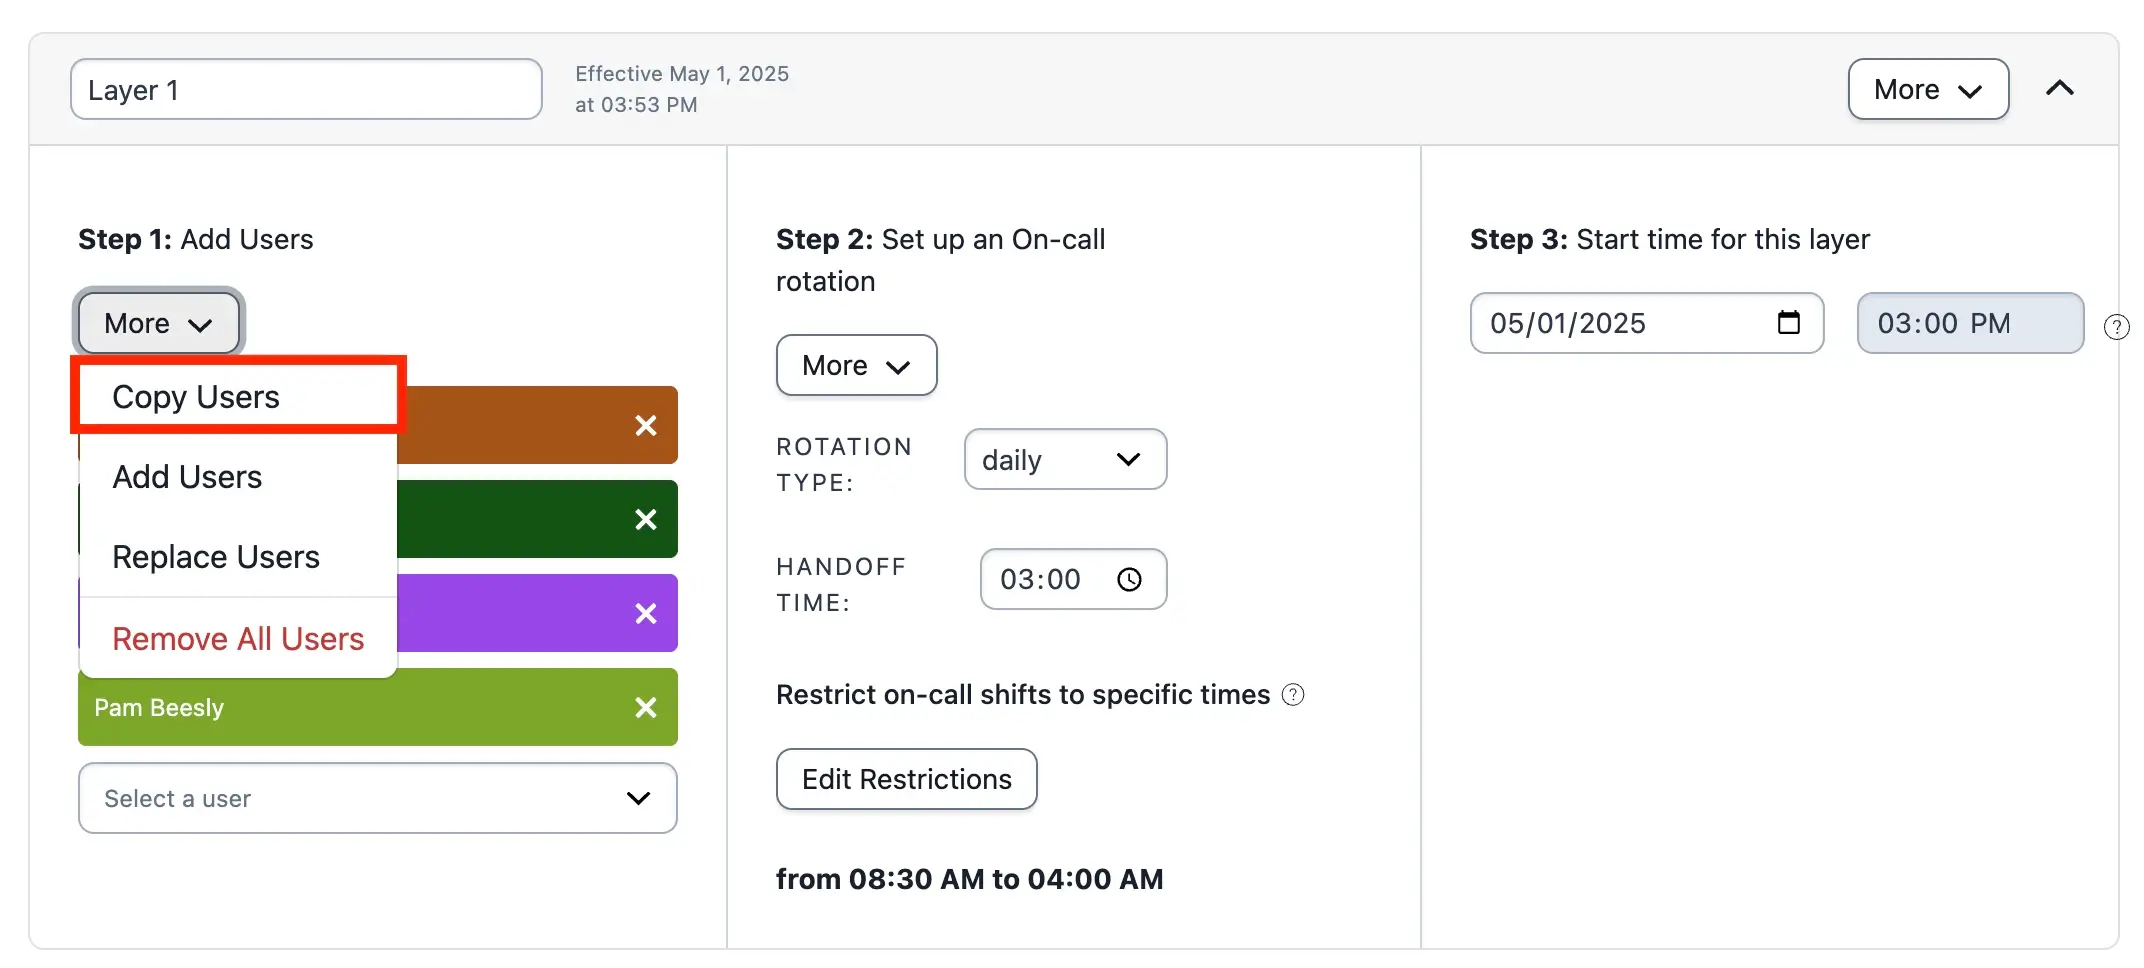 *Copy users from a layer* 3. Select one of the following options: 1. Navigate to the target layer, click **More** and select **Add Users**. This option adds the copied people to the existing ones in that layer. 2. Navigate to the target layer, click **More** and select **Replace Users**. This option overwrites the existing people in that layer. ### Remove Users From Existing Schedules To permanently remove a person from an on-call schedule: 1. Navigate to **People** → **Schedules**. Click the **** icon to the right of your desired schedule and select **Edit**. 2. Click the **** icon next to the name of the person you want to remove.  *Remove a user* 3. Click **Save Schedule** in the bottom right corner. > **Overrides:** Removing a person from a schedule does not delete their future overrides, if any exist. Read [Delete an Override](#delete-an-override) for more information. ## Duplicate a Schedule Copying an existing schedule to create a new one with the same people and settings allows you to create new schedules at scale. You can duplicate a schedule in two places in the web app: - On the [Schedule List](#schedule-list) page - On the [Schedule Details](#schedule-details) page > **Team Association:** The **Team** selection for copied schedules is initially blank. Roles with Team Manager permissions can associate the new schedule with any [Teams](/account-admin/teams) they belong to. ### Schedule List 1. Navigate to **People** → **Schedules**. 2. Click the **** icon and select **Duplicate**. This action creates a new schedule that copies all people and settings from the previous schedule, excluding the team association. 3. Enter a **Schedule Name** for the new on-call schedule and make any necessary edits. 4. Click **Save Schedule**. ### Schedule Details 1. Navigate to **People** → **Schedules** and select the **name** of your desired schedule. 2. On the right side, click **Copy this Schedule**. 3. Enter a **Schedule Name** for the new on-call schedule and make any necessary edits. 4. Click **Save Schedule**. ## Rename Schedule Layers You can edit a schedule layer's name to provide a descriptive title. A schedule layer's name can be up to 100 characters long and supports emojis. 1. Navigate to **People** → **Schedules**. Click the **** icon to the right of your desired schedule and select **Edit**. 2. Click the layer name you want to update and enter a new value. 3. Click **Save Schedule**.  *Edit schedule layer name* ## Reorder Schedule Layers The order of schedule layers determines how the final schedule is computed. For example, if Layer 1 and Layer 2 have shifts that overlap and Layer 2 appears below Layer 1 in the UI, the final schedule includes only shift times from Layer 1 that shifts from Layer 2 do not cover. You can change the order of a schedule's layers to adjust how the final schedule is computed. 1. Navigate to **People** → **Schedules**. Click the **** icon to the right of your desired schedule and select **Edit**. 2. Click and hold the gray bar at the top of the layer you want to move, drag it to your preferred position, and release it. 3. Click **Save Schedule**. > **Note:** Changing the order of schedule layers can cause the final schedule to appear incorrect when viewing past schedules. This occurs because the final schedule was computed using a layer order that is no longer in effect. ## Duplicate a Layer You can duplicate an entire layer’s configuration (including people, on-call rotation type, handoff time, and restrictions) into a new layer. 1. Navigate to **People** → **Schedules**. Click the **** icon to the right of your desired schedule and select **Edit**. 2. Click **More** to the right of the layer you want to duplicate and select **Duplicate Layer**.  *Duplicate a schedule layer* 3. A new layer is created with the same configuration after the last layer in your schedule. You can move this layer by dragging and dropping it to your preferred position. ### Copy Layer Configuration You can copy a layer’s **Rotation Type** and **Handoff Time** configuration and paste it into another layer. This action overwrites the configurations of the target layer. 1. Navigate to **People** → **Schedules**. Click the **** icon to the right of your desired schedule and select **Edit**. 2. Click **More** to the right of the desired layer and select **Copy Layer Configuration**. 3. Navigate to the target layer, click **More** and select **Paste Layer Configuration**. ### Copy Layer Restrictions You can copy a layer’s **Restrict on-call shifts to specific times** configuration into another layer. This action overwrites the configurations of the target layer. 1. Navigate to **People** → **Schedules**. Click the **** icon to the right of your desired schedule and select **Edit**. 2. Under **Step 2: Set up an On-call rotation**, click **More** within the desired layer and select **Copy Layer Restrictions**.  *Copy layer restrictions* 3. Navigate to the target layer, click **More** and select **Replace Layer Restrictions**. 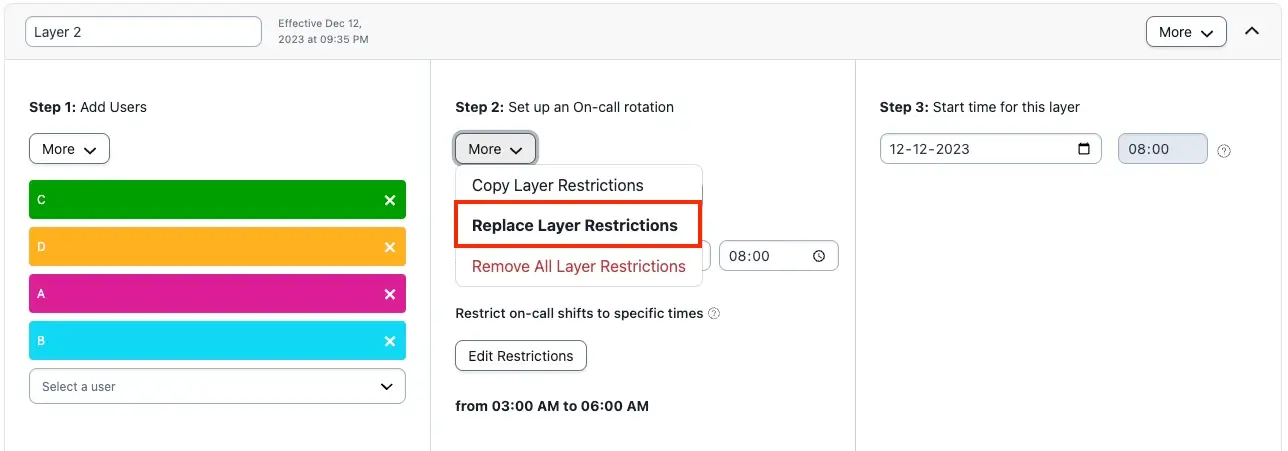 *Replace layer restrictions* 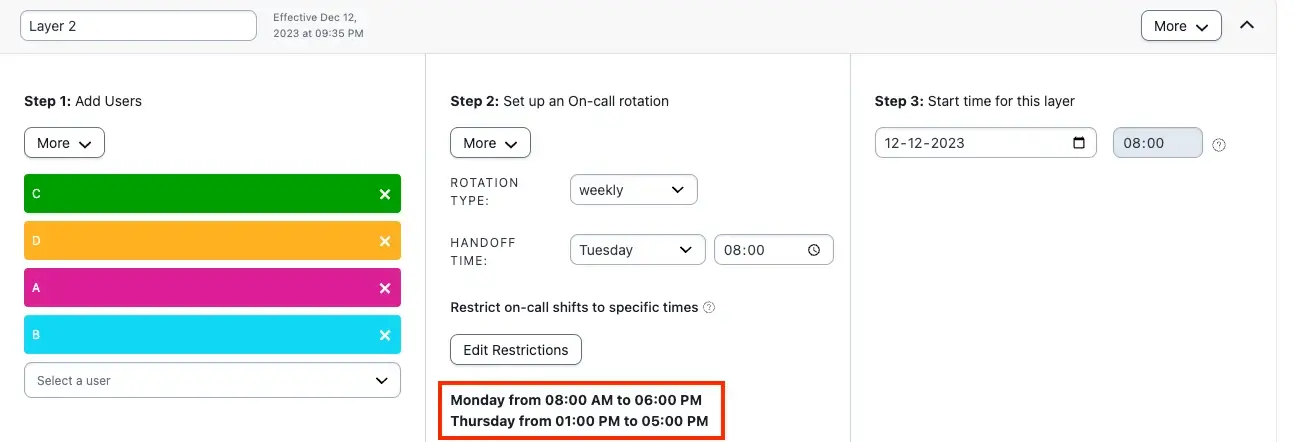 *Layer restrictions* ## Create Overrides Overrides allow you to make manual one-time adjustments to on-call schedules. Overrides are most commonly used when a person is sick, goes on vacation, or wants to swap on-call shifts. Scheduling an override creates an override layer on a schedule. Scheduled overrides display beneath your schedule layers as the lowest layer before the **Final Schedule**. 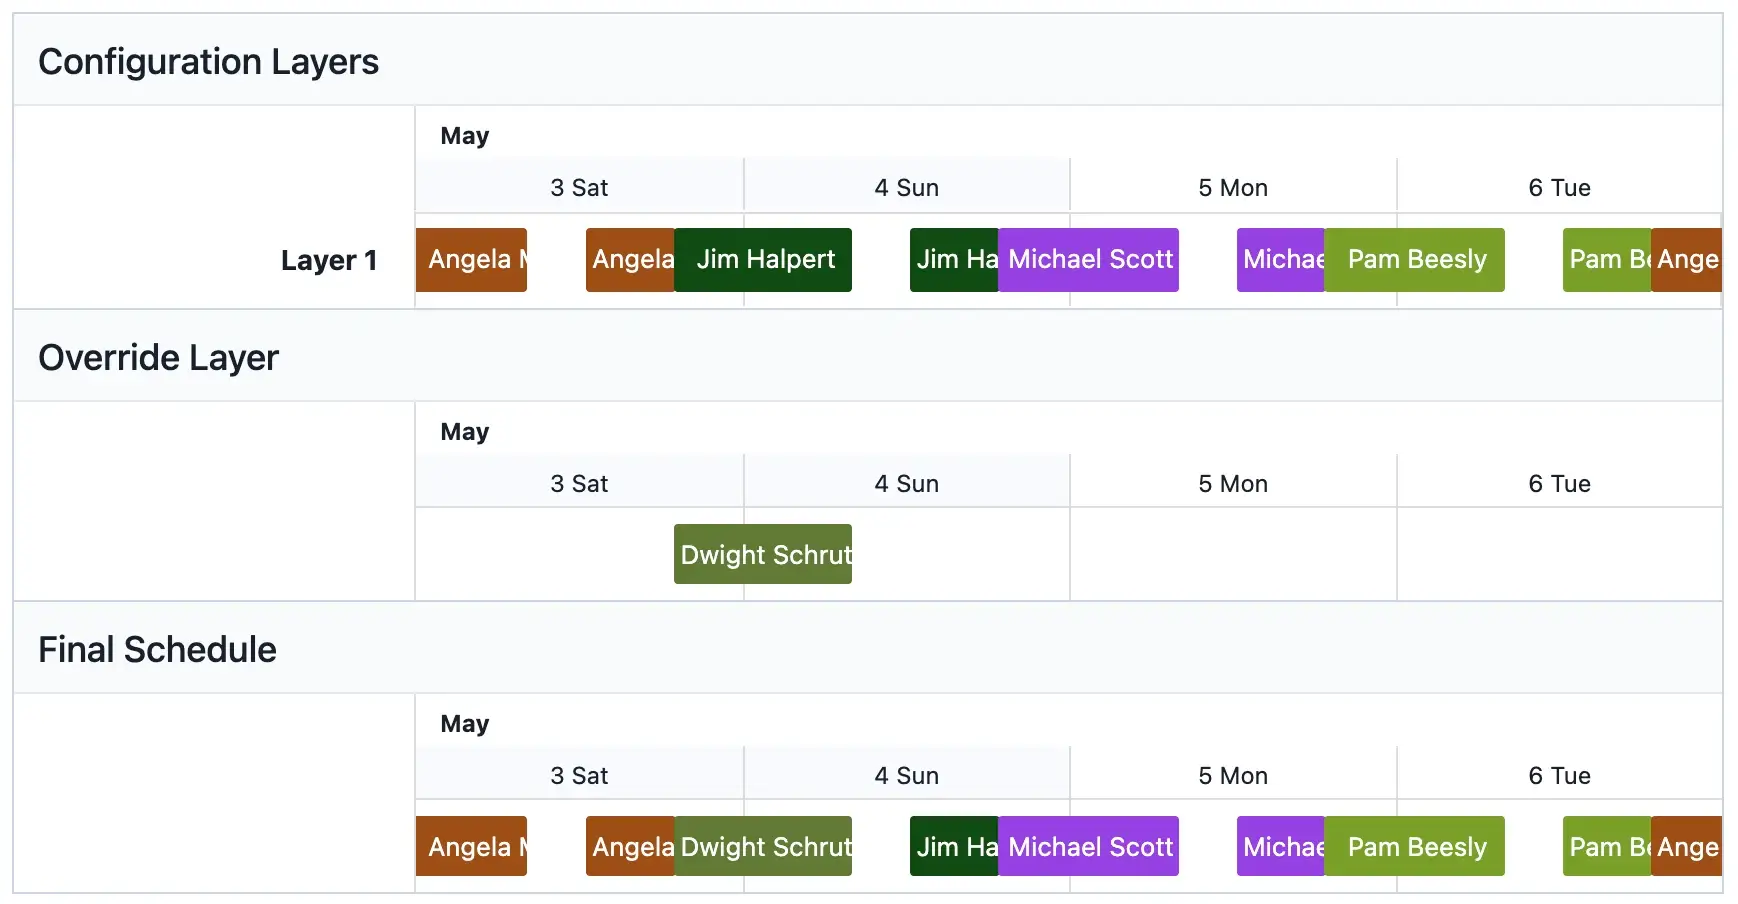 *Override layer on the final schedule* You can create overrides in the [web app](#create-overrides-in-the-web-app) or [using the REST API](#create-overrides-using-the-rest-api). > **Required User Permissions:** All roles, with the exception of Restricted Access, Observers, Limited Stakeholders, and Full Stakeholders, can create overrides. ### Create Overrides in the Web App You can schedule overrides on existing schedules in two places: - On a specific schedule shift - On any span of time on a schedule #### Override a Specific Schedule Shift Scheduling an override by selecting a specific shift pre-populates the relevant information. 1. Navigate to **People** → **Schedules**. 2. From the **Schedules** page or from a schedule's edit page, click directly on the shift you want to override. You can tab forward by days, weeks, and months to locate the shift if necessary. 3. In the **Schedule an Override** modal, fill out or confirm the following fields: | Field | Action | | :------------------------------ | :---------------------------------- | | **Who should take this shift?** | Select the person taking the shift. | | **Start Date** | Confirm or edit the start date. | | **Start time** | Confirm or edit the start time. | | **End Date** | Confirm or edit the end date. | | **End time** | Confirm or edit the end time. | 4. Click **Create Override**. 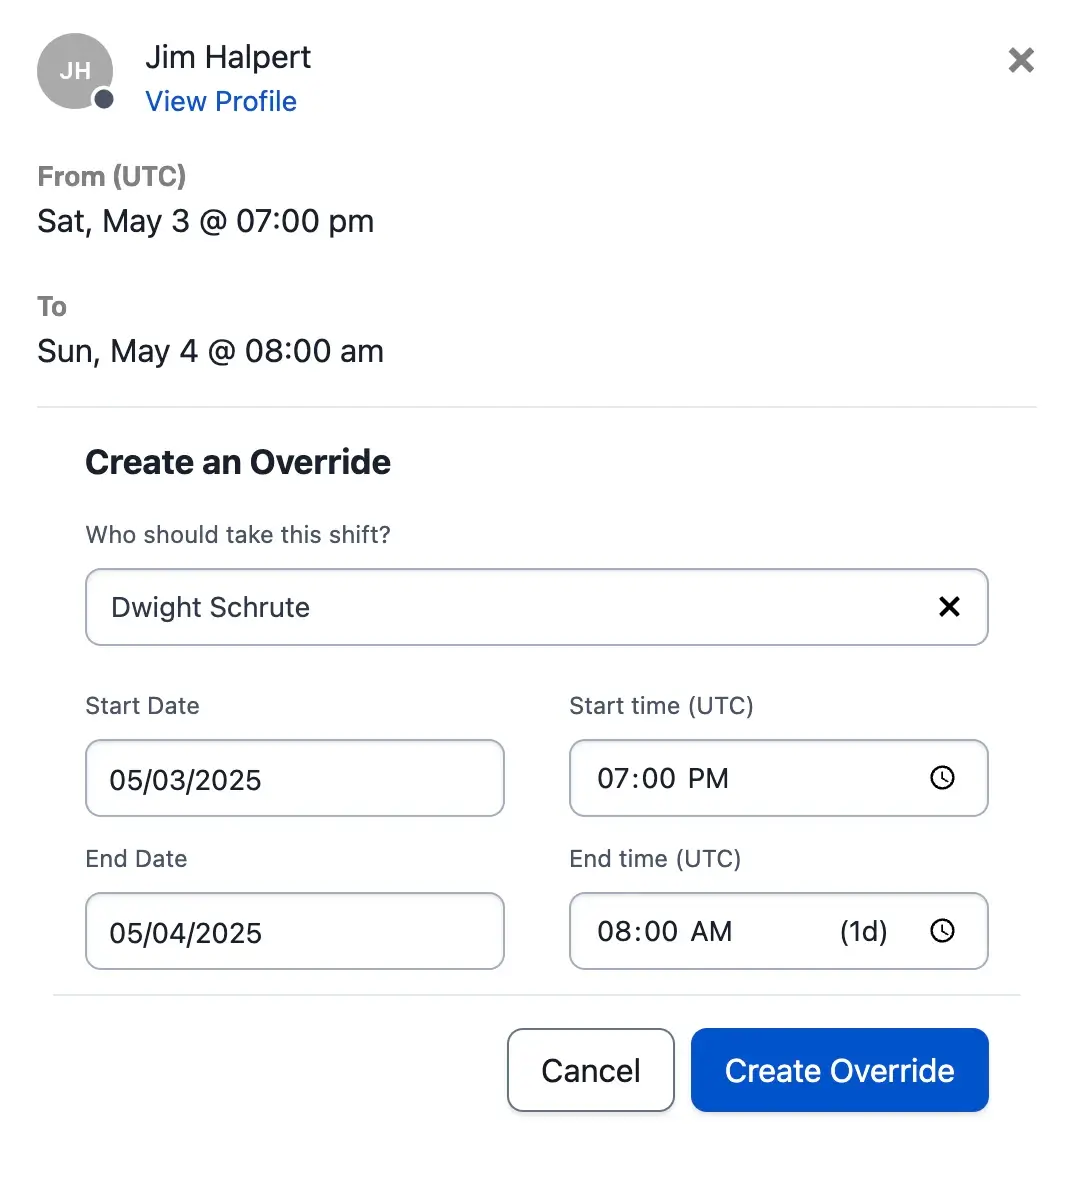 *Override an on-call shift* #### Override Any Span of Time on a Schedule 1. Navigate to **People** → **Schedules**. Click the **** icon to the right of the desired schedule and select **Schedule an override**. 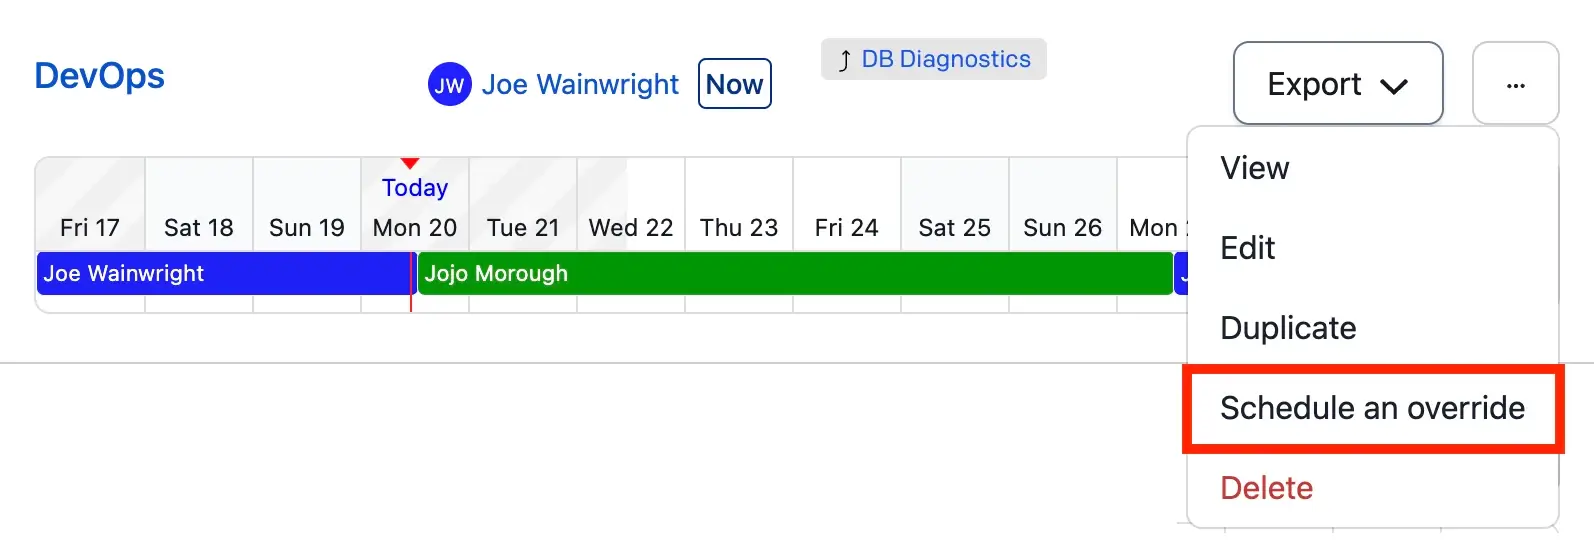 *Schedule an override from the Schedules list* 2. Alternatively, click into a schedule and select **Schedule an Override** on the right side.  *Schedule an override from a schedule* 3. In the **Schedule an Override** modal, select values for the fields: | Field | Action | | :------------ | :------------------------------------- | | **User** | Select the person taking the override. | | **Starts on** | Select the start date and time. | | **Ends on** | Select the end date and time. | 4. Click **Create Override**. ### Create Overrides in My On-Call Shifts Follow [our documentation on My On-Call Shifts](/incident-management/schedules/my-on-call-shifts#create-overrides-on-my-on-call-shifts) to create overrides from this page. ### Create Overrides Using the REST API An example Python script to schedule overrides for a person going on vacation is located here: [vacation\_overrides.py](https://github.com/PagerDuty/public-support-scripts/tree/master/overrides_bulk_operations). Our developer docs provide more information on [creating](/developer/api/reference/rest/schedules/create-schedule-override) and [deleting](/developer/api/reference/rest/schedules/delete-schedule-override) overrides using the REST API. ## Delete an Override You can delete an upcoming override if it is no longer needed. If you delete an override during the middle of the scheduled shift, the regular schedule resumes immediately. You cannot delete past overrides; you can only delete present or future overrides. 1. Navigate to **People** → **Schedules** and select your desired schedule, or click the **** icon and select **View**. 2. Navigate to the scheduled override time within the timeline or calendar view. 3. In the **Upcoming Overrides** list on the right side, click the **** icon. 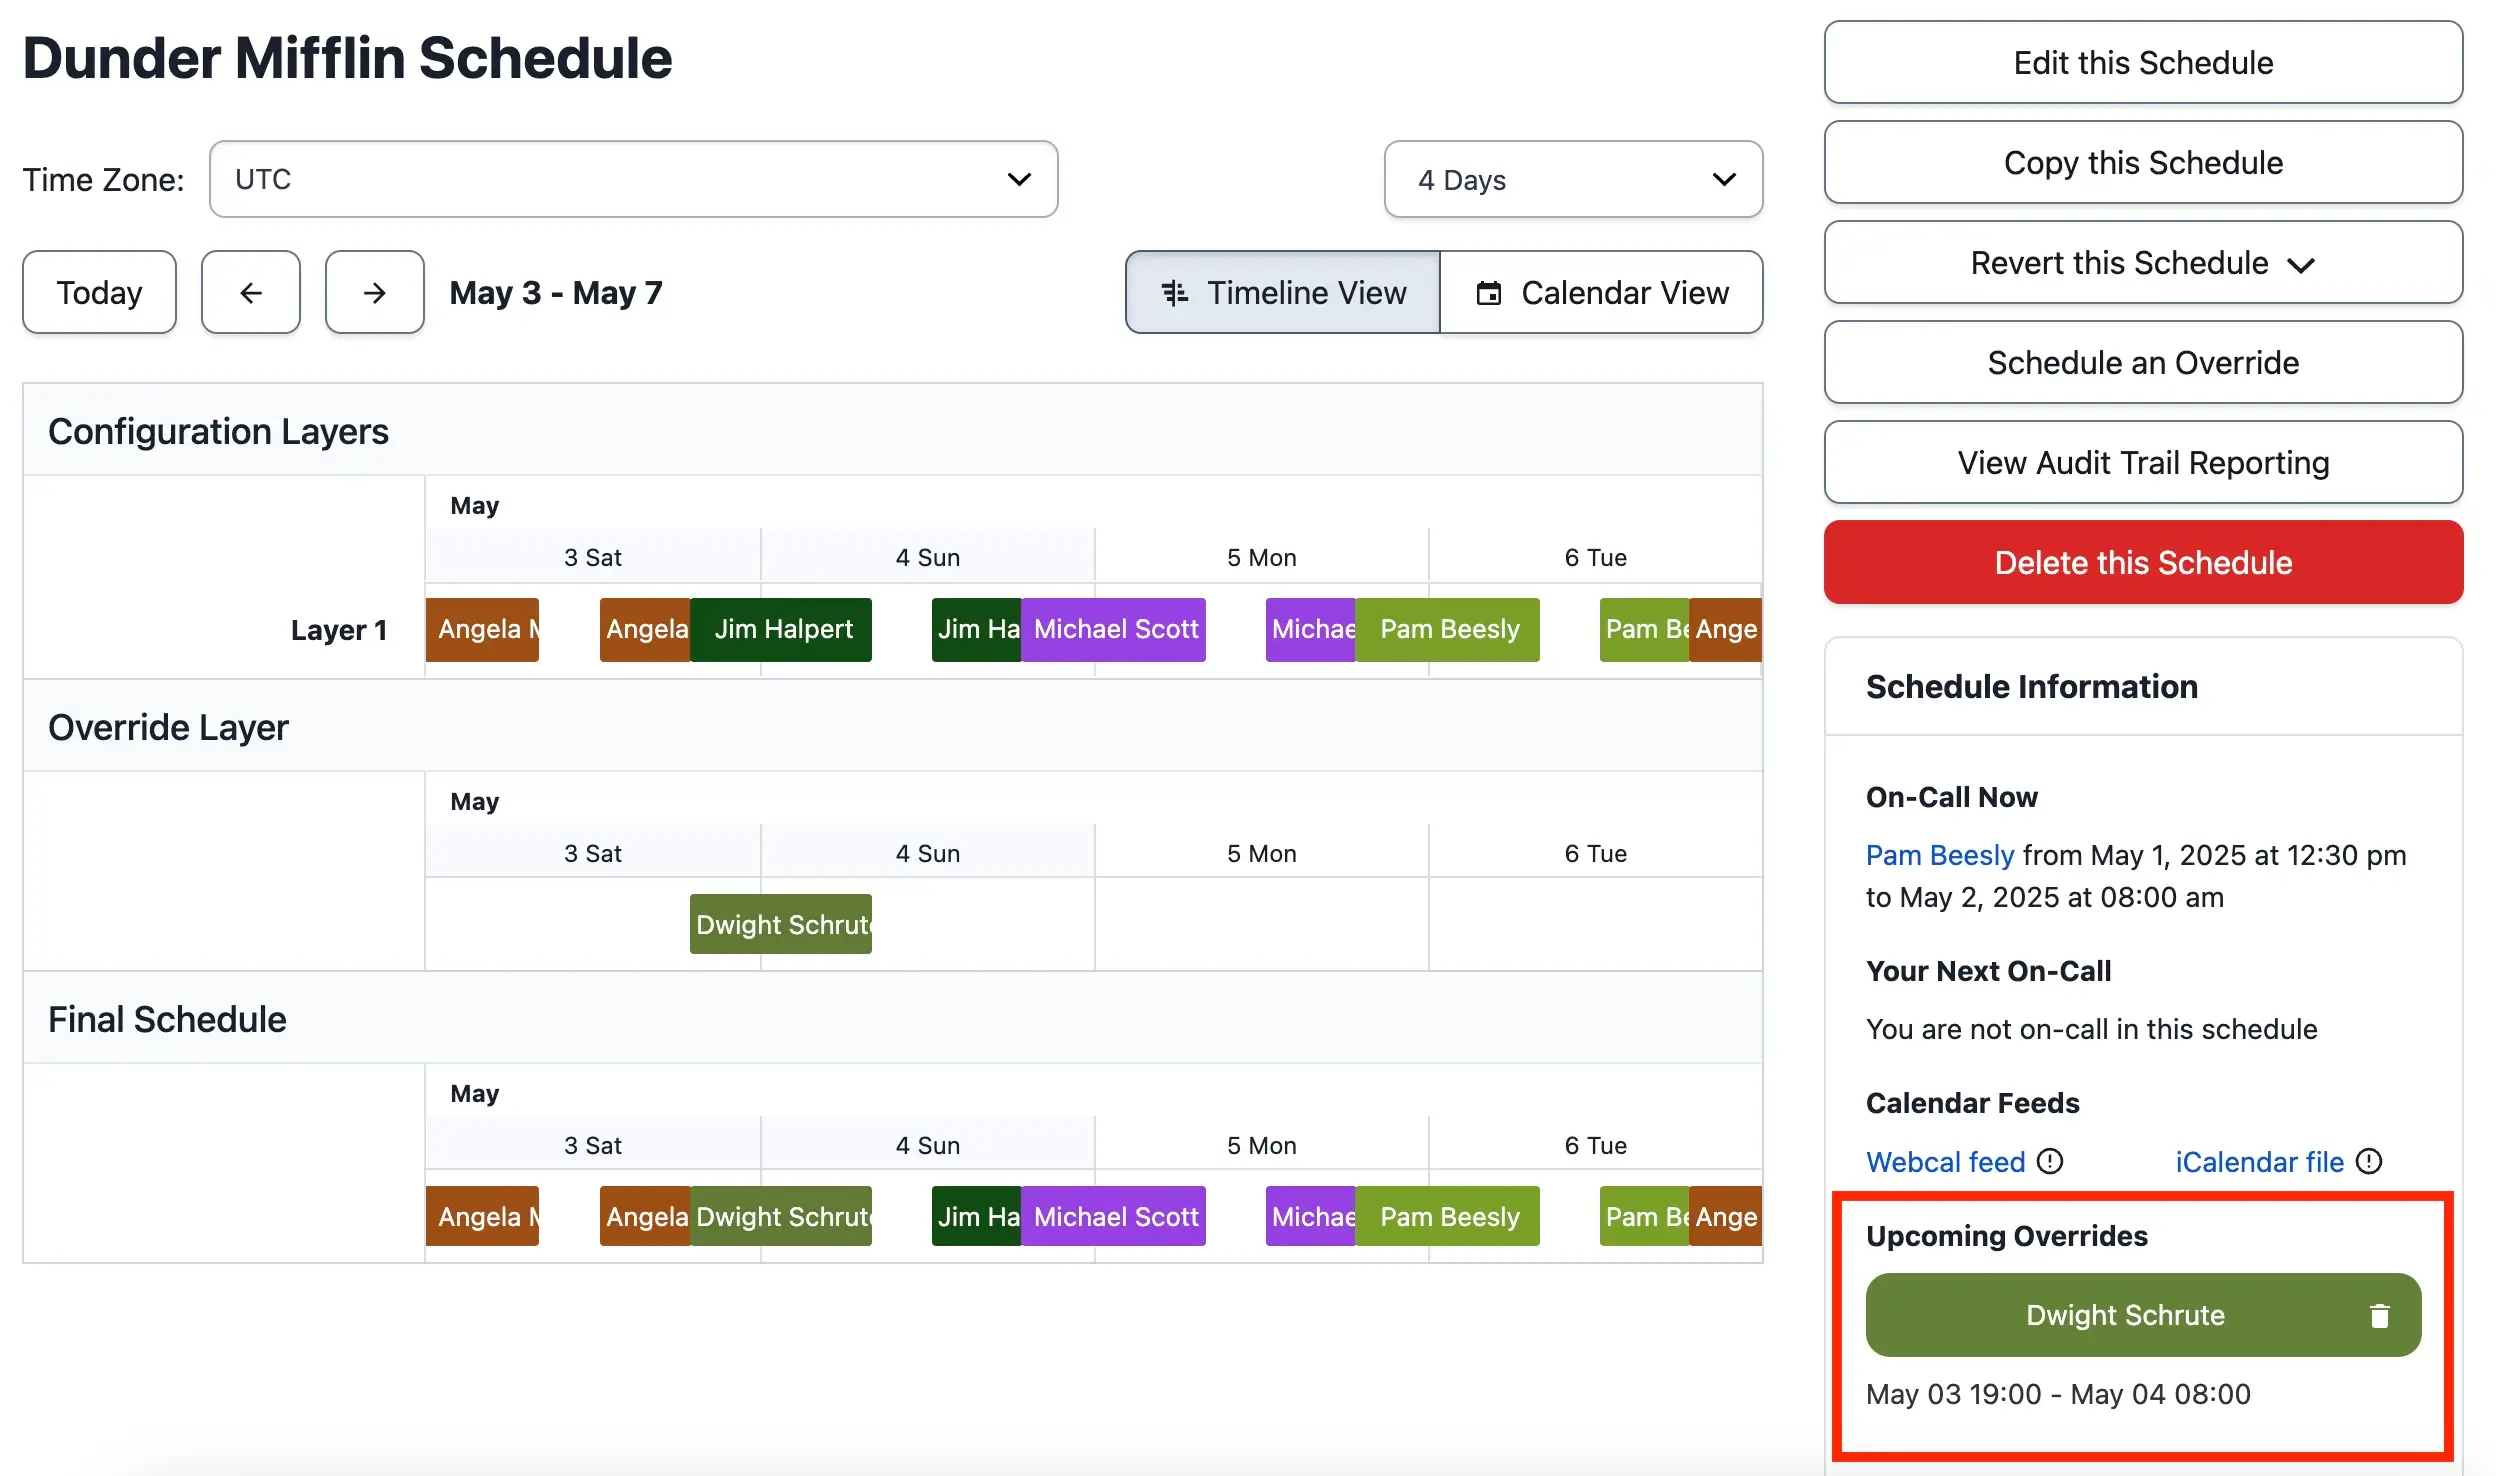 *Delete an override* ## Edit Schedule Time Zone Settings When you create a new schedule, it defaults to the [account-level time zone](/account-admin/time-zone-settings#change-the-account-level-time-zone). Follow the instructions in [Change the Schedule-Level Time Zone](/account-admin/time-zone-settings#change-the-schedule-level-time-zone) to use a different time zone for your schedule than the account. ## Pause or Deactivate an On-Call Schedule Sometimes you might want to stop using a schedule without deleting it. For example: - The schedule is a draft which you are not ready to implement. (Note, however, that you can set an effective date for future changes without deactivating your current schedule.) - The schedule is only used for particular occasions, such as on-call shadowing. To take an on-call schedule out of use, remove the schedule from any escalation policies it is assigned to, or [change the escalation policy your services use](/incident-management/services/services-and-integrations#edit-a-services-escalation-policy) to another that does not include the schedule. ### Option 1: Remove a Schedule from an Escalation Policy The right sidebar displays any escalation policies where the schedule is in use.  *Escalation policies that use this schedule* 1. Select the **escalation policy** you want to remove the schedule from. This action opens the escalation policy page. 2. Click **Edit** in the top right corner of the page. 3. Locate your schedule in the **Notify the following users or schedules** field and click the **** icon to remove it from the escalation rule.  *Remove schedule from an escalation policy* > **Tip:** If the schedule is the only target (person or schedule) in the escalation rule, click the **** icon for the entire rule, as each rule must contain at least one target. 4. Click **Save** at the bottom of the escalation policy. ### Option 2: Change the Escalation Policy for a Service Visit [Escalation Policies and Schedules](/incident-management/schedules/escalation-policies-and-schedules#deactivate-schedules-via-escalation-policies) for instructions to change a service’s escalation policy. This action ensures that incidents triggered for the service do not alert the schedule you want to take out of use. ## Restore a Schedule to a Previous Version If you or another person alters a schedule in an undesired way, you can quickly revert a schedule back to a previously saved version. This feature also allows you to see when a change occurred. 1. Click **People** → **Schedules**. 2. Select the **name** of the schedule you want to revert. 3. On the right side of the page, select **Revert this Schedule** to view recent versions. 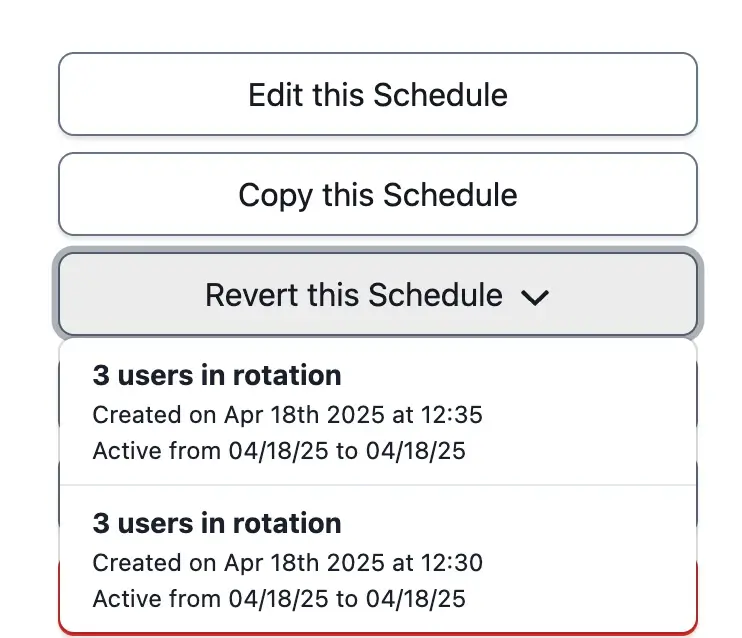 *Restore a schedule to a previous version* 4. Select an option from the dropdown menu to open the schedule's edit page with that version populated. 5. Confirm the schedule details, optionally make additional changes, and click **Revert Schedule** in the upper right corner. > **Schedule Limitation with Overrides:** Only changes made to the schedule layers can be reverted. Overrides are not affected if you revert a schedule. For more information about reviewing who made a change to a schedule, see [View Schedule Audit Trail Reporting](/incident-management/analytics/audit-trail#schedule-audit-trail-reporting). ## Schedules and Teams Behavior For accounts with [Teams](/account-admin/teams), if you [assign a schedule to a Team](/incident-management/schedules/schedule-basics#create-a-schedule), all people on the schedule are added to the Team. Similarly, if a schedule is already assigned to a Team, adding people to the schedule adds them to the Team. You can view a schedule's Teams in the **Schedule Information** sidebar on the right side. ### Add a Schedule to a Team > **Required User Permissions:** While editing an on-call schedule, only Global Admins and the Account Owner can add the schedule to a Team. 1. Navigate to **People** → **Schedules** and click the **** icon to the right of your desired schedule and select **Edit**. 2. In the **Teams** section, select the Team(s) you want to associate the schedule with. 3. Click **Save Schedule**. ### Remove a Schedule from a Team Before you can remove a schedule from a Team, keep the following items in mind: - If you manually added a schedule to a Team, a person with a base role of Admin or higher can remove the schedule from the Team. - If you manually added an escalation policy with a schedule to a Team, remove the escalation policy from the Team before removing the schedule. 1. Navigate to **People** → **Schedules** and click the **** icon to the right of your desired schedule and select **Edit**. 2. In the **Teams** section, click the **** icon to the right of the Team(s) you want to remove the schedule from. 3. Click **Save Schedule** in the bottom right corner. --- URL: https://docs.pagerduty.com/incident-management/schedules/edit-shift-based-schedules # Edit Schedules Add users, create overrides, or modify handoff times. As individuals join and leave your on-call rotations, you must edit your schedules so that the correct people are on call and notified at the correct times. > ****Create a Schedule**:** If you create a schedule for the first time, visit the [Schedule Basics](/incident-management/schedules/shift-based-schedules) article. > ****User Permissions**:** You can add all individuals, except Limited and Full Stakeholders, to schedules. > > People with the following roles can add or remove [teams](/account-admin/teams) while editing: > > - Global Admin > - Account Owner > > People with the following roles can make other edits to on-call schedules: > > - Users > - Admins/Global Admins > - Manager base roles and team roles > - People with a Manager Team role can manage only their team’s schedules. > - Account Owner ## Add or Remove Members from an Existing Schedule 1. Navigate to **People** → **Schedules** and select the schedule to update. 2. On the rotation to modify, click **** and select **Edit**. 3. In the **Edit Rotation** modal, configure the following: | Action/Field | Description | | :---------------- | :-------------------------------------------------------------------------------------------------------------- | | **Members Tab** | Click this tab to manage rotation members. | | **Add members** | Search for and select the members to add. Repeat this step until you add all required members. | | **Sequence** | Drag and drop names to adjust the sequence if needed. Members move through the rotation in top-to-bottom order. | | **Remove Member** | Click the **** icon next to a member to remove them from the rotation. | 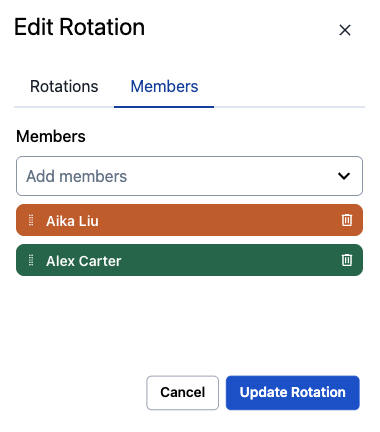 *Edit Rotation* 4. Click **Update Rotation**. 5. Click **Save Schedule**. ## Deciding Between an Override and a Custom Shift To determine the best option, ask yourself: > "Do you want to **replace** or **add** a responder?" If **Replace**: Use an [**Override**](#create-an-override-in-the-web-app). If **Add**: Use a [**Custom Shift**](#create-a-custom-shift). ### Use a Custom Shift When - **Filling Empty Gaps**: You need coverage during a time when no rotations are active, such as a one-off emergency block during a holiday or extending coverage past a rotation's end date. - **Adding Extra Support**: You want an additional person on call without removing the person already scheduled. A common example is adding a second responder to assist during a high-risk deployment. - **Handling Irregular Windows**: You need to cover a specific maintenance window that does not align with regular rotation boundaries or has nothing to do with the standard rotation. - **Expressing "Additive" Intent**: The goal is to add a person to the on-call set rather than replacing whoever is currently scheduled. ### Use an Override When - **Swapping Responders**: You need to replace a specific member of a rotation who is unavailable (for example, Alice is sick, so Bob covers her specific shift). - **Performing a Scoped Replacement**: You want to target a specific rotation or custom shift and change who is assigned to it for a set window of time. > ****Sanity Check**:** - If removing the override leaves the schedule with the **correct** on-call person, **keep it as an override**. > - If removing the override **leaves a gap**, you require **a custom shift**. ## Create an Override in the Web App Overrides allow you to make one-time manual adjustments to on-call schedules. Use them when someone is unavailable due to illness, vacation, or when team members need to swap on-call shifts. 1. Navigate to **People** → **Schedules** and select the schedule to create the override. 2. Select a member within a rotation to override. You can create an override on any span of time on a schedule. > ****Override Option Not Visible**:** If you click a member and do not see the **Override** option, the schedule is likely not finalized. To fix this, click **Save Schedule** and click the member again. 3. Click **+ Override**. 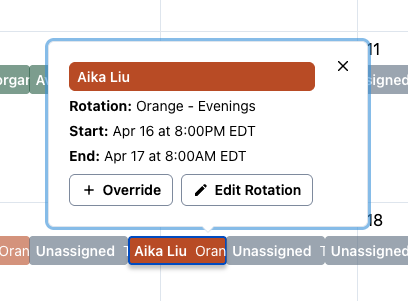 *Create an Override* 4. In the **Create an Override** modal, select a member to cover the shift and click **Create Override**. 5. Click **Save Schedule**. You can also create overrides in [My On-Call Shifts](/incident-management/schedules/my-on-call-shifts#create-overrides-on-my-on-call-shifts) or [via the API](/developer/api/reference/rest/schedules/create-schedule-override). ## Delete an Override in the Web App 1. Navigate to **People** → **Schedules** and select the schedule with the override to delete. 2. Click the override within a rotation. Overrides are clearly marked _(Override)_. 3. Click **Remove**. 4. Click **Save Schedule**. 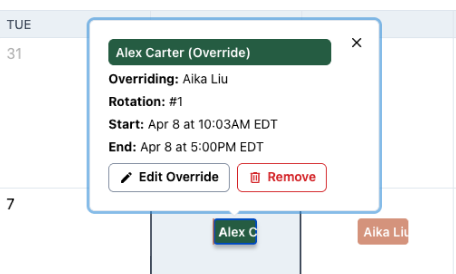 *Remove an Override* ## Create an Open Schedule with Responder Sign-Ups Open schedules allow responders to select their shifts. 1. Navigate to **People** → **Schedules** and click **+ Create Shift-Based Schedule**. 2. Configure your schedule details, then click **+ Create Rotation**. Create a rotation with configured days and times, but do not assign members to the rotation. 3. Create as many rotations as needed without assigning members. 4. Click **Save Schedule**. Responders can now add themselves to the schedule and choose their rotation. ## Create a Custom Shift Creating a one-off shift on top of an existing rotation allows you to handle temporary gaps or surge requirements without affecting the logic of your long-term recurring rotations. 1. Navigate to **People** → **Schedules** and select the schedule to create a shift. 2. Under the **Create Rotation** dropdown, click **Create Shift**. 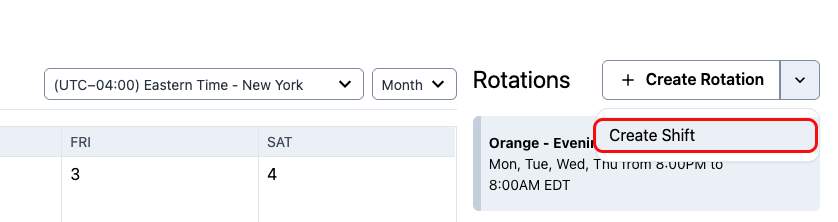 *Create Shift Button* 3. In the **Create Shift** modal, enter the shift details. You can add a team member or leave the shift unassigned to keep it open for a team member to claim. Click **Create Shift**. ## Duplicate a Schedule Copying an existing schedule to make a new one with the same members and settings is an easy way to create new schedules at scale. There are two places to duplicate a schedule in the web app: **Schedules List Page** 1. Navigate to **People** → **Schedules**. 2. Click **** next to the desired schedule and select **Duplicate**. This action creates a new schedule that copies all members and settings from the original schedule—except for the schedule name and team association. 3. On the next screen, configure the following fields and click **Save Schedule**: | Field | Value | | :---------------- | :--------------------------------- | | **Schedule Name** | Enter a new name for the schedule. | | **Team** | Select a team from the dropdown. | **Schedule Details Page** 1. Navigate to **People** → **Schedules** and click the name of the schedule to duplicate. 2. On the right side, click **Copy this Schedule**. This action creates a new schedule that copies all members and settings from the original schedule—except for the schedule name and team association. 3. On the next screen, configure the following fields and click **Save Schedule**: | Field | Value | | :---------------- | :--------------------------------- | | **Schedule Name** | Enter a new name for the schedule. | | **Team** | Select a team from the dropdown. | ## Duplicate a Rotation Copying a rotation is an easy way to ensure your settings transfer to another rotation when creating a schedule. 1. Navigate to **People** → **Schedules** and click the name of the desired schedule. 2. On the rotation to duplicate, click **** and select **Duplicate**. 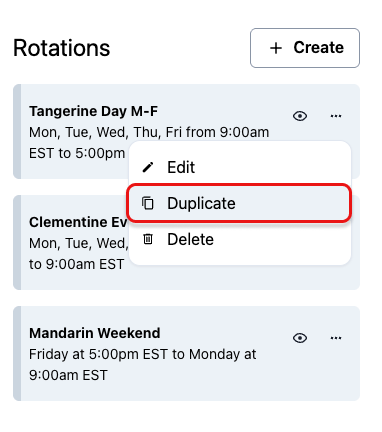 *Duplicate Rotation* ## Hide or Unhide a Rotation To remove a rotation without deleting it from a schedule, you can hide the rotation. 1. Navigate to **People** → **Schedules** and select the desired schedule. 2. On the rotation to hide, click the **** icon. 3. Click the greyed-out icon again to unhide the rotation.  *Hide Rotation* ## Pause or Deactivate an On-Call Schedule ### Change the Escalation Policy for the Service Visit the [Escalation Policies and Schedules](/incident-management/schedules/escalation-policies-and-schedules#deactivate-schedules-via-escalation-policies) article for instructions on how to change a service’s escalation policy. This ensures that incidents triggered for the service do not alert the schedule to deactivate. ### Remove a Schedule from a Team Before you can remove a schedule from a team, note the following: - If you manually added a schedule to a team via the instructions in [teams](/account-admin/teams#create-a-team), a person with a base role of Admin or higher can remove the schedule from the team. - If you manually added an escalation policy with a schedule to a team via the instructions in [escalation-policies](/incident-management/schedules/escalation-policies#add-an-escalation-policy-to-a-team), you must first remove the escalation policy from the team via the instructions in [escalation-policies](/incident-management/schedules/escalation-policies#remove-an-escalation-policy-from-a-team) before removing the schedule. To remove a schedule from a team: 1. Navigate to **People** → **Schedules** and select the desired schedule. 2. Click the **** icon beside the schedule name. 3. Under **Teams**, click the **X** to remove a team. 4. Click **Save Schedule**. ## End a Rotation Schedule a rotation to end immediately or on a specific date for temporary coverage, such as holidays or short-term projects. 1. Navigate to **People** → **Schedules** and select the desired schedule. 2. On the rotation card, select the **** menu and click **End rotation**. 3. In the **End Rotation** modal, select an **End method** (either **End Immediately** or **A specific end time**) and click **End Rotation**. 4. Click **Save Schedule** to apply the changes. --- URL: https://docs.pagerduty.com/incident-management/schedules/escalation-policies # Escalation Policy Basics Escalation policies notify on-call users about incidents Escalation policies automate incident assignment and connect services to individual users and/or schedules. They are designed to notify a single target at a time until one individual acknowledges the incident. By adding rules to your escalation policy, you can ensure that each incident has a thorough response plan in the event that initial responders cannot acknowledge. Services in PagerDuty can only be associated with one escalation policy. An escalation policy, however, can be associated with as many services as you like. > **Pricing Plans:** Escalation policies are available on all pricing plans, although the Free plan is limited to a single escalation policy. Other plans do not have a set limit on the number of escalation policies. > **Required User Permissions:** The following user roles can create, edit, and delete escalation policies: > > - Account Owner, Admin, and Global Admin users > - Users with a Manager base role > - Users on a Team who have been granted Manager access to an escalation policy ## How Escalation Works An escalation policy is an ordered set of rules (also called levels). When an incident triggers, PagerDuty works down these rules until someone acknowledges. ### The Incident Lifecycle Through a Policy When an incident triggers on a service, it follows the escalation policy assigned to that service: 1. PagerDuty immediately notifies the target(s) at the first escalation rule. There is no delay before this first notification. 2. The responder has until the [escalation timeout](#escalation-timeout) elapses to take action on the incident — that is, to acknowledge, resolve, or reassign it. 3. If no one takes action before the timeout elapses, the incident escalates to the next rule, and PagerDuty notifies the target(s) there. 4. This continues down each rule until a responder acknowledges or the policy reaches its final rule. 5. Once a responder acknowledges, the policy stops escalating and PagerDuty stops sending notifications. > **What "Escalates After ___ Min" Measures:** The **escalates after \__\_ min** value on a rule is the [escalation timeout](#escalation-timeout): the time a responder has to act before the incident moves to the _next_ rule. It does not delay the _first_ notification. Whoever is at the first rule is always notified the moment an incident triggers. There is no setting to delay this initial notification. ### What Acknowledgment Does Acknowledging an incident tells PagerDuty that a responder is working on it, which stops the policy from escalating and pauses further notifications. Acknowledgment does not resolve the incident — only resolving it (or the underlying alert clearing) ends the incident's lifecycle. If an acknowledged incident re-triggers, it resumes following the escalation policy. ## Create an Escalation Policy > **Default Mobilization Escalation Policy:** Every PagerDuty account includes an escalation policy called **Default Mobilization EP**, with the Account Owner assigned to it. This is an empty, internal, account-level escalation policy that ships with your account. See [Quick Declare](/incident-management/incidents/quick-declare) for guidance on when to use this escalation policy. 1. Navigate to **People** → **Escalation Policies** → **New Escalation Policy**. 2. Enter a **Name** for your escalation policy. Optionally, add a **Description**. 3. In the **Notify the following users or schedules** field, search and select the [targets](#escalation-targets) you want to notify when an incident triggers. - If your account has [Round Robin Scheduling](/incident-management/schedules/round-robin-scheduling), optionally select the checkbox to **Assign via Round Robin**. > **Tip:** - To notify users on a schedule, you must [add your schedule to an escalation policy and then add the escalation policy to a service](/incident-management/schedules/escalation-policies-and-schedules#connect-a-schedule-to-a-service-via-escalation-policy). > - If you select more than one user or schedule, each will be [notified at the same time](#notify-multiple-users-at-once) per escalation rule. 4. Optionally, add a second [rule](#escalation-rules) to serve as a secondary line of responders who will be notified if no one in the first rule responds. Enter the number of minutes that should pass before the incident escalates in the **escalates after \__\_ min.** field. This time period is called the escalation timeout. Incidents will not escalate if they are acknowledged or resolved before the timeout is reached. 5. Click **Add a new Escalation Rule** to create the second rule. 6. Search and select the target(s) you want to notify when an incident triggers. 7. Configure additional escalation rules as required. 8. Click **Save**. 9. Add your escalation policy to a service so that users can be notified of incidents. Follow the instructions on [creating a service](/incident-management/services/services-and-integrations#create-a-service) if you have not created one yet, or [edit an existing service](/incident-management/services/services-and-integrations#edit-service-settings) to add your escalation policy. > **Repeat Your Policy:** To configure your policy to repeat, check the box next to **If no one acknowledges, repeat this policy \_\_**. Then select the number of times to repeat. An escalation policy can be repeated up to nine times. ### Escalation Timeout The escalation timeout is the amount of time in which a user must acknowledge or resolve an incident before it escalates to the next rule. The default escalation timeout is 30 minutes but can be adjusted. 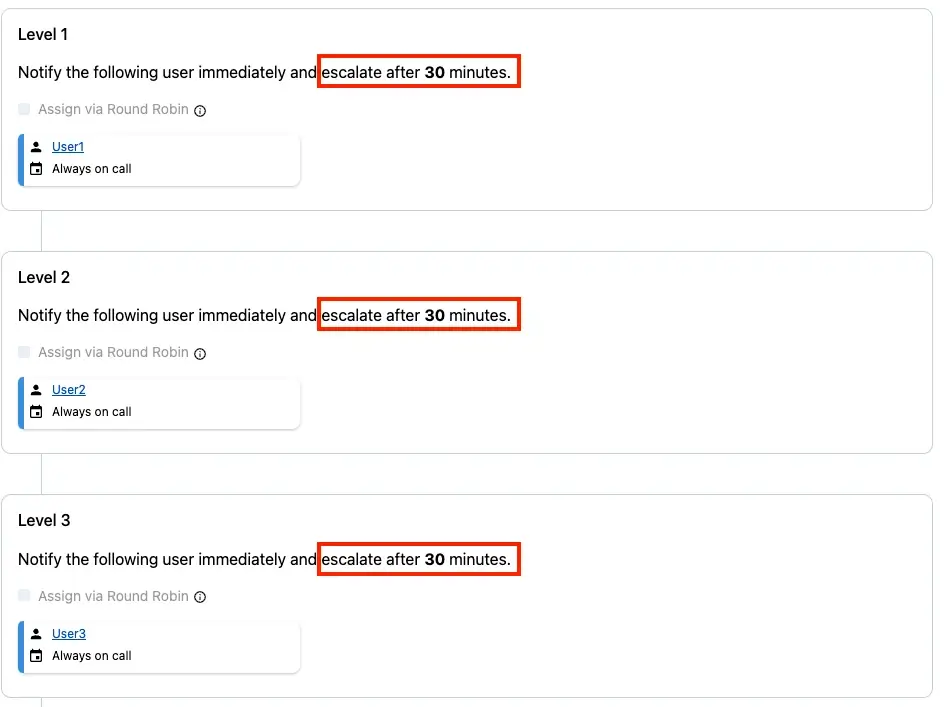 *Escalation Timeout* ## Edit an Escalation Policy 1. Navigate to **People** → **Escalation Policies**. 2. Click to the right of your desired escalation policy, or click the escalation policy's **name**, then click **Edit Escalation Policy**. 3. Edit the following fields as needed: | Field | Value | | :----------------------------------------------- | :--------------------------------------------------------------------------------------------------------------------------------------------------------------------------------------------- | | **Escalation policy name** | Enter a new name for the escalation policy. | | **Description** | Enter a new description for the escalation policy. | | **Team** | Available on Business, Digital Operations (legacy), and Enterprise for Incident Management plans. Click the dropdown and select a new Team. | | **Send On-Call Handoff Notifications** | Select when the escalation policy should send [on-call handoff notifications](/account-admin/user-profile/notification-rules#on-call-handoff-notifications): **always** or **when in use by a service**. | | **Tags** | To add a tag, search and select it. To delete a tag, click . To create a new tag, type your preferred tag name and select `[TAG-NAME]` **(Create new tag)** from the dropdown. | | **Escalation Rules — Add users or schedules** | In the **Notify the following users or schedules** field, search and select the [targets](#escalation-targets) you want to notify when an incident triggers. | | **Escalation Rules — Delete users or schedules** | In the **Notify the following users or schedules** field, click to the right of the user or schedule you want to delete. | | **Assign via Round Robin** | Check or uncheck this checkbox on each escalation rule. | | **If no one acknowledges, repeat this policy** | Check the checkbox and select the number of times to repeat. Uncheck to disable repeating. | | **Add a new escalation rule** | Click **Add a new escalation rule**. | | **Reorder escalation rules** | Click and drag on the bottom right of the escalation rule. | | **Delete an escalation rule** | Click to the right of the escalation rule. | | **Edit Escalation Timeout Period** | Enter a new time in minutes. The time period must be at least three minutes if there are multiple targets on an escalation level. | 4. Click **Save**. ## Delete an Escalation Policy > **Warning:** Deleting an escalation policy is permanent and cannot be restored. If you delete an escalation policy, the users and schedules on that policy will no longer be associated with the service they were supporting. If the service still needs on-call responders, edit the escalation policy instead to suit your needs. Deleting an escalation policy is most appropriate when the service it was supporting is no longer in use. 1. Navigate to **People** → **Escalation Policies**. 2. Click to the right of your desired escalation policy, or select an escalation policy, then click **Edit Escalation Policy**. 3. At the bottom of the page, select **Delete**. 4. Confirm your selection in the modal. This action cannot be undone. ### Add an Escalation Rule 1. Navigate to **People** → **Escalation Policies**. 2. Select an escalation policy, then click **Edit Escalation Policy**. 3. At the bottom of the first escalation rule, enter a value for **escalates after \_ min**. This represents the number of minutes that will pass before PagerDuty notifies the next escalation rule. 4. Click **Add a new Escalation Rule**. 5. Select a user or schedule to notify if responders at the previous rule do not acknowledge an incident. 6. Click **Save**. ### Delete an Escalation Rule 1. Navigate to **People** → **Escalation Policies**. 2. Select an escalation policy, then click **Edit Escalation Policy**. 3. On the escalation rule you want to delete, click ✗. 4. Click **Save**. > **Heads Up:** There is no undo or confirmation alert for this action. You may click **Cancel** at the bottom of the page if you have made an incorrect selection and have not yet saved your changes. ## Escalation Rules Escalation policies are made up of rules that allow you to escalate incidents if responders in the first rule do not respond within the [escalation timeout](#escalation-timeout). At least two rules are recommended, with the option to add more. Escalation rules can also be used to achieve more [complex use cases involving schedules](/incident-management/schedules/escalation-policies-and-schedules#escalation-policy-and-schedule-use-cases). ### Notify Multiple Users at Once Escalation policies are designed to notify a single target at a time until one individual acknowledges the incident. There may be times, however, when you want to notify more than one user at a time. An escalation policy can be configured to notify more than one user when an incident is triggered or escalated (multi-user notifications). There are three methods of configuring multi-user notifications based on your intended use case: - Notifying multiple users at once regardless of their on-call status. This method is covered in the section below. - Notifying multiple users and/or groups at once based on a specific span of time — for instance, if you want more than one person to be notified during the weekend or after business hours. This method is covered in [Escalation Policies and Schedules](/incident-management/schedules/escalation-policies-and-schedules#notify-multiple-users-during-specific-times). - Notifying a secondary on-call user when a primary on-call user does not respond based on their schedule and escalation rule. This method is covered in [Escalation Policies and Schedules](/incident-management/schedules/escalation-policies-and-schedules#notify-a-secondary-responder-when-the-primary-does-not-respond). > **Incident Workflows:** To create a predetermined set of incident actions that assist with assembling a response team of multiple responders and/or escalation policies independently, you can use an [Incident Workflow](/ai-automation/automation/incident-workflows) to mobilize a [coordinated response](/incident-management/incidents/add-responders). #### Notifying Multiple Users at Once Regardless of Their On-Call Status To notify two or more users at once regardless of their on-call status, set up an escalation policy with multiple users on the same escalation rule: 1. Navigate to **People** → **Escalation Policies**. 2. Click **New Escalation Policy** to create a new escalation policy, or select → **Edit** to edit an existing one. 3. Click in the field below **Notify the following users or schedules** and select all of the responders who should be notified when an incident is triggered or escalated. 4. Click **Save**. > **Can I Use a Schedule on Its Own to Achieve Multi-User Notifications?:** **No**. Visit [Escalation Policies and Schedules](/incident-management/schedules/escalation-policies-and-schedules) for more information on essential concepts and how to properly configure multi-user notifications. ## Escalation Targets Each rule of an escalation policy requires at least one target so that PagerDuty knows who to notify when an incident triggers. A target can be either a user or a schedule: - **User Targets**: Select users as targets if you always want a specific person to be notified when an incident is triggered, assigned, or escalated to their rule on an escalation policy. - **Schedule Targets**: Select on-call schedules as targets if you want to notify the user who is currently on-call when an incident is triggered, assigned, or escalated to the schedule's rule on an escalation policy. For more information on common use cases, visit [Escalation Policies and Schedules](/incident-management/schedules/escalation-policies-and-schedules). > **Inactive Users:** Deleted users are marked as inactive on an escalation policy. These users will be skipped when the escalation policy runs. ## Notification Behavior When an incident triggers, PagerDuty attempts to notify responders at the first rule of the escalation policy. If the responder does not acknowledge within the [escalation timeout](#escalation-timeout) period, the incident escalates to the next escalation rule until a user acknowledges. Once a user acknowledges the incident, the escalation policy stops escalating and PagerDuty stops sending notifications. If nobody is on-call in the first rule (due to a [coverage gap](/incident-management/schedules/schedule-basics#schedule-restrictions) in a schedule, for example), PagerDuty assigns the incident to the next escalation rule with an on-call responder. ## Limits on Escalation Policies ### Escalation Rules You can add up to 20 escalation rules to an escalation policy. ### Repeat an Escalation Policy You have the option to repeat an escalation policy nine times. Once an escalation policy reaches the number of loops configured, the incident will stay assigned to the last user and will not continue to notify once it has cycled through all of the responder's contact methods. ### Multi-User Notifications Notifying too many users at once runs the risk of creating confusion about who owns an incident. [Multi-user notifications](#notify-multiple-users-at-once) on each escalation level are limited to 50 users or schedules on Business, Digital Operations (legacy), and Enterprise for Incident Management plans, and five on Professional and Free plans. ### Escalation Timeouts With a single target on an escalation rule, the minimum [escalation timeout](#escalation-timeout) is one minute. If there is more than one target in an escalation rule, the minimum escalation timeout is three minutes. These restrictions are displayed in the web app. ### Escalation Policy Changes An incident follows the escalation policy's structure as it was when the incident triggered. Changes made to an escalation policy after an incident triggers will not affect any currently open incidents. ### When No One Is On Call If nobody is on call at the first rule — for example, because of a [coverage gap](/incident-management/schedules/schedule-basics#schedule-restrictions) in a schedule — PagerDuty skips that rule and assigns the incident to the next rule that has an on-call responder. > **Deleting Users and Schedules:** When an incident triggers, PagerDuty records a snapshot of a service's escalation policy and uses this version throughout the entirety of the incident's lifecycle. This means you will not be able to delete any users or schedules that were on the escalation policy when the incident triggered. If you need to delete such a user or schedule, you have two options: > > 1. Resolve any associated incidents. > 2. After making the desired changes to the escalation policy, [reassign](/incident-management/incidents/reassign-incidents#reassign-an-incident) the incident to the same escalation policy. This records a new escalation policy snapshot and allows you to delete any users or schedules captured in the previous snapshot. ### Live Call Routing If you have Live Call Routing enabled to Connect Directly and there is more than one responder on an escalation rule, PagerDuty will randomly cycle through all responders on that rule. If an incident triggers via Live Call Routing (if either no one answers or you have selected **Leave a Message**), all users on an escalation rule can expect to receive notifications via their configured notification methods. ## Add an Escalation Policy to a Team If your account has the [Teams](/account-admin/teams) feature, you can use escalation policies to connect other core PagerDuty objects to your Teams. When you add an escalation policy to a Team, PagerDuty assigns all of the escalation policy's associated users, schedules, and services to that Team. For more information, visit [Teams](/account-admin/teams). 1. Navigate to **People** → **Escalation Policies** → click to the right of your desired escalation policy and select **Edit**. 2. In the **Team** dropdown, select your desired Team. > **One Team Per Policy:** An escalation policy can only be associated with one Team at a time. 3. Click **Save**. ### Remove an Escalation Policy from a Team 1. Navigate to **People** → **Escalation Policies** → click to the right of your desired escalation policy and select **Edit**. 2. Click to the right of the Team name.  *Remove an Escalation Policy from a Team* 3. Click **Save**. ## On-Call Handoff Notification Settings On-call handoff notifications (OCHONs) can notify users up to 48 hours before they go on-call, and are configured on a [user's profile](/account-admin/user-profile/notification-rules#on-call-handoff-notifications). The following conditions must be met for users to receive OCHONs: - The target user must have [on-call handoff notifications configured](/account-admin/user-profile/notification-rules#on-call-handoff-notifications). - The user must be a [target](#escalation-targets) on the escalation policy. - The escalation policy must either be in use by a service (default) — and that service must not be disabled — or must be configured to send handoff notifications **always**. If an escalation policy is attached to a service, PagerDuty automatically sends OCHONs. If it is not attached to a service, configure the escalation policy to send OCHONs: 1. Navigate to **People** → **Escalation Policies** → click the **name** of your desired escalation policy → click **Edit Escalation Policy**. 2. In the **Send On-Call Handoff Notifications** dropdown, select **Always**. 3. Click **Save**. When viewing escalation policies in the web app at **People** → **Escalation Policies**, you can see whether OCHONs are enabled on the right-hand side: **when in use by a service** or **always**. --- URL: https://docs.pagerduty.com/incident-management/schedules/escalation-policies-and-schedules # Escalation Policies and Schedules Connect a schedule to a service via escalation policy [On-call schedules](/incident-management/schedules/schedule-basics) represent your teams' on-call responsibilities in PagerDuty, while escalation policies allow you to connect services to on-call schedules, and they ensure that the right people are notified at the right time. Schedule members will receive incident notifications once the schedule is added to an escalation policy, and a service uses that escalation policy. > **Availability:** Free accounts are limited to one schedule and one escalation policy. Other pricing plans do not have a set limit on the number of schedules and escalation policies. ## Connect a Schedule to a Service via Escalation Policy To connect an on-call schedule to a service: 1. In the web app, go to **People** → **Escalation Policies** → click next to your desired escalation policy _or_ [create a new escalation policy](/incident-management/schedules/escalation-policies#create-an-escalation-policy). 2. Add your schedule to the escalation policy at the appropriate level and click **Save**. - For more information about configuring escalation policies, see [Escalation Policy Basics](/incident-management/schedules/escalation-policies#create-an-escalation-policy). 3. Navigate to **Services** → **Service Directory** → select your desired service _or_ [create a new service](/incident-management/services/services-and-integrations#create-a-service). 4. Assign your escalation policy to the service: - If you are editing an existing service, read [Edit a Service's Escalation Policy](/incident-management/services/services-and-integrations#edit-a-services-escalation-policy). - If you are creating a new service, read [Create a Service](/incident-management/services/services-and-integrations#create-a-service). ### Deactivate Schedules via Escalation Policies To pause or deactivate notifications from a service connected to a particular schedule, you can change the escalation policy that the service uses. To change the escalation policy a service uses: 1. Navigate to **Services** → **Service Directory**. 2. Find the service that notifies the schedule you would like to pause or deactivate → select the **Settings** tab → click **Edit** in the **Assign and Notify** section. 3. In the **Assign to escalation policy** section, select an escalation policy that does not use the schedule you wish to pause or deactivate. 4. Click **Save Changes**.  *Assign a different escalation policy to a service* > **Repeat for Other Services:** If any other services use the same escalation policy, you need to repeat this process for those services. ## Escalation Policy and Schedule Use Cases Escalation policies and schedules can be configured in many ways to fit your team's needs. The following are examples of common methods of configuring these features together: - [Notify a secondary responder when the primary does not respond](#notify-a-secondary-responder-when-the-primary-does-not-respond) - [On-Call Shadowing](#on-call-shadowing) - [Notify multiple users during specific times](#notify-multiple-users-during-specific-times) ### Notify a Secondary Responder When the Primary Does Not Respond It is a common need to set up a backup, secondary responder in case the primary responder does not acknowledge an incident. To create primary and secondary on-call users: - [Create schedules for the primary and secondary on-call levels](#create-schedules-for-the-primary-and-secondary-on-call-levels). - [Add each schedule to the appropriate escalation level](#add-each-schedule-to-the-appropriate-escalation-level). #### Create Schedules for the Primary and Secondary On-Call Levels This example uses a **Primary** schedule and a **Secondary** schedule. Both schedules rotate weekly on Monday at 0900 and have multiple people in the rotation. The person from the **Primary** schedule is the first responder and the person from the **Secondary** schedule is the backup, in case the first responder does not take action on an incident.  *Primary schedule*
 *Secondary schedule* > **Schedule Layer Precedence:** See the section [Schedule Layer Precedence](#schedule-layer-precedence) for more information about why two schedules are required for a primary/secondary setup. #### Add Each Schedule to the Appropriate Escalation Level Once you have created on-call schedules to represent primary and secondary levels, you can add each schedule to an escalation policy. In the following screenshot, the **Primary** schedule is the first escalation level and the **Secondary** schedule is the second escalation level. The expected behavior for this escalation policy is as follows: - When an incident triggers, it will be immediately assigned to whoever is on call in the **Primary** schedule. - The **Primary** schedule user has 30 minutes to take action on the incident (i.e., acknowledge, resolve, or reassign the incident). - If the user on the **Primary** schedule does not take action on the incident within 30 minutes, the incident will escalate to the on-call user at the second escalation level. - If the person on the **Secondary** schedule does not take action on the incident within 30 minutes, then the incident is reassigned and escalated to the person on the **Primary** schedule (**Repeats 3 times if no one acknowledges incidents**).  *Primary and Secondary schedules added to an escalation policy* Alternatively, if you would like _both_ your **Primary** and **Secondary** on-call users to be notified when an incident triggers, you can add both schedules to the same escalation level.  *Primary and Secondary schedules at the same escalation level* > **Tip:** You must have a minimum of five minutes between escalation levels if you have more than one person/schedule in an escalation level. ### On-Call Shadowing A common practice for new hires is to have them shadow the primary on-call responder, so they can gain experience before taking on responsibility for a service. You can achieve this by creating a dedicated shadow schedule, and placing it alongside the primary on-call schedule on the escalation policy. #### Create a Shadow Schedule with a Placeholder User 1. In the PagerDuty web app, navigate to **People** → **Schedules** and click **New Schedule**. 2. Enter a **Schedule Name** (for example, On-call Shadow), select a placeholder user in schedule **Layer 1**, and click **Save Schedule**. #### Add the Shadow Schedule to Your Escalation Policy 3. Navigate to **People** → **Escalation Policies**. 4. Select your preferred escalation policy and click **Edit Escalation Policy**. 5. Add the schedule you created in the previous step to the first escalation level and click **Save**. #### Add the Shadowing User to the Shadow Schedule 6. Add the shadowing user to the shadow schedule, either by [adding them to the rotation](/incident-management/schedules/edit-schedules#add-users-to-existing-schedules) or as an [override](/incident-management/schedules/edit-schedules#create-overrides) for the appropriate amount of time. ### Notify Multiple Users During Specific Times In many cases, you have a group of people on call during business hours and a different group of people on call after business hours, or different groups of people on call at various times of the day. The intended use of an escalation policy is to notify one person at a time, but you may have situations when you want to notify multiple people at the same time. To notify multiple users at the same time, but only during specific times, you want to: - [Create individual on-call schedules for each person](#create-individual-on-call-schedules-for-each-person). - [Add the schedules to the appropriate level of an escalation policy](#add-schedules-to-an-escalation-policy). This example uses the following setup: - User 1 and User 2 are on call during business hours, Monday through Friday 0800 – 1700, and should be notified at the same time. - User 3 and User 4 on call after business hours, Monday through Friday 1700 – 0800, and should be notified at the same time. - User 5 and User 6 are on call during the weekend, Friday 1700 – Monday 0800, and should be notified at the same time. #### Create Individual On-Call Schedules for Each Person The first step is to create an [on-call schedule](/incident-management/schedules/schedule-basics#create-a-schedule) for each user, reflecting their specific on-call times. The following are examples for each of the three shifts. Here is what User 1's schedule would look like. User 1 is on call Monday through Friday from 0800 to 1700: 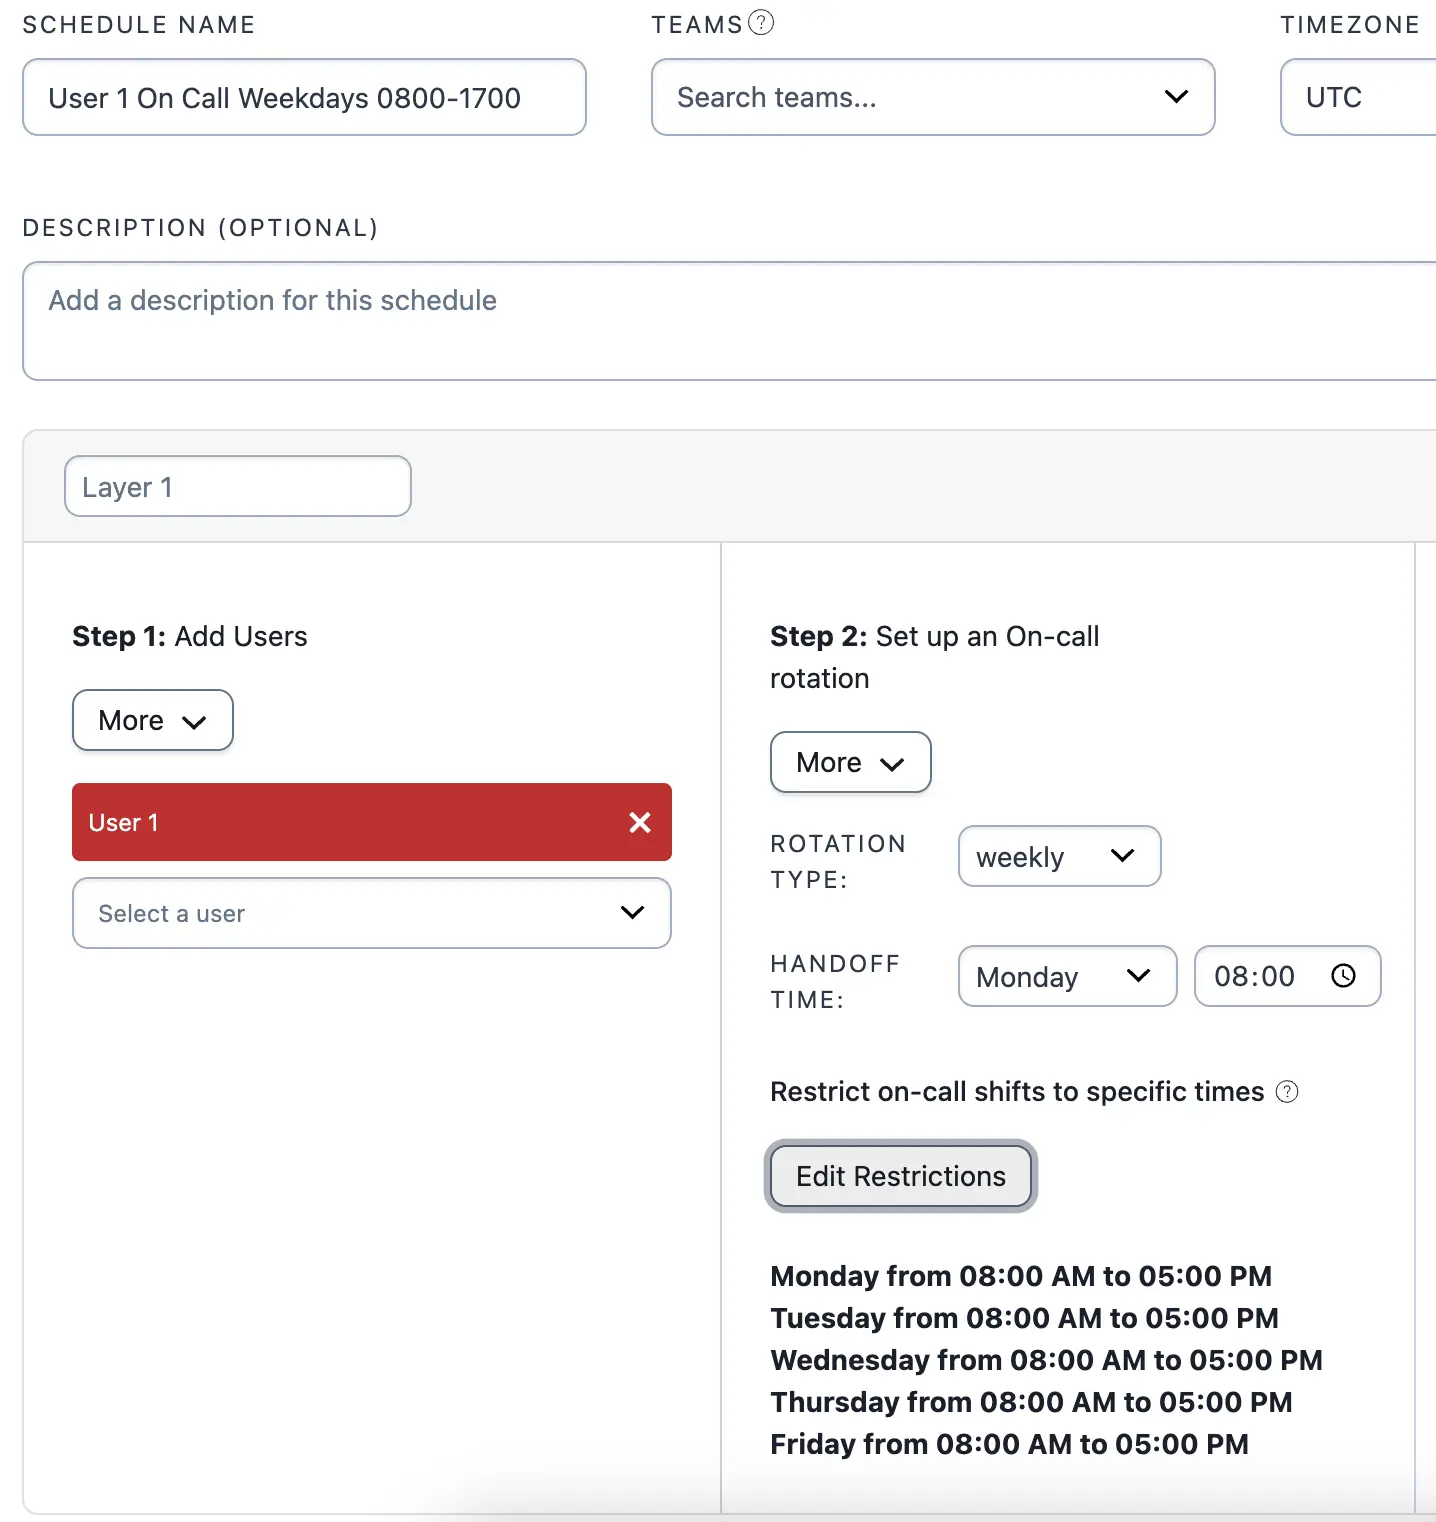 *User 1's restricted weekday shifts* User 3 is on call during the week from 1700 to 0800: 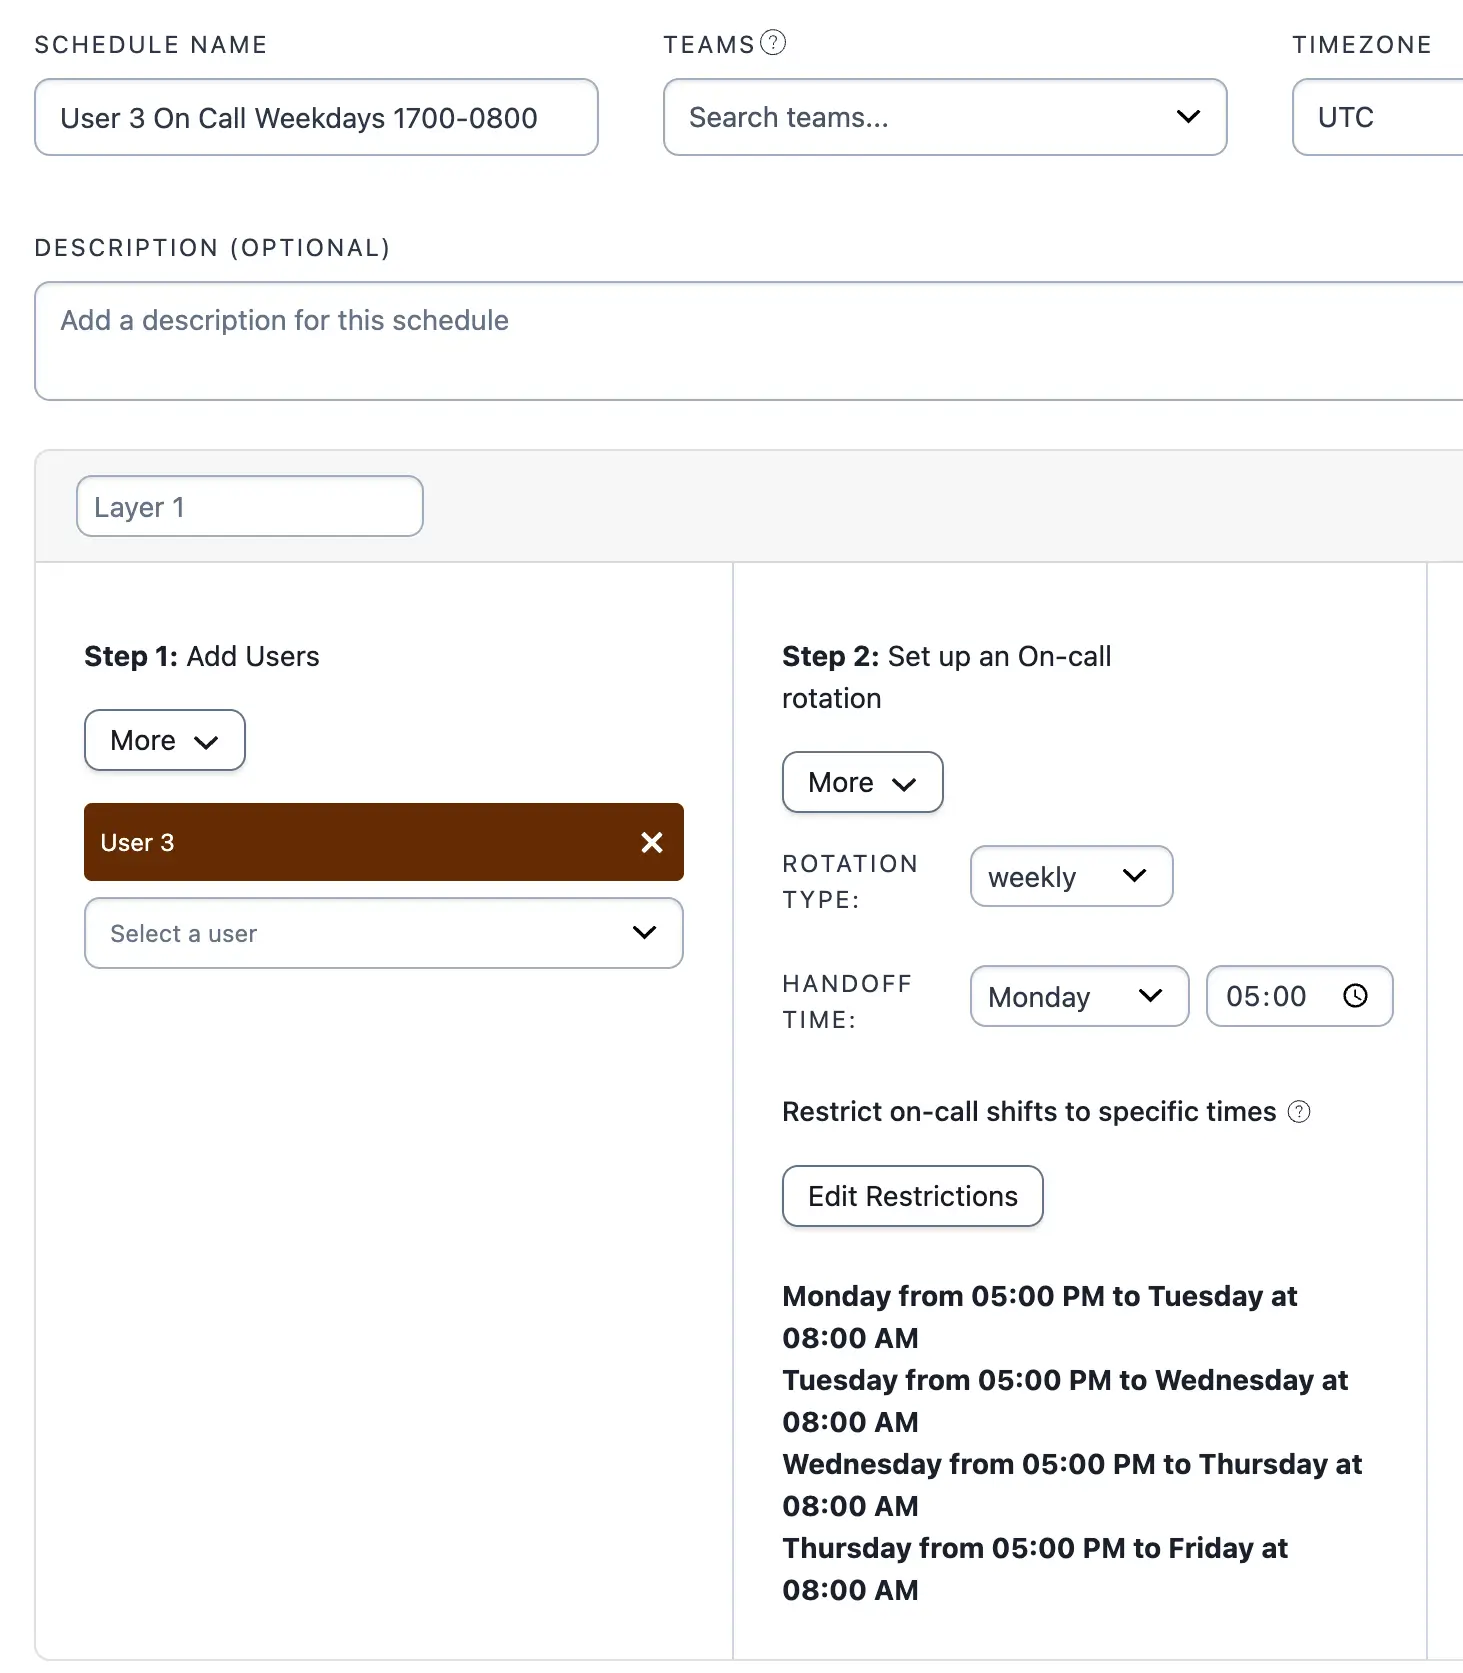 *User 3's restricted weekday shifts* User 5 is on call over the weekend, from Friday 1700 to Monday 0800: 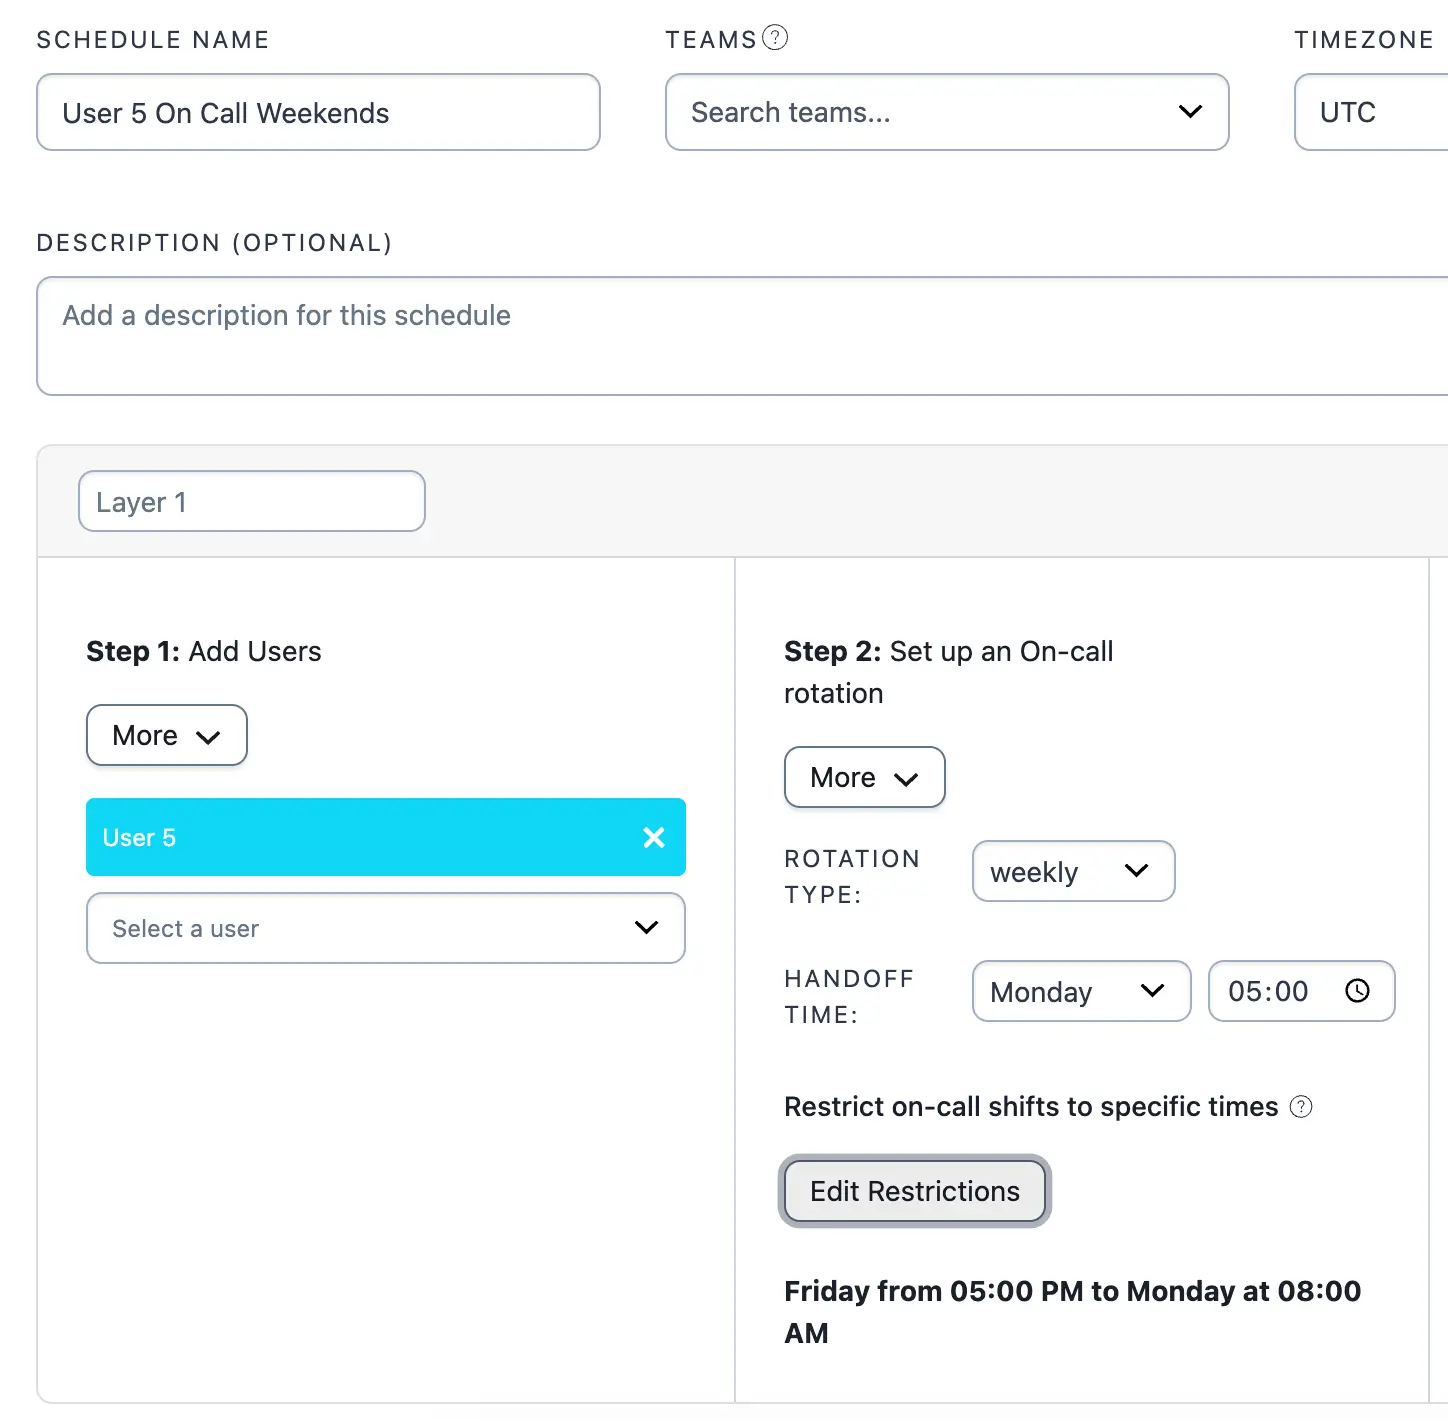 *User 5's restricted weekend shift* #### Add Schedules to an Escalation Policy Once you have created a schedule for each user, you can add them to an escalation policy. The following image shows all six schedules in the first level of the escalation policy. With this configuration, if an incident triggers Monday through Friday between 0800 and 1700, User 1 and User 2 will be notified and assigned to the incident, since they are the only users who are on call at that escalation level during those times. If an incident triggers Monday through Friday 1700 and 0800, User 3 and User 4 will both be assigned to the incident and notified, since they are the only users who are on call at that escalation level during those times. On the weekends, Friday 1700 to Monday 0800, only User 5 and User 6 will be assigned to incidents and notified. 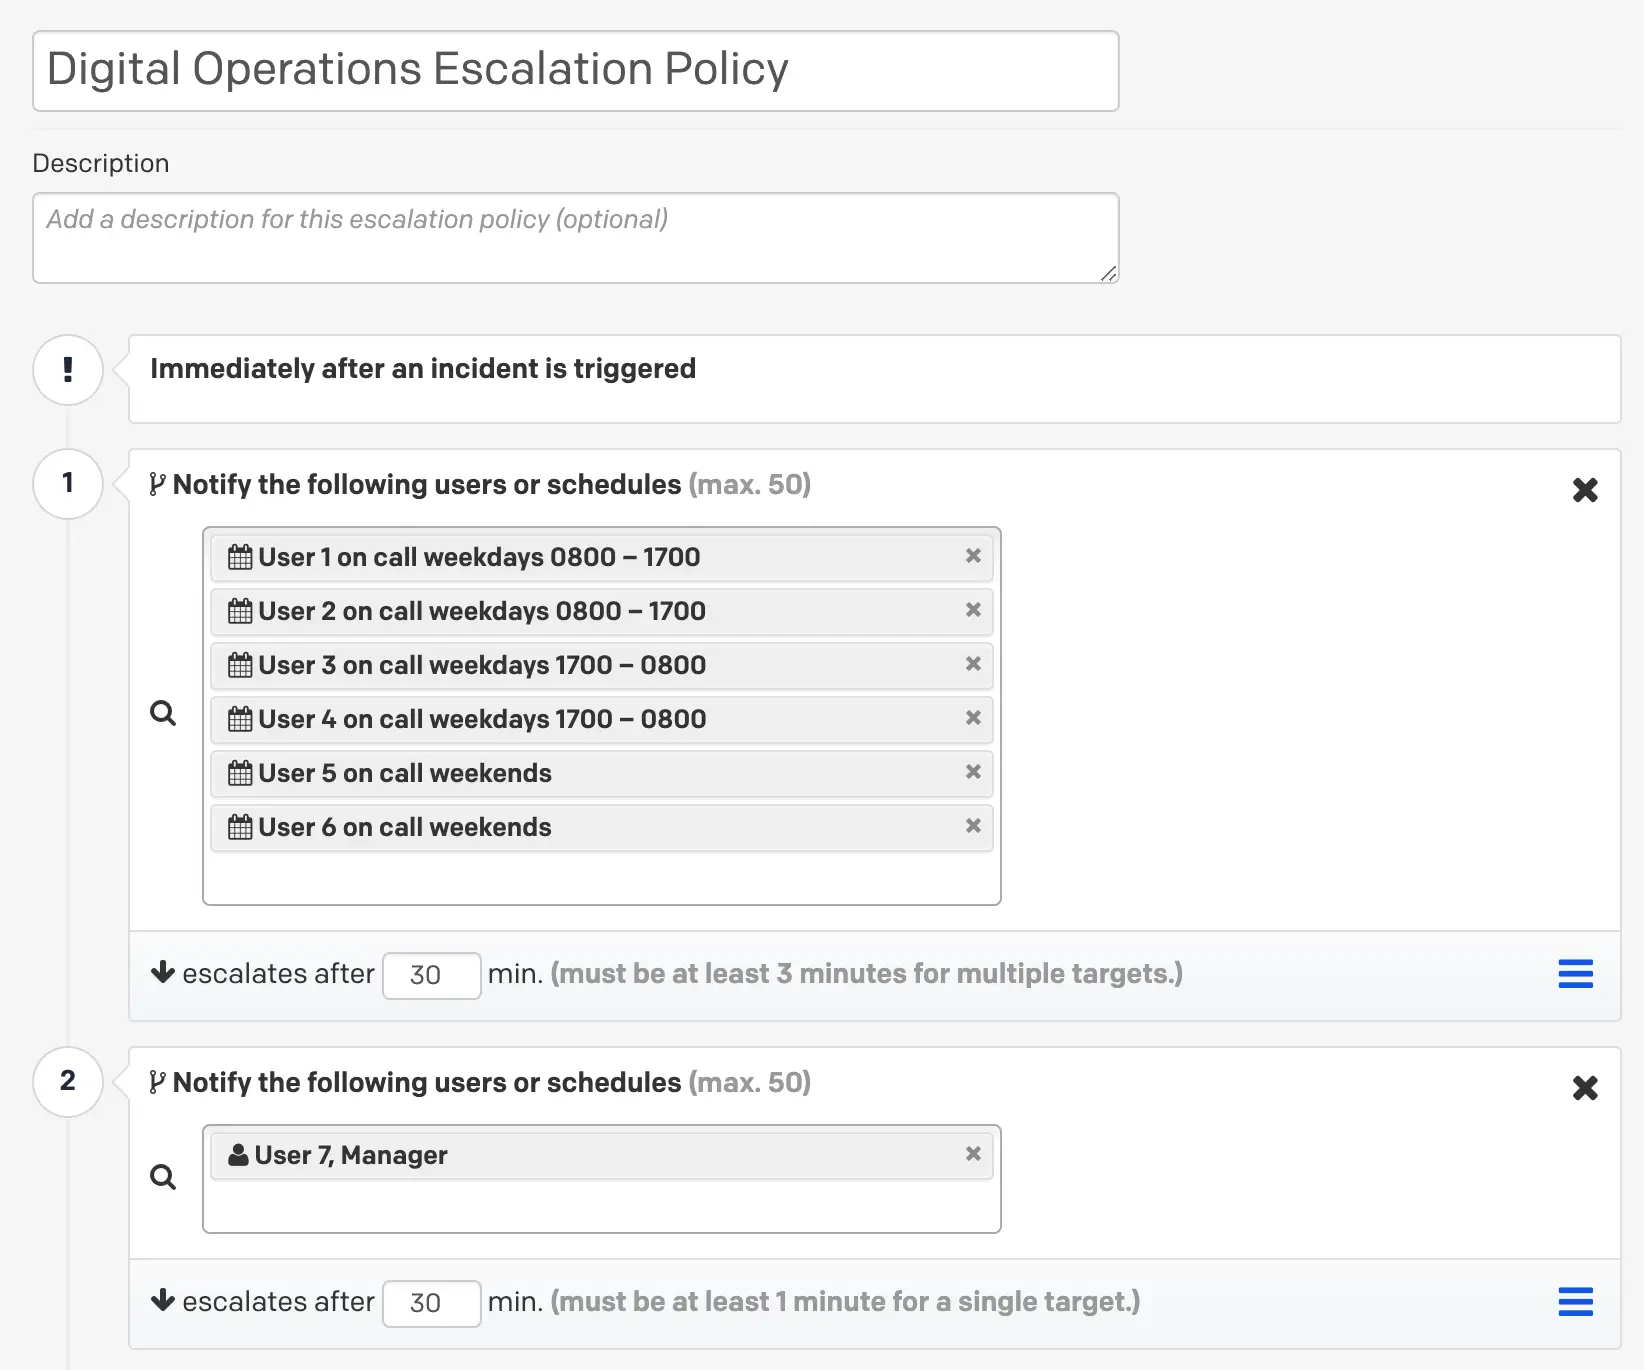 *Schedules added to an escalation policy* In this example, the escalation policy is set up so that if an incident is not acknowledged or resolved within 30 minutes, it will escalate to the team's manager, User 7. ## Schedule Layer Precedence An important concept to grasp is that only _one user per schedule can be on call_. In other words, you cannot notify multiple users at once using a single schedule. With the goal of notifying multiple users at once, a natural first instinct would be to add multiple layers to a schedule — one layer for each on-call responder, for example. The way PagerDuty schedules work, however, is that the lowest layer on a schedule takes precedence over any others. The following screenshot demonstrates what happens when multiple schedule layers are stacked on top of each other, i.e., Layer 3 takes precedence over Layers 1 and 2: 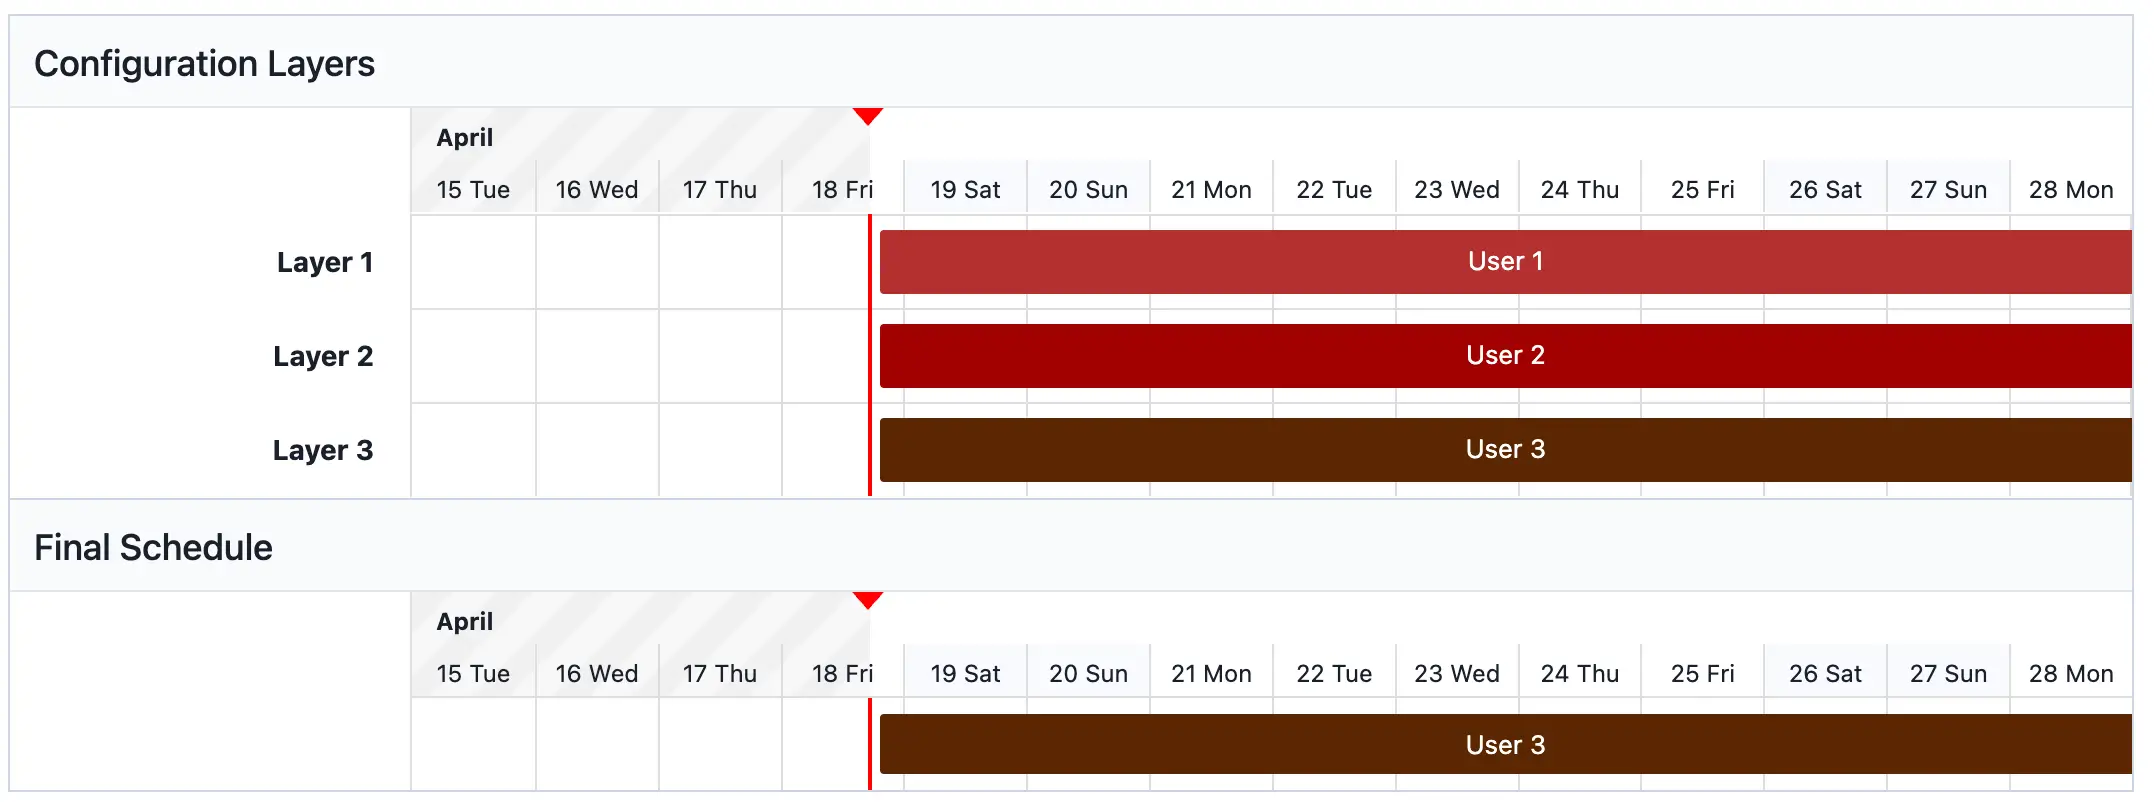 *Bottom schedule layer precedence* With this in mind, [adding multiple schedules and/or users to an escalation policy](/incident-management/schedules/escalation-policies#notify-multiple-users-at-once) is the only way to notify multiple users at once. --- URL: https://docs.pagerduty.com/incident-management/schedules/google-calendar-extension # Google Calendar Extension Sync Out of Office events from Google Calendar into PagerDuty to flag scheduling conflicts before they affect on-call coverage. The Google Calendar extension syncs calendar events with PagerDuty. The extension integrates with Shift Agent to detect scheduling conflicts before they impact coverage, and it operates independently to support standalone scheduling needs. This integration reduces manual availability updates and maintains operational continuity while respecting scheduled commitments. > **Availability:** The Google Calendar extension is available on all pricing plans. > **Permission Scope Details:** - The Google Calendar integration connects at an account level. PagerDuty reads **Out of Office** events only for Google Calendar accounts with a corresponding PagerDuty user. PagerDuty identifies users by matching email addresses. > - The scope `https://www.googleapis.com/auth/calendar.events.freebusy` does not enable PagerDuty to view all calendar events or user data. > - PagerDuty does not store data unrelated to **Out of Office** events. PagerDuty stores and displays **Out of Office** dates and times for specific users on the PagerDuty schedule page to determine conflicts. > - PagerDuty cannot read event titles, view users on events, or write to calendars. ## Set Up the Google Calendar Extension 1. In Google Workspace, follow the instructions to [Create a service account](https://developers.google.com/identity/protocols/oauth2/service-account#creatinganaccount) to share credentials with PagerDuty. In **Advanced settings**, configure the following fields: | Field | Value | | :-------------------------------------------- | :----- | | **Domain-wide Delegation** | Enable | | **Google Workspace Marketplace OAuth Client** | Enable | 2. Navigate to **Main Menu** → **APIs & Services** → **OAuth consent screen**. 3. Select **Data Access** and click **Click or remove scopes**. 4. Click the **Filter** search field and select **Scope**. 5. Search for and select `https://www.googleapis.com/auth/calendar.events.freebusy`. 6. Select the **Google Calendar API** checkbox and click **Update**. 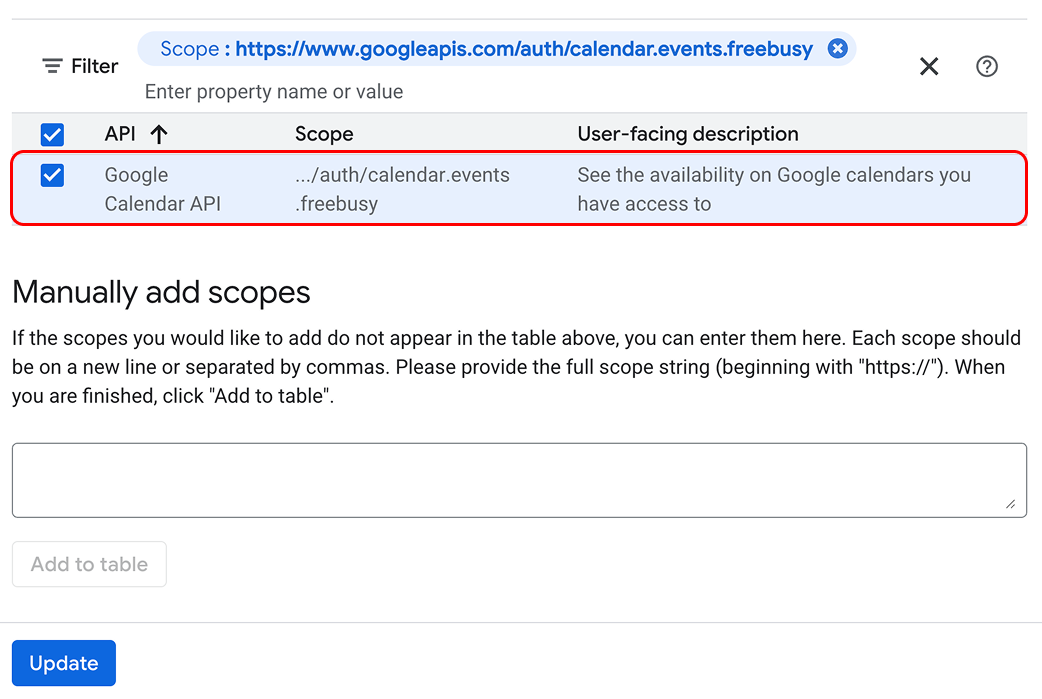 *Enable Google Calendar API Scope* 7. In the PagerDuty web app, navigate to **Integrations** → **Extensions**. 8. Click **New Extension** and select **Google Calendar**. 9. On the Google Calendar extension page, upload your **Google Workspace token file**. View Google's [Creating a service account](https://developers.google.com/identity/protocols/oauth2/service-account#creatinganaccount) documentation for more information about your Google Workspace access token. 10. Navigate to the **Google Workspace Admin Console** and add a new client with an ID matching the service account client ID. - **Note**: You can add only one file for each Google Workspace. 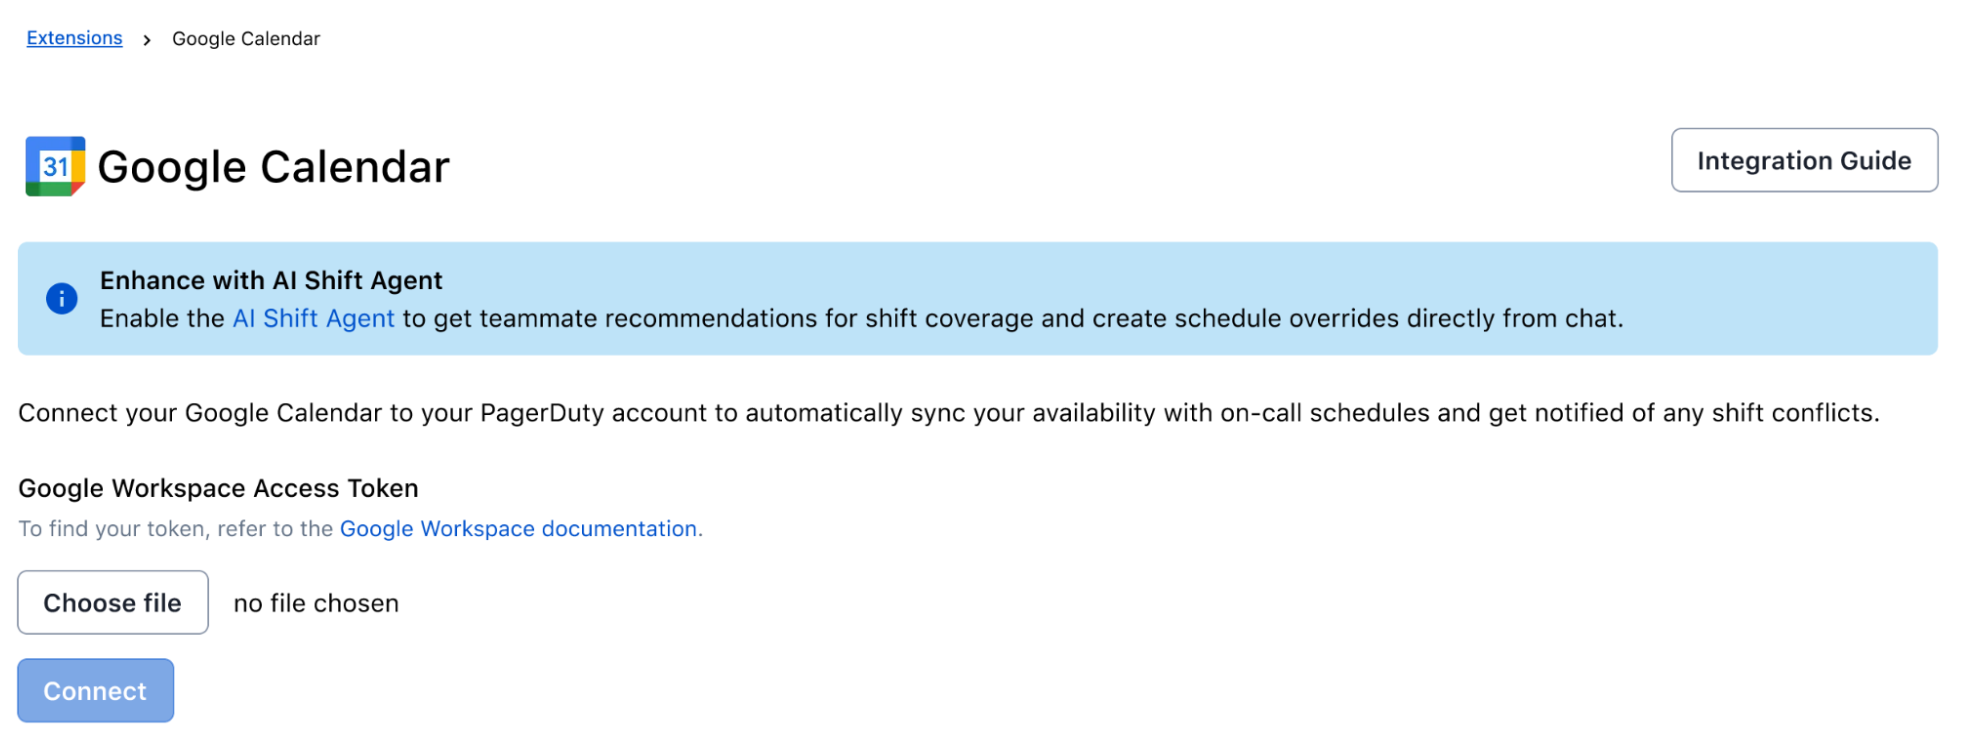 *Upload Google Workspace Access Token* > **Calendar Event Limit:** A limit of 1,000 total future calendar events exists per calendar. > **Google Calendar Update Schedule:** Shift Agent ingests Google Calendar data once per hour and does not immediately detect recent conflicts. Manually share out-of-office information with Shift Agent (for example, `I am going to be on vacation June 13`) to immediately include recent availability updates. > **Use Focus Time to Block Meetings:** The **Focus Time** event type blocks your calendar for lunch or other times to prevent meetings. This event type auto-declines events without triggering PagerDuty conflict detection. ### Configure Account-Level Notification Settings Navigate to **Integrations** → **Extensions** → **Google Calendar** to adjust notification settings. When enabled, you can suppress Slack conflict alerts that occur during your Google Calendar Out of Office (OOO) event. Alerts outside the OOO window deliver normally. This configuration reduces noise from last‑minute OOO blocks added to schedules. 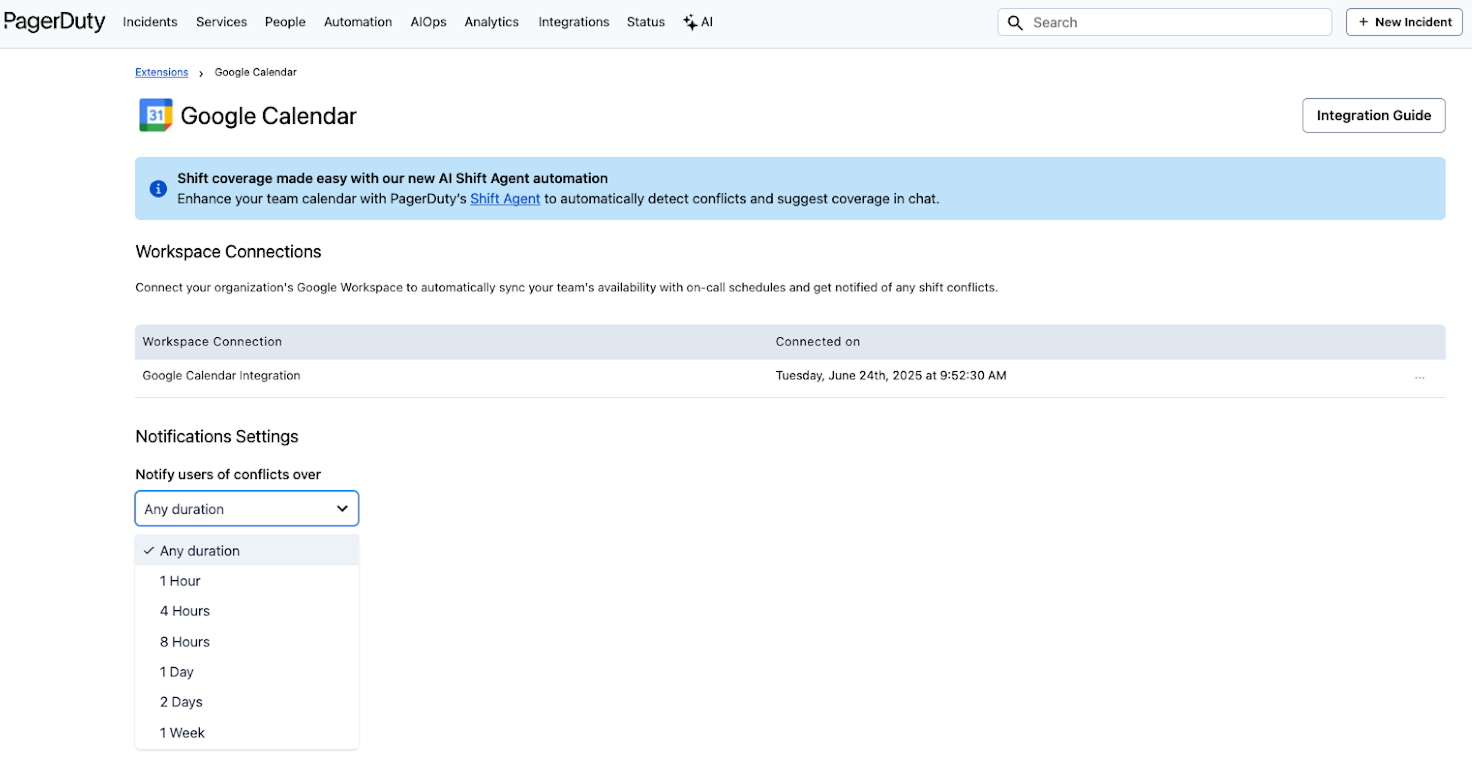 *Google Calendar Notification Settings* --- URL: https://docs.pagerduty.com/incident-management/schedules/my-on-call-shifts # My On-Call Shifts An at-a-glance view of your on-call shifts My On-Call Shifts allows users to view their current and upcoming on-call responsibilities in a single, easy-to-use view, where they can also create overrides for any of their shifts. My On-Call Shifts is also available as a widget on the right side of the Incidents page, which displays a user's current shift and when they are on call next. > **Schedules and Escalation Policies:** My On-Call Shifts displays schedule shifts if the schedule is part of an active [escalation policy](/incident-management/schedules/escalation-policies) (i.e., a service uses the escalation policy). If you have shifts on a schedule that _do not_ appear in My On-Call Shifts, please check that the schedule is on an escalation policy, and that a service uses the escalation policy. ## My On-Call Shifts in the Web App To access the My On-Call Shifts page: 1. Navigate to **People** → **My On-Call Shifts**, or **User Icon** → **My Profile** → **On-Call Shifts** tab. The following information is displayed here: - **Currently On-Call**: In the upper-left you will see shifts that you are currently on call for. - **My On-Call Shifts**: Below on the left, you will see a list of all your on-call shifts. - **Calendar**: In the center of the screen you will see a calendar of your upcoming on-call shifts, up to 90 days in the future. - Use the dropdown in the top right to adjust the time range by **month**, **week**, **day** or **list** view. > **90-Day Calendar Limit:** The calendar will only display shifts up to 90 days in the future. You may view calendar dates beyond 90 days, but shifts will not be visible. ### Shift Types Shifts types are denoted by the following: - Recurring on-call shifts have a **solid color**. - Shifts where you are always on-call have a **diagonal line pattern**. ### Adjust the Time Zone You can adjust the time zone using the dropdown on the left side of the screen. ### Toggle Escalation Policy Layers To add or remove on-call shifts from the view, click the **eye icon** to the right of a shift in your **My On-Call Shifts** list. Your selection is saved when you navigate away from the page. ### View Another User's On-Call Shifts Go to **People** → **Users** and select another user to visit their profile page. Select the **On-Call Shifts** tab. > **Tip:** You can [create overrides](#create-override-button) while viewing another user's On-Call Shifts page. ## Create Overrides on My On-Call Shifts There are two ways to create overrides on the My On-Call Shifts page: - [Use the Multi-Overrides tool](/incident-management/schedules/my-on-call-shifts#multi-overrides-tool) - [Use the Create Override button](/incident-management/schedules/my-on-call-shifts#create-override-button) ### Multi-Overrides Tool > **Delete Overrides Made Using the Multi-Overrides Tool:** If you wish to delete any overrides that were made with the Multi-Overrides tool, you will need to delete them individually. This is typically done on the associated schedule's detail page. Read [Delete an Override](/incident-management/schedules/edit-schedules#delete-an-override) for more information. > > Multi-Overrides can only be made up to three months ahead of the current date. 1. Navigate to **People** → **My On-Call Shifts**. 2. In the calendar, hover over a date, then click and drag to select the range of dates you would like to override. 3. In the modal, select a user from the **Who should take this shift?** dropdown. 4. Review the shifts that you are overriding — you may _optionally_ edit the start and end times, as well as uncheck shifts from the list at the bottom of the modal. 5. Click **Create Override**. ### Create Override Button 1. Navigate to **People** → **My On-Call Shifts** → **Create Override**. 2. In the modal, select a user to override in the **Who should take this shift?** dropdown, select a user to override the shift. 3. Update the start and end times to cover the appropriate time range. - _Optional_: If you do not wish to override all of a user's shifts, you can uncheck shifts from the list at the bottom of the modal. 4. Click **Create Override**. ## My On-Call Shifts Widget To access the **My On-Call Shifts** widget, navigate to the right side of the **Incidents** page. The widget displays your current on-call shifts with dates and times, as well as escalation policies you are on-call for and upcoming shifts. --- URL: https://docs.pagerduty.com/incident-management/schedules/readiness-reports # On-Call Readiness Reports Ensure that responders have optimal on-call notification settings ## On-Call Readiness Reports On-Call Readiness Reports help organizations improve incident response quality by ensuring responders have optimal [notification rule configurations](/account-admin/user-profile/notification-rules). When responders have well-configured notification rules, they are better prepared to go on-call and are less likely to miss notifications, decreasing MTTA. Every report provides a Team-filtered overview of each responder's on-call readiness status, and can optionally send them email instructions on how to best configure their notification rules. > **Availability:** On-Call Readiness Reports are available on PD Reliability Platform plans. They're also available on the following pricing plans: Business, Digital Operations (legacy), and Enterprise for Incident Management. [Contact our Sales team](https://www.pagerduty.com/contact-us/) to upgrade your account to include On-Call Readiness Reports. ## Create an On-Call Readiness Report > **Required User Permissions:** - Team Managers can create On-Call Readiness Reports for Teams that they are Managers or members of. > - Admins and Account Owner can create On-Call Readiness Reports for all Teams. 1. Navigate to **Analytics** → **On-Call Readiness** and click **Create a New Report**. 2. **Readiness Profile**: You may _optionally_ edit the name of the report by clicking next to the auto-populated name, entering your preferred **name**, and clicking **Save Changes**. Next, select an on-call readiness profile: - [Never miss a page](#never-miss-a-page) - [Try every notification method](#try-every-notification-method) - [More than email](#more-than-email) - [Must include phone](#must-include-phone) Click **Next** to continue. 3. **Search and Filter**: On the next screen, the [Teams](/account-admin/teams) that you are a member of, or a manager on, are selected by default. Click the dropdown **\[X] teams selected** to adjust which Teams are included in the report. Once you have selected your preferred Team(s), click **Apply**. 4. Next you see a preview of the selected Teams' **Readiness Summary** and **Readiness Details**. To see a detailed view of how each responder compares to the report's criteria, click the Team dropdown under **Readiness Details**. Click **Next** to continue. 5. **Notify Users**: This screen displays a summary of the emails that will be sent to your selected responders. It displays: - **Recipients**: The number of recipients. - **Sender**: This is PagerDuty by default. You may change this by clicking **Edit**, selecting the preferred **sender** from the dropdown, and clicking **Save changes**. - **Subject**: The default subject of the email, e.g., `Action Requested: Your PagerDuty on-call profile is incomplete`. - **Documentation Link** _(optional)_: By default the email directs recipients to follow documentation in the [PagerDuty Knowledge Base](/get-started/introduction). To link to internal documentation instead, click **Add one**, enter a link to your preferred documentation, and click **Save changes**. 6. You then see a preview of the email that recipients will receive. After reviewing the information in the previous section, click **Send Email** to send to the selected recipients, _or_ click **Save & Close** to save the report and email settings for later use. If you choose to send the email, click **Confirm** in the confirmation modal. 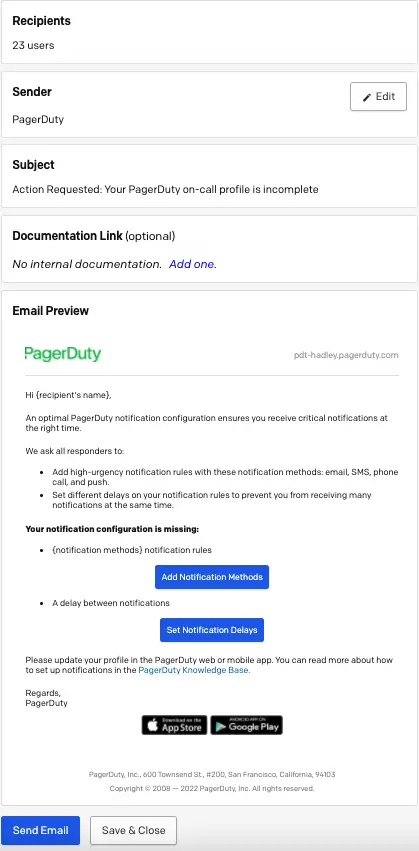 *Preview on-call readiness email* ### Edit an On-Call Readiness Report 1. Navigate to **Analytics** → **On-Call Readiness** and click the **Name** of the report. 2. You may edit the following pages: - **Readiness Profile**: By default, the report is at the **Search and Filter** teams step, but you may also change the Readiness Profile by clicking **Previous**. Once you have chosen your Readiness Profile, click **Next** to return to Search and Filter. - **Search and Filter**: You may edit your selected teams by clicking into the dropdown under **Search and select specific teams that you would like to target for improving readiness**, editing your preferred Teams, and clicking **Apply**. Click **Next** to edit the email details. - **Notify Users**: On this page you may edit the Sender by clicking **Edit**, selecting the sender from the dropdown, and clicking **Save Changes**. 3. Once finished with edits to all of the previous pages, click **Send Email** or **Save & Close** on the Notify Users page to save your changes. ### Edit On-Call Readiness Settings > **Required User Permissions:** Admins and Account Owners can edit On-Call Readiness Settings. To change the default On-Call Readiness profile to fit your organization: 1. Navigate to **Analytics** → **On-Call Readiness** → **Settings**. You can also find these settings by navigating to **User Icon** → **Account Settings** → **On-Call Readiness**. 2. Select your preferred [default report profile](#on-call-readiness-report-profiles) and click **Save**. ## Delete an On-Call Readiness Report 1. Navigate to **Analytics** → **On-Call Readiness**. 2. Hover over the **Name** of your report and click . A confirmation pop-up appears; click **Delete** to delete the report.  *Delete an on-call readiness report* ## On-Call Readiness Report Profiles ### Never Miss a Page The **Never miss a page** profile ensures that responders have high-urgency notification rules configured with every contact method (push, email, phone call, and SMS). It also ensures that they have delays set between the notification rules in case they miss the first notification. ### Try Every Notification Method The **Try every notification method** profile ensures that responders have high-urgency notification rules configured with every contact method (push, email, phone call, and SMS), which provides resiliency in case of delivery failures. ### More Than Email The **More than email** profile ensures that responders have high-urgency notification rules configured with at least one non-email/silent contact method (push, email, phone call, or SMS). ### Must Include Phone The **Must include phone** profile ensures that responders have high-urgency notification rules configured with phone call notifications. It also ensures that responders have delays set between the notification rules to prevent them from receiving many notifications at the same time. This is usually the most reliable way to be woken up at night. ## On-Call Readiness Responder Emails When a Team Manager or Admin sends out emails from the On-Call Readiness Report, the responders from the selected Teams that do not meet the report's criteria receive emails similar to the following, prompting them to configure their notification rules properly: 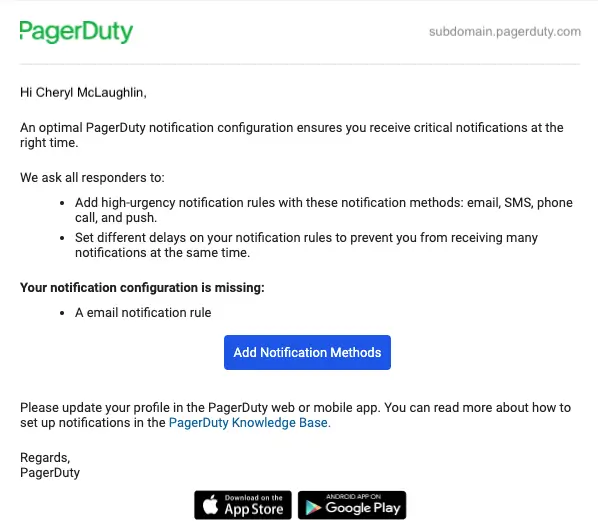 *On-call readiness responder email* ## Mobile Notification Rule Templates Responders who download the [PagerDuty Mobile App](/get-started/mobile-app) for the first time go through an onboarding wizard, which includes fast and easy notification rule setup using the [on-call readiness](#on-call-readiness-report-profiles) notification rule templates. These templates include notification rule presets, which are designed to signify different levels of urgency. Choosing a template overwrites other notification rules, and it prompts responders who already have custom rules to confirm they would like to apply these changes. 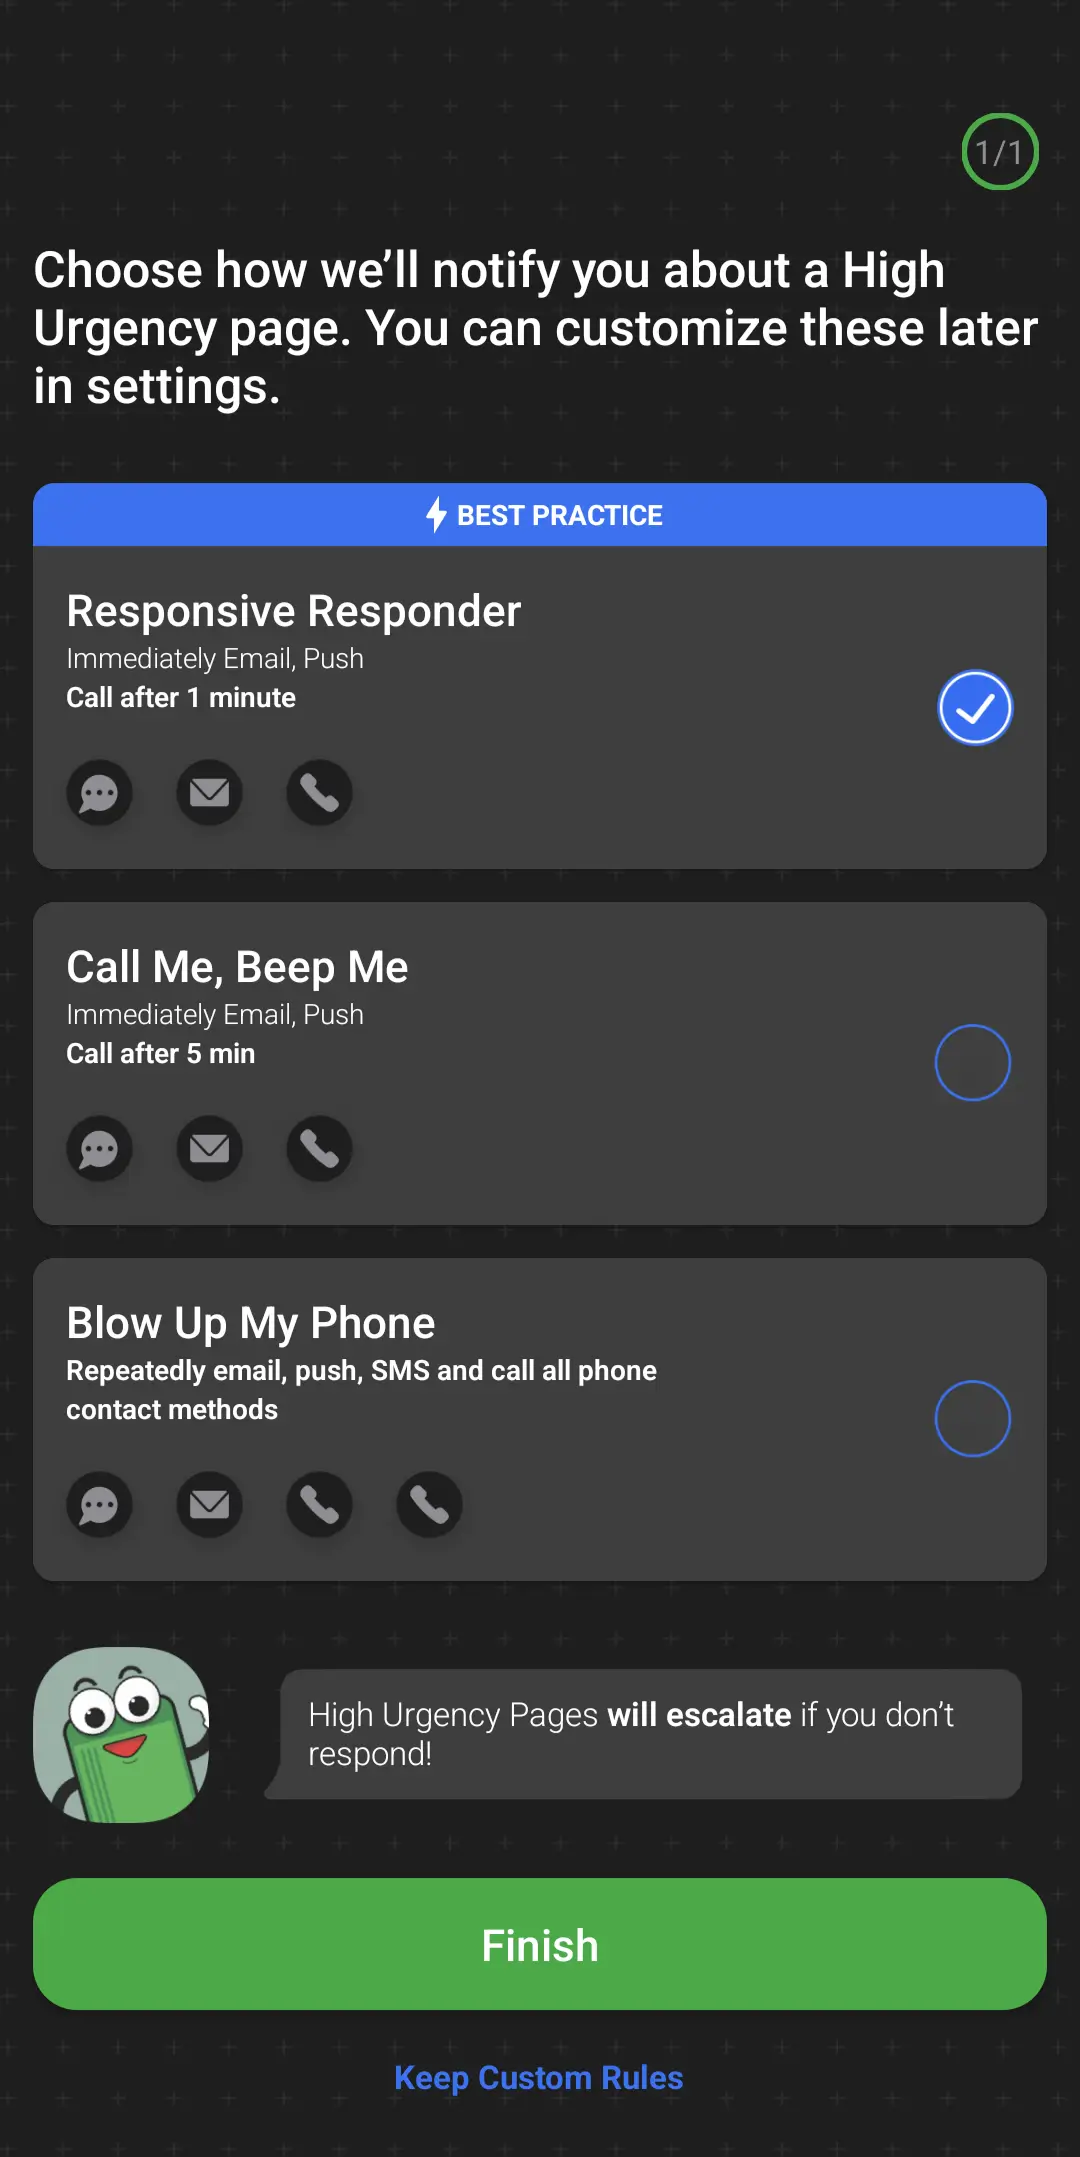 *Mobile notification rule templates*
--- URL: https://docs.pagerduty.com/incident-management/schedules/round-robin-scheduling # Round Robin Scheduling Use an assignment ring to add responders to incidents in sequential order Round Robin Scheduling is an incident assignment strategy where users are placed in a ring and assigned to incidents sequentially. This strategy helps ensure that incidents are equitably distributed, especially if they cluster during a single on-call shift. It can also lower incident response time if a service experiences concurrent incidents, since the incidents will not all be assigned to the same responder. > **Availability:** Round Robin Scheduling is available on PD Reliability Platform plans. It's also available on the following pricing plans: Business, Digital Operations (legacy), and Enterprise for Incident Management. [Contact us](https://www.pagerduty.com/contact-sales/) for more information about changing to a pricing plan that includes Round Robin Scheduling. ## Enable Round Robin Scheduling ### Enable Round Robin on a New Escalation Policy Follow the instructions to [create an escalation policy](/incident-management/schedules/escalation-policies#create-an-escalation-policy), making sure to select **Assign via Round Robin** in step three. ### Enable Round Robin on an Existing Escalation Policy 1. Navigate to **People** → **Escalation Policies** → click to the right of your desired escalation policy and select **Edit**. In the level(s) where you would like to enable Round Robin, check the box **Assign via Round Robin**.  *Select Assign via Round Robin* 2. Add **users** or **schedules** to the escalation level. When it is a schedule's turn for incident assignment, whoever is currently on call for the schedule will be assigned to the incident. 3. Click **Save**. When an incident triggers on any service that [uses this escalation policy](/incident-management/services/services-and-integrations#edit-a-services-escalation-policy), incidents will be assigned in sequential order to the users and/or schedules participating in the round robin rotation. ### Round Robin Scheduling Indicator With Round Robin Scheduling enabled, a green arrow appears next to the user who is next in line for incident assignment.  *User1 Is Up Next for Incident Assignment* ### Disable Round Robin Scheduling 1. Navigate to **People** → **Escalation Policies** → click to the right of your desired escalation policy and select **Edit**. 2. Uncheck the **Assign via Round Robin** checkbox underneath each escalation level where you would like to disable Round Robin Scheduling. 3. Click **Save**. ## Starting Point Determination Round Robin Scheduling uses an assignment ring to determine who to assign an incident to. The starting point of the ring is determined by the user order when the escalation policy is created. For example, if you enable Round Robin Scheduling on an escalation policy and add User 1 followed by User 2, the starting point of the ring will be User 1. ## When Users Are Added or Removed When you add or remove users or schedules from an escalation level with Round Robin Scheduling enabled, the previous on-call sequence for other users and schedules will remain unchanged. This means that: 1. Any users or schedules removed from the escalation policy level are also removed from the assignment ring. 2. Any users or schedules added to the escalation policy level are appended to the back of the ring, in the order they were added. 3. The ring resumes in the same order it was originally configured in, either without the removed user or with the newly-added user at the back of the ring. ### Examples **Add a User:** A round robin rotation has two users, and User 2 is set to receive the next incident:  *Round robin rotation with two users, User 2 up next* If you add User 3 and User 4, they are added at the back of the assignment ring. The assignment order continues after User 2 onto User 3 → User 4 → User 1, and so on:  *Round robin rotation with four users after adding User 3 and User 4* **Remove a User:** With the same four users as above, User 3 is set to receive the next incident, but you remove User 4:  *Round robin rotation with four users, User 3 next and User 4 being removed* The order continues after User 3 onto User 1 → User 2, and so on:  *Round robin rotation with three users after removing User 4* ## Responder Requests When an escalation policy with Round Robin Scheduling is requested as part of a [responder request](/incident-management/incidents/add-responders#escalation-policy-responder-notifications) — either [manually](/incident-management/incidents/add-responders#manually-add-responders-to-an-open-incident) or as part of an [Incident Workflow](/ai-automation/automation/incident-workflows) — the request goes to the user at the front of the assignment ring and the ring rotates. **Example:** An escalation policy with Round Robin Scheduling has three users and User 2 is at the front of the assignment ring. During the course of an incident on a different service, someone requests the escalation policy as a responder. User 2 receives the responder request and User 3 is now at the front of the assignment ring. ## Incident Workflows If a Round Robin Scheduling escalation policy is part of an Incident Workflow's responder request along with other users, all users indicated in the workflow will receive responder notifications and the assignment ring will rotate. ## Schedules With Coverage Gaps When a schedule is due for assignment next, PagerDuty attempts to assign the incident to whoever is currently on call on that schedule. If no one is on call due to a [coverage gap](/incident-management/schedules/schedule-basics#schedule-restrictions), PagerDuty skips the schedule and assigns the incident to the next user or schedule in the assignment ring. This ensures that a coverage gap on a schedule does not cause an incident to be missed. When a skip due to a coverage gap occurs, the schedule remains at the front of the assignment ring, and PagerDuty will attempt to assign the next incident to it. ## Escalation Timeouts If a responder does not acknowledge the incident within the escalation timeout period, the incident escalates to the next level of the escalation policy — it does not rotate between users or schedules at the same escalation level. To learn more about escalation policies and escalation timeouts, see [Escalation Policies](/incident-management/schedules/escalation-policies). ## Escalation Policies with a Single Level If a responder does not acknowledge an incident within the escalation timeout period and the escalation policy is set to repeat, Round Robin Scheduling will attempt to assign the incident to the next user or schedule in the assignment ring. When an incident is reassigned to the same escalation policy, Round Robin Scheduling will also assign the incident to the next user or schedule in the assignment ring. ## Round Robin Scheduling and Live Call Routing Round Robin Scheduling does not apply to [Live Call Routing](/integrations/live-call-routing) when the connection is configured to [connect directly to an on-call responder](/integrations/live-call-routing#play-greeting-and-call-the-current-on-call-responder). Live Call Routing will attempt to contact all on-call responders on an escalation level if other responders on the same level do not answer the call. If responders do not answer the call, PagerDuty prompts the caller to leave a message. An incident will trigger with the incident description containing the inbound caller ID, and it will assign to the on-call responder on the first level of the escalation policy. If Round Robin Scheduling is enabled, the incident will be assigned to the user at the front of the assignment ring and the ring will rotate. ## Round Robin Scheduling via Escalation Policy API To apply Round Robin Scheduling to new and existing escalation policies via Terraform, see the [Escalation Policies API documentation](/developer/api/reference/rest/escalation-policies/update-escalation-policy). --- URL: https://docs.pagerduty.com/incident-management/schedules/schedule-basics # Schedule Basics Build a legacy, layer-based on-call schedule where only one user is on call at a time and the newest layer takes precedence. Use legacy schedules to map your coverage needs and determine who receives a notification when an incident triggers. When an incident impacts a service, notifications are sent to the on-call user in the [service's associated escalation policy](/incident-management/schedules/escalation-policies). Legacy schedules differ from [shift-based schedules](/incident-management/schedules/shift-based-schedules), the current scheduling experience, in how coverage is structured. Legacy schedules are built from schedule layers, where the last-created layer takes precedence over earlier layers and only one user per schedule is on call at a time. ## Create a Schedule Basic schedules are most often comprised of a single [schedule layer](#schedule-layers), where you add users on a daily or weekly rotation. You can use layers to organize shifts visually so that you can tell at a glance what days and hours a shift covers. > **Free Plan Limit:** Free plans are limited to one schedule. > **Required User Permissions:** Users with the following roles can create, edit, and delete on-call schedules: > > - User > - Manager base roles and team roles. Manager team roles can only manage schedules associated with their team. > - Admin/Global Admin > - Account Owner To create a new schedule in the web app: 1. Navigate to **People** → **Schedules** and click **New Schedule**. 2. Enter a **Schedule Name** (required) and an optional **Description**. If your account has [Advanced Permissions](/account-admin/advanced-permissions), you may optionally assign the schedule to a [Team](/account-admin/teams) using the **Teams** dropdown. > **Schedule Name and Description:** Emojis are supported in both the **Schedule Name** and **Description** fields. Schedule names are limited to 255 characters and descriptions are limited to 1024 characters. 3. Review the **Time Zone**. - The time zone is set to the [account-level time zone](/account-admin/time-zone-settings#change-the-account-level-time-zone) by default. Use the dropdown to change the time zone if needed. 4. **Step 1: Add Users**: In the **Select a User** dropdown, select all of the users you would like to add to the rotation. Users rotate through their on-call responsibilities from top to bottom. You can drag and drop users to adjust their on-call order. - If someone does not appear in the dropdown, Admin users or higher can select **Invite your team to PagerDuty** to [add users](/account-admin/manage-users#add-users) to your account. > **Who Can Be Added to Schedules:** All users, with the exception of Limited and Full Stakeholders, can be added to schedules. > > If you are not sure what role you have, or if you need your permissions adjusted, see [Check Your User Role](/account-admin/user-roles#check-your-user-role) or [Edit User Roles](/account-admin/manage-users#edit-user-roles). 5. **Step 2: Set Up an On-Call Rotation**: In the **Rotation type** dropdown, select **daily**, **weekly**, or **custom**. - This value determines how frequently the users from Step 1 change on-call responsibilities. - For **custom** rotation types, enter a value for **Shift length** and then select **hours**, **days**, or **weeks**. 6. Select a **Handoff time** via the time picker to determine when responsibilities should rotate. 7. _(Optional)_ Configure the schedule to **Restrict on-call shifts to specific times**. See [Schedule Restrictions](#schedule-restrictions) for more information. 8. **Step 3: Start Time for This Layer**: The **Start time for this layer** is automatically populated from the information in Step 2. You can optionally change it so that it takes effect at a future date and time. > **Final Schedule:** In some cases, such as when updating handoff times or setting a future start date for a schedule layer, the user order may differ between the schedule layer and the final schedule in order to preserve the rotation order. Refer to the **Final Schedule** section at the bottom of the page for a preview of what the schedule will look like after saving changes. 9. Review the **Final Schedule** section at the bottom of the page and click **Save Schedule**. > **Layer Requirement:** A schedule must have at least one layer before you can save it. You cannot save a schedule with no layers. > **Connect a Schedule to a Service:** You will need to connect the schedule to a service via an escalation policy. After associating a schedule with an escalation policy, on-call users can be notified about incidents on any service that uses the escalation policy. **If you do not add your schedule to an escalation policy, incident notifications will not be sent to users on call on the schedule.** > > Once you have [created an escalation policy](/incident-management/schedules/escalation-policies#create-an-escalation-policy), follow the instructions in [Connect a Schedule to a Service via Escalation Policy](/incident-management/schedules/escalation-policies-and-schedules#connect-a-schedule-to-a-service-via-escalation-policy). ## Edit a Schedule See [Edit Schedules](/incident-management/schedules/edit-schedules) for more information. ## Delete a Schedule > **Warning:** Deleting a schedule is permanent and cannot be restored. If you would like to deactivate a schedule instead, see [Pause or Deactivate an On-Call Schedule](/incident-management/schedules/edit-schedules#pause-or-deactivate-an-on-call-schedule). 1. Go to **People** → **Schedules** and select a schedule. 2. From the actions on the right, select **Delete this Schedule**. 3. Confirm your selection in the dialog window. ## Optional Schedule Components Depending on your organization's needs, you may find these features helpful when developing your PagerDuty schedules. ### Schedule Layers A schedule layer consists of a group of people who rotate on-call responsibilities through the same shift. In a basic weekly schedule, you create a single layer where each member is on call for one week, with a set day and time for transferring on-call responsibility. A schedule layer is also the foundation for more [complex schedules](/incident-management/schedules/schedule-examples) that you can tailor to your team's needs. Schedule layers are expandable and collapsible to help save screen space while you are creating or editing a schedule. PagerDuty's schedule builder enables you to create multiple layers for one schedule. This feature can be useful for international companies that need to create a [follow-the-sun schedule](/incident-management/schedules/schedule-examples#example-8-follow-the-sun-schedule), where each time zone can be grouped as a layer. > **Schedule Layer Limit:** Schedules can contain a maximum of 60 layers. #### Schedule Layer Precedence When a schedule has multiple layers, the last layer created — the bottom layer on the schedule creation page — has precedence over any previous layers. The example below illustrates this: 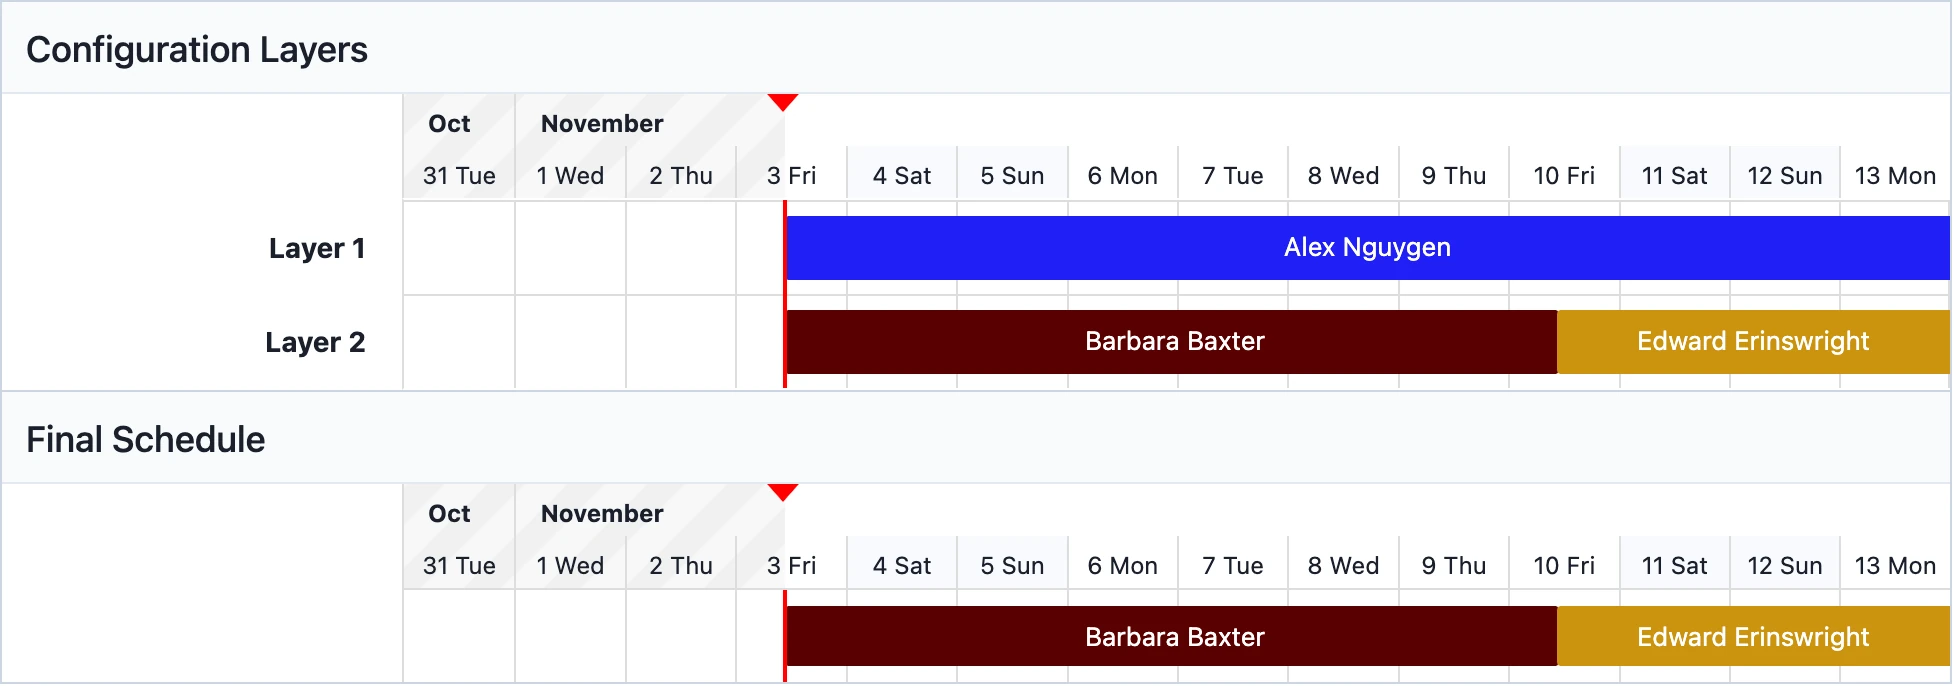 *Last layer takes precedence over previous layers* Alex is scheduled consistently in Layer 1, but since Layer 2 has Barbara and Edward scheduled over the time that Alex had in Layer 1, their layer takes precedence in the Final Schedule. This allows for [complex schedules](/incident-management/schedules/schedule-examples) where different users fill in gaps in coverage. For example, if you want Alex to be on call during the work week and Barbara and Edward to be on call on the weekends, you would create [restrictions](#schedule-restrictions) so that Layer 1 and Layer 2 fit together to create continuous coverage in the Final Schedule: 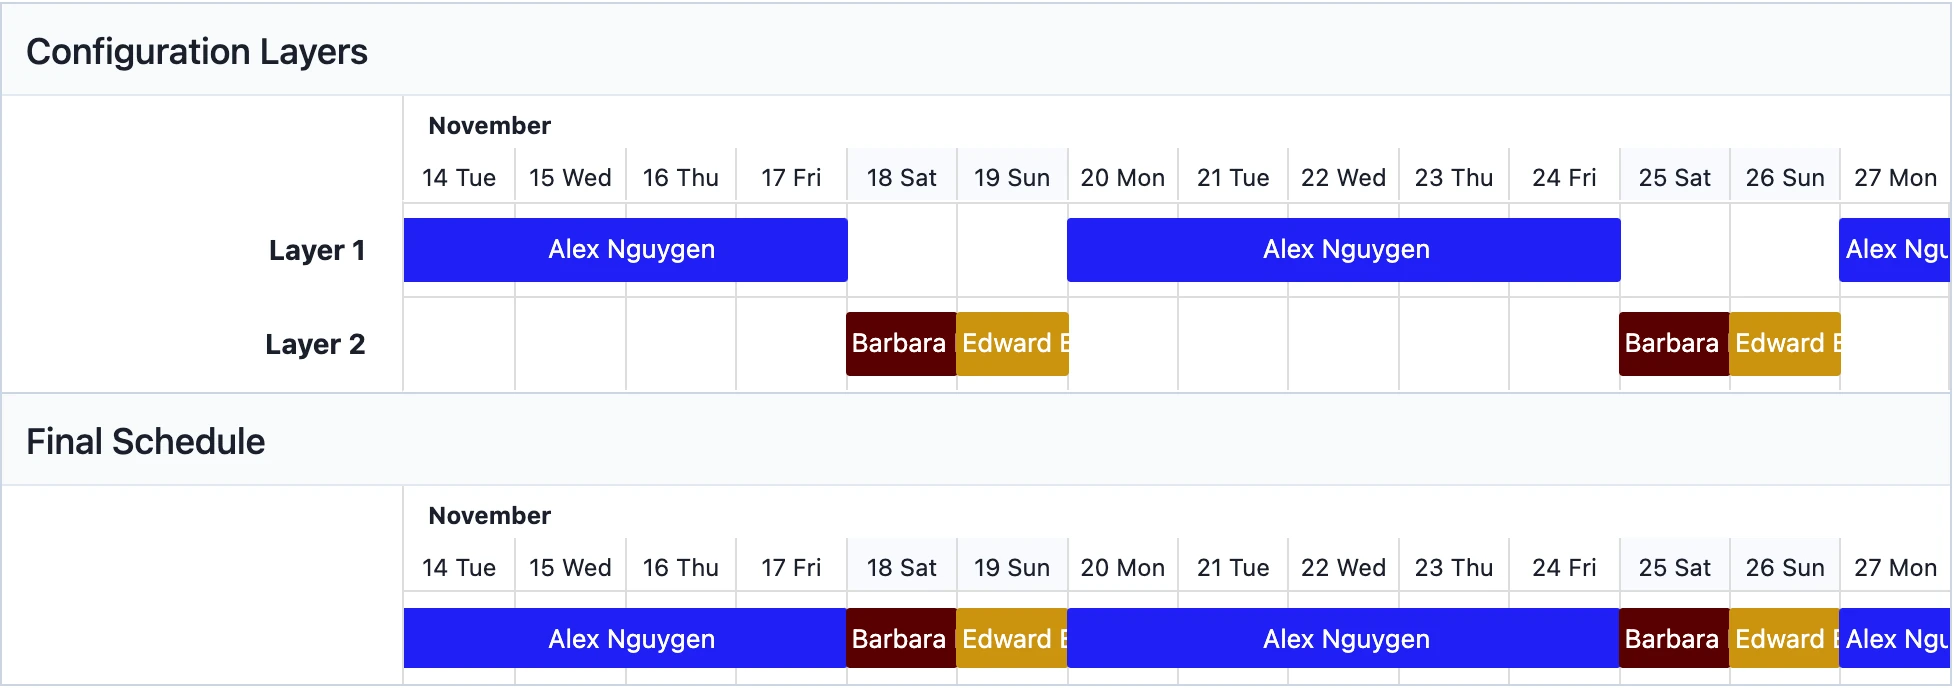 *Complex schedule example* #### Delete a Schedule Layer 1. To delete a schedule layer while [creating a schedule](#create-a-schedule), select **More** → **Delete Layer** in the top-right of the layer you would like to delete. **This will delete a layer immediately if the schedule has not been saved.** 2. To preserve historical accuracy, **PagerDuty does not delete schedule layers after they have been saved** to the schedule. If you would like to remove a previously-saved layer from an on-call schedule, you can set an [end-date](#end-date-a-schedule-layer). > **Layer Requirement:** You must have at least one layer in order to save the schedule. #### End-Date a Schedule Layer To preserve historical accuracy, PagerDuty does not delete schedule layers after they have been created. If you would like to remove a layer from an on-call schedule, you can set an end-date. To end-date a schedule layer: 1. Navigate to **People** → **Schedules**. 2. To the right of your desired schedule, select **Edit**. 3. To the right of the schedule layer you want to remove, select **Delete Layer**. 4. In the **Schedule Layer Removal** modal, enter a **date and time** to remove the layer and click **Remove Layer**. - To remove the layer immediately, leave the date and time as they are. 5. Click **Save Schedule**. When a schedule layer has been end-dated, it will appear until the date it was set to be removed. For example, Barbara Baxter was on Layer 2 of this schedule, and then it was end-dated for November 8th. This layer will continue to appear until November 8th and then disappear afterwards: 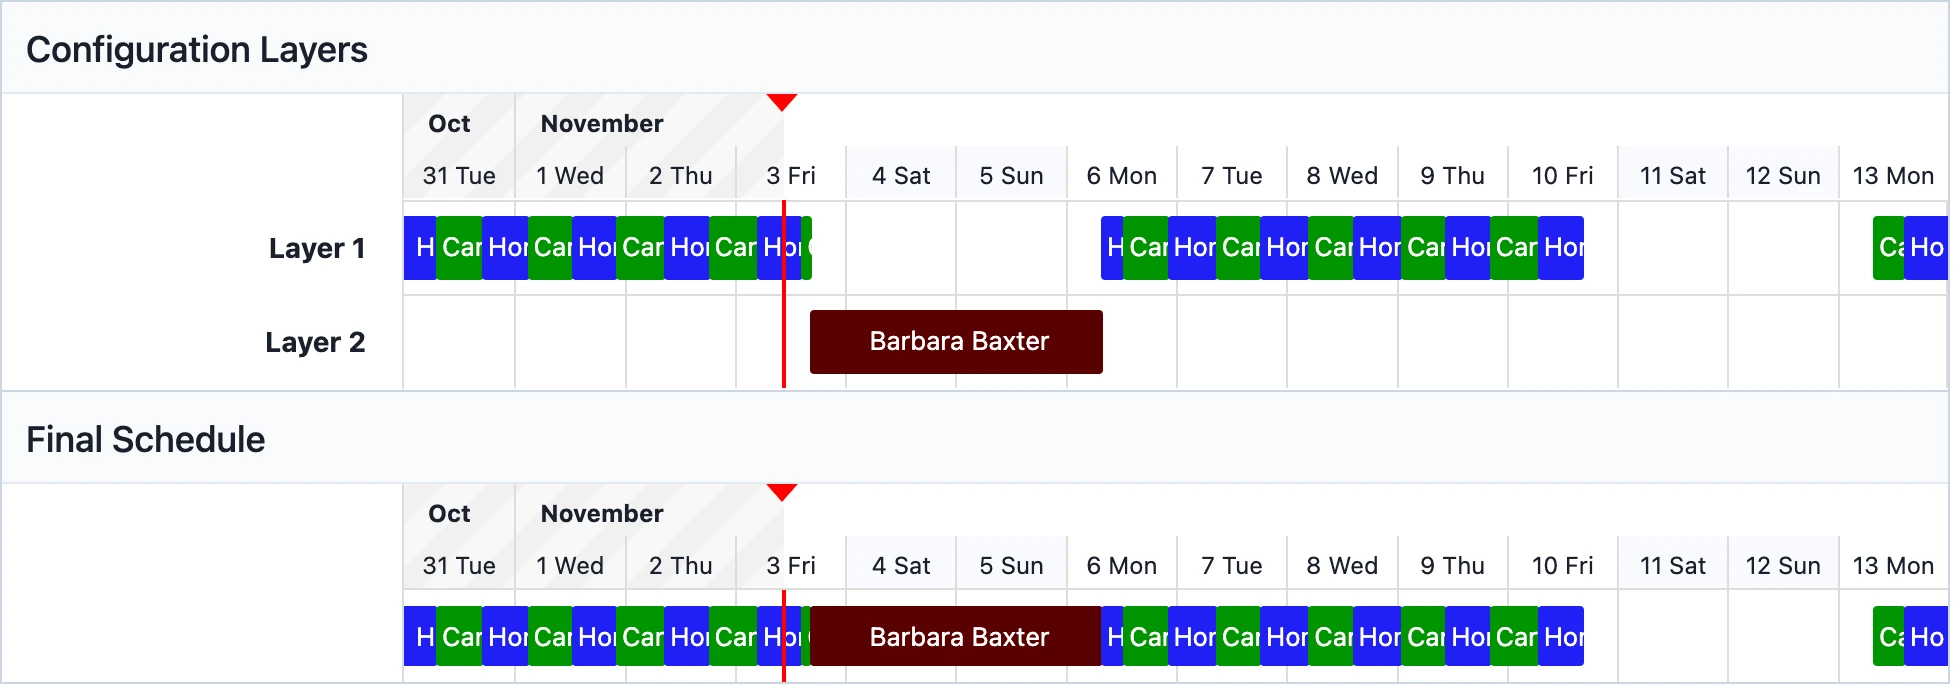 *End-dated schedule layer example* #### Edit an End-Dated Schedule Layer If a layer's end-date is still in the future, you will have the option to edit or undo the end-date. 1. Go to **People** → **Schedules** and select **Edit** to the right of your preferred schedule. 2. On the end-dated layer, select your preferred action: **Edit** or **Undo**. **Edit** allows you to [schedule a new deletion date](#end-date-a-schedule-layer), while **Undo** restores the layer and removes the end-date. 3. Click **Save Schedule** at the bottom-left of the page. ### Schedule Restrictions By default, PagerDuty distributes on-call shifts over a 24-hour period. You may wish to limit the times and days that users are on call. PagerDuty offers two methods depending on how much fine-tuning you need: - [Restrict on-call duty to specific times of the day](#restrict-on-call-duty-to-specific-times-of-the-day): Creates uniform shifts for every day of the week. This option does not allow you to modify individual days. For example, if you select a shift from 17:00–09:00, every day of the week will have that shift by default. - [Restrict on-call duty to specific times of the week](#restrict-on-call-duty-to-specific-times-of-the-week): Allows you to set different shifts for every day of the week. For example, you can set Monday to have a shift from 17:00–09:00 and Tuesday to have a shift from 13:00–20:00. > **Schedule Coverage Gaps:** Restricting hours creates coverage gaps in a schedule when no one is on call. This may be the desired behavior, but there are some items to keep in mind. > > In relation to an escalation policy, if the schedule is on the first level and no one is on call, the incident will immediately escalate to the next escalation level. If no one is on call on the entire escalation policy, **an incident will not be created**. > > If you try to create a new incident in the web app on a service where no one is on call, you will get an error message that the **Incident cannot be assigned**. Similarly, any trigger events sent to an integration where no one is on call **will not trigger an incident**. > > You can also fill coverage gaps with other layers, as in [follow-the-sun](/incident-management/schedules/schedule-examples#example-8-follow-the-sun-schedule) or [weekend/weekday](/incident-management/schedules/schedule-examples#example-10-weekendweekday-schedule) schedules. #### Restrict On-Call Duty to Specific Times of the Day This option lets you restrict a schedule so that users are on call every day, but only for specific hours. 1. Go to **People** → **Schedules**. 2. Select a schedule and click **Edit this Schedule**. 3. Select the **Rotation type** from the dropdown. 4. Set the **Handoff time** to the beginning of the shift via the time picker. 5. Under **Restrict on-call shifts to specific times**, click **Add Restrictions**. 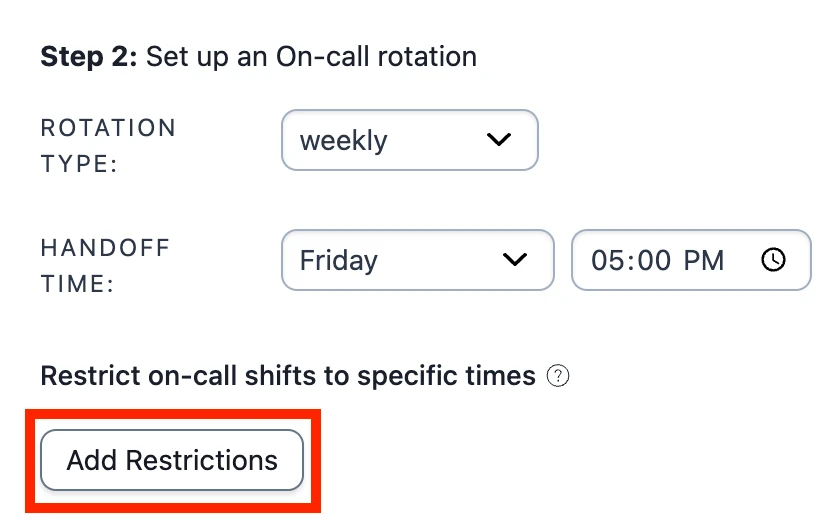 *Add schedule restrictions* 6. In the modal window, select **Restrict on-call duty to specific times-of-the-day** and enter **from** and **to** values, or click :clock4: to use the time picker to select appropriate times. 7. Click **Apply**. 8. Click **Save Changes**. **Example:** If you want users on this schedule to only be on call from 5:00 PM to 9:00 AM after business hours, select the following: 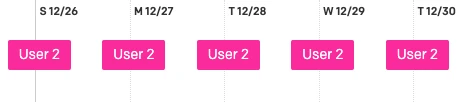 *Restricted to specific times of the day* #### Restrict On-Call Duty to Specific Times of the Week For more fine-grained control, you can create individual restrictions for each day of the week. 1. Go to **People** → **Schedules**. 2. Select a schedule and click **Edit this Schedule**. 3. Select the checkbox **Restrict on-call shifts to specific times**. 4. Under **Restrict on-call shifts to specific times**, click **Add Restrictions**. 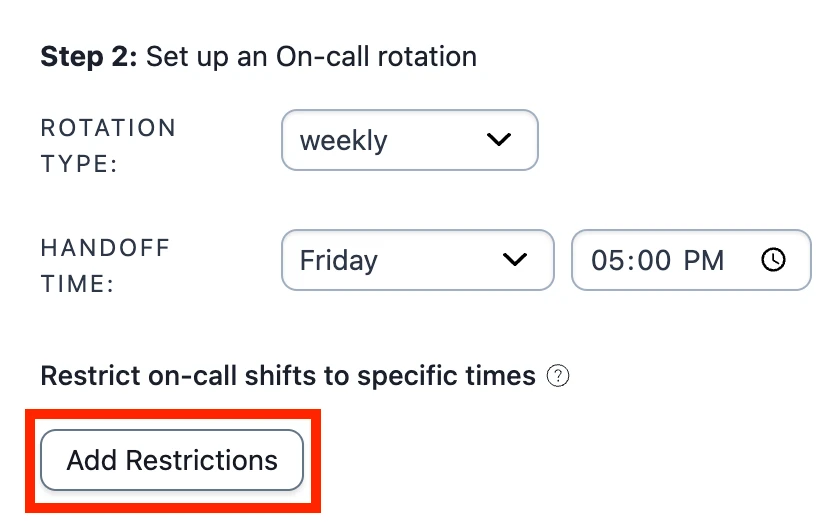 *Add schedule restrictions* 5. Use the dropdown and time picker to specify the **days** and **times** users should be on call. 6. Click **Apply**. 7. Click **Save Changes**. **Example:** If you want after-hours coverage from 17:00 to 09:00 on weekdays, with continuous coverage over the weekend, input the following (the last day/time selections cover the weekend from Friday to Monday):  *Restricted to specific times and days of the week* ### Assign a Schedule to a Team via Escalation Policy Schedules can be associated with [Teams](/account-admin/teams) via escalation policies. To assign a Team to your schedule, [add your schedule to an escalation policy](/incident-management/schedules/escalation-policies-and-schedules#connect-a-schedule-to-a-service-via-escalation-policy) and then [add that escalation policy to your Team](/account-admin/teams#create-a-team). You also have the option to associate a schedule with a Team when you _create_ the schedule, but not while editing it. This accommodates the following use case: With [Advanced Permissions](/account-admin/advanced-permissions), some users are only allowed to edit their Team's objects, such as schedules, services, and escalation policies. If one of these users wants to create a new schedule and put it inside their Team's escalation policy, they can only do so if that schedule is assigned to their team. ## Schedules List The schedules list provides an overview of every schedule, where you can see at a glance who is currently on call, what escalation policy the schedule uses, and upcoming shifts. You can filter all schedules by date range, Teams, and users, and easily search and compare schedules. The schedules list can be found in the web app under **People** → **Schedules**. ### Parameters #### Date To filter all schedules in the list by date, use the following options: - Click the **Time Period** dropdown to select one of the following: **1 Day**, **4 Days**, **1 Week**, **2 Weeks**, or **30 Days**. - Click to move back an iteration of the selected time period, or click to move forward. For example, if you selected **1 Week**, clicking moves you forward by one week. - Click **Today** to view all schedules from today's date. #### Teams To filter by Team, click the **Teams** dropdown and select from **All Teams**, **My Teams**, or search and select a specific Team. #### User To filter by user, click the **User** dropdown and search for your preferred user. To remove the user filter, click to the right of the user's name. ### Search To search for a specific schedule, enter the schedule's name in the **Search** field and press Enter. ### View Details - **Schedules**: Click the schedule's name to view its full details. - **On Call Now**: The user currently on call will be listed with a **Now** pill to the right of their name. Click the user's name to view their details. - **Shifts**: Click a shift to view its full details or to [create an override](/incident-management/schedules/edit-schedules#override-a-specific-schedule-shift). - **Escalation Policies**: If the schedule has only one escalation policy, click the escalation policy name to view its details. If the schedule has more than one, click **\[x] Escalation Policies** and select the escalation policy you would like to view from the modal. - **Teams**: If a schedule has only one Team, click the Team name to view its details. If the schedule has more than one, click **\[x] Teams** and select the Team you would like to view from the modal. ### Actions You may also take the following actions from this page: - [Create a New Schedule](#create-a-schedule) - [Export a Schedule](/incident-management/schedules/schedules-in-apps) - Click to select from the following options: - [Edit a Schedule](/incident-management/schedules/edit-schedules) - [Duplicate a Schedule](/incident-management/schedules/edit-schedules#duplicate-a-schedule) - [Schedule an Override](/incident-management/schedules/edit-schedules#create-overrides) - [Delete a Schedule](#delete-a-schedule)
--- URL: https://docs.pagerduty.com/incident-management/schedules/schedule-examples # Schedule Examples Common use cases for different schedule types ## Schedule Examples PagerDuty schedules handle complex on-call scenarios through layered configurations, time restrictions, and custom rotations. The examples below demonstrate various scheduling patterns — from basic schedules, irregular shifts, and split rotations to follow-the-sun coverage and primary/secondary backup systems. - [Example 1: Basic 9 to 5 Schedules](#example-1-basic-9-to-5-schedules) - [Example 2: Complex Irregular Schedules](#example-2-complex-irregular-schedules) - [Example 3: Complex Schedule for 2 Users on a 2-Day Rotation with Separate Weekends](#example-3-complex-schedule-for-2-users-on-a-2-day-rotation-with-separate-weekends) - [Example 4: Complex Split Shift Rotation](#example-4-complex-split-shift-rotation) - [Example 5: Complex Schedule with Restrictions](#example-5-complex-schedule-with-restrictions) - [Example 6: Create Primary and Secondary On-Call Schedules](#example-6-create-primary-and-secondary-on-call-schedules) - [Example 7: Inverse Schedules](#example-7-inverse-schedules) - [Example 8: Follow-the-Sun Schedule](#example-8-follow-the-sun-schedule) - [Example 9: Schedule Users Every Other Week](#example-9-schedule-users-every-other-week) - [Example 10: Weekend/Weekday Schedule](#example-10-weekendweekday-schedule) ## Example 1: Basic 9 to 5 Schedules This schedule is for teams that follow a standard weekday 9 AM–5 PM rotation, with each team member taking the daily shift in turn. It is ideal for consistent weekday coverage without overlapping on-call periods or complex week-to-week variations. > **Basic Schedule:** This example illustrates the most straightforward on-call setup. It provides standard weekday coverage from 9 AM to 5 PM and does not include evening or weekend shifts, which should be factored in when planning full-time coverage. ### Ex. 1 Schedule Requirements This schedule rotates daily between team members, providing 9 AM–5 PM coverage each weekday. - Each user is on call for one full day at a time. - Shifts rotate automatically every morning at 9:00 AM. - The daily rotation ensures equal coverage and predictable scheduling. - There is no evening or weekend coverage with this schedule. ### Ex. 1 Schedule Configuration Layer 1 includes the team members in a daily rotation. - **Rotation type**: Daily - **Handoff time**: 9:00 AM - **Restricted hours**: 9:00 AM–5:00 PM 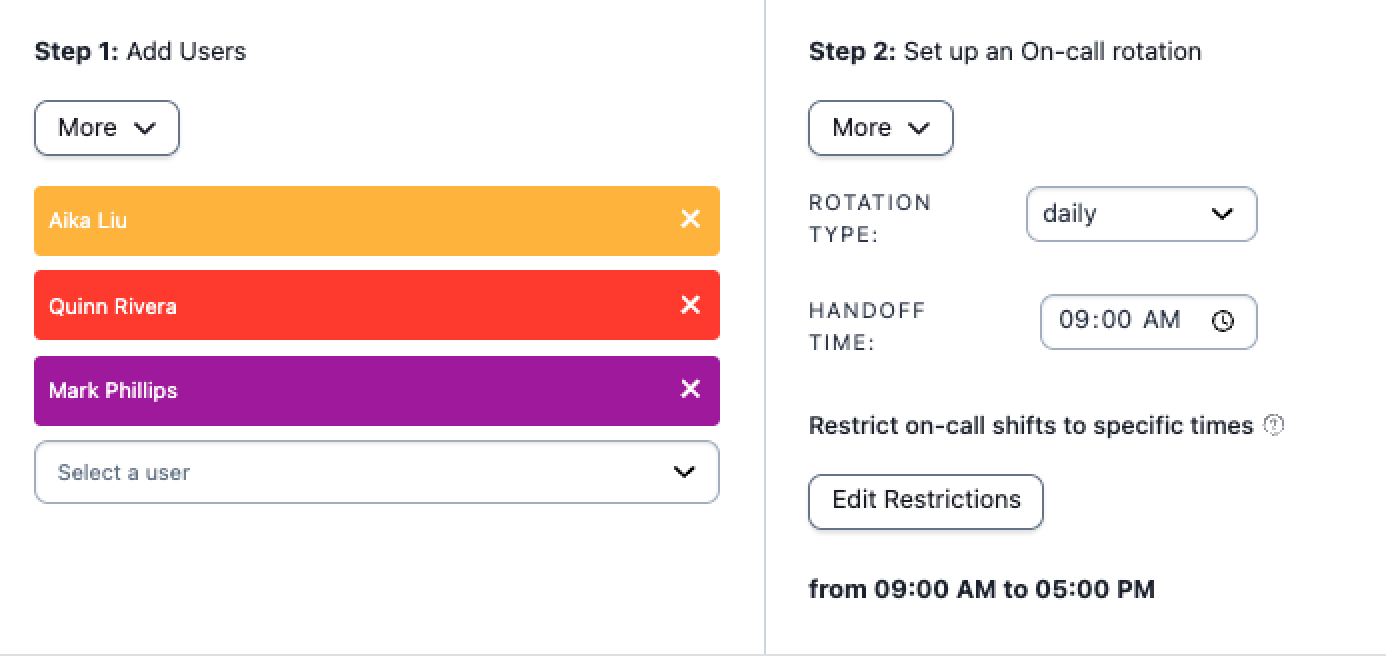 *Example 1 configuration* ### Ex. 1 Final Schedule The final schedule automatically rotates daily coverage between team members. One person is scheduled from 9:00 AM to 5:00 PM, ensuring weekday coverage with predictable handoff times. 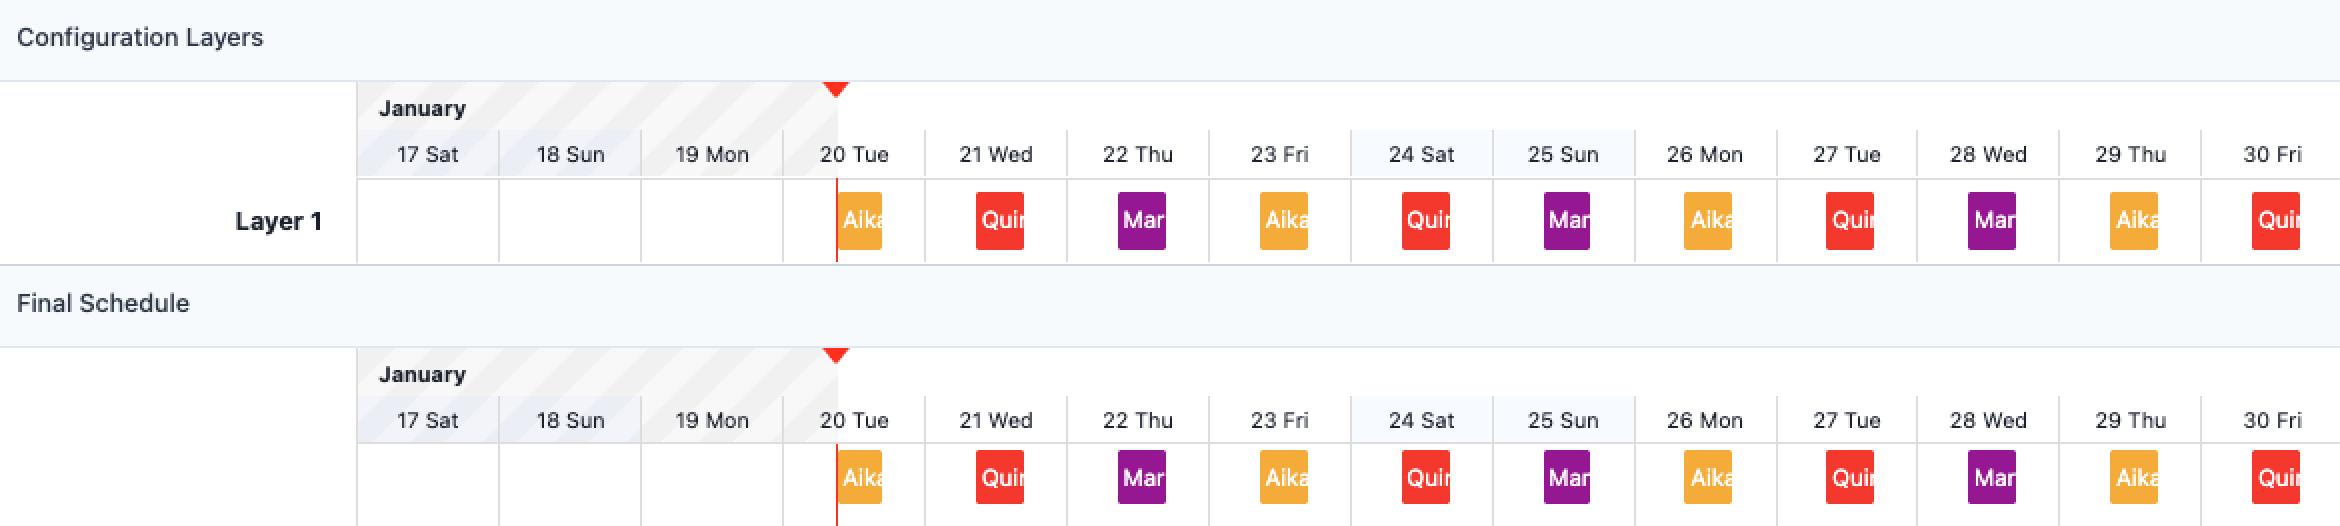 *Example 1 final schedule* ## Example 2: Complex Irregular Schedules This schedule is for teams that rotate 12-hour shifts, on call for one week and then off call for a few. ### Ex. 2 Schedule Requirements This schedule has six users that alternate shifts every other week. One week, they work Sunday-Tuesday-Thursday-Saturday (STTS). The next week, they work Monday-Wednesday-Friday (MWF). There are two six-week rotations in total — one where everyone rotates through the MWF schedule, and one staggered by three weeks where they work through STTS. ### Ex. 2 Schedule Configuration Layer 1 rotates weekly with a handoff time at the beginning of the first time restriction, Sunday at 12:00 AM. It covers the STTS days by restricting on-call duty to **specific times-of-the-week**. 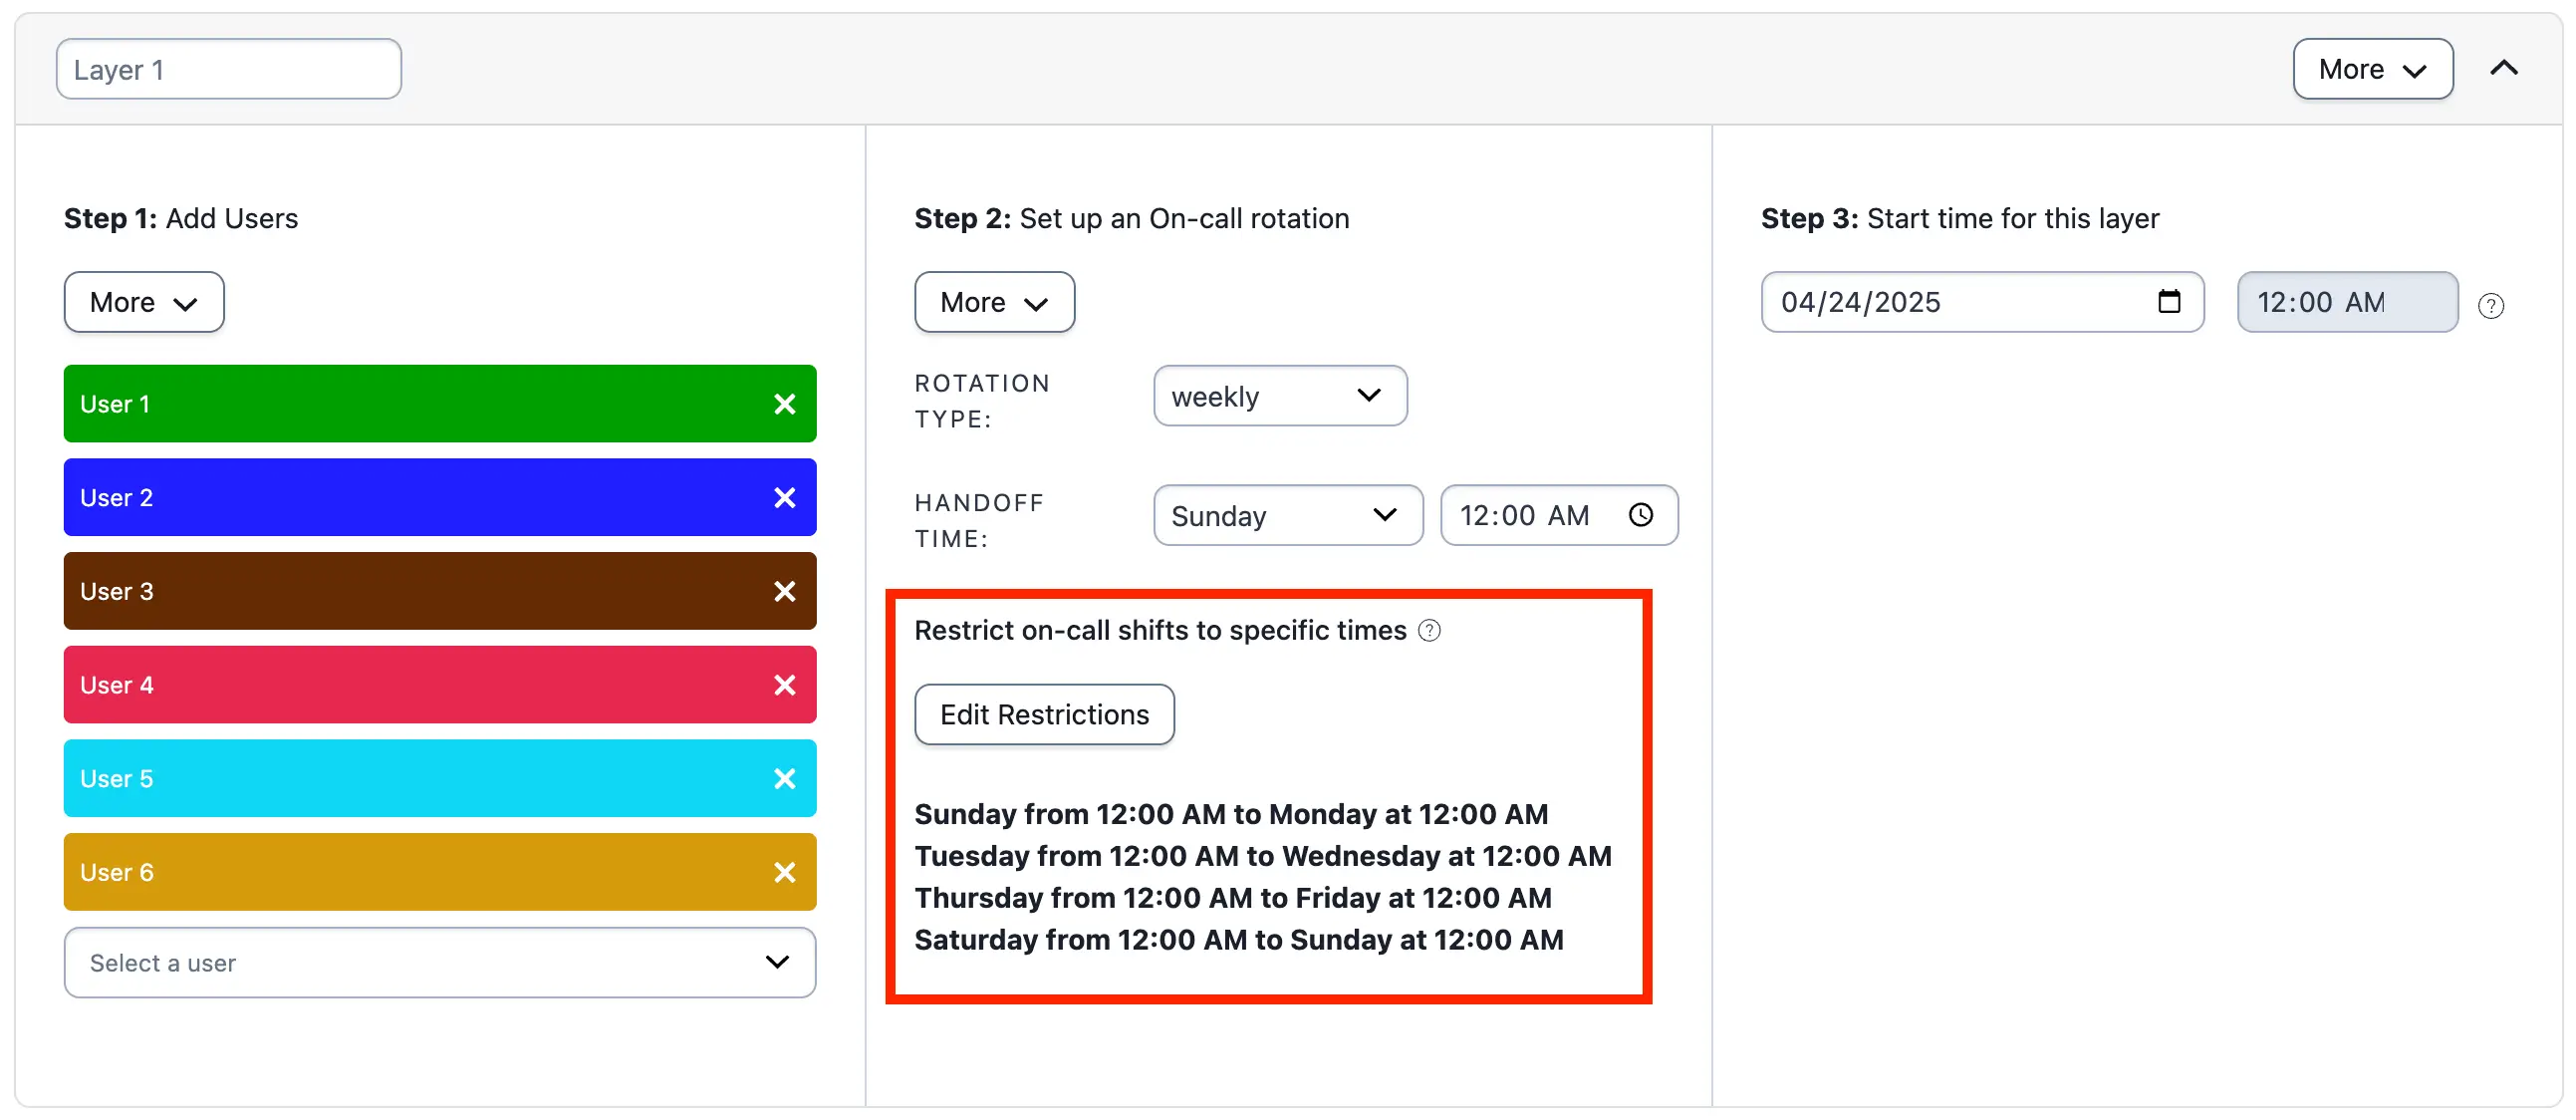 *Example 2, layer 1* Layer 2 rotates weekly with a handoff time at the beginning of its first time restriction, Monday at 12:00 AM. It covers MWF by restricting on-call duty to **specific times-of-the-week**. 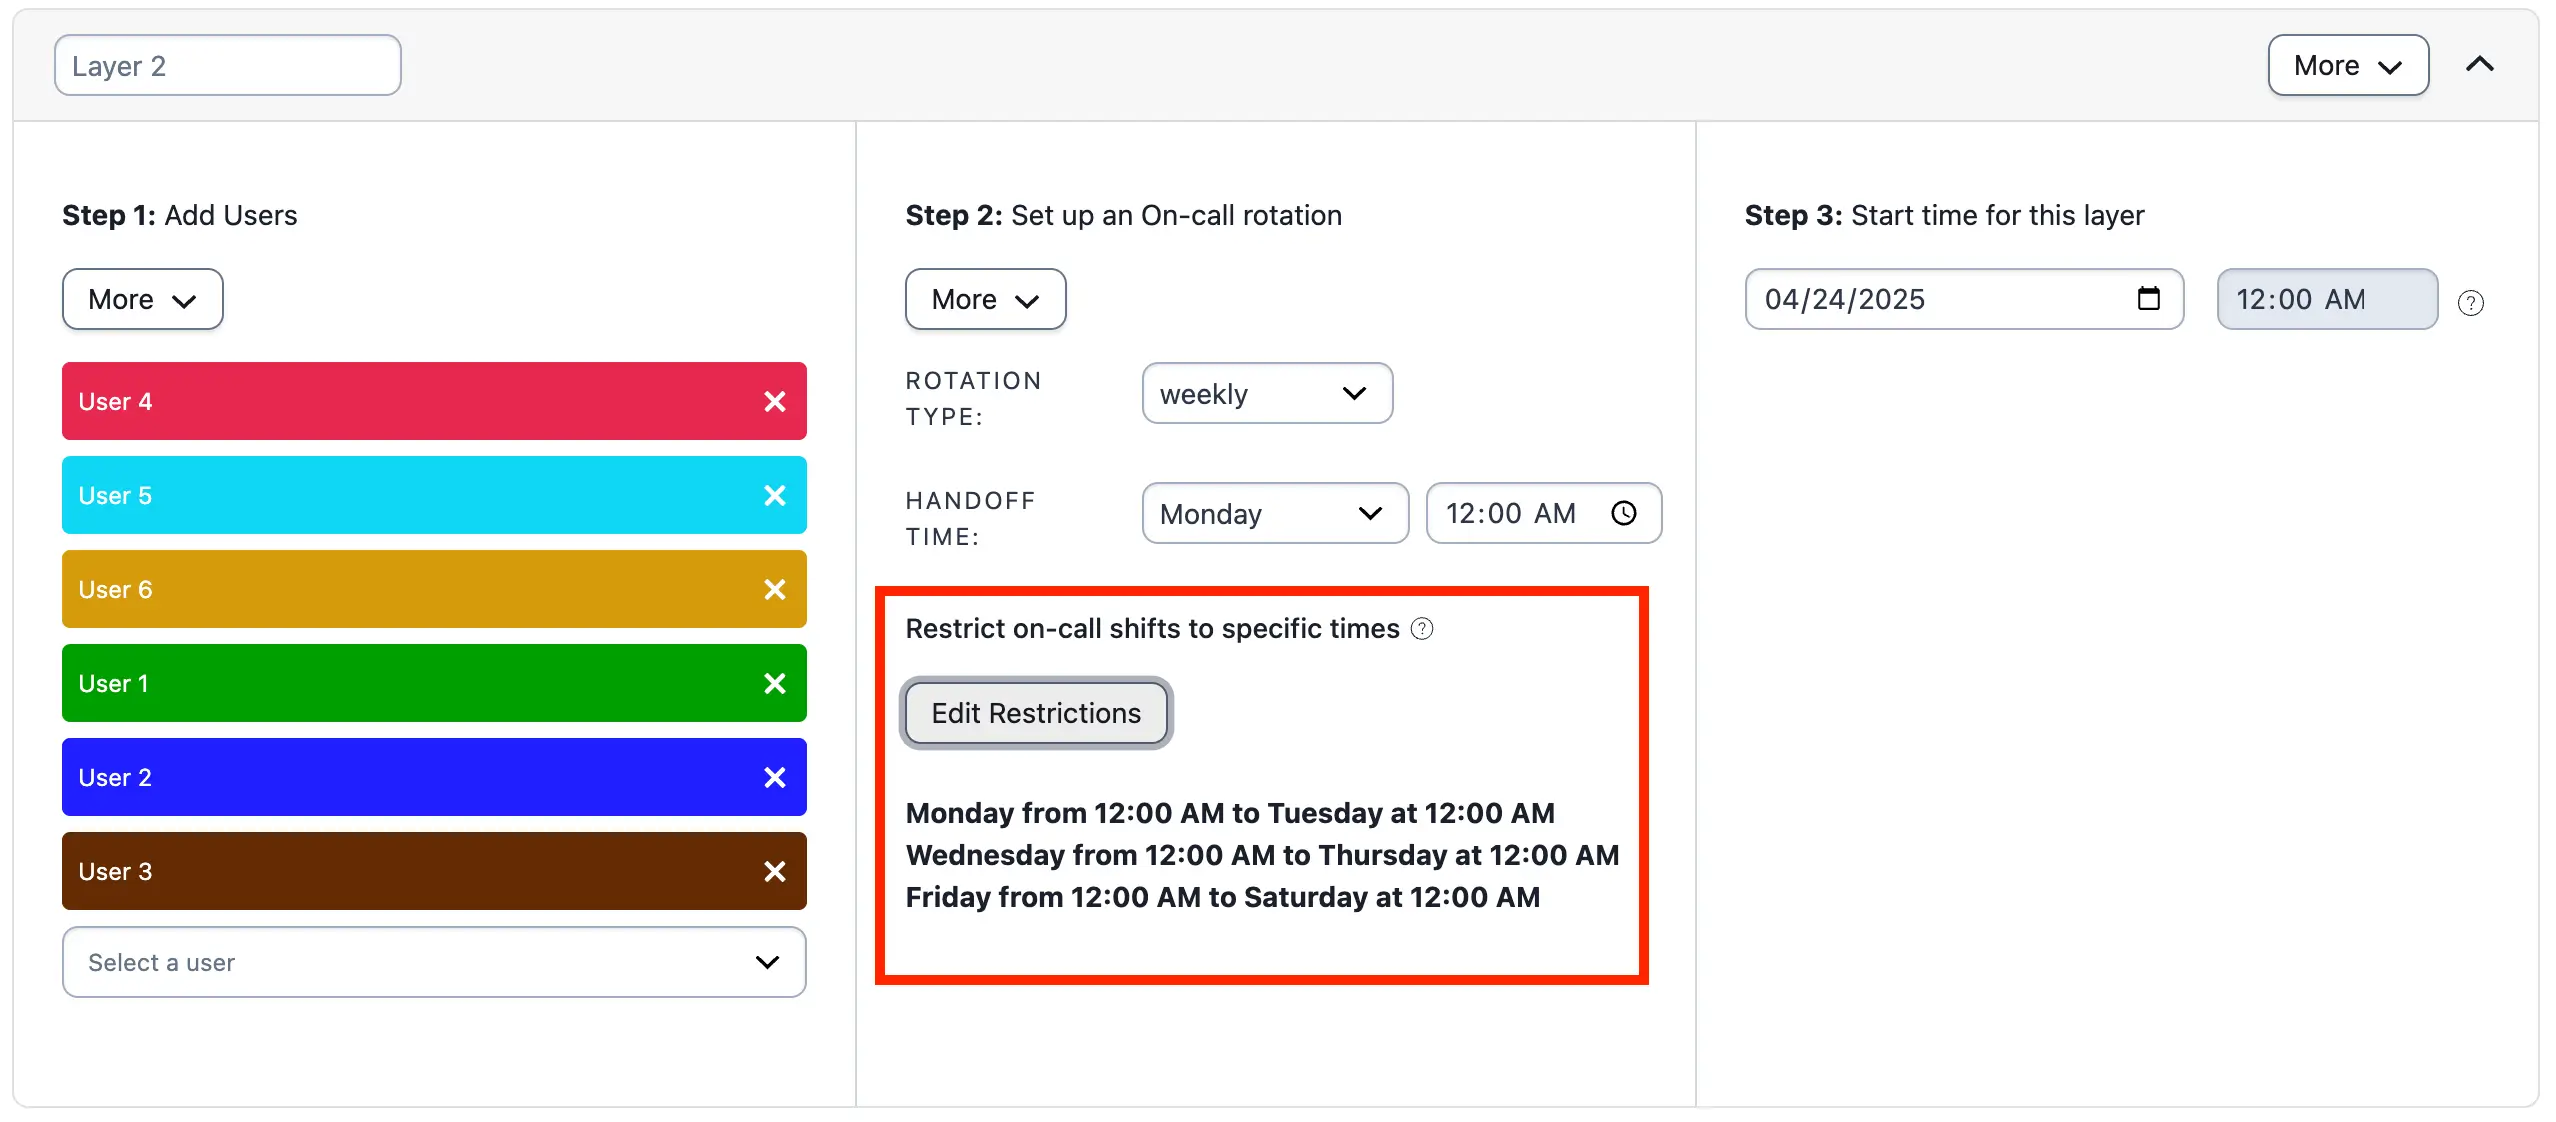 *Example 2, layer 2* ### Ex. 2 Final Schedule 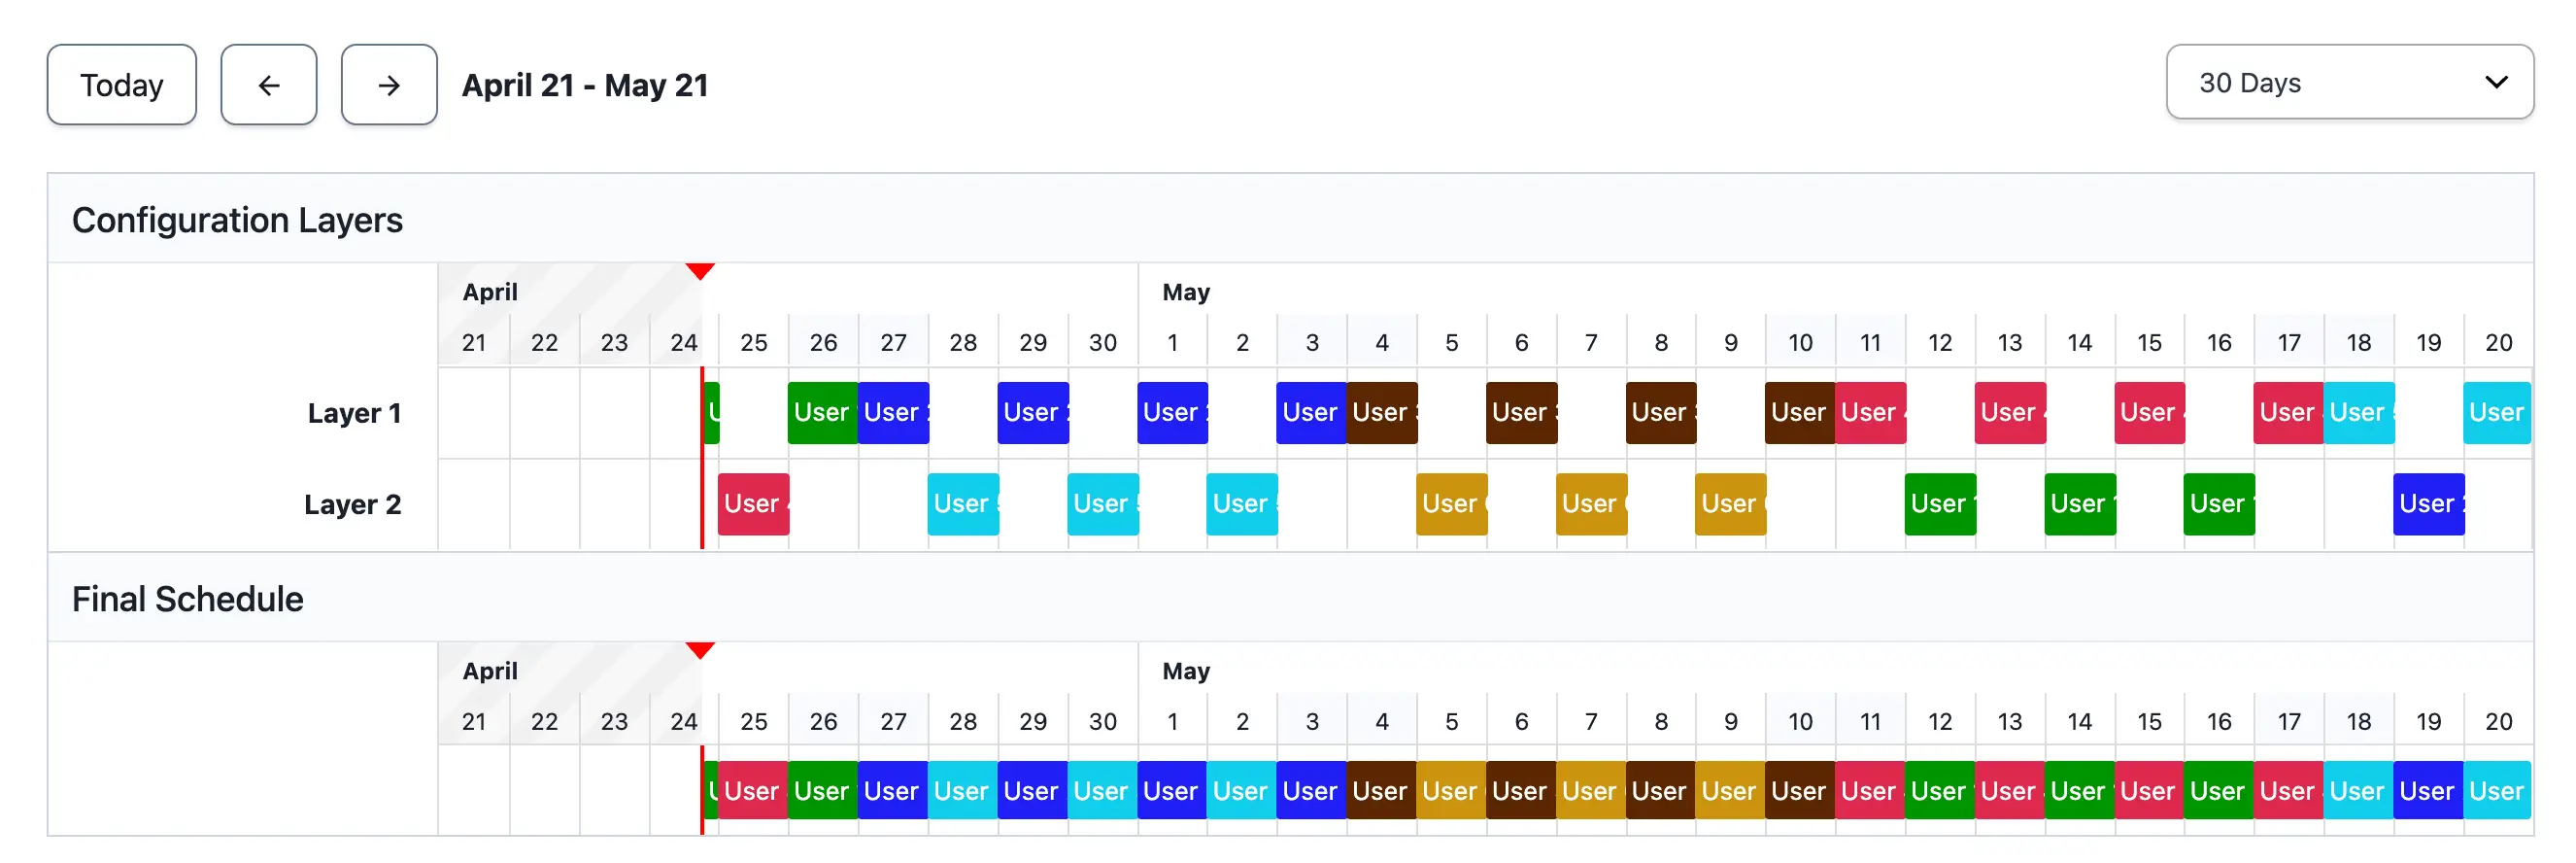 *Example 2 final schedule* ## Example 3: Complex Schedule for 2 Users on a 2-Day Rotation with Separate Weekends This example shows a complex schedule for two users on a two-day rotation. They are on call in the evenings from 5:00 PM to 8:00 AM. On Saturday and Sunday, responders are on call for 24 hours from 8:00 AM until 8:00 AM the next day. ### Ex. 3 Schedule Requirements During the weekdays, User 1 and User 2 are on call from 5:00 PM to 8:00 AM. They take turns covering the weekends from Friday at 5:00 PM to Monday at 8:00 AM. Shifts are: - User 1 is on call Tuesday and Wednesday from 5:00 PM to 8:00 AM. - User 2 is on call Thursday and Friday from 5:00 PM to 8:00 AM. - User 1 is on call Saturday at 8:00 AM to Sunday at 8:00 AM. - User 2 is on call Sunday at 8:00 AM to Monday 8:00 AM, and Monday 5:00 PM to Tuesday 8:00 AM. ### Ex. 3 Configuration Create four layers, each with its own weekly rotation that fulfills one of the requirements listed in the previous section. The handoff time should be the day and time that the first restriction begins. The effective date of change should be the first date that a layer's restriction begins on. The date in Step 3 for each layer will therefore be different. #### Layer 1 User 1 is on call Tuesday and Wednesday from 5:00 PM to 8:00 AM. 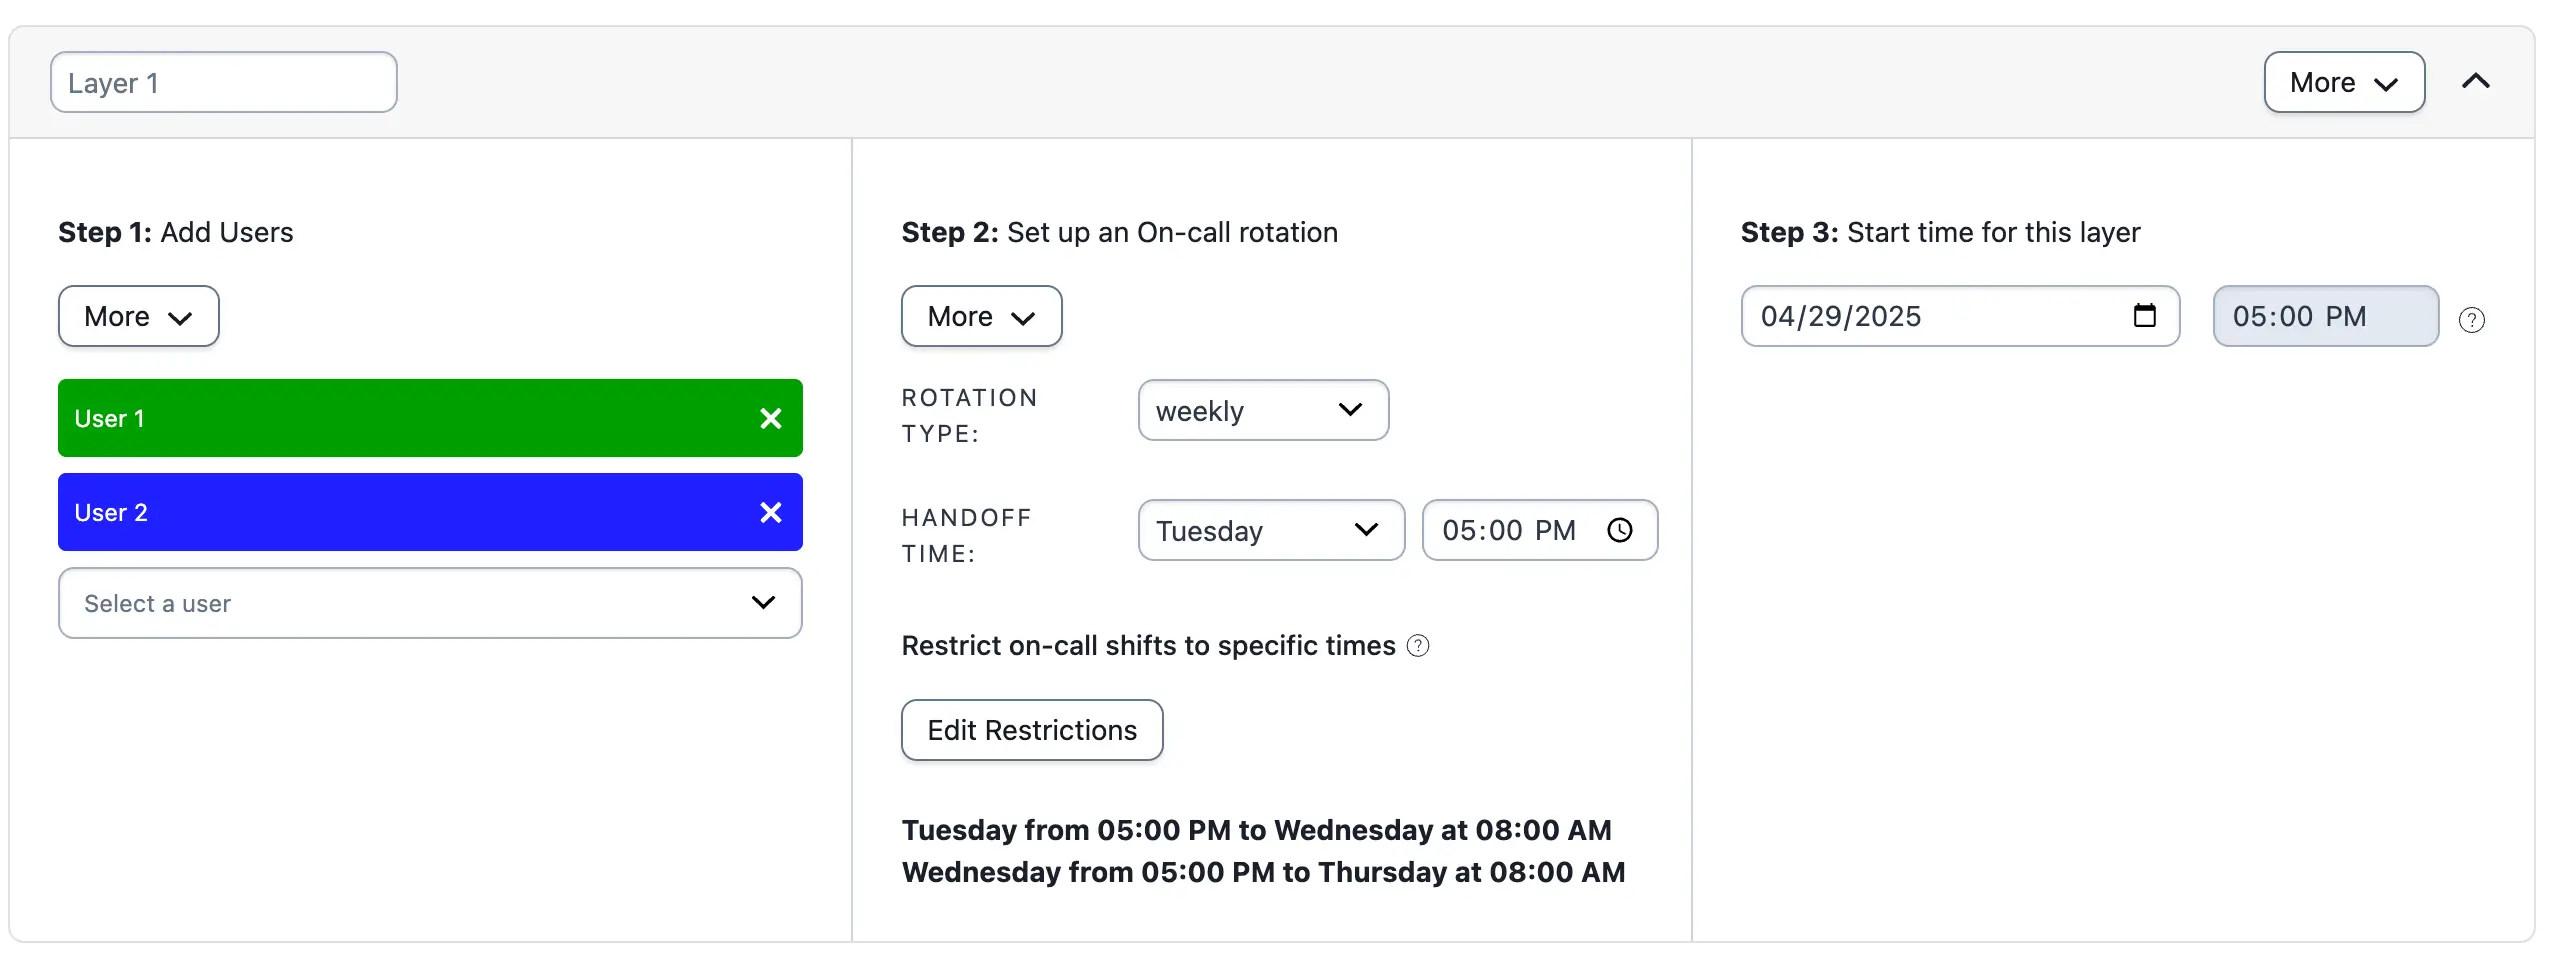 *Example 3, layer 1* #### Layer 2 User 2 is on call Thursday and Friday from 5:00 PM to 8:00 AM. Note the change in Step 3 for the Start time — the date selected is a Thursday.  *Example 3, layer 2* #### Layer 3 User 1 is on call Saturday at 8:00 AM to Sunday at 8:00 AM.  *Example 3, layer 3* #### Layer 4 User 2 is on call Sunday at 8:00 AM to Monday 8:00 AM, and Monday 5:00 PM to Tuesday 8:00 AM.  *Example 3, layer 4* ### Ex. 3 Final Schedule  *Example 3 final schedule* ## Example 4: Complex Split Shift Rotation This example shows how to create a time-restricted four-person rotation where two users split each shift. ### Ex. 4 Schedule Requirements These users are on call between 12:00 AM and 10:00 AM with a shift length of five hours. After five hours, the next user comes on call to cover the schedule until 10:00 AM. ### Ex. 4 Configuration 1. Add four users to the schedule in Step 1. 2. Under **Restrict on-call shifts to specific times**, click **Edit Restrictions**. 3. Select **Restrict on-call duty to specific times-of-the-day** and click **Add Restriction**. Restrict the schedule from 12:00 AM to 10:00 AM. 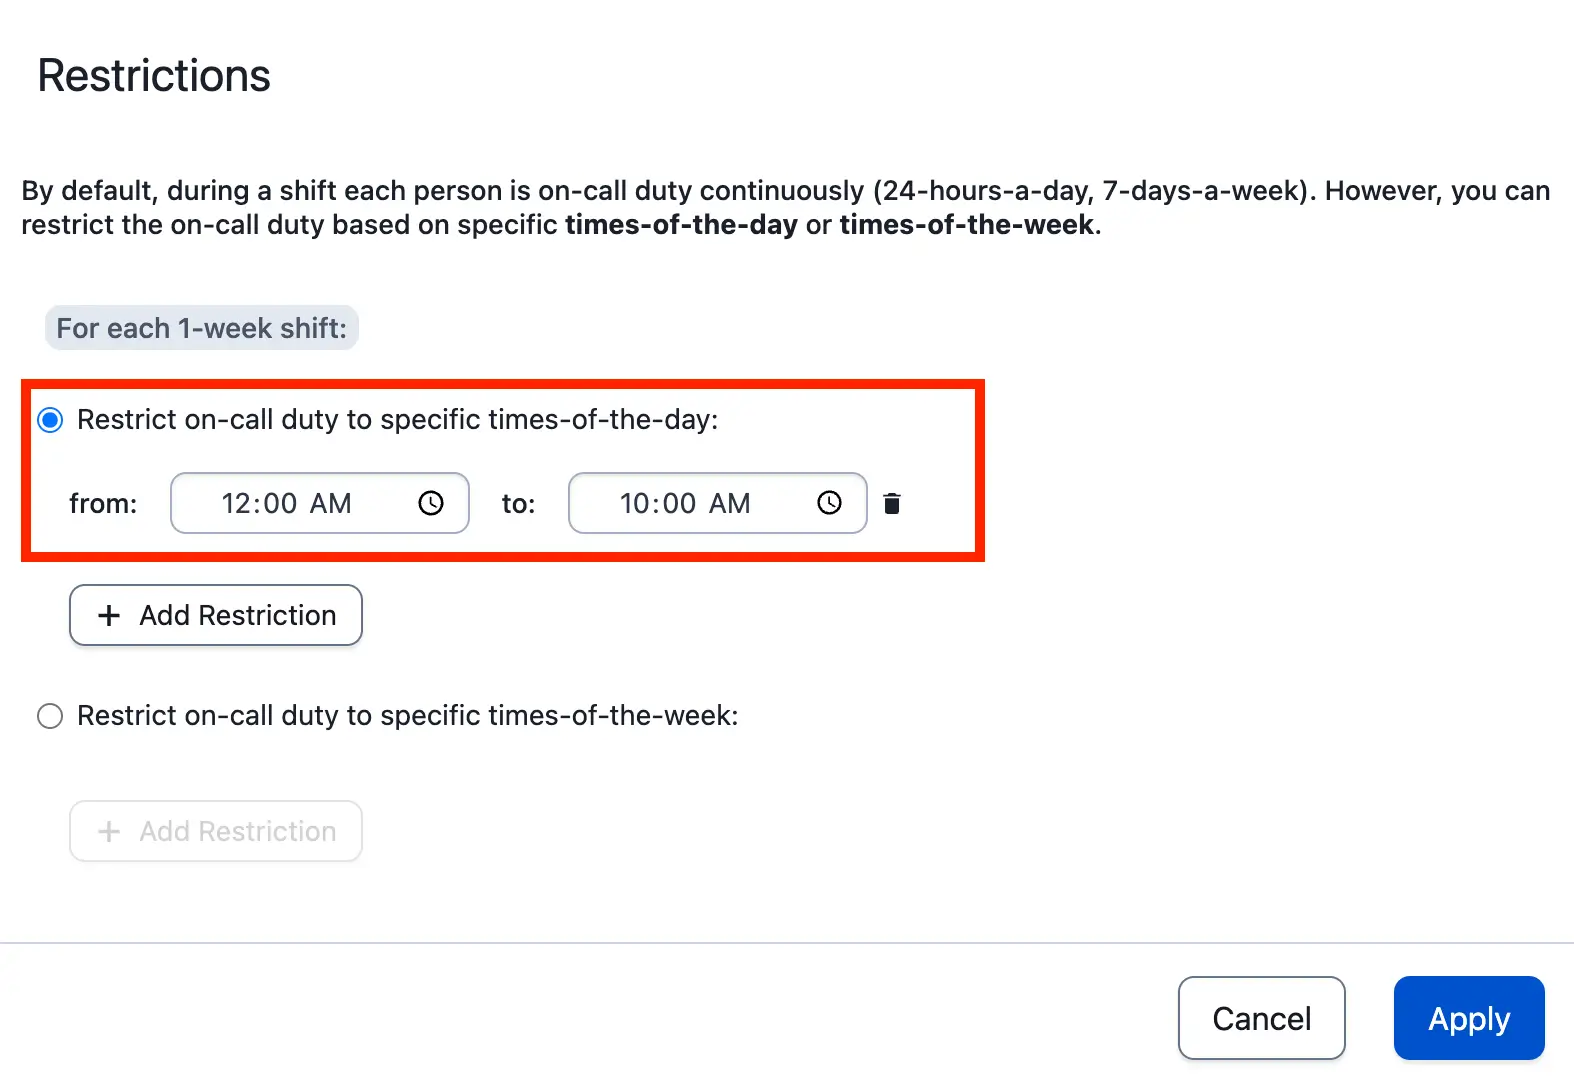 *Example 4 restrictions* 4. Create a custom rotation type with a shift length of 12 hours. Set the handoff time to halfway through the shift: 5:00 AM. - A 12-hour shift is required to ensure that shifts consistently begin at 12:00 AM and 5:00 AM. 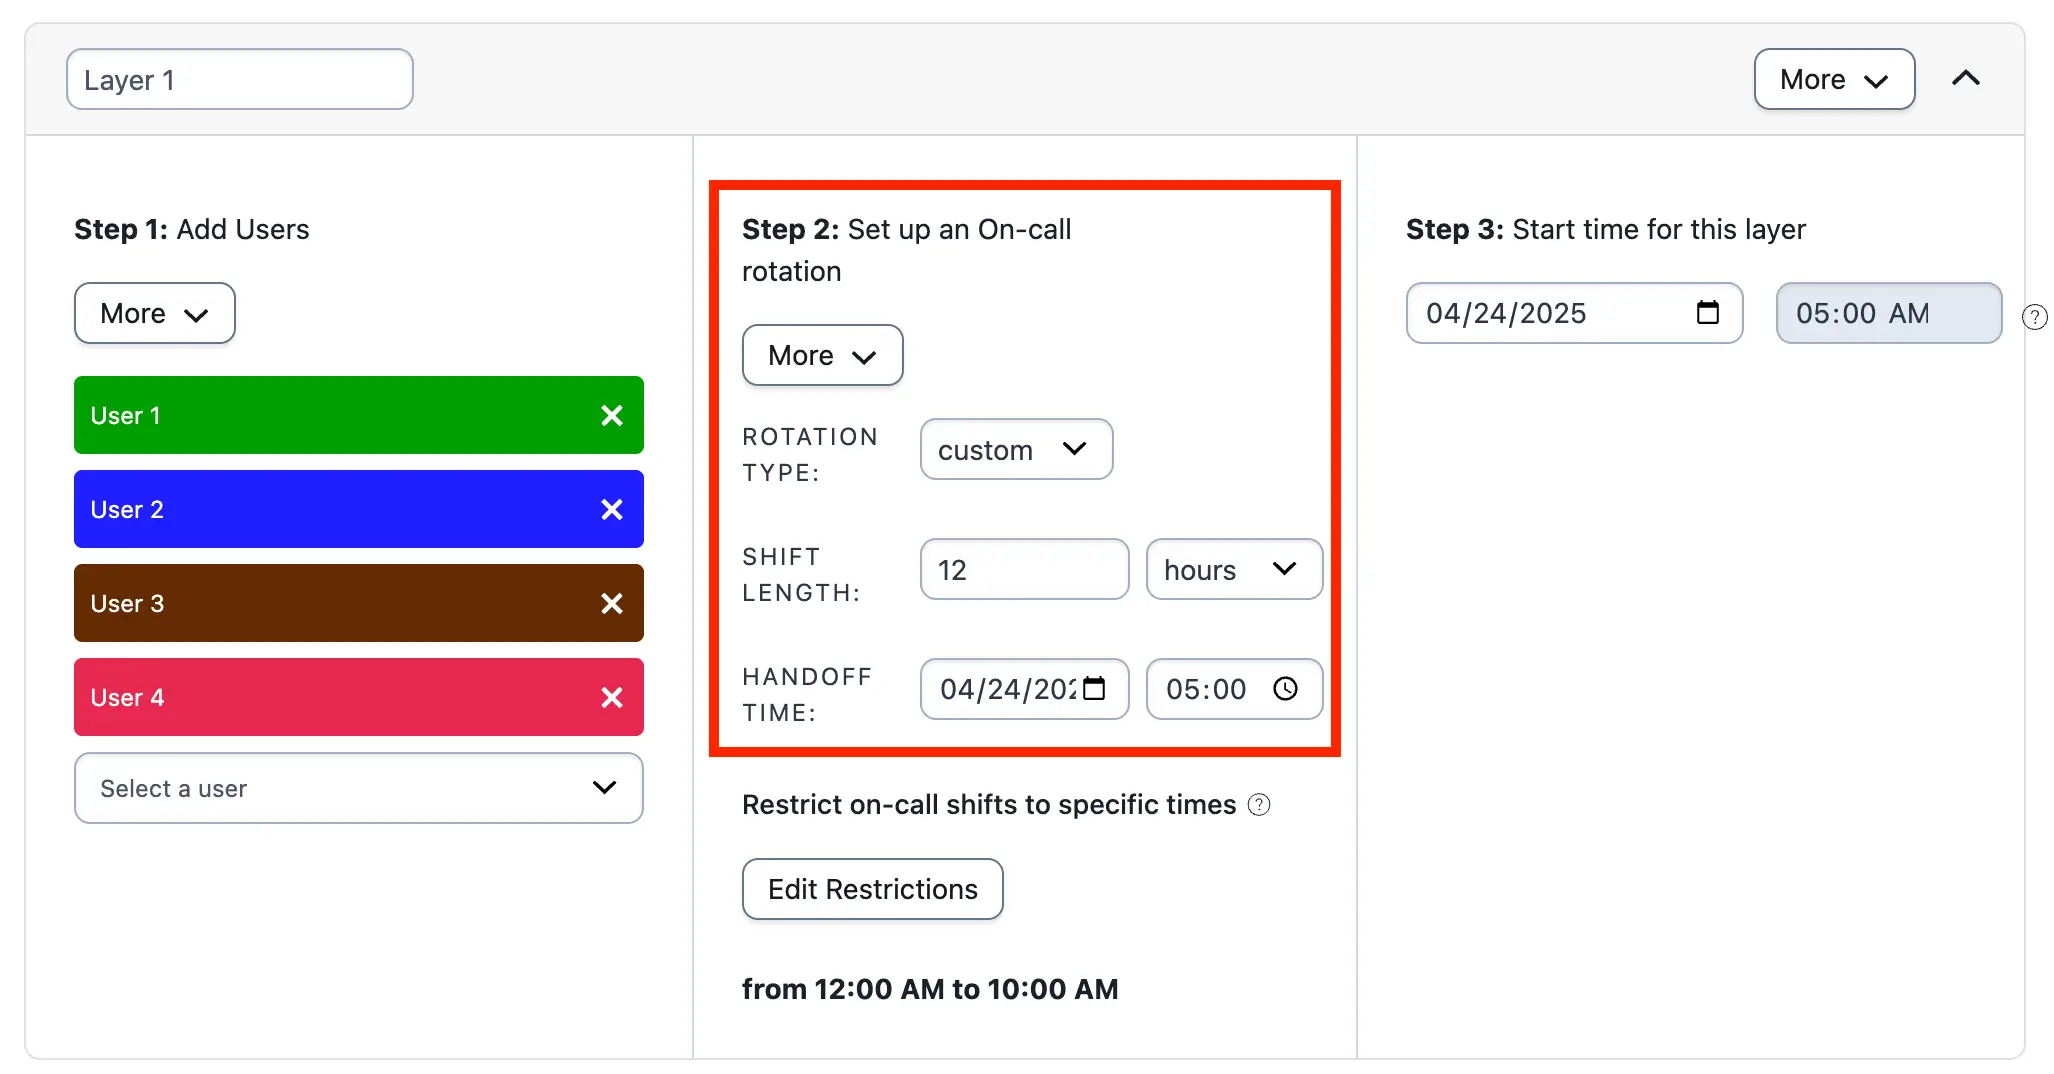 *Example 4 rotation configuration* ### Ex. 4 Final Schedule  *Example 4 final schedule* ## Example 5: Complex Schedule with Restrictions In this example, User 5 and User 6 trade off the early morning shift. User 3 takes the morning and User 4 takes the evening shift during a four-day week. User 1 and User 2 take shifts on the elongated weekend: - Monday and Wednesday: User 5 for seven hours, then User 3 for six hours, then User 4 for 11 hours. - Tuesday and Thursday: User 6 for seven hours, User 3 for six hours, User 4 for 11 hours. - Friday, Saturday, and Sunday: User 1 for 12 hours, User 2 for 12 hours.  *Example 5* User 1 and User 2 are straightforward to schedule because they have consistent shifts. Create a layer for each remaining user and restrict on-call duty to specific times of the week based on their scheduled shifts.  *Example 5, layers 1 and 2*
 *Example 5, layers 3 and 4*
 *Example 5, layer 5* The final schedule follows:  *Example 5 with all layers* You can overlap layers to simplify the schedule. Moving the layer with User 1 and User 2 to the bottom — since lower schedule layers take precedence over higher layers — lets you simplify some of the restrictions. For example, Users 3, 4, and 5 then only need to be restricted by time of day. 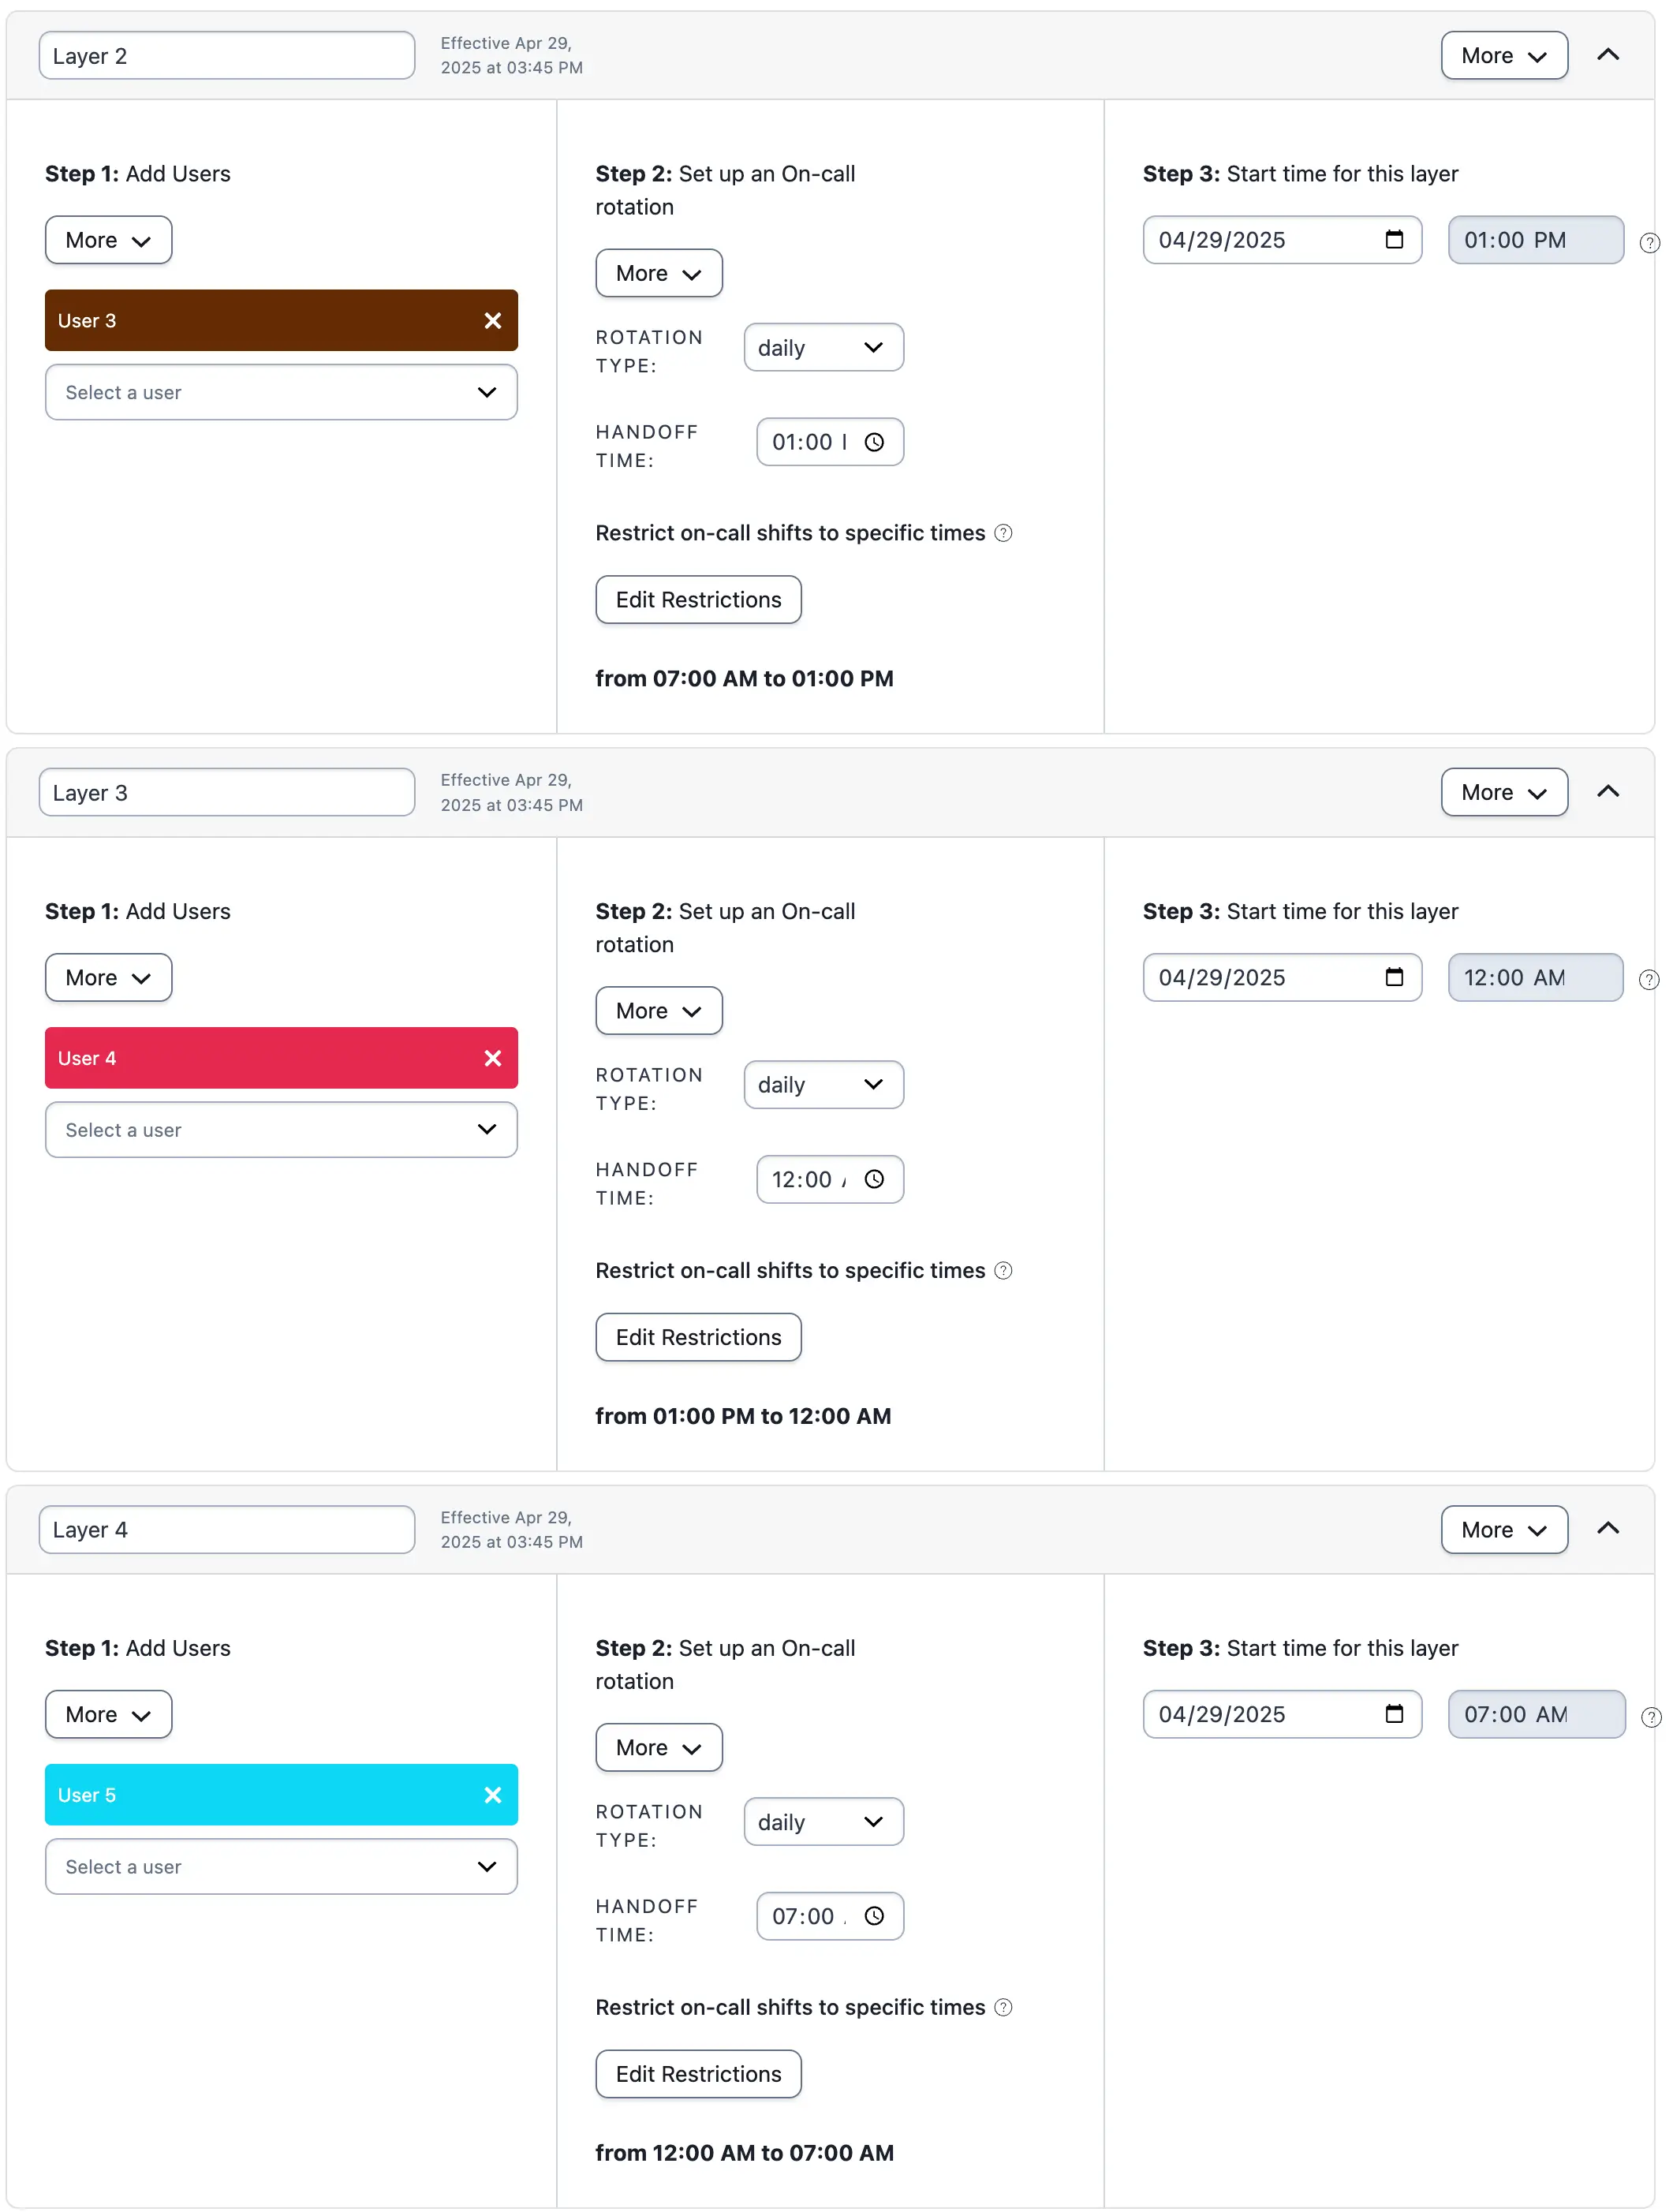 *Example 5, layers 2, 3 and 4 alternative* ### Ex. 5 Final Schedule By moving the layer with Users 1 and 2 to the bottom and keeping the restrictions for User 6 the same, these layers overwrite the higher layers. This produces the same final schedule as before, but with fewer restrictions outlined. 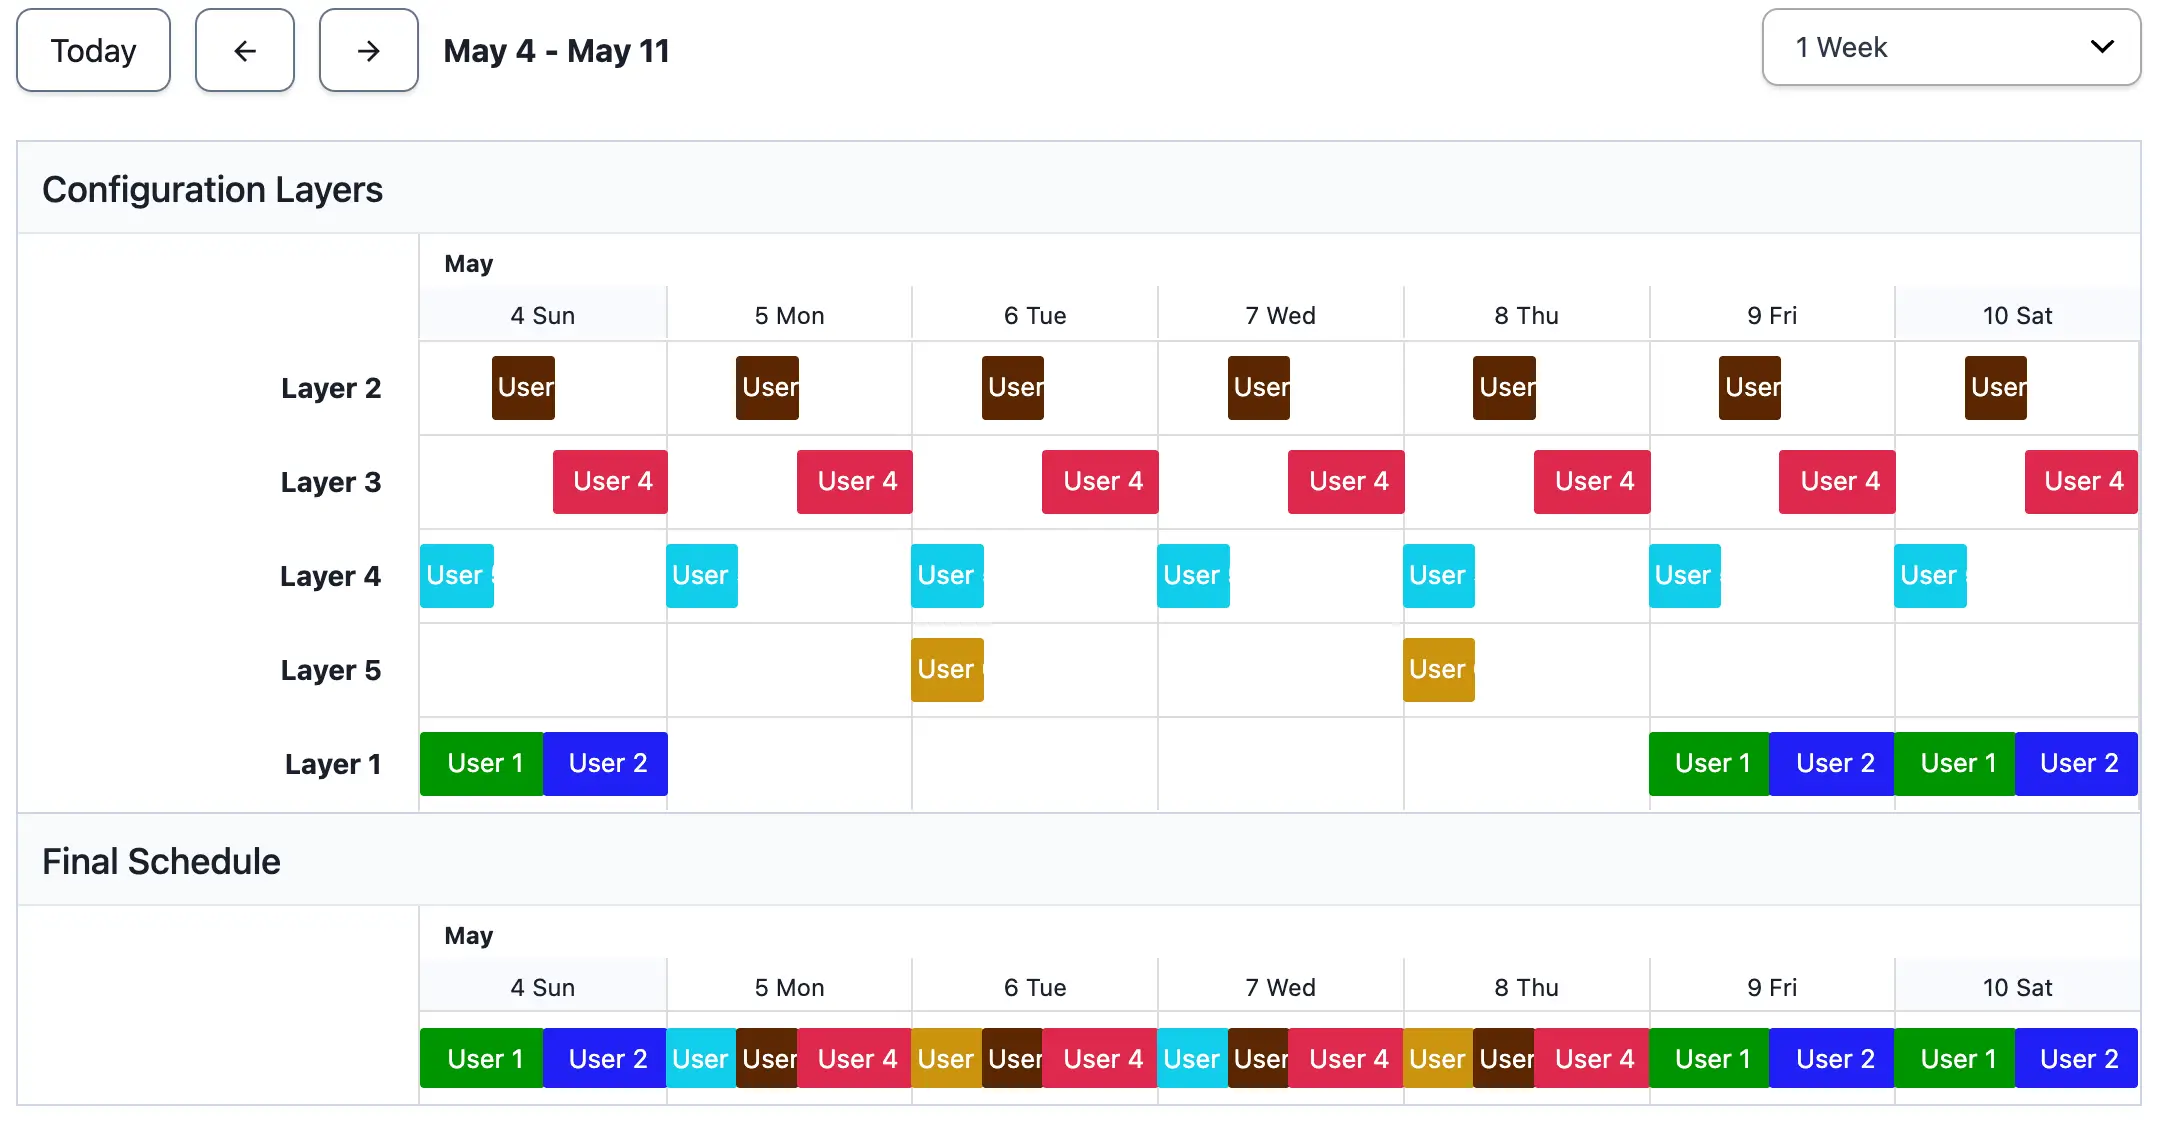 *Example 5 final schedule using overlapping layers* ## Example 6: Create Primary and Secondary On-Call Schedules Creating primary and secondary schedules is helpful when the primary responder misses a notification. This example uses a primary and secondary schedule. You may add more backup schedules to an escalation policy as needed. ### Create a Primary On-Call Schedule 1. Navigate to **People** → **Schedules** and click **New Schedule**. 2. Enter a **Schedule name**, and optionally enter a **description** and adjust the **Time zone**. 3. Configure the schedule to meet your primary on-call needs: | Field | Value | | :------------------- | :------------------------------------------------------- | | **Users** | Select users from the dropdown list. | | **Rotation type** | Select the desired rotation type from the dropdown menu. | | **Handoff Time** | Set the desired handoff time. | | **Start time** | Set the schedule start time. | | **Add Restrictions** | If necessary, add restrictions to the on-call shifts. | 4. Review the schedule and click **Save Schedule**. 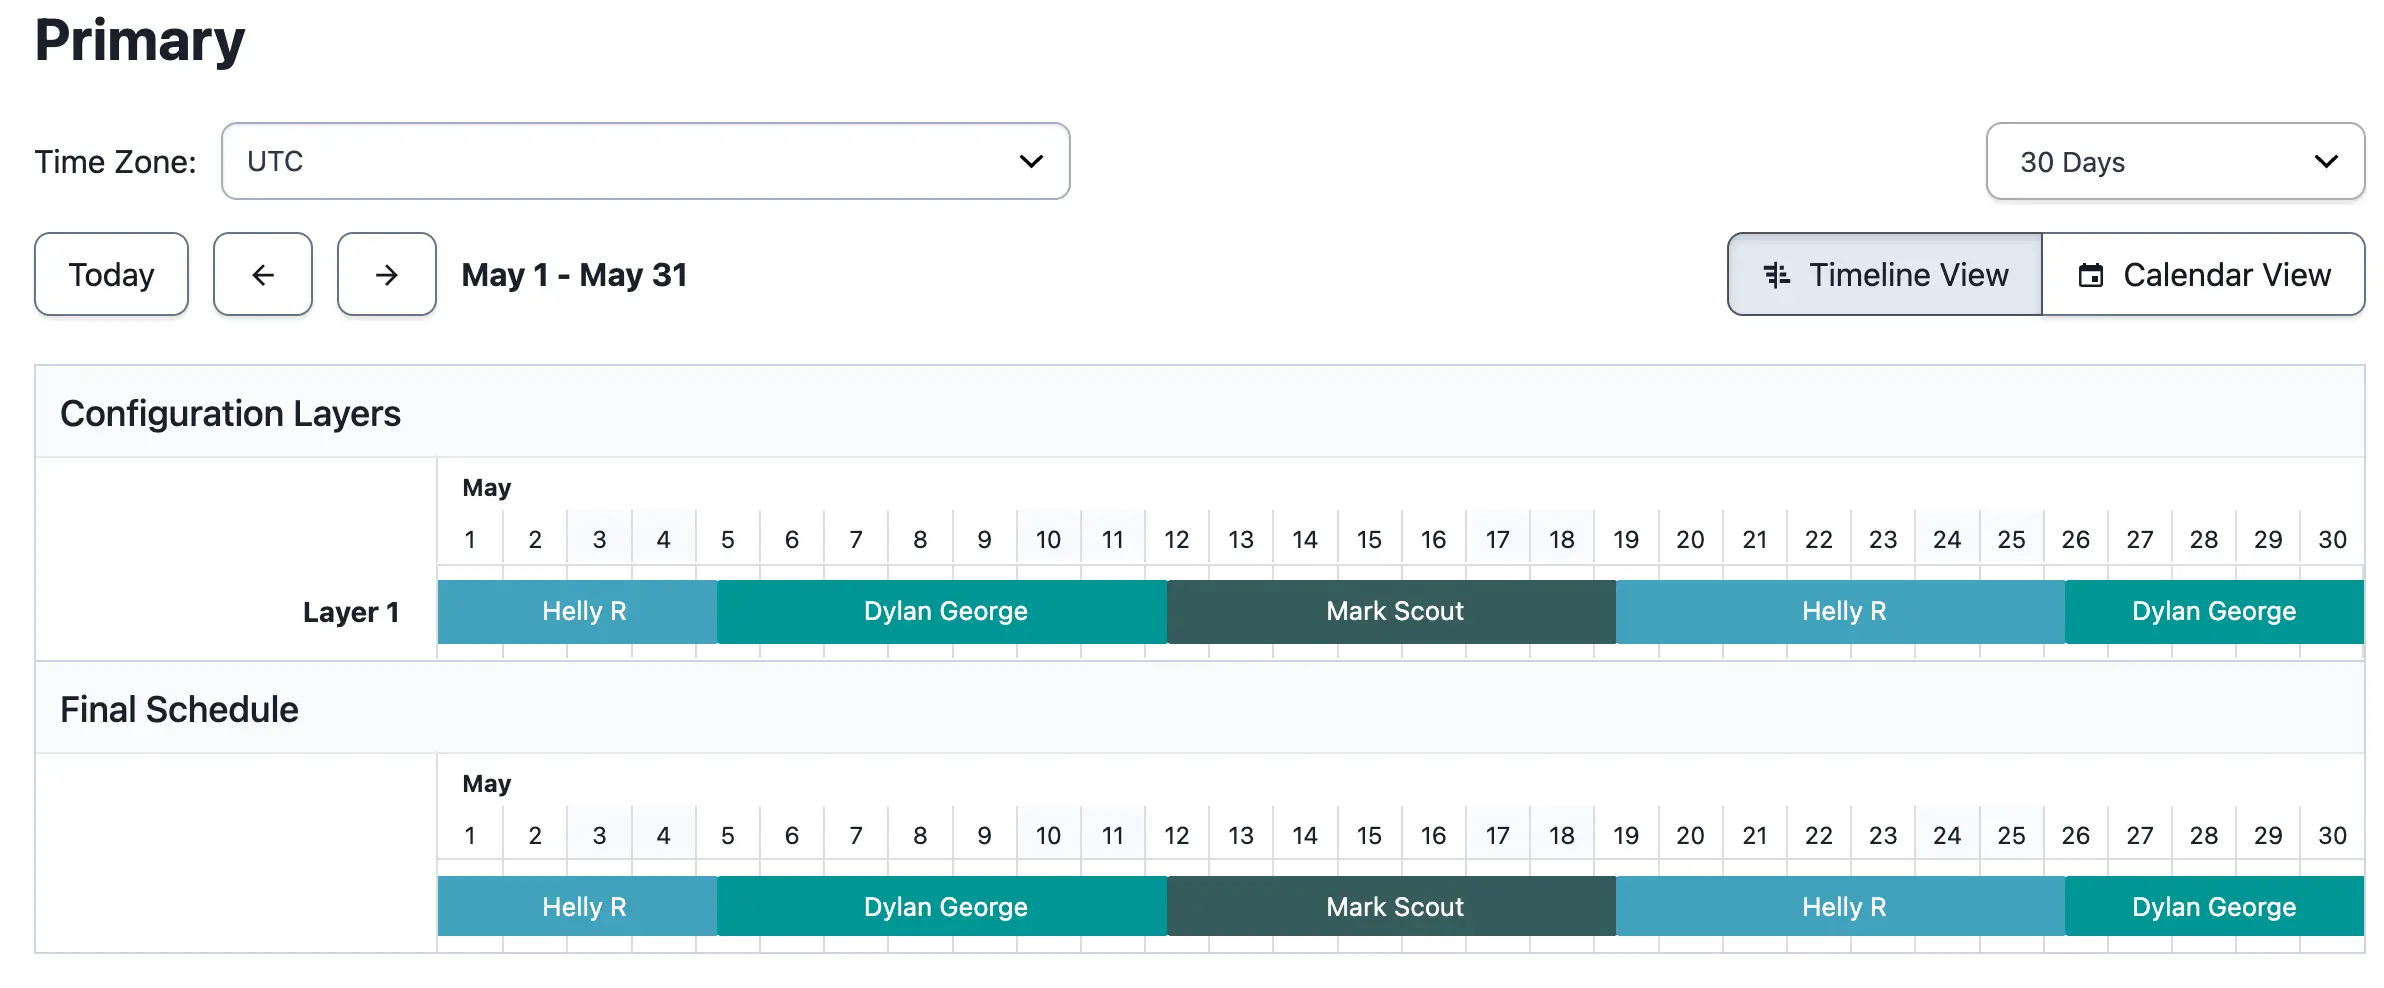 *Example 6, primary schedule* ### Create a Secondary On-Call Schedule 1. Repeat the configuration steps from the [primary on-call schedule setup](#create-a-primary-on-call-schedule), or navigate to the primary schedule you just created and select **Copy this Schedule**. 2. Adjust the user order so that it is staggered from the primary schedule. 3. Review the schedule and click **Save Schedule**. 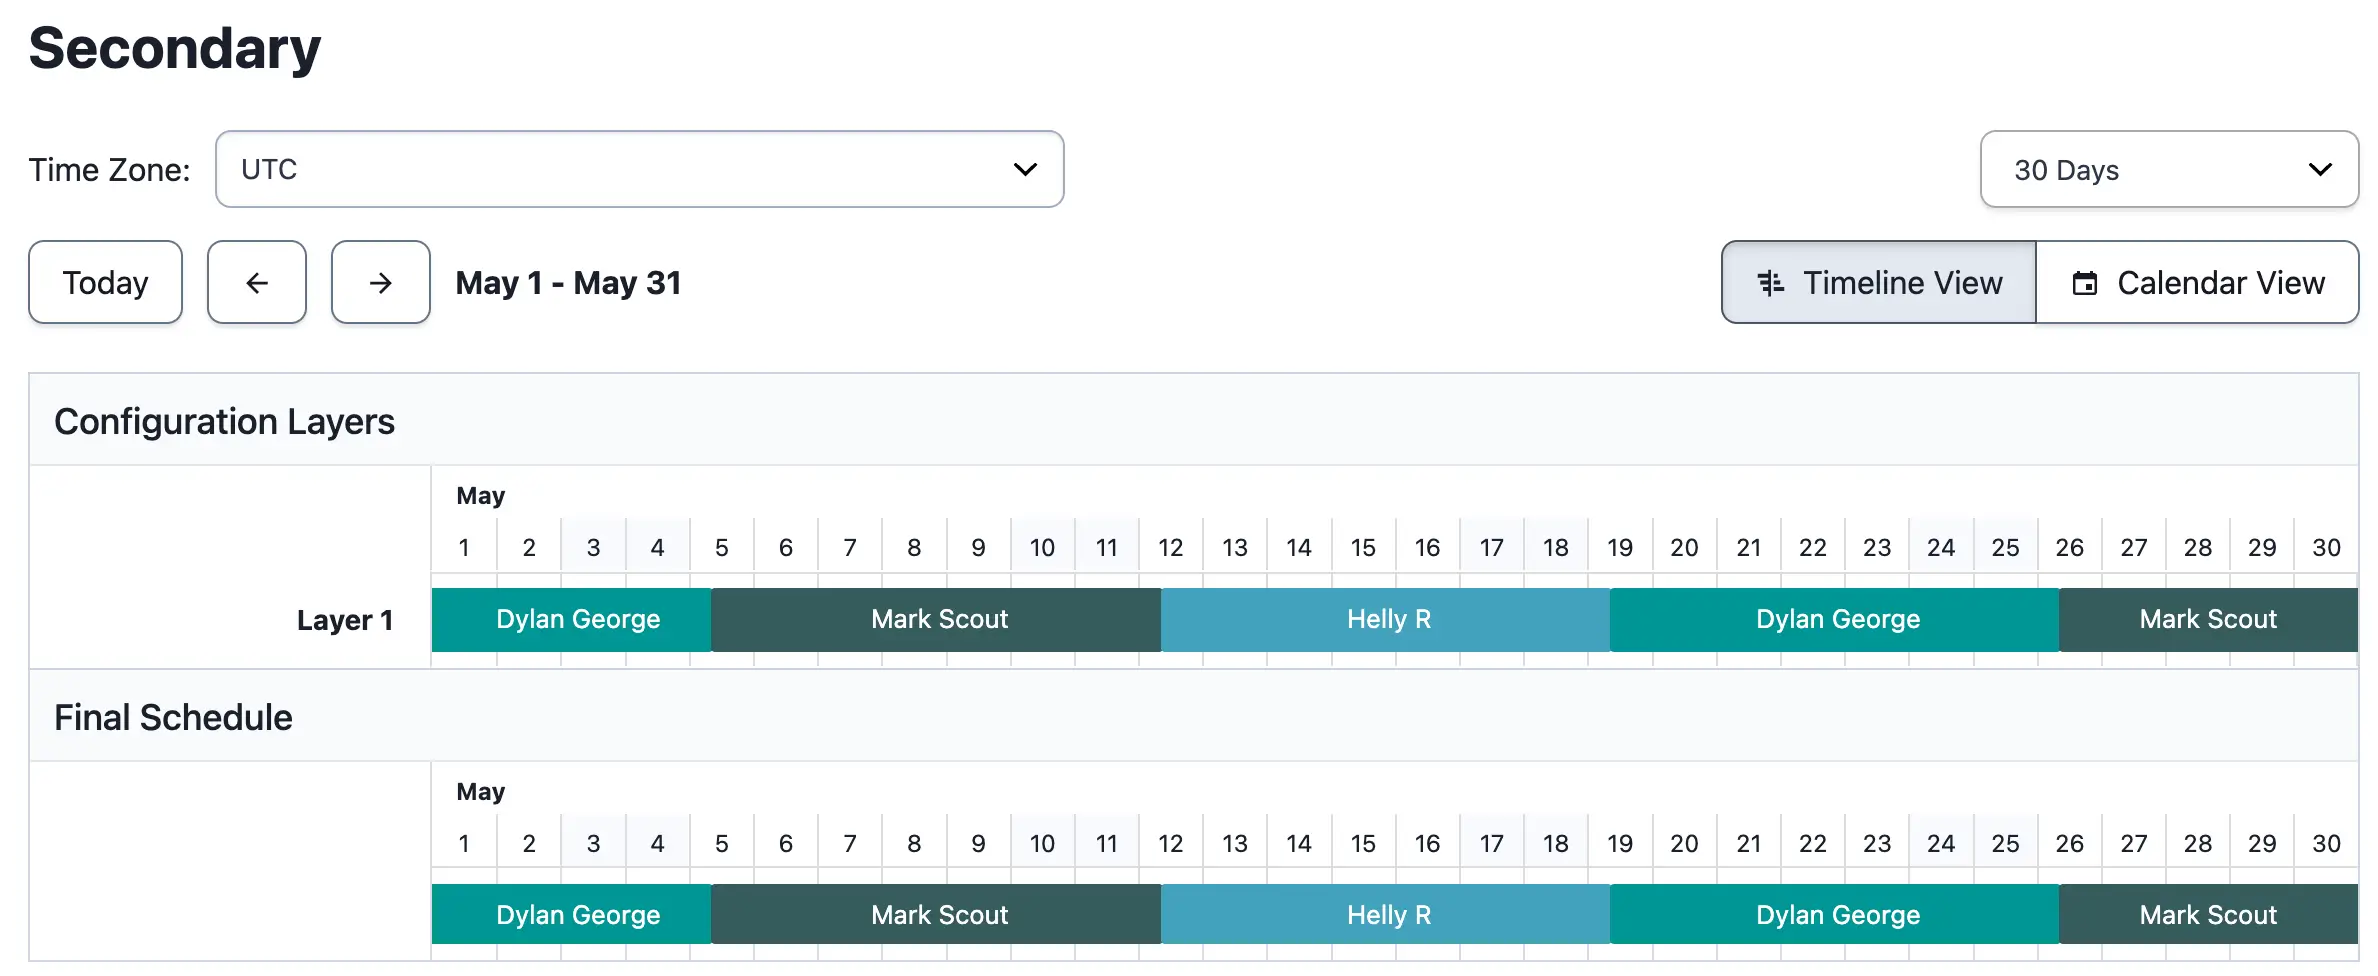 *Example 6, secondary schedule* ### Create an Escalation Policy Create an escalation policy with the primary schedule at level one and the secondary schedule at level two. For more information about creating and configuring escalation policies, read [Create an Escalation Policy](/incident-management/schedules/escalation-policies#create-an-escalation-policy). 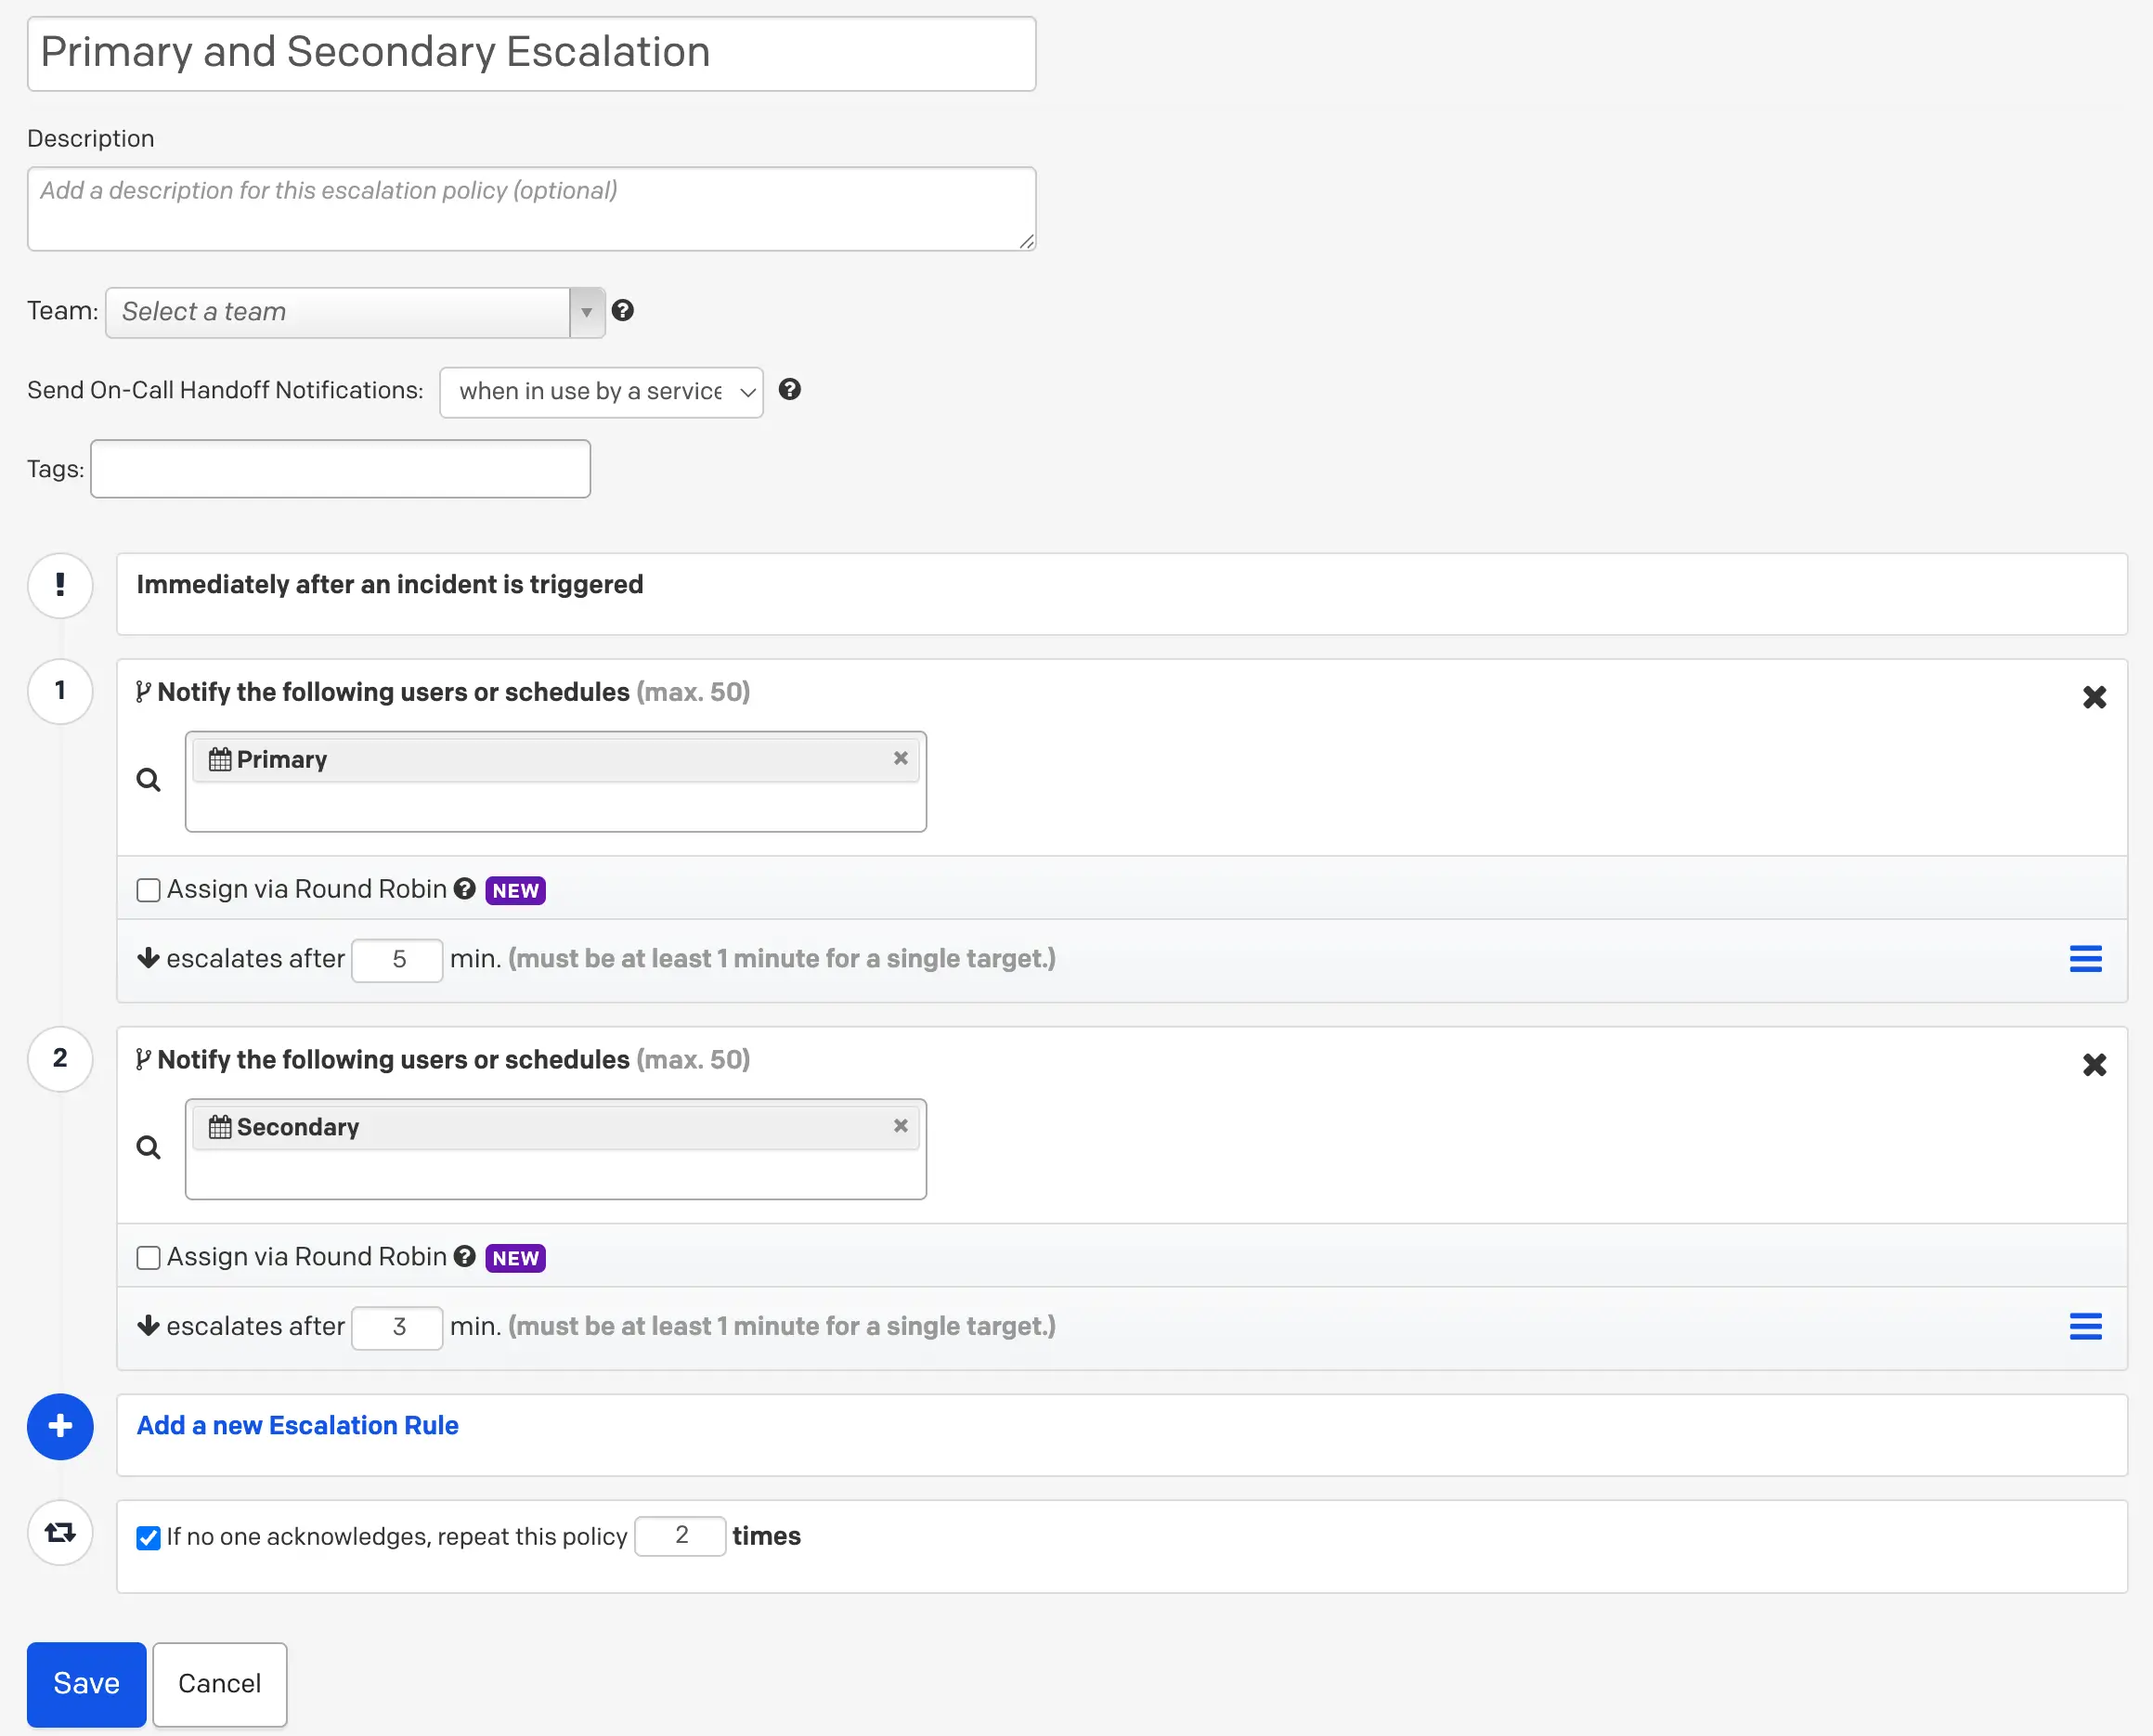 *Example 6, escalation policy* ## Example 7: Inverse Schedules This setup is similar to [Example 6](#example-6-create-primary-and-secondary-on-call-schedules), but with two users and the following conditions: - When User 1 is the primary on-call, User 2 is the secondary on-call. - When User 2 is the primary on-call, User 1 is the secondary on-call. This requires two on-call schedules, each added to a separate level of an escalation policy. ### Ex. 7 Schedule Requirements This schedule has two users on call. When User 1 is the first point of escalation, User 2 is the backup, receiving all incidents that User 1 does not respond to. When User 2 is the first point of escalation, User 1 is the backup, receiving all incidents that User 2 does not respond to. ### Ex. 7 Configuration Create two schedules — one for escalation level one and one for level two. #### Schedule 1 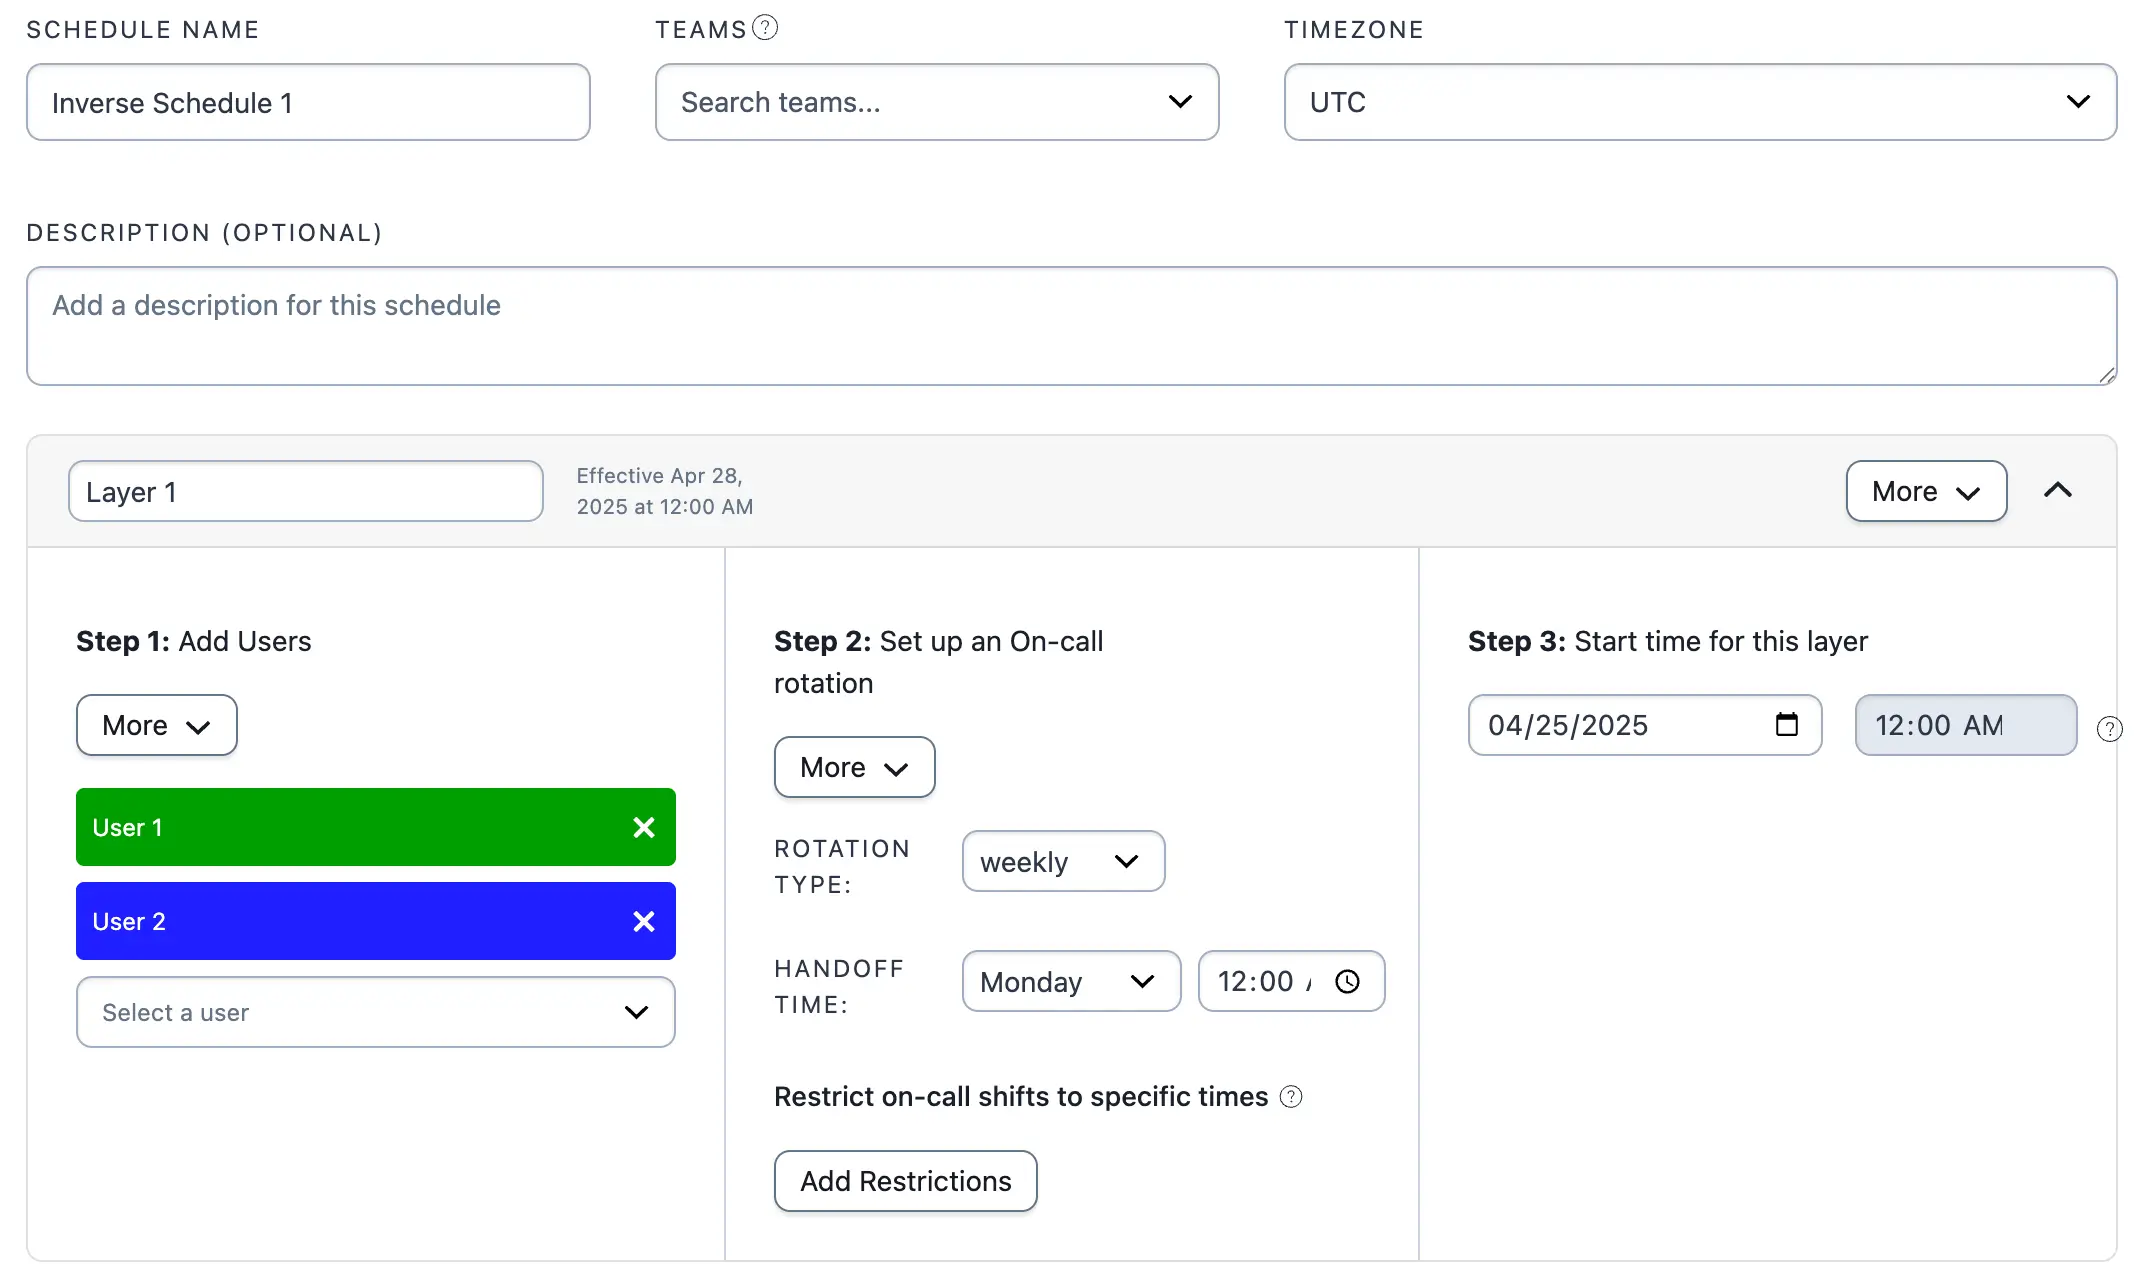 *Example 7, schedule 1* #### Schedule 2 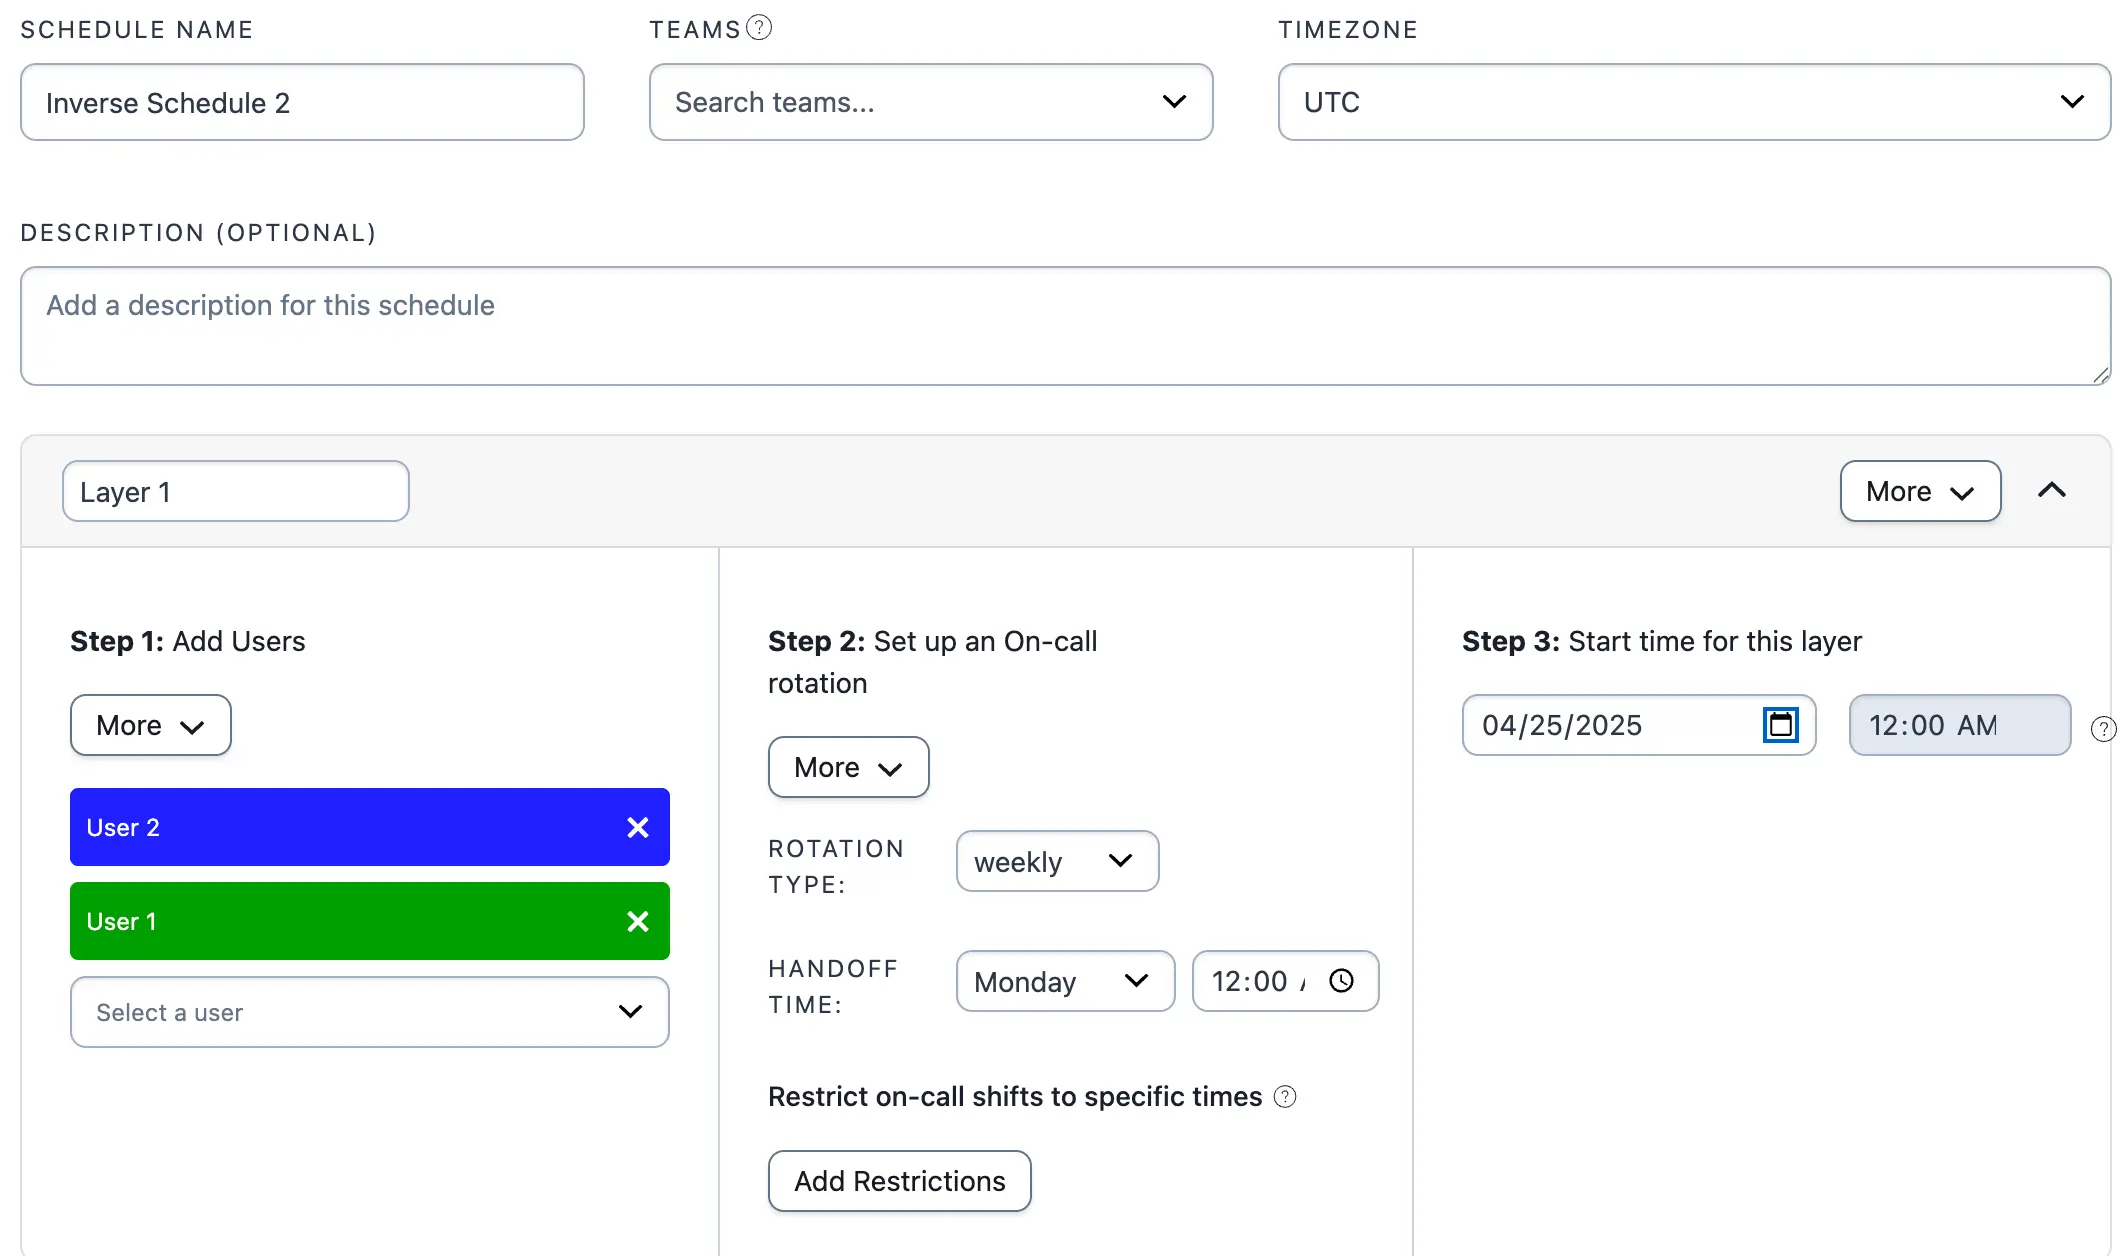 *Example 7, schedule 2* > **Tip:** Select **Copy this Schedule** to clone a schedule and then reorder the users. When viewing a specific schedule, this option appears on the right side of the page. ### Ex. 7 Escalation Policy 1. Navigate to **People** → **Escalation Policies** and either click **New Escalation Policy** or edit an existing one. 2. Add Schedule 1 to Level 1 of the escalation policy. 3. Click **Add a new Escalation Rule** and add Schedule 2 to Level 2 of the escalation policy. 4. Click **Save**. 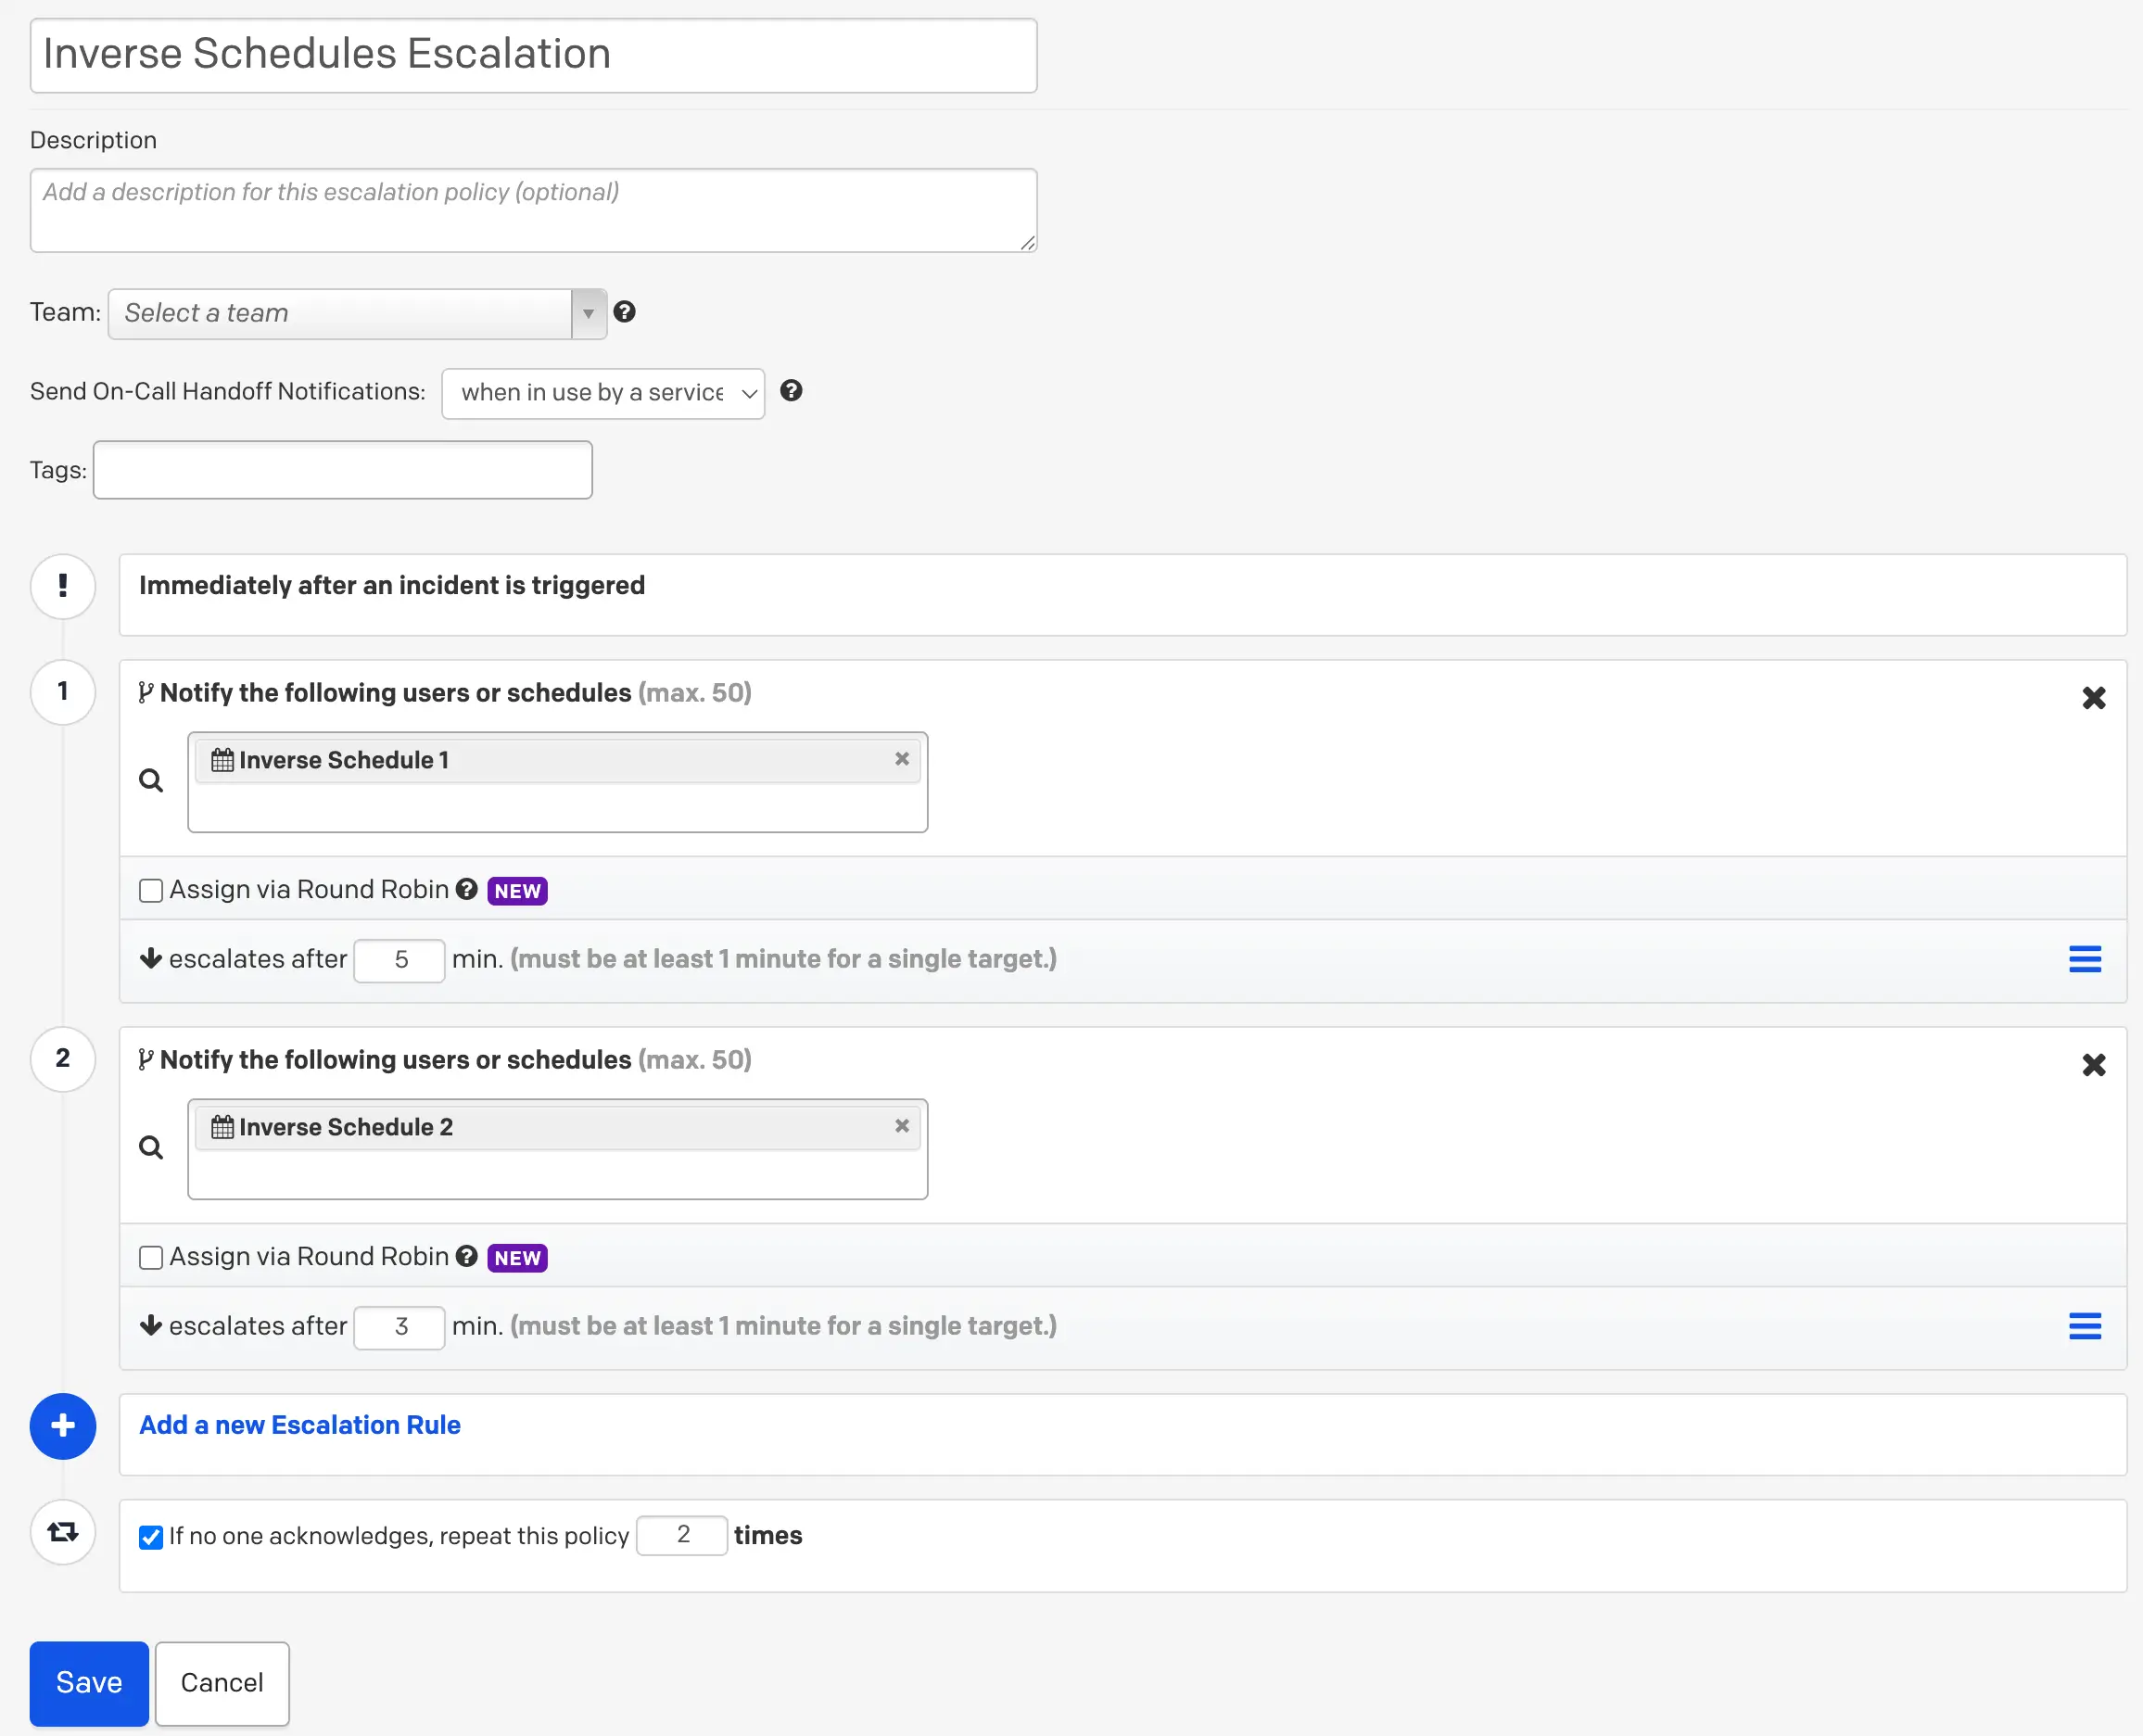 *Example 7, escalation policy* ## Example 8: Follow-the-Sun Schedule A follow-the-sun schedule is common for international teams across different time zones and ensures 24/7 coverage. This schedule has three sets of users on call at different times of the day and week. This example uses a US team and an India team. ### Ex. 8 Schedule Requirements This schedule has three rotating shifts, or layers. The first layer — for users in the US — consists of User 1 and User 2. They are on call weekdays from 8:00 AM to 8:00 PM US Pacific Time (PT) and rotate on a weekly basis. The India layer consists of User 3 and User 4. They are on call weekdays starting at 8:00 PM PT until 8:00 AM PT the following day. The third layer covers the weekends and includes all four users. The person on call during the weekend covers the entire weekend and rotates weekly. In this example, the weekend begins at Friday 8:00 PM Pacific and ends Sunday 8:00 PM Pacific. ### Ex. 8 Configuration 1. In the PagerDuty web app, navigate to **People** → **Schedules** and click **New Schedule**. 2. Enter a **Schedule name** and optionally adjust the time zone. All times you select are local to this time zone. #### Team 1 (US) 1. Add the US users (User 1 and User 2) by selecting **Select a User** in **Layer 1**. 2. Select **weekly** as the rotation type and set the **Handoff time** to the beginning of the shift. 3. Under **Restrict on-call shifts to specific times**, click **Add Restrictions**. 4. With **Restrict on-call duty to specific times-of-the-day** selected, enter **8:00 AM to 8:00 PM**. 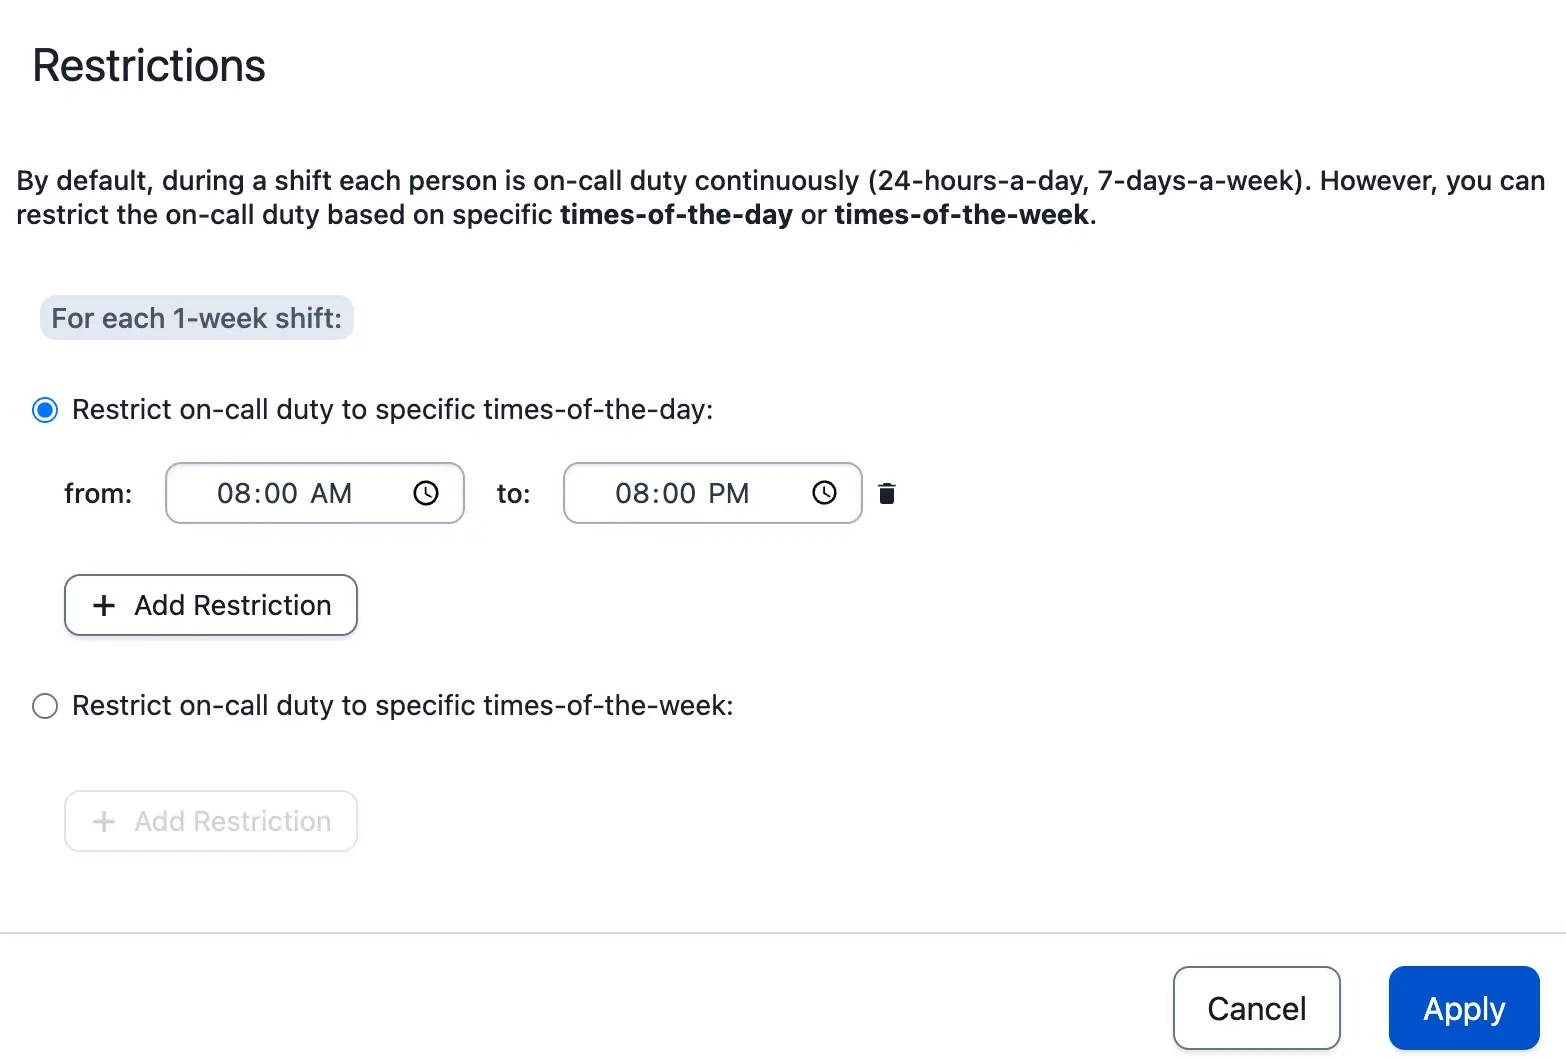 *Example 8, layer 1 restrictions* 5. Click **Apply**. 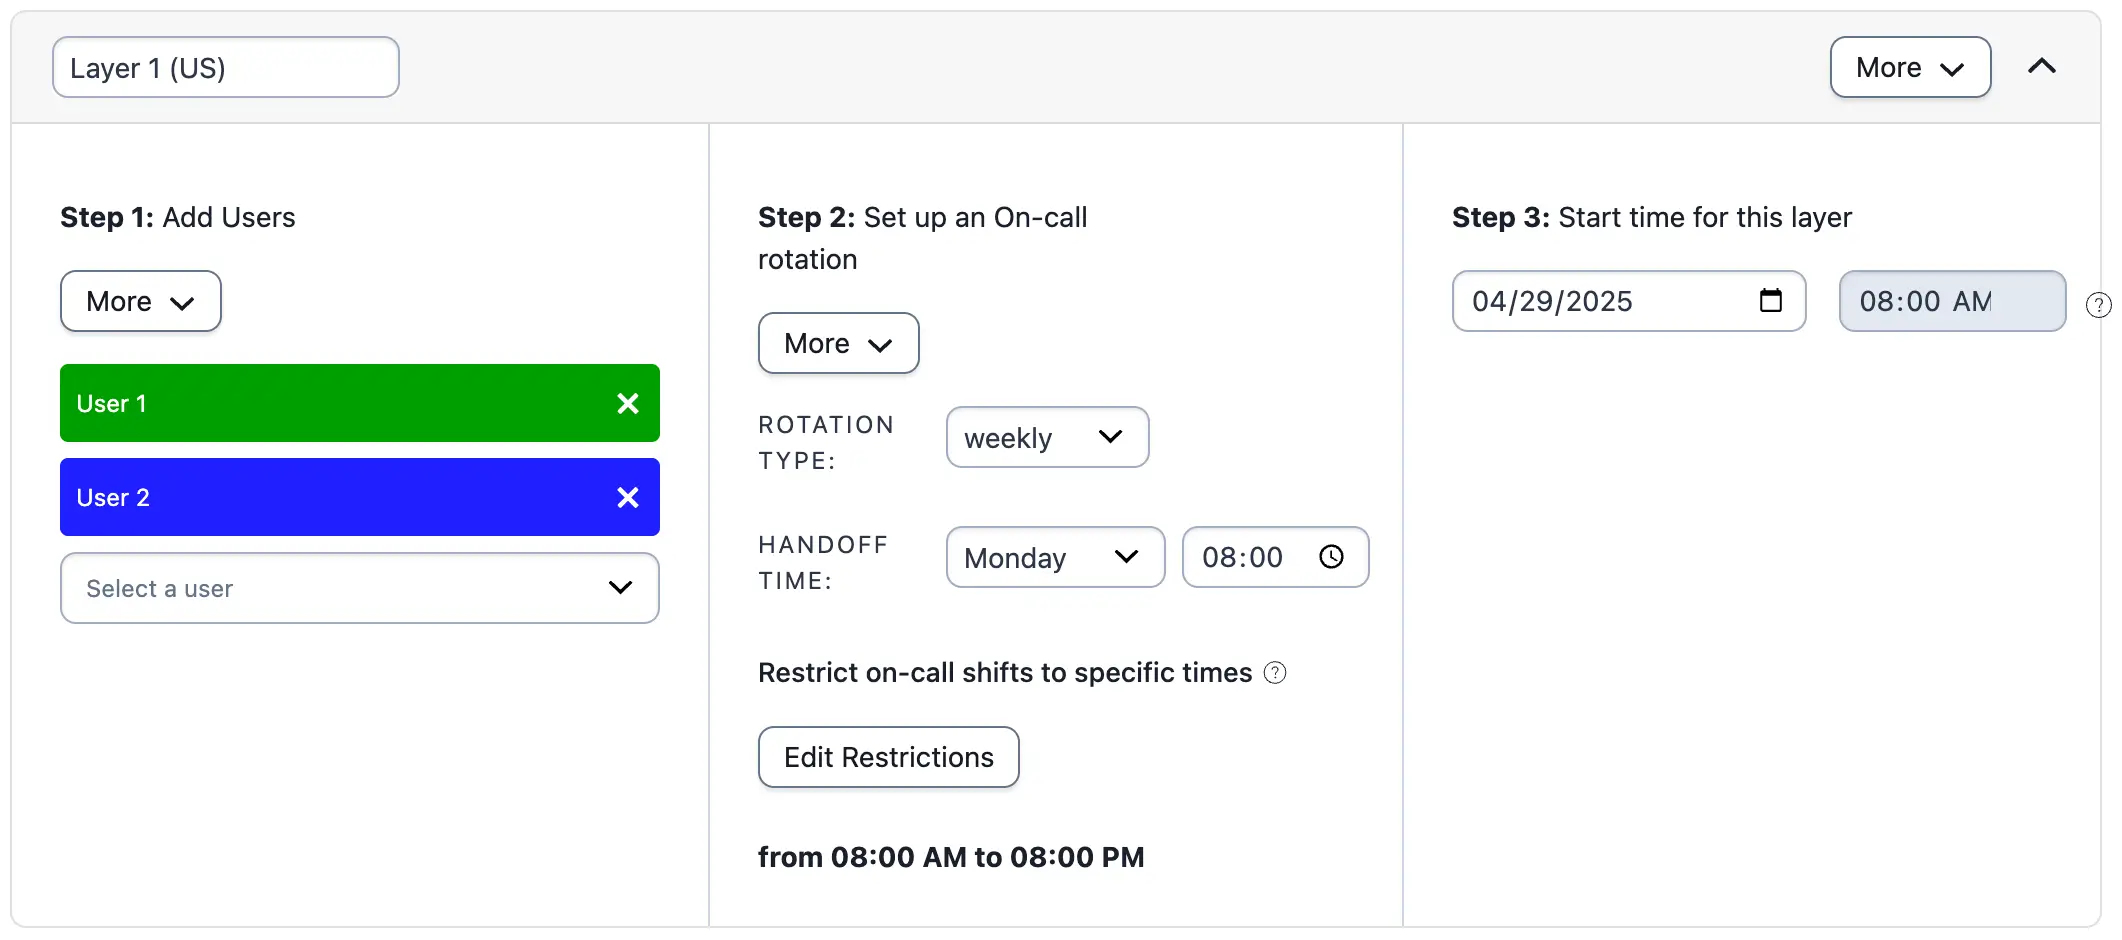 *Example 8, layer 1 (US)* > **Layer Precedence:** You do not need to restrict this layer to weekdays, since the [weekend rotation in Layer 3](#team-3-weekend) replaces weekend days on the final schedule. This follows the rule that the lowest layer takes precedence over any higher layers. #### Team 2 (India) 1. Click **Add a new layer** and add the India users (User 3 and User 4) to **Layer 2**. 2. Select **weekly** as the rotation type and set the **Handoff time** to the beginning of this team's shift. 3. Under **Restrict on-call shifts to specific times**, click **Add Restrictions**. 4. With **Restrict on-call duty to specific times-of-the-day** selected, enter **8:00 PM to 8:00 AM**. 5. Click **Apply**. 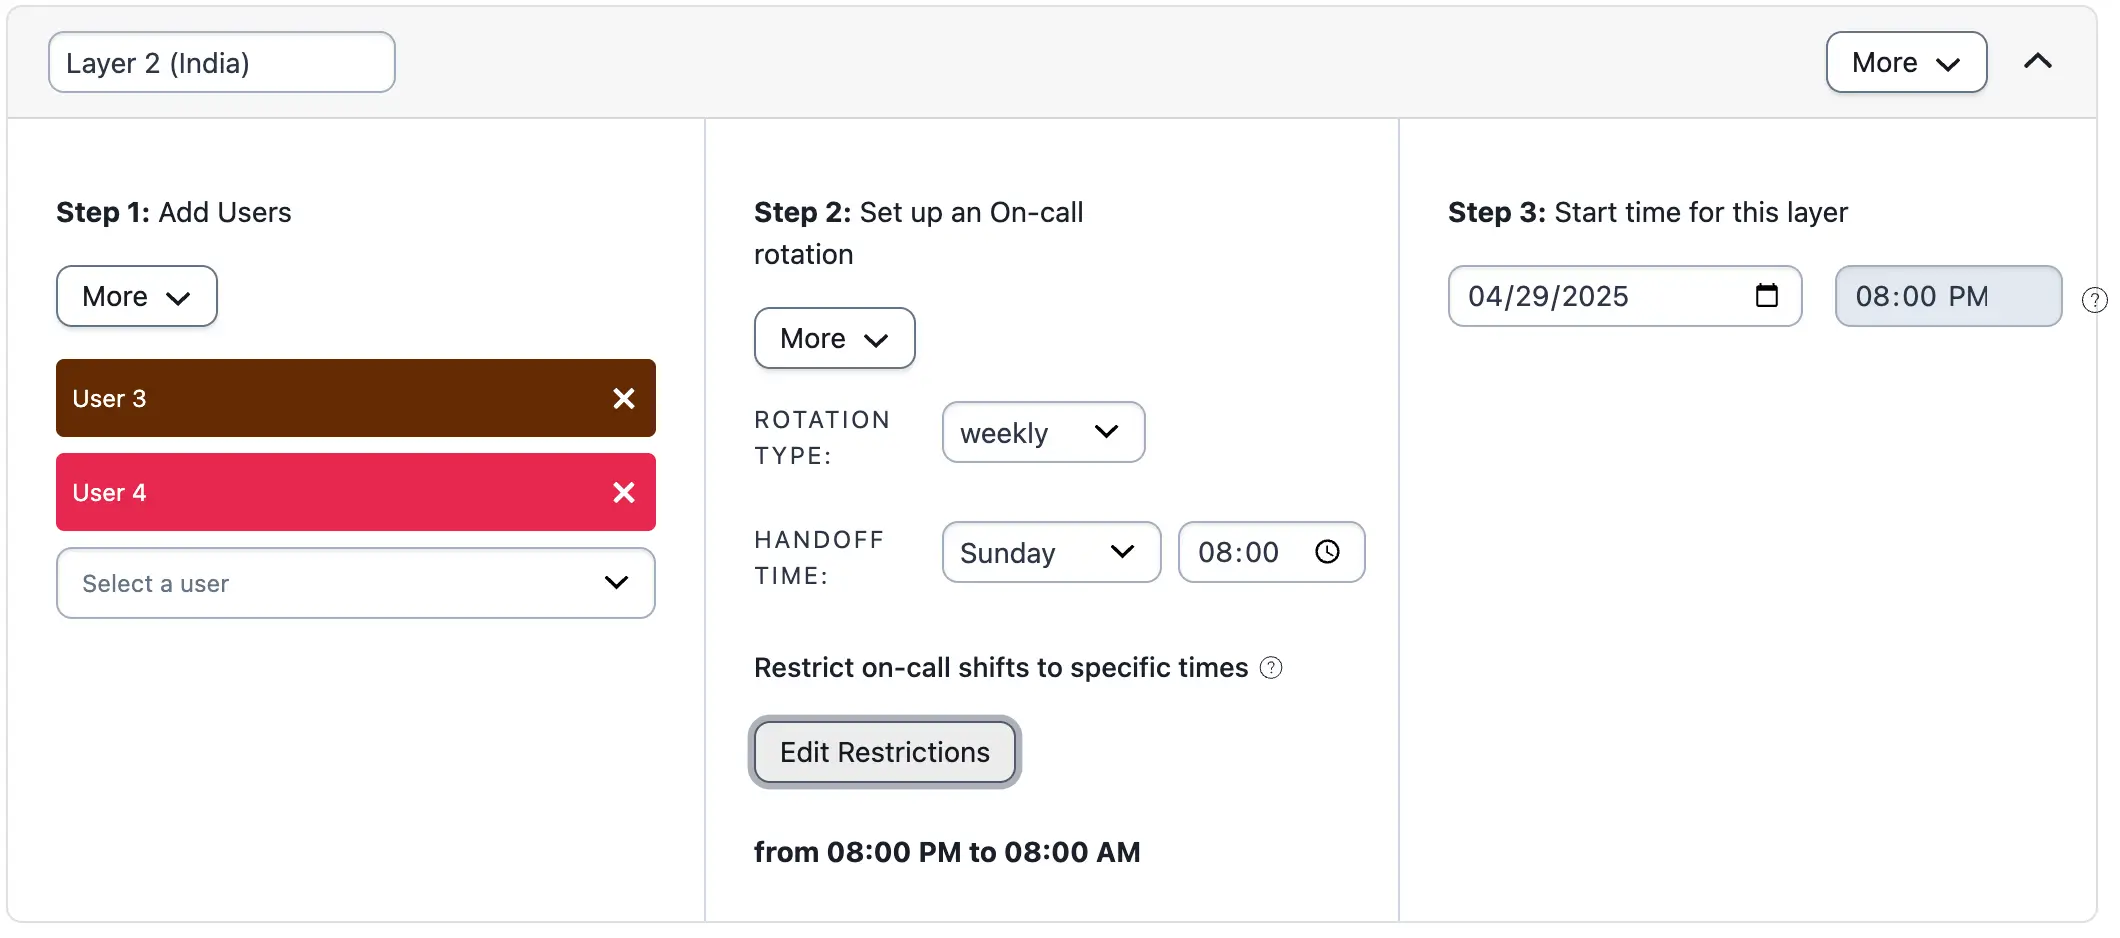 *Example 8, layer 2 (India)* #### Team 3 (Weekend) 1. Click **Add a new layer** and add all four users to **Layer 3**. 2. Select **weekly** as the rotation type and set the **Handoff time** to the beginning of this team's shift. 3. Under **Restrict on-call shifts to specific times**, click **Add Restrictions**. 4. With **Restrict on-call duty to specific times-of-the-week** selected, enter **Friday 8:00 PM to Sunday 8:00 PM**. 5. Click **Apply**. ### Ex. 8 Final Schedule 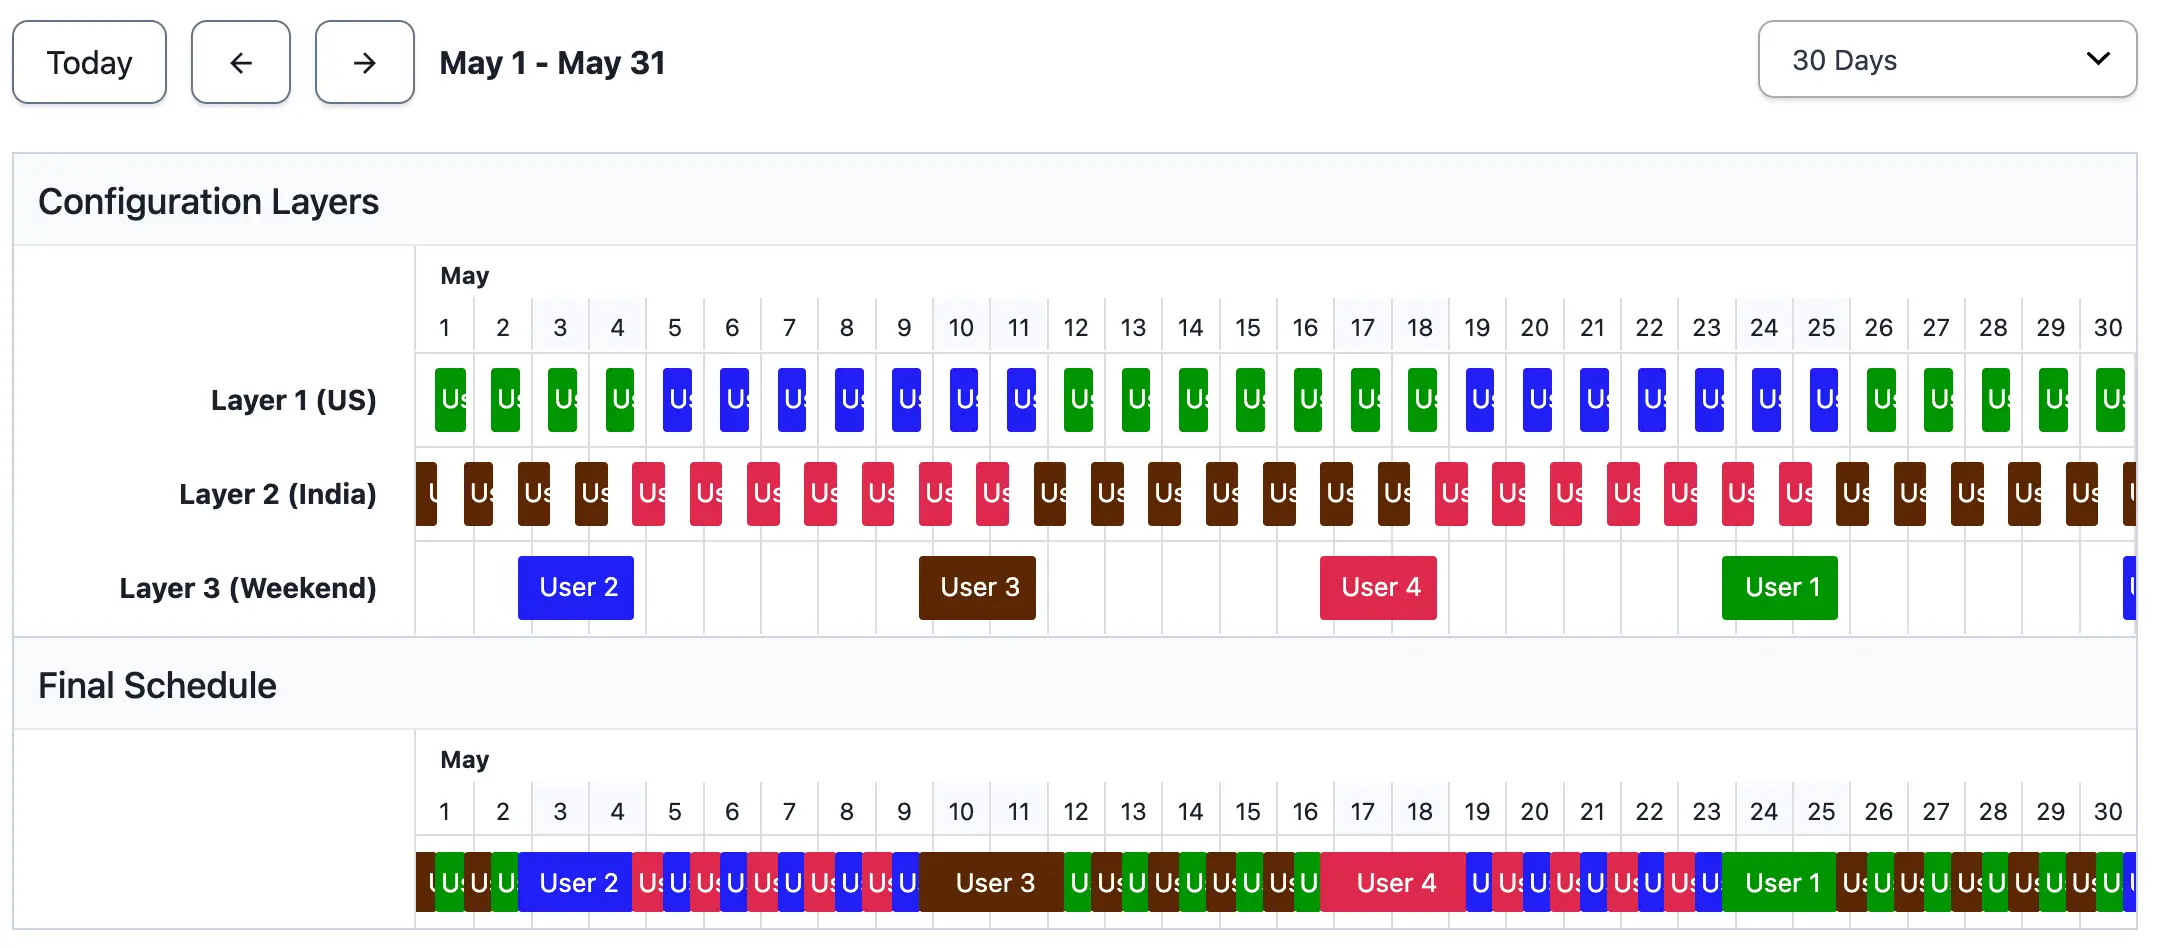 *Example 8, final schedule* ## Example 9: Schedule Users Every Other Week ### Ex. 9 Schedule Requirements This schedule has four users. Two users are on call during the weekdays. The other two are on call during the weekend. They rotate every week. ### Ex. 9 Configuration Layer 1 handles the weekday rotation. User 1 and User 2 rotate on a weekly basis with a handoff time of Monday 12:00 AM.  *Example 9, layer 1* Click **Add a new layer** to create a second layer for the weekend. Layer 2 has Users 3 and 4 on a weekly rotation with a handoff time of Saturday 12:00 AM. Restrict this layer to the weekend.  *Example 9, layer 2* ### Ex. 9 Final Schedule  *Example 9, final schedule* ## Example 10: Weekend/Weekday Schedule A weekend/weekday schedule requires one rotation for the working week and another for the weekend. This example uses one layer for each group. Navigate to **People** → **Schedules** and click **New Schedule**. Enter a name for your schedule. ### Layer 1: Weekday The first layer is the weekday layer. Each member is on call for 24 hours in a daily rotation. [Create a schedule](/incident-management/schedules/schedule-basics#create-a-schedule) with a daily rotation type and a handoff time at 12:00 AM.  *Example 10, layer 1* ### Layer 2: Weekend This schedule layer represents the weekend rotation. 1. Click **Add a new layer**. 2. Add users to the layer and set the rotation type as **daily** with a handoff time of **00:00**. 3. Under **Restrict on-call shifts to specific times**, click **Add Restrictions**. 4. With **Restrict on-call duty to specific times-of-the-week** selected, enter **Saturday 12:00 AM to Monday 12:00 AM** to represent the weekend rotation. 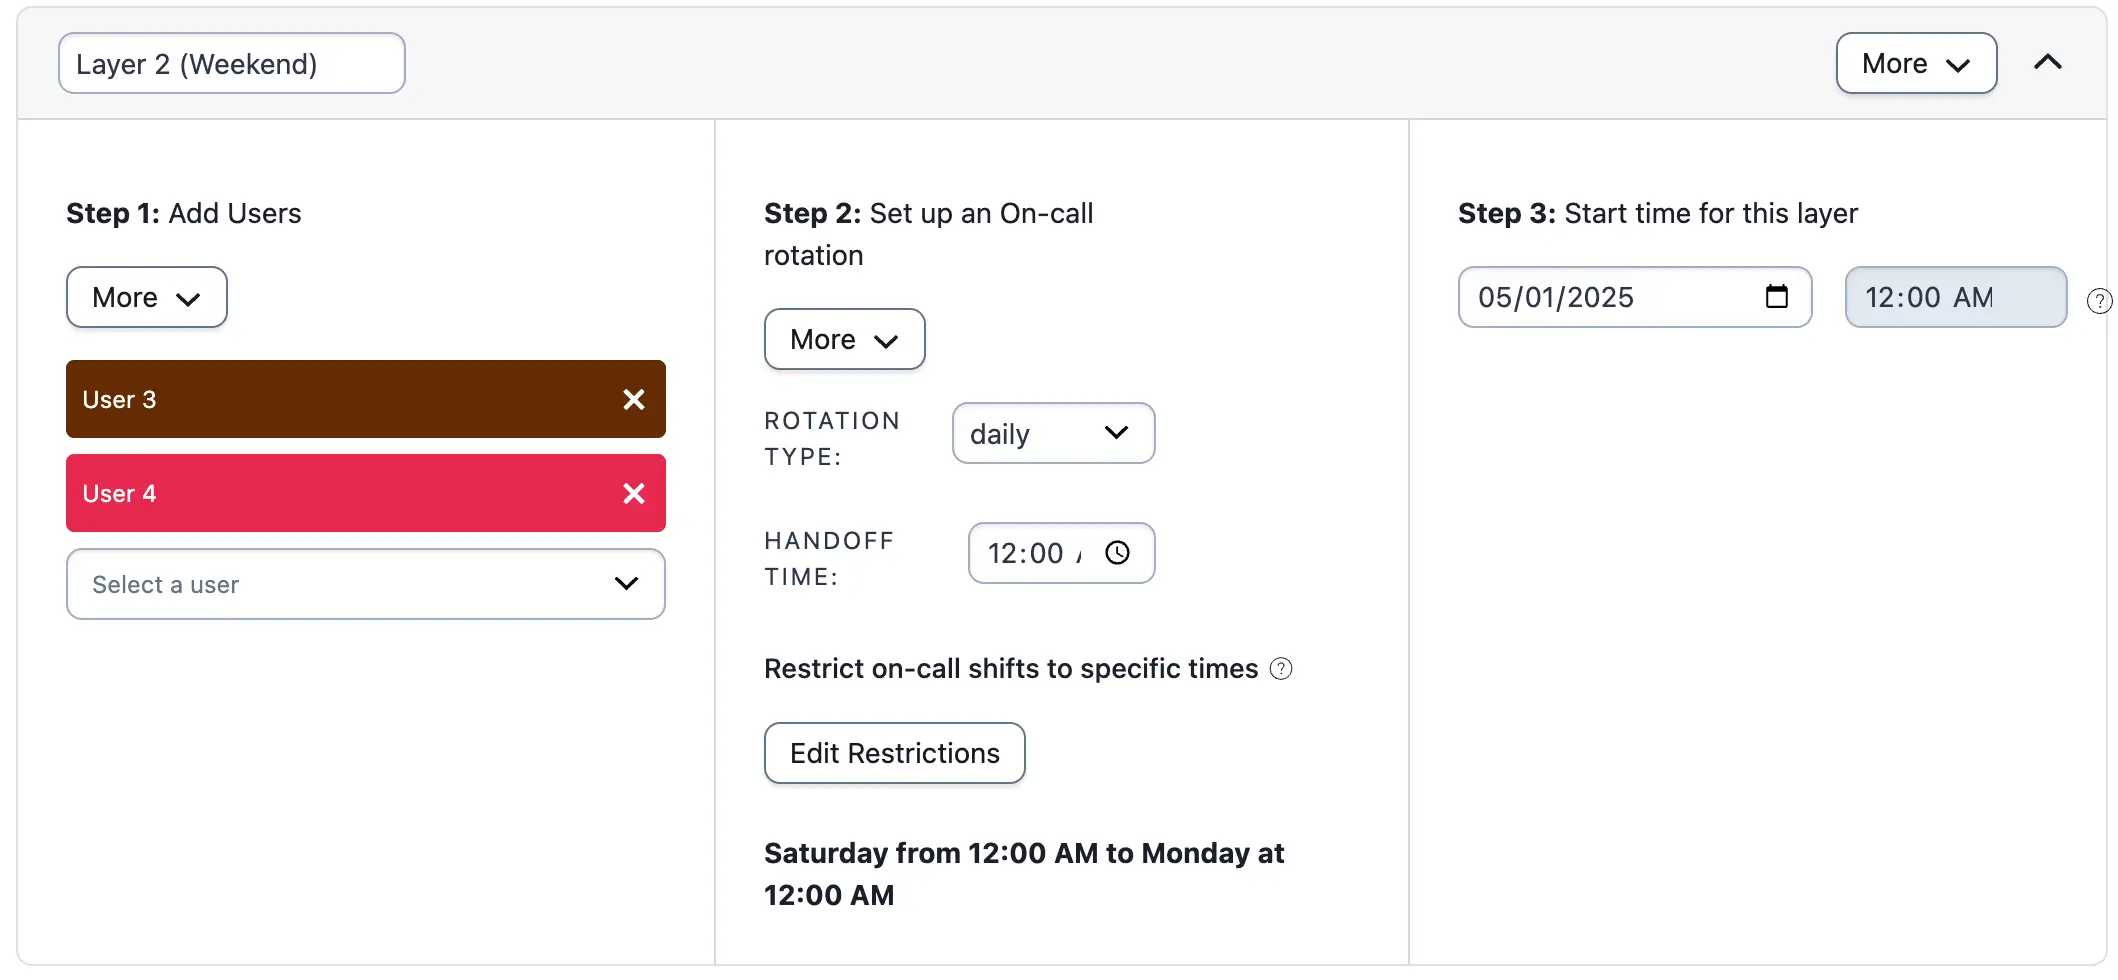 *Example 10, layer 2* Since the bottom layer takes precedence over other layers, the **Final Schedule** shows that User 1 and User 2 take turns on call Monday to Friday on a daily basis. User 3 goes on call Saturday at 12:00 AM. User 4 goes on call Sunday at 12:00 AM. 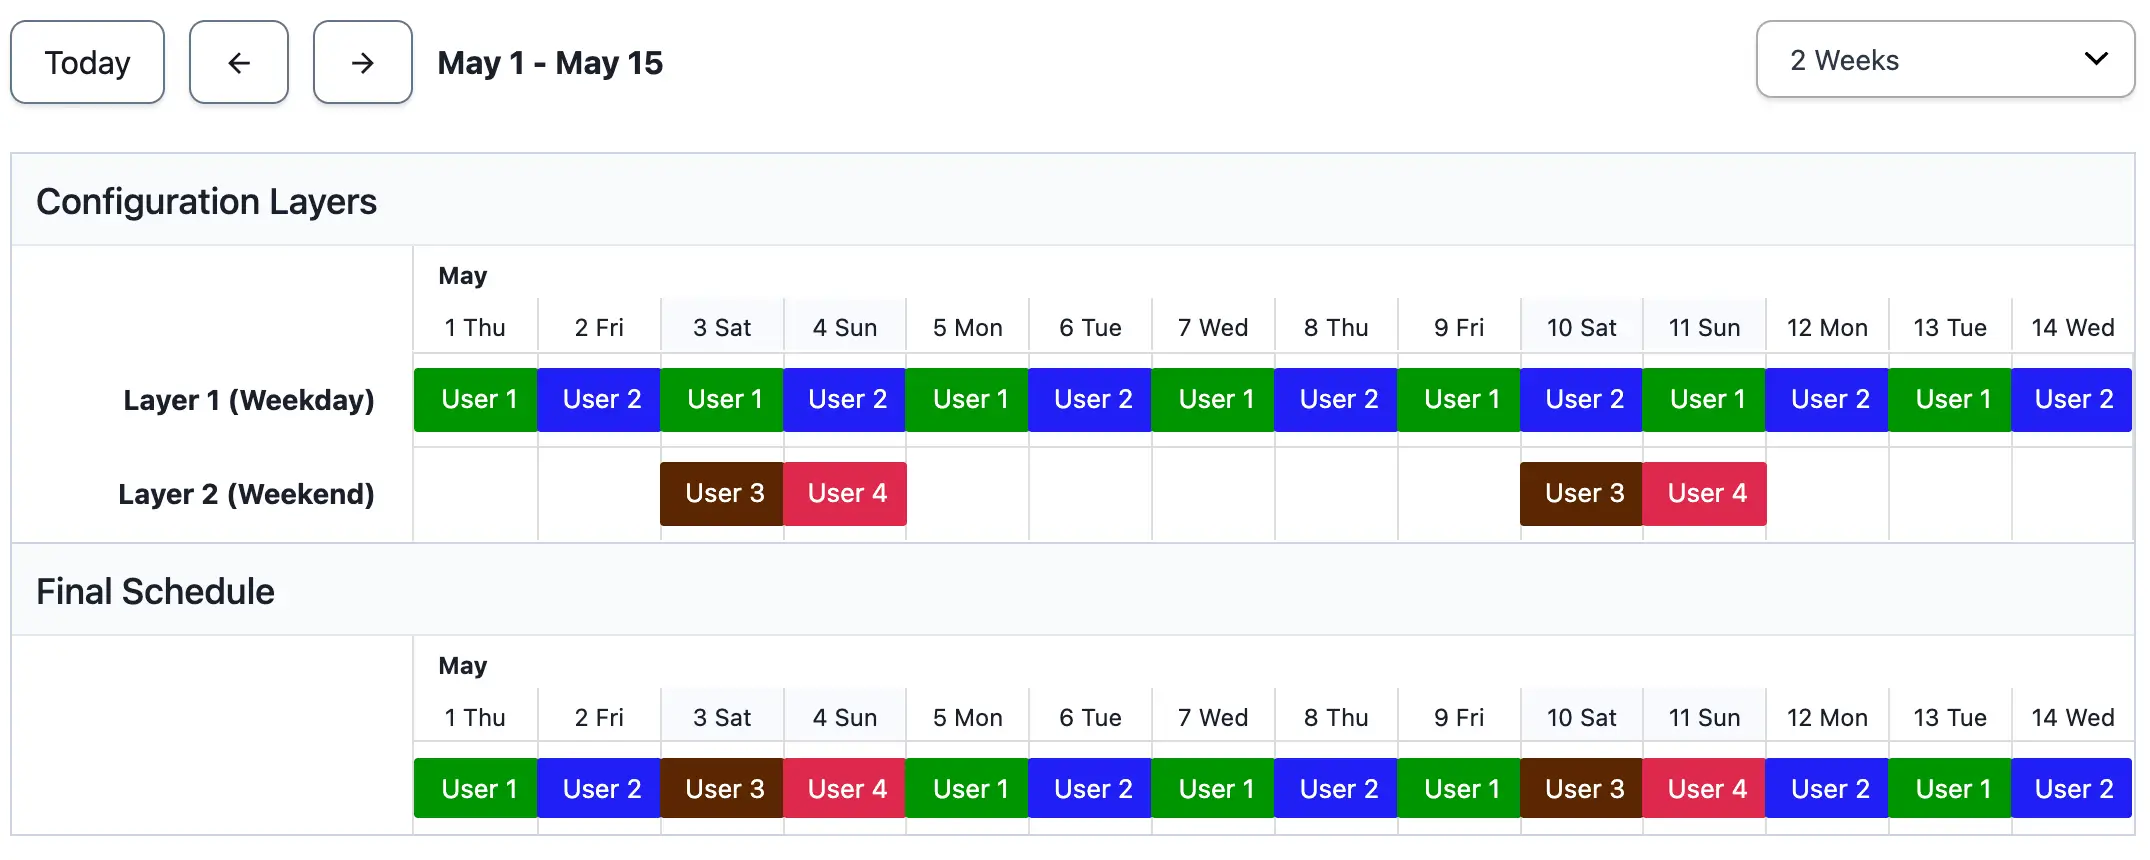 *Example 10, final schedule*
--- URL: https://docs.pagerduty.com/incident-management/schedules/schedules-in-apps # Schedules in Third-Party Apps Add PagerDuty schedules to third-party apps like Confluence, Apple Calendar, Google Calendar, Microsoft Outlook, etc. Exporting a PagerDuty schedule to a third-party app allows users to review their on-call shifts without logging in to multiple products. Common choices include [Confluence](#confluence) and [calendar apps](#calendar-apps), such as Google Calendar and Apple Calendar. - [Confluence](#confluence) - [Calendar Apps](#calendar-apps) ## Confluence ### In PagerDuty 1. Navigate to **People** → **Schedules**. 2. To the right of the schedule you would like to export, select **Export**. In the section **iCalendar file**, right click **Everyone** and select **Copy Link Address**. Keep this link address for later use.  *Copy link address* ### In Confluence #### Subscribe to a PagerDuty Schedule Before you can [add a PagerDuty on-call schedule to a Confluence page](#add-a-pagerduty-on-call-schedule-to-a-confluence-page), you’ll need to subscribe to it. 1. Go to **User Icon** → **Personal Space** → **Calendars**.  *Select Calendars* 2. Select **Subscribe by URL**.  *Select Subscribe by URL* 3. In the **Subscribe** dialog window, enter a **Calendar name**, paste the **iCal URL** from [step 2 above](#in-pagerduty), and click **Subscribe**.  *Subscribe to calendar* > **Schedule Name Length:** Atlassian expects the name of your schedule in PagerDuty to be 28 characters or less. If the name of your PagerDuty schedule has 29 or more characters, then you will see the following error in Confluence: `Specified calendar does not seem like iCalendar`. Note that this refers to the schedule's name and not the iCal URL. > > The same error message will appear if one or more of your users in PagerDuty has a name that is 29 or more characters long. #### Add a PagerDuty On-Call Schedule to a Confluence Page After [subscribing to a PagerDuty on-call schedule](#subscribe-to-a-pagerduty-schedule): 1. Select **Create** from the top navigation bar or press `c` to create a new page. 2. Give the page a title, type `/team calendars`, and select the **Team Calendars** widget.  *Team Calendars widget* 3. In the right panel’s **Calendar** field, search for and select the calendar you [subscribed to above](#subscribe-to-a-pagerduty-schedule). 4. Click **Publish** in the top right corner. ## Calendar Apps You can integrate your on-call schedule with calendar software (e.g., Apple Calendar, Google Calendar, Microsoft Outlook, etc.) using the WebCal or iCal formats. > **Historical Data:** iCal and WebCal feeds will display historical data over a 1-month period. Up to 6 months of on-call schedules can be exported in the feed. - [Export All Schedules](#export-all-schedules) - [Export a Single Schedule](#export-a-single-schedule) - [Changes to Schedules](#changes-to-schedules) - [Troubleshooting WebCal Exports](#troubleshooting-webcal-exports) ### Export All Schedules You can export **all** of your personal on-call schedules at once on your profile page. 1. In the PagerDuty web app, go to **User Icon** → **My Profile** and select the **User Settings** tab. 2. In the section **Calendar**, right click **WebCal feed** and copy the link. Alternatively, you can download the `.ics` file by clicking **iCalendar file**. 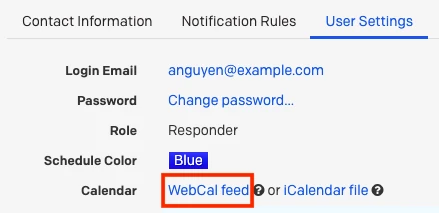 *Select WebCal feed* 3. Open [Google Calendar](https://calendar.google.com/calendar/render#main_7) or preferred calendar application. In this example, we will use Google Calendar. 4. Under **Other calendars**, select **From URL** from the drop-down list. 5. Paste the URL and click **Add calendar**. 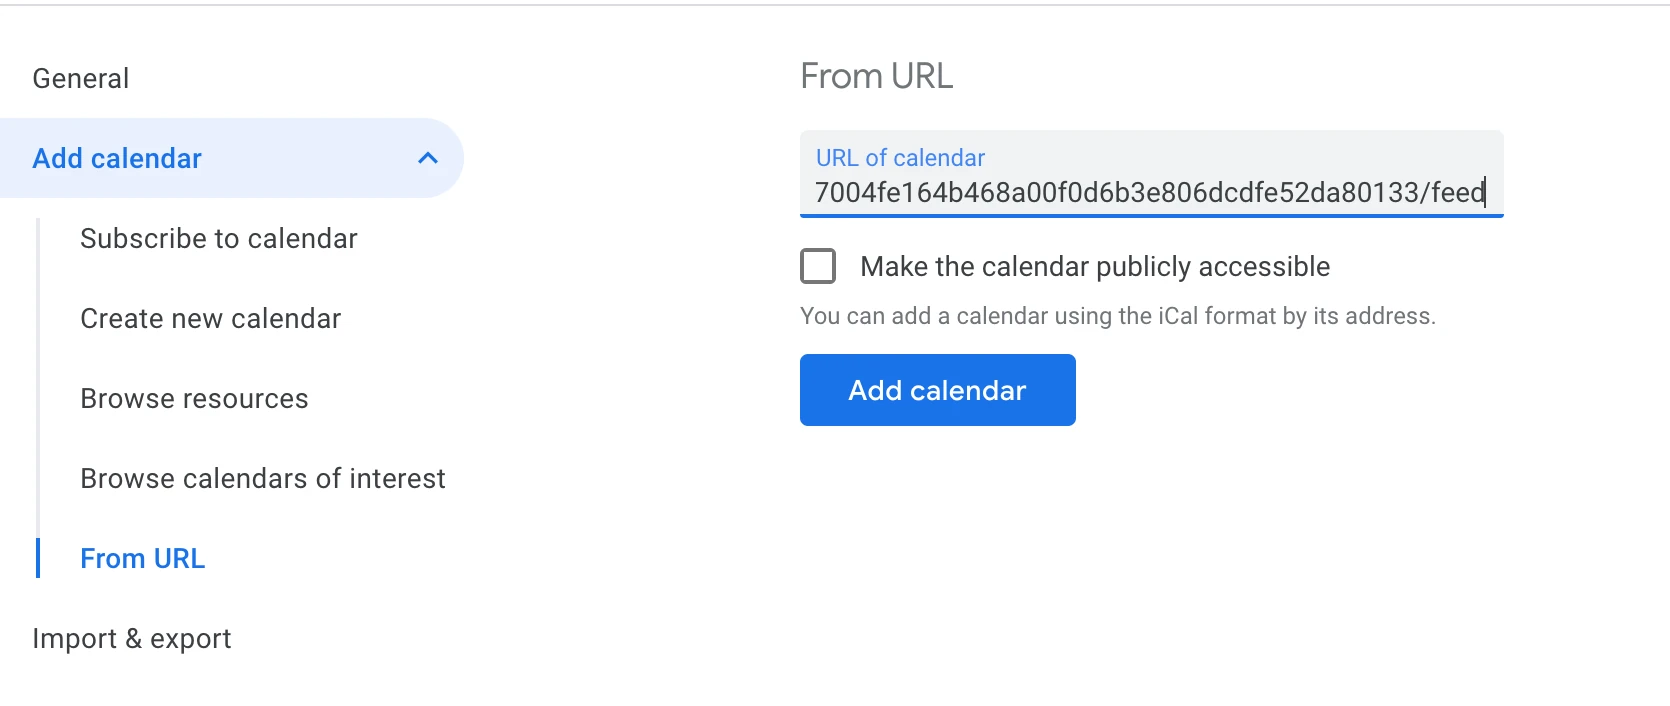 *Paste calendar URL* #### Export Schedules from My On-Call Shifts 1. In the PagerDuty web app, navigate to **People** → **My On-Call Shifts**. 2. Click **Export Calendar**. 3. Select **WebCal feed** or **iCalendar file**. 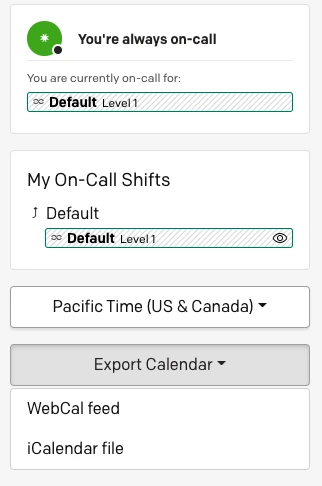 *Export calendar* ### Export a Single Schedule You can also export schedules individually. Find the iCal or WebCal link for a specific schedule by clicking on the schedule and selecting **Export**. You can export [only your on-call shifts](#export-only-your-on-call-shifts) or the [entire schedule](#export-the-entire-schedule) with everyone's shifts. When exporting the calendar feed from the Schedules page, it will export **only the selected** on-call schedule. #### Export Only Your On-Call Shifts 1. In the PagerDuty web app, go to **People** → **Schedules**. 2. Next to a calendar select **Export** → **Just My Calendar** to launch your calendar application. You will be prompted to subscribe to the calendar URL. 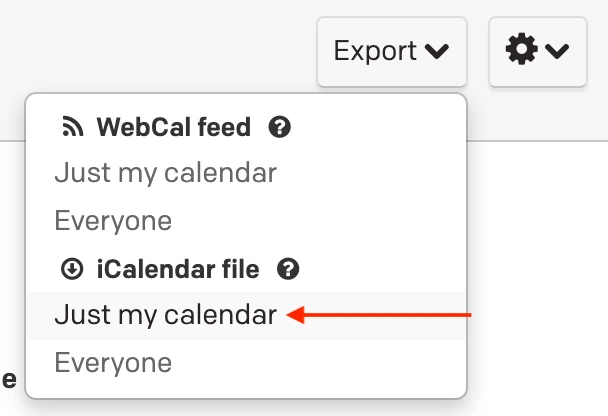 *Export just my calendar* 3. In this example we're using Apple Calendar — click **Subscribe** to finish importing your personal schedule.  *Paste calendar URL* #### Export the Entire Schedule 1. Go to **People** → **Schedules**. 2. To the right of your desired schedule, select **Export** → **WebCal feed** → **Everyone** to launch your calendar application. You will be prompted to subscribe to the calendar URL. 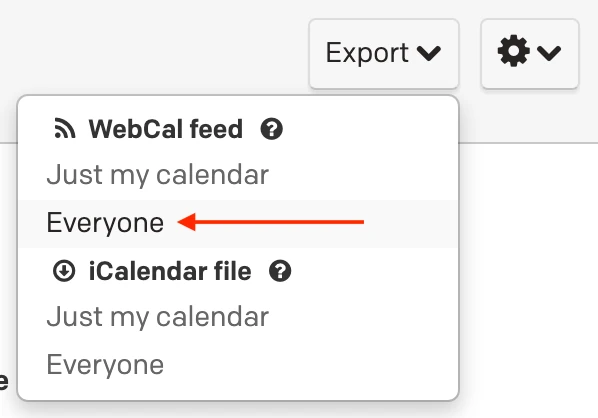 *Select Everyone* 3. Confirm the subscription to complete the import of the entire schedule. ### Changes to Schedules Once an on-call schedule is exported into Google Calendar, Google Calendar will **automatically** update when you make a change to the on-call schedule in PagerDuty. This means that once an on-call schedule has been exported, you will not need to edit it when you make changes to the schedule in PagerDuty. > **Refresh Period:** Google Calendar can take up to 24 hours to refresh an imported on-call schedule. This is because Google Calendar caches the data every time it refreshes. ### Delete an Imported Schedule Sometimes when you import the wrong calendar into Google Calendar and attempt to import a different calendar it may not import correctly. Unsubscribing from the wrong calendar in Google Calendar and importing the correct one should resolve this issue. For more information, please see Google’s documentation [Delete or unsubscribe from a calendar](https://support.google.com/calendar/answer/37188?hl=en&co=GENIE.Platform%3DDesktop). After you’ve removed the incorrect schedule, you can try importing the correct one again. Outlook users can review Microsoft's documentation [Delete a calendar in Outlook](https://support.microsoft.com/en-us/office/delete-a-calendar-in-outlook-9ba1364c-bdb0-41be-8f66-eaf96698d021) for more information about deleting a PagerDuty schedule. ### Troubleshooting WebCal Exports Users may occasionally encounter errors when working with exported WebCal feeds in Google Calendar. For example: - Google Calendar displays an error `could not fetch URL`. - A `loading` message appears in Google Calendar, but events are not imported. These errors are typically related to syncing and caching issues in Google Calendar when it fetches a calendar feed that was added by URL. If you do experience this issue, please test the following fixes when initially subscribing to the calendar via URL: 1. Add `?nocache` to the end of the feed URL. 1. **Example**: In place of `webcal://yoursubdomain.pagerduty.com/private/xxxxxxxxxxxxxxxxxxxxxxxxxxxxxx/feed/XXXXXXX`, use `webcal://yoursubdomain.pagerduty.com/private/xxxxxxxxxxxxxxxxxxxxxxxxxxxxxx/feed/XXXXXXX?nocache`. 2. Change `webcal://` to `http://` or `https://` at the beginning of the URL. 1. **Example**: In place of `webcal://yoursubdomain.pagerduty.com/private/xxxxxxxxxxxxxxxxxxxxxxxxxxxxxx/feed/XXXXXXX`, use `http://yoursubdomain.pagerduty.com/private/xxxxxxxxxxxxxxxxxxxxxxxxxxxxxx/feed/XXXXXXX`. ## Reset Your Personal Calendar Feed URLs You may wish to reset the URL associated with your personal calendar feed. This action will update all of your on-call schedules. Please note, these URLs are different from the calendar feed URLs associated with an on-call schedule. 1. In the PagerDuty web app, go to **User Icon** → **My Profile**. 2. Select the tab **User Settings** and click **Regenerate feed URLs**. 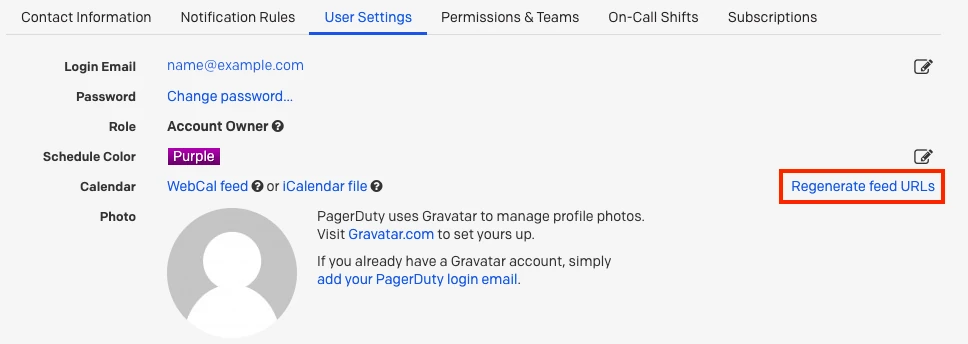 *Select Regenerate feed URLs* 3. Use the newly generated WebCal or iCal links to update your calendar application. --- URL: https://docs.pagerduty.com/incident-management/schedules/shift-based-schedules # Shift-Based Schedules Create and configure shift-based on-call schedules — rotations, restrictions, handoff times, and shift assignment. Use shift-based schedules to map your coverage needs and determine who receives a notification when an incident triggers. When an incident impacts a service, notifications go to the user on the [service’s associated escalation policy](/incident-management/schedules/escalation-policies). Shift-based schedules are the current scheduling experience and differ from [legacy schedules](/incident-management/schedules/schedule-basics) in how coverage is structured. Shift-based schedules are built from named rotations, where each rotation defines active days, active times, a handoff, and a shift assignment type. > **Feature Availability:** If you do not see the option to create a shift-based schedule, your account may not have access yet. Contact your Customer Success Manager (CSM) to confirm availability for your account. > > _Shift-based schedules began rolling out to all accounts in Summer 2026._ > **Required User Permissions:** If you have one of the following roles, you can create, edit, and delete on-call schedules: > > - User > - Manager base roles and team roles > - Manager team roles can only manage schedules associated with their team. > - Admin/Global Admin > - Account Owner ## Create a Basic Schedule A basic shift-based schedule consists of at least one rotation. However, you should have multiple rotations to ensure there are no gaps in the schedule. Each rotation defines the time window during which a user is on call. You can use multiple rotations to create different schedule arrangements and view your on-call coverage at a glance. > **Availability:** Free plans are limited to one schedule. Paid plans do not have a set schedule limit. To create a shift-based schedule in the web app: 1. Navigate to **People** → **Schedules**. 2. Click **+ Create Shift-Based Schedule**. 3. Enter the following schedule details and click **Continue**: | Field | Value | | -------------------------- | ----------------------------------------------------------------------------------------------------------------------------------------------------------------------------------------------- | | **Schedule Name** | Enter a unique name. | | **Description** (Optional) | Enter a description to provide context. | | **Template Options** | Select **Custom**, or choose a [pre-defined template](https://support.pagerduty.com/main/docs/shift-based-schedule-examples) (such as Weekly Handoff, Workday / Weekend, or Follow the Sun) to pre-populate your schedule settings. | 4. Click **+ Create Rotation**. 5. Configure the following rotation settings in the modal: | Field | Value | | --------------------------- | ------------------------------------------------------------------------------------------------------------------------------------------------------------- | | **Rotation Name** | Add a descriptive name that you can clearly identify from the schedule. | | **Time Zone** | Review the time zone for the region. The time zone is set to the account-level time zone by default. Use the dropdown to change to the desired time zone. | | **Rotation Type** | Select a rotation type. You can set it to _Hourly_Daily_, _Weekly_, or _Monthly_. This value determines how frequently users change on-call responsibilities. | | **Active Days of the Week** | Set the active days of the week. You can select specific days or a range that starts and ends on specific days and times. | | **Active Times of Day** | If you selected specific days under **Active Days of the Week**, select the active times of day. | | **Shift assignment type** | Choose whether shifts rotate through individual members or if all team members are on-call at the same time. | | **Handoff** | Select a handoff time to determine specifically when responsibilities must rotate. | | **Members** | Click the **Members** tab to add individual users or [teams](/account-admin/teams) to the rotation. | > **Adding Users:** You can add all users, except Limited and Full Stakeholders, to schedules. If someone does not appear in the dropdown, Admin users or higher can add users to the account. 6. Click **Create Rotation**. 7. Repeat steps 4 through 6 for additional rotations. 8. Click **Save Schedule**. 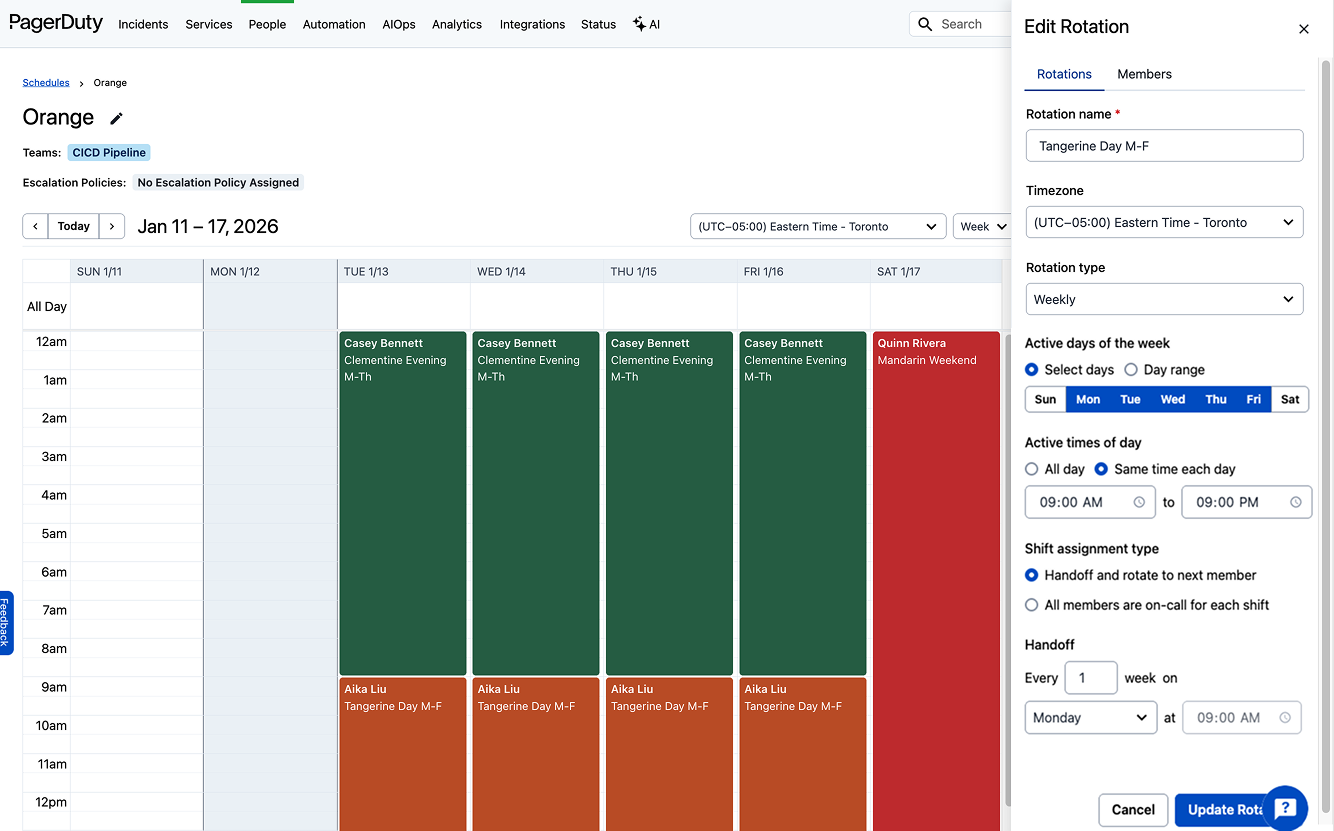 *Basic Schedule* > **Connect a Schedule to a Service:** **Important:** You must connect the schedule to a service via an escalation policy. After you associate a schedule with an escalation policy, on-call users receive notifications about incidents on any service(s) that use the escalation policy. > > Once you create an [escalation policy](/incident-management/schedules/escalation-policies#create-an-escalation-policy), follow the instructions in [Connect a Schedule to a Service via Escalation Policy](/incident-management/schedules/escalation-policies-and-schedules#connect-a-schedule-to-a-service-via-escalation-policy). *** ## Edit Schedules Review the [Edit Schedules article](/incident-management/schedules/edit-shift-based-schedules) for more information. ### Shifts and Overrides Within [Edit Schedules](/incident-management/schedules/edit-shift-based-schedules), you can find content on manual adjustments such as: - **[Custom Shifts](/incident-management/schedules/edit-shift-based-schedules#create-a-custom-shift)**: Create one-off changes to an existing rotation that differ from the recurring pattern. - **[Overrides](/incident-management/schedules/edit-shift-based-schedules#create-an-override-in-the-web-app)**: View, create, or delete manual one-time adjustments (such as vacations or shift swaps). > **Note:** Need help deciding? Learn [when to pick an override versus a custom shift](/incident-management/schedules/edit-shift-based-schedules#deciding-between-an-override-and-a-custom-shift) based on whether you are replacing an existing responder or adding extra coverage to your schedule. ## Schedule Settings Overview To access a rotation's configuration settings: 1. For the desired schedule, select and click **Edit**.  *Edit Rotation* ### Rotation Name When naming your rotation, choose a clear, descriptive name that helps you easily identify it in the schedule. A good naming convention helps distinguish between multiple rotations, especially when managing complex or overlapping shifts. For example: Support - Weekday AM (PST) ### Time Zone When you create a new schedule, it is set to the [account-level time zone](/account-admin/time-zone-settings#change-the-account-level-time-zone) by default. Follow the instructions in [Change the Schedule-Level Time Zone](/account-admin/time-zone-settings#change-the-schedule-level-time-zone) if you want your schedule to have a different time zone than the account. ### Rotation Types Rotation types determine how frequently responsibilities change. - You can set the rotation type to _Hourly_, _Daily_, _Weekly_, or _Monthly_. - For example, _Hourly_ is useful for eight-hour shift coverage, while a _Monthly_ rotation can work better for lower-urgency situations where a single individual remains on call for longer periods. ### Schedule Restrictions When creating a rotation, you can set the following: - **Active Days of the Week:** This option creates uniform shifts for every day of the week and determines the days the rotation is active. You can select either specific days when you are on call or a range that starts on one day at a specific time and ends on another day at a specific time. - **Active Times of Day:** This defines the window during which a responder is on call. You can set the time window for specific days here. > **Note:** If you select **Day range** in **Active days of the week**, this field remains hidden. 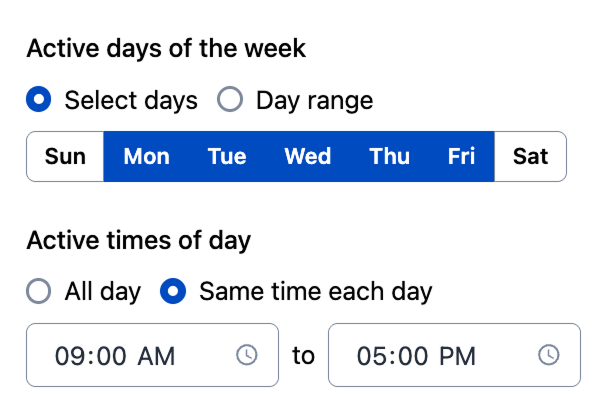 *Active Days and Times* ### Shift Assignment Type Select **Handoff and rotate to next member** to set a handoff time when on-call responsibilities rotate. You can configure this rotation to occur at a set frequency. 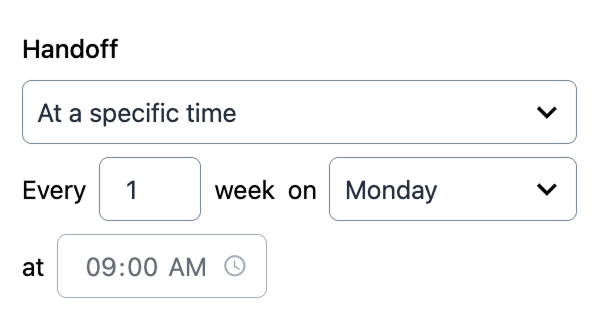 *Handoff Times* If you select **All members are on-call for each shift**, all members assigned to the rotation are on call simultaneously. ### Rotation Start and End - **Rotation starts** defines when the rotation must begin — either immediately or at a specific date and time in the future. - **Rotation ends** specifies when the rotation must conclude. You can configure it to continue indefinitely or specify an exact end date and time. ## Export a Schedule to Your Calendar You can add a schedule to an external calendar application, such as Google Calendar or Outlook, using a calendar feed or file. Choose a **WebCal** feed to subscribe to a live feed that updates as the schedule changes, or an **iCalendar** feed to download a static `.ics` file. 1. Navigate to **People** → **Schedules**. 2. Locate your schedule in the list and click the **Export** dropdown. 3. Select one of the following options: | Option | Description | | :--------------------------------------- | :------------------------------------------------------------------------------------------ | | **WebCal feed — My calendar** | Provides a `webcal://` subscription link for only your own on-call shifts on this schedule. | | **WebCal feed — Everyone's calendar** | Provides a `webcal://` subscription link for all members' shifts on this schedule. | | **iCalendar feed — My calendar** | Downloads an `.ics` file containing only your own on-call shifts on this schedule. | | **iCalendar feed — Everyone's calendar** | Downloads an `.ics` file containing all members' shifts on this schedule. | > **Keep Your Calendar Feed Private:** A WebCal subscription link grants access to your on-call schedule. Treat it like a password — anyone with the link can view the calendar. Do not share it publicly or paste it where others can see it. ## FAQ **Can I create an open schedule with unassigned rotations/shifts?** Yes. You can create an "open" schedule by using a template or building a custom schedule without assigning team members to the rotations. Once you share the blank schedule with unassigned rotations, team members choose their commitment level. They click on the unassigned rotation and select: - **Override:** To claim a single, one-time shift. - **Edit Rotation:** To join the rotation for its entire duration. If there is no rotation to insert themselves into, they [create a shift](/incident-management/schedules/edit-shift-based-schedules#create-a-custom-shift). > **Tip:** After your team finishes signing up, check the schedule for any remaining unassigned shifts to ensure you have 100% coverage. **Can I create a future schedule to prepare for team changes or new hires?** Yes. This feature allows you to prepare for team changes — such as a new hire starting next month — without disrupting the current live on-call rotation. 1. Navigate to the schedule where you want to create a future rotation. 2. On the rotation card, select the menu and click **Edit**. 3. From the **Updates take effect** dropdown, select **On a specific date** and choose a date. 4. Add the new team member to the **Members** list. 5. Click **Update Rotation**. 6. Click **Save Schedule**. > **Note:** The system generates a _pending update_ card indicating when these changes take effect. Once the chosen date passes, the update card disappears, and the member automatically integrates into the rotation.
--- URL: https://docs.pagerduty.com/incident-management/schedules/shift-based-schedules/api-upgrade-examples # Shift-Based Schedules: Upgrading to the V3 Shift Schedules API Implementation and compatibility notes for upgrading internal automations to the V3 Shift Schedules API The V3 Shift Schedules API replaces the legacy V2 Layers logic with a redesigned, shift-based architecture. This upgrade allows internal tools and automations to manage schedules with the same precision as modern calendar standards (iCal). By moving away from the complexity of the old layers-based schedules, the V3 API provides exact control over rotations, supporting multi-responder shifts, automated recurring patterns, and "shadow rotations" for seamless onboarding. Upgrading ensures internal tools can leverage these granular controls, providing a more reliable and scalable foundation for teams' on-call logic. ## Implementation & Compatibility To maintain service continuity while you adopt these new features, please note the following: - **API Specificity:** Shift-based schedules are exclusive to the V3 API; therefore, internal automations must be upgraded to V3 to interact with new shift-based configurations. - **Coexistence:** Existing legacy schedules will continue to function via the V2 endpoints. We recommend a hybrid approach; use V3 for all new schedules while maintaining V2 for your historical data. - **Upgrade Path**: V2 schedules will remain fully supported and operational. An automated tool to help transition legacy schedules to the new format is currently in development. > **Developer Resources:** Explore our [API docs and integration examples](/developer/schedules-v2-to-v3-upgrade). --- URL: https://docs.pagerduty.com/incident-management/services # Services and Integrations Create a service and add integrations to begin receiving incident notifications A technical service reflects a discrete piece of functionality that is wholly owned by one team. One or more technical services combine to deliver business capabilities. You can add one or more [integrations](/integrations) to a technical service to receive events from those tools. > **Best Practices:** Read the [Full Service Ownership](/ops-guides/service-ownership) guide when creating new services. This guide provides best practices that software delivery operations teams can use to ensure they are equipped to fully own their services. > **Required User Permissions:** The following roles can create, edit, and delete services: > > - User > - Admin > - Manager base roles and team roles. Manager team roles can only manage services associated with their team. > - Global Admin > - Account Owner ## Create a Service To create a service in the web app: 1. Navigate to **Services** → **Service Directory** and click **New Service**. 2. Enter the following details: | Field | Value | | --------------- | -------------------------------------------------------------------- | | **Name** | Enter a name based on the function that the service provides. | | **Description** | Enter a description based on the function that the service provides. | | Click **Next**. | | 3. Select **Generate a new escalation policy** or **Select an existing escalation policy**. Click **Next**. - If you generate a new escalation policy, you are the first-level on-call for the service. You can [edit the escalation policy](/incident-management/schedules/escalation-policies#edit-an-escalation-policy) at any time after the service is created. 4. Configure **AIOps** settings: > **AIOps Notes:** - Alert grouping is only available with the [PagerDuty AIOps](/ai-automation/aiops/overview) add-on product. If you do not have PagerDuty AIOps, you skip ahead to **Integrations** in step 5. > - On AIOps plans, all newly created services have AIOps enabled by default. Refer to the [Manage AIOps](/incident-management/services/configurable-service-settings#manage-aiops) section for steps to disable AIOps after service creation. > - On PD Reliability Platform plans, Signal Intelligence is disabled by default on newly created services and Event Orchestrations. Select one of the following options: - **[Intelligent](/ai-automation/aiops/noise-reduction/alert-grouping/intelligent-alert-grouping)**: Select this option to group intelligently, based on alert content and past groups. - **[Content-Based](/ai-automation/aiops/noise-reduction/alert-grouping/content-based-alert-grouping)**: To group alerts when contents of specified alert fields match, click **Create Grouping** and select your alert grouping criteria. You can choose to group alerts based on **Any** or **All** of the following fields, then select your preferred **Field Name**. - **[Unified Alert Grouping](/ai-automation/aiops/noise-reduction/alert-grouping/unified-alert-grouping)**: Combines content-based alert grouping and intelligent alert grouping with a flexible time window. - **[Time-Based](/ai-automation/aiops/noise-reduction/alert-grouping/time-based-alert-grouping)**: To group for a selected duration, select your preferred **duration** from the dropdown. - **Turn Off Alert Grouping**: Select this option if you do not want to use alert grouping. Click **Next**. 5. **Integrations**: Select the integrations you use to send alerts to this service from the search bar, dropdown, or from the list of most popular integrations. - If you do not want to add an integration, click **Create service without an integration** at the bottom of the page. 6. Click **Create Service**. - If you add an integration to your service, you are directed to the service’s **Integrations** tab, where you can find the integration guide, along with an integration key. **Follow the integration guide instructions to complete configuration**. Once you complete the integration guide instructions, your service configuration is complete. - If you do not add an integration to the service, no further configuration is necessary. - You can also customize your service to include other attributes such as [urgency](/incident-management/services/configurable-service-settings#notification-urgency), [acknowledgment timeouts](/incident-management/services/configurable-service-settings#acknowledgement-timeout), [auto-resolution](/incident-management/services/configurable-service-settings#auto-resolution), or [incident workflows](/ai-automation/automation/incident-workflows). ## Edit Service Settings To edit an existing service's settings: 1. Navigate to **Services** → **Service Directory** and select or search for your service. 2. Click **Edit** to the right of the [service detail or setting](/incident-management/services/configurable-service-settings) you want to change. 3. Once you edit your preferred settings, click **Save changes**. ### Edit a Service's Escalation Policy 1. Navigate to **Services** → **Service Directory** and select or search for your service. 2. Select the **Settings** tab and click **Edit** to the right of **Assign and Notify**. 3. Under **Assign to escalation policy**, search for and select an escalation policy. 4. Click **Save changes**. ## Disable and Re-Enable Services Disabling a service is a choice in the following cases: - A service is no longer in use and you want to preserve its settings for future use. - To prevent incidents from triggering. Disabling a service is similar to [putting a service in maintenance mode](/incident-management/services/maintenance-windows). New incidents do not trigger while a service is in either of these states. The main difference is that a maintenance window eventually ends and brings a service back online. A disabled service must be manually re-enabled. ### Disable a Service 1. Navigate to **Services** → **Service Directory** and select or search for your service. 2. On the right side, navigate to **More** → **Disable Service**. 3. In the confirmation dialog, click **Disable**. ### Re-Enable a Service 1. Navigate to **Services** → **Service Directory** and select or search for your service. 2. On the right side, navigate to **More** → **Enable Service**. ## Delete a Service 1. Navigate to **Services** → **Service Directory** and select or search for your service. 2. In the top right, navigate to **More** → **Delete Service**. 3. Read the confirmation modal and click **Delete Service**. ## Add Integrations to an Existing Service You can add more than one integration to a service, which allows you to represent the components in your tech stack as services in PagerDuty. Components can be applications, micro-services in an application’s architecture, or cross-cutting shared infrastructure (for example, networks and security). Consolidating integrations into appropriate services also helps improve accuracy with service-level reporting in [Insights](/incident-management/analytics/insights) reports. 1. In the [Integrations Directory](/integrations), search for and select your integration's guide. 2. Navigate to **Services** → **Service Directory** and select the service where you want to add the integration. 3. Select the **Integrations** tab and click **Add another integration**. 4. Select the integrations you use to send alerts to this service from the search bar, dropdown, or from the most popular integrations list. 5. Click **Add**. > **Product Limit:** A service cannot have more than 250 integrations. 6. Find your integration in the list and click on the right to view and copy your **Integration Key**. 7. Continue with the instructions in the integration guide to complete configuration. For information on how to add extensions to a service, refer to [Extensions](/integrations/extensions). ## Edit an Integration To edit an integration that exists on a service: 1. Navigate to **Services** → **Service Directory** and select or search for the service with the integration you want to edit. 2. Select the **Integrations** tab and click the gear icon to the right of your integration. 3. In the top right, click **Edit Integration**. 4. Enter a new value for the **Integration name**. 5. Click **Save changes**. ### Generate a New Integration Key You can rotate an integration key for routine security or if it becomes compromised. 1. Navigate to **Services** → **Service Directory** and select or search for the service with the integration key you want to rotate. 2. Select the **Integrations** tab and click the gear icon to the right of your integration. 3. In the top right, click **Edit Integration**. 4. Select **Generate a new integration key** - A browser alert asks you to confirm your decision before generating the new key. If you click **Cancel**, the integration key remains unchanged. If you confirm the change, the key is overwritten immediately, even if you leave the edit page. 5. Click **Save changes**. ### Move an Integration to Another Service You can move an integration from one service to another. You can move integrations between as many services as needed, as many times as needed, and all incidents tied to that integration follow. > **Note:** - Your integration key does **not** change after moving the integration from one service to another. > - If there are more than 8,000 open (that is, triggered or acknowledged) incidents associated with an integration, you cannot move the integration unless you resolve some first. [Contact the Support team](https://www.pagerduty.com/contact-us/#contact-support) if you want to move an integration with more than 8,000 open incidents. 1. Navigate to **Services** → **Service Directory** and select or search for the service with the integration you want to move. 2. Select the **Integrations** tab and click the gear icon to the right of the integration. 3. On the right side of the screen, select **Move to Another Service**. 4. In the **Destination Service** dropdown, select the new service where you want to move the integration. > **Note:** If the settings on the destination service differ from the current service, you receive a warning message alerting you to the configuration differences. 5. Select **Confirm & Move Integration**. ## Delete an Integration If an integration is no longer needed, it can be deleted from the service. A deleted integration cannot be recovered. If you need to use the integration again, you can create a new one of the same type on the service. 1. Navigate to **Services** → **Service Directory** and select or search for the service with the integration you want to delete. 2. Select the **Integrations** tab and click the gear icon to the right of the integration you want to delete. 3. On the right side, select **Delete Integration**. 4. Confirm your selection in the dialog window. > **Note:** - To temporarily deactivate an integration instead, you can either place the service in [maintenance mode](/incident-management/services/maintenance-windows), or temporarily [move the integration](/incident-management/services/services-and-integrations#move-an-integration-to-another-service) to an inactive service. > - When an integration is deleted, PagerDuty does not remove the incidents. There are no changes to the open or resolved incidents. ## Create a Generic Events API Integration If there is not an out-of-the-box integration for your tool, so long as your system can make outbound HTTP calls, you can integrate using the Events API. > **Required User Permissions:** The following roles can add integrations: > > - Manager\* > - Admin > - Global Admin > - Account Owner > > \*Permissions for adding integrations can vary. Check for notes on requirements in the introduction of the integration guide. To add a generic integration: 1. Follow the instructions to [add an integration to an existing service](#add-integrations-to-an-existing-service), or to [create a service with an integration](#create-a-service), and select **Events API V2** or **Events API V1** on the Integrations page. 2. Once complete, you can find the **Integration Key** in the Integrations tab by clicking to the right of the integration. Use this key in your monitoring tool to send events to PagerDuty. ### Events API v2 The Events API allows monitoring tools to directly send events in the [PD-CEF](/developer/api/pd-cef) format. If you are using custom monitoring, you can also use this format to take advantage of PD-CEF's display and workflow features. ## Create a Vendor Specific Service via API You can create a service with a vendor-specific integration (for example, AWS CloudWatch) via the [REST API](/developer/rest-api-overview). You must know the vendor details, which are not shown in the web app, but can be obtained from the [Vendors API](/developer/api/reference/rest/vendors/get-vendor). Afterward, you can create a [new service](/developer/api/reference/rest/services/create-service) or [new integration](/developer/api/reference/rest/services/create-service-integration) with the details you received from the Vendors API. ## FAQ Events API v2 is designed to handle machine-generated monitoring and event data, such as infrastructure monitoring (Nagios, SignalFX, Datadog), application performance monitoring (New Relic, AppDynamics), and external site checks (Pingdom, Wormly). For human-generated events, tickets, or incidents, such as those from ServiceNow or JIRA, use the [REST API](/developer/api/reference/rest/incidents/create-incident) to enable direct, streamlined creation of PagerDuty incidents. If you are using a custom monitoring tool, library, or script that has not yet been updated to v2, select [Events API v1](/developer/events-api-v1-overview). --- URL: https://docs.pagerduty.com/incident-management/services/business-services # Business Services Create business services to model how technical services support your business infrastructure and to communicate incident status to non-technical stakeholders Business services allow you to model capabilities that span multiple technical services and that may be owned by several different teams. Mapping [technical services](/incident-management/services/services-and-integrations) to business services gives responders context on an incident’s impact to the business. [Status Pages](/incident-management/communicate/status-pages-overview) use business services to let non-technical stakeholders see when there is an incident affecting one of the business services they care about. Business services should be: - Recognizable to non-technical stakeholders - Supported by one or more [technical services](/incident-management/services/services-and-integrations) in PagerDuty You may have business services listed on an external status page, within a service catalog/CMDB, or defined in relation to existing health metrics from a monitoring tool. > **Required User Permissions:** Admin, Manager, Global Admin and Account Owner base roles can create and edit business services. Managers must have Manager level access to the Team associated with the business service. > > If you are not sure what role you have, or if you need your permissions adjusted, visit our sections on [Checking Your User Role](/account-admin/user-roles#check-your-user-role) or [Changing User Roles](/account-admin/user-roles#edit-user-roles). ## Create a Business Service 1. In the PagerDuty web app, navigate to **Services** → **Business Services** and click **New Business Service**. 2. Enter the following information: | Field | Description | | :-------------- | :------------------------------------------------------------------------------------------------------------------------------------------------------------------------------------ | | **Name** | Enter a meaningful name that will define the business service. | | **Owner** | Enter the owner as yourself or a point of contact for the business service. _(Optional)_ | | **Team** | Select a [Team](/account-admin/teams) associated with this business service. _(Optional)_. Only available on Business, Enterprise for Incident Management and Digital Operations (Legacy) plans. | | **Description** | Provide a description of what the business service is responsible for. | 3. Under **Services**, select the **Technical Services** or **Business Services** tab and then search and select [supporting services](#supporting-services) by clicking to the right of the service's name. 4. Click **Create Business Service** to save. > **Non-Critical Technical Services:** Sometimes there is a technical service that supports a business service, but is not critical to its function. You may prefer to omit **non-critical technical services** that support a business service, since a disruption to one of those technical services does not necessarily mean that the business service is disrupted. ## Edit a Business Service 1. Navigate to **Services** → **Business Services** and select the **name** of the desired business. 2. To the right of the business service’s name, click **Edit**. 3. In the edit view, make the required changes and click **Save Changes**. ## Edit Business Services Settings An incident must have a [priority](/incident-management/incidents/incident-priority) in order to affect a business service. By default, incidents on a supporting technical service with **any** priority will affect a business service. Alternatively, you can configure a business service to require that incidents meet a specified priority threshold. 1. Navigate to **Services** → **Business Services** and click . 2. Select when you would like business services to show an incident: - **If a supporting technical service has an open incident with any priority assigned** _or_ - **If a supporting technical service has an open incident with a priority at or above** and select the **priority level**. 3. Click **Save Changes**. ## Delete a Business Service 1. Navigate to **Services** → **Business Services** and select the **name** of the desired business. 2. Select **More** → **Delete Business Service**. 3. In the confirmation dialog, select **Delete Service**. ## Supporting Services Supporting services are [technical services](/incident-management/services/services-and-integrations), or even other business services, that a business service requires in order to be considered operational. If one of the supporting services mapped to a business service experiences an incident with a qualifying [priority](/incident-management/incidents/incident-priority), this business service will be impacted and appear on [Status Pages](/incident-management/communicate/status-pages-overview). ## Service Graph The [Service Graph](/incident-management/services/service-graph) visually maps how Business Services connect with technical services across your infrastructure, helping teams quickly understand service dependencies and assess incident impact on business-critical functions. ## Subscribe to Business Services After defining business services, users can subscribe so that they are notified whenever there is an impacting incident. Please read [Business Service Subscription](/incident-management/services/business-services/subscription) for more information. --- URL: https://docs.pagerduty.com/incident-management/services/business-services/subscription # Business Service Subscription Subscribe others, or self-subscribe to business services and incidents Business service subscriptions allow you to automatically receive updates about incidents impacting key business services. Admins, Managers and the Account Owner can choose to subscribe all users, or specific users and Teams to business services as part of their PagerDuty account setup. You can also self-manage your subscriptions. A combination of admin and self-managed business service subscriptions increases the number of users subscribed to business services, which keeps stakeholders informed during major incidents. 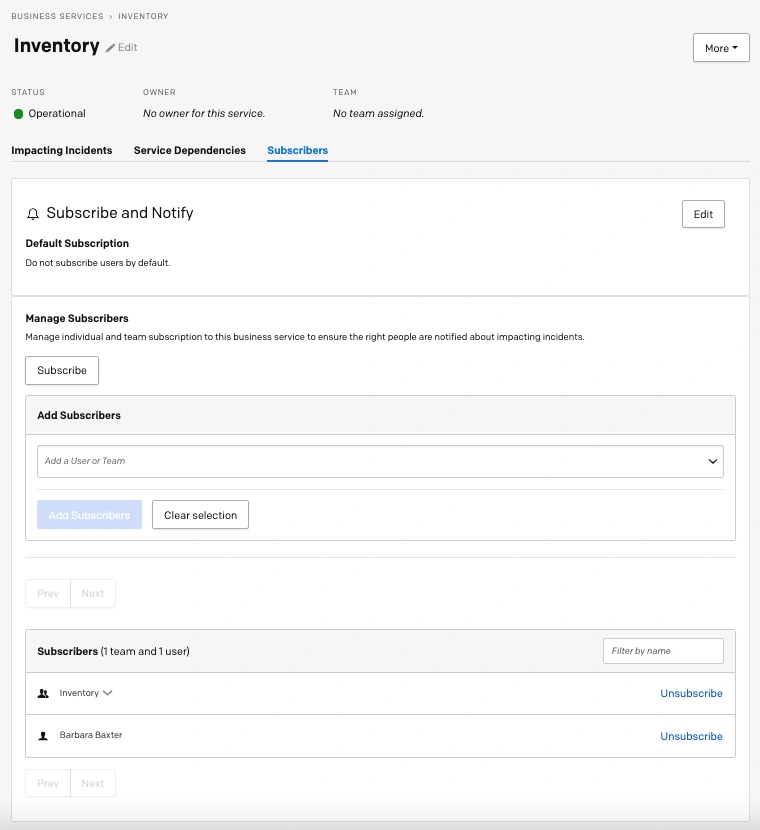 *Business service subscribers* > **Pricing Plans:** Business service subscription is available on PD Reliability Platform plans. It's also available on the following pricing plans: Business, Digital Operations (legacy) and Enterprise for Incident Management. Please [contact our Sales team](https://www.pagerduty.com/contact-sales/) if you would like to upgrade to a plan with business service subscription. ## Manage Business Service Subscriptions ### Subscribe Users and Teams to Business Services > **Required User Permissions:** - Manager, Admin and Account Owner base roles can add subscriptions for other users. Manager Team roles may add subscribers to business services associated with their Team. > - All users can view, add and manage their own self-subscriptions. To self-subscribe, or subscribe another user to a specific business service: 1. Navigate to **Services** → **Business Services** and click the **name** of your preferred Business Service. 2. Select the **Subscribers** tab and click **Edit**. 3. Click the **Add Subscribers** dropdown and search and select your preferred users or Teams. 4. Once you have selected your users and/or Teams, click **Add Subscribers**. The new subscribers appear in the **Subscribers** list below. > **Default Subscription:** You can configure a business service to automatically subscribe all users. When editing the business service, set the **Default Subscription** to **Subscribe all users and any future users**. #### Subscribe Users via User Profile You can also self-subscribe or subscribe users to a business service through the User Profile: 1. Navigate to **People** → **Users** → select the desired **User** → **Subscriptions** tab. 2. Search and select the **Business Service(s)** that you would like to subscribe the user to and then click **Add Business Services**. #### Subscribe Teams via the Team Page Teams can also subscribe to a business service through the Team details page: 1. Navigate to **People** → **Teams** → select your **Team** → **Subscriptions** tab. 2. Search and select the **Business Service(s)** that you would like to subscribe your Team to and then click **Add Business Services**. #### Subscribe to Business Services in the Mobile App You can self-subscribe to a business service from the mobile app: 1. In the mobile app, navigate to **More** → **Status Dashboard**. 2. Tap the **Business Service** you would like to subscribe to and then tap in the upper right to subscribe. The icon will turn blue when you have successfully subscribed and you will see a confirmation dialog at the bottom of the screen. ### Unsubscribe Users and Teams from Business Services To unsubscribe yourself, other users or Teams from a business service: 1. Navigate to **Services** → **Business Services** and click the **name** of your preferred Business Service. 2. In the **Subscribers** list, click **Unsubscribe** to the right of the user or Team name. #### Unsubscribe Users via the User Profile You can also unsubscribe yourself, other users or Teams from a business service through the User Profile: 1. Navigate to **People** → **Users** → select the desired **User** → **Subscriptions** tab. 2. In the **Business Service(s)** list, locate the desired business service and click **Unsubscribe** to the right. #### Unsubscribe Teams via the Team Page Teams can also unsubscribe from a business service through the Team details page: 1. Navigate to **People** → **Teams** → select the desired **Team** → **Subscriptions** tab. 2. In the **Business Service(s)** list, locate the desired business service and click **Unsubscribe** to the right. > **Team Subscriptions:** - You cannot unsubscribe individual users if they were subscribed via a Team to a business service. > - A user will not see a business service subscription on their User Page if they were added via a Team. > - Users added to a Team will automatically be subscribed to any existing Team business service subscriptions. #### Unsubscribe from Business Services in the Mobile App You can unsubscribe yourself from a business service from the mobile app: 1. In the mobile app, navigate to **More** → **Status Dashboard**. 2. Tap the **Business Service** you would like to subscribe to and then tap in the upper right to subscribe. The icon will turn white when you have successfully unsubscribed and you will see a confirmation dialog at the bottom of the screen. ## Subscribe to Incidents You can also subscribe users and Teams to individual incidents regardless of business service subscriptions. Please refer to our [Communicate with Stakeholders](/incident-management/communicate/communicate-with-stakeholders) article to learn more. --- URL: https://docs.pagerduty.com/incident-management/services/configurable-service-settings # Configurable Service Settings Customize the incidents' behavior on a service Service settings allow you to customize what actions you would like to be performed when an incident is triggered. Service settings address incident assignment and notifications, noise reduction, coordinating with stakeholders, event rules and remediation resources. By configuring these settings, you can optimize each incident to address your team’s specific needs. > **Required User Permissions:** Users with the following roles can edit services: > > - User > - Admin > - Manager base roles and team roles > - Manager team roles can only manage services associated with their team. > - Global Admin base roles > - Account Owner ## Add an Incident Workflow to a Service You can configure a service to run an [Incident Workflow](/ai-automation/automation/incident-workflows) when an incident triggers and conditions are met. 1. Navigate to **Services** → **Service Directory** and select your preferred service. 2. Select the **Workflows** tab and click **Associate Workflow**. 3. Follow the steps in the Incident Workflow guide to [create or edit a workflow.](/ai-automation/automation/incident-workflows#triggers) ### Remove an Incident Workflow from a Service If you’d like to remove an Incident Workflow from a service: 1. Navigate to **Services** → **Service Directory** and select your preferred service. 2. Select the **Workflows** tab and click on the 3 dots next to the workflow you want to remove. 3. Click **Open in builder** and remove the association with the service. ## Assign to Escalation Policy Every service in PagerDuty is associated with an [escalation policy](/incident-management/schedules/escalation-policies). You can assign a different escalation policy to a service with these steps: 1. In the PagerDuty web app, go to **Services** → **Service Directory** and select the service you wish to edit. 2. Select the **Settings** tab and click **Edit** to the right of **Assign and Notify**. 3. In the **Assign to escalation policy** dropdown, select an escalation policy. 4. Click **Save Changes**. ## Notification Urgency PagerDuty uses the concept of urgency to allow you to customize how responders are notified depending on how critical an incident is. Incidents can be either **high-urgency** (i.e., it requires immediate attention) or **low-urgency** (i.e., it can wait). As an incident responder, this means you can set up notification rules so that you won't be woken up for low-urgency incidents that can be handled in the morning, or you can set a service to notify you with only high-urgency or low-urgency notification methods at specific times of day. > **Low-Urgency Incident Escalation:** In contrast to high-urgency incidents, low-urgency incidents will not automatically move to higher escalation levels if no one acknowledges it. Low-urgency incidents also cannot be manually escalated, only re-assigned. If you need to escalate a low-urgency incident according to the escalation policy on that service, you will need to change it to high-urgency first. There are two steps that go into effectively using Urgencies: - [Step One: Configure Urgencies on a Service](#step-one-configure-urgencies-on-a-service) - [Step Two: Configure User Profiles](#step-two-configure-user-profiles) ### Step One: Configure Urgencies on a Service Urgencies are defined on a service, and all services initially default to **High-urgency notifications, escalate as needed**. To adjust a service’s urgency: 1. In the PagerDuty web app, go to **Services** → **Service Directory** and select the service to edit. 2. Select the **Settings** tab and click **Edit** to the right of **Assign and Notify**. 3. Under **How should responders be notified?**, select one of the following options (depending on your account’s pricing plan, some of these option may not be available): - **High-urgency notifications, escalate as needed** - **Low-urgency notifications, do not escalate** - **Dynamic notifications based on alert severity** - **Based on support hours**: Once selected, select the **days** of the week and the **hours** and **time zone** for your support hours. Next, under **During support hours, use**, select what type of notification urgency you would like during support hours. Under **Outside support hours, use**, select what type of notification urgency you would like outside of support hours. You may also _optionally_ choose to check the box next to **Raise urgency of unacknowledged incidents to high** when support hours start. 4. Click **Save Changes**. 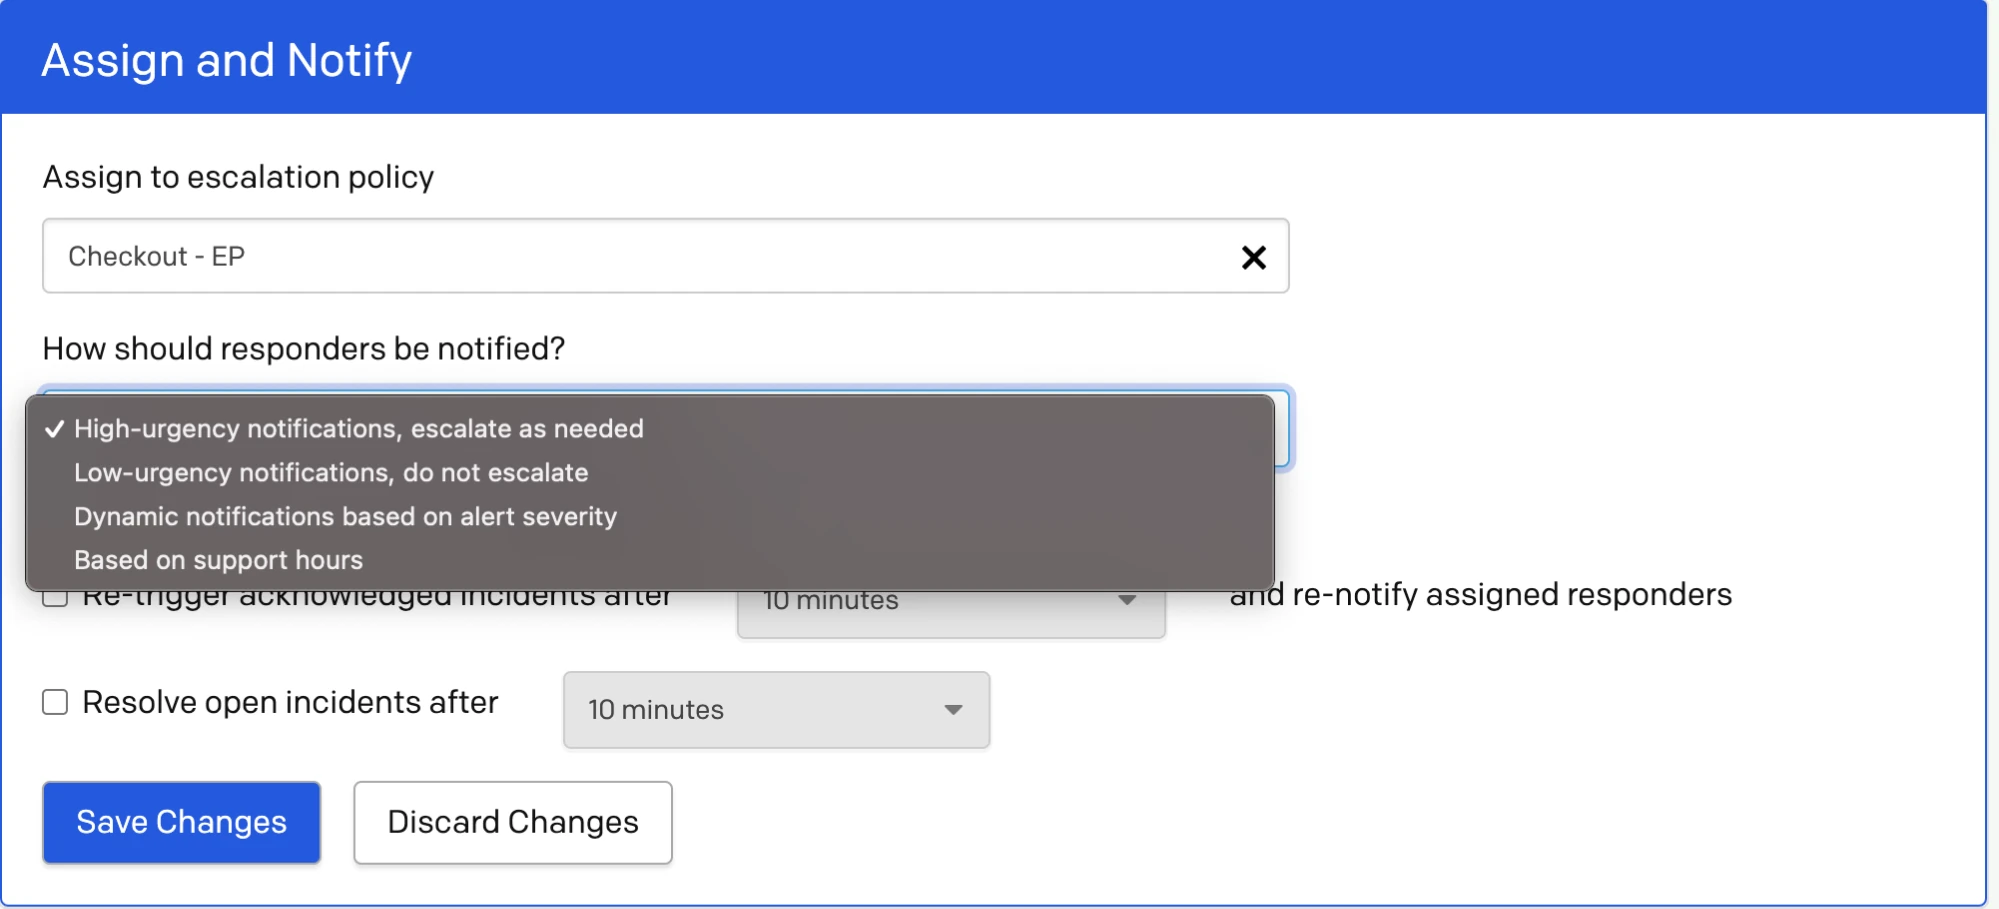 *Select notification urgency* > **Manually Setting Urgency:** If an incident's urgency is set either in the web/mobile app or through the REST API when an incident is triggered, then the selected urgency level will override whatever urgency setting is set on that service. ### Step Two: Configure User Profiles After you’ve configured urgency on a service, responders will specify their notification urgency preferences on their user profile. We recommend creating several tiers of “noisy” notification rules for high-urgency incidents so that on-call responders are notified numerous times until they acknowledge the incident. For low-urgency incidents, however, an on-call responder may want to receive “quieter” notifications, like a push notification or email, or even no notification at all. For more information, see [Notification Rules](/account-admin/user-profile/notification-rules). #### Urgency Use Case: Support Hours Let's take a support team as an example. Since a support team responds to customer inquiries during business hours, we may want incidents to be categorized as critical during business hours and non-critical after hours. The following options are available both **During support hours** and **Outside support hours**: 1. **High-urgency notifications, escalate as needed** 2. **Low-urgency notifications, do not escalate** 3. **[Dynamic notifications](/incident-management/incidents/dynamic-notifications) based on alert severity** Beneath your support hours there is an option **When support hours start, raise urgency of unacknowledged incidents to high**. With this feature enabled, all open incidents on the service will become high-urgency when your support hours begin, and responders will receive notifications based on their high-urgency notification rules. Notifications will continue until a responder acknowledges or resolves the incident. 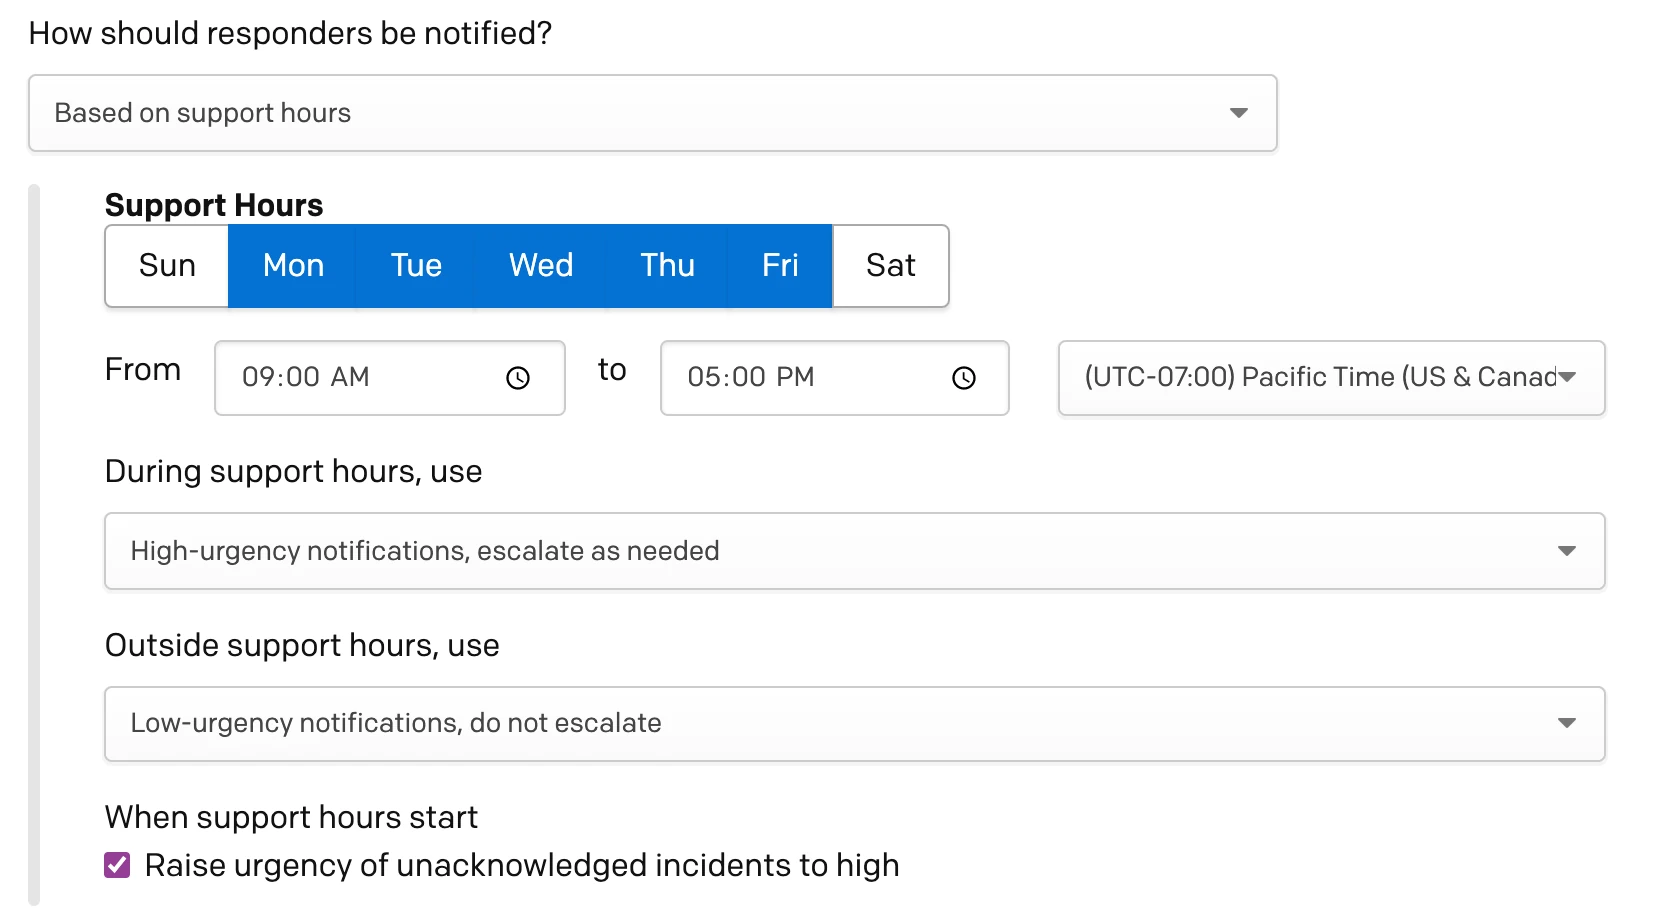 *Set support hours Monday through Friday, 9:00 a.m. to 5:00 p.m.* This setting is useful for teams who rely on support hours to give their people a rest during off-hours, but want to make sure that any incidents that trigger outside of business hours will be promptly handled once business hours begin again. Please note that the **From** and **to** times are for _each_ day. If you select two or more continuous days, then the start and end times apply to each day individually. > **Manually Triggered Incidents:** When [manually triggering a PagerDuty incident in the web app](/incident-management/incidents/overview#triggerdeclare-an-incident), it is possible to make an urgency selection that overrides the service's support hours settings. ### Edit Urgency If an open incident's urgency has been reassessed, responders can edit its urgency in the web or mobile app. Please read [Edit Incident Urgency](/incident-management/incidents/edit-incidents#edit-incident-urgency) for more information. ## Acknowledgement Timeout Incident acknowledgement timeouts help ensure that an acknowledged incident is not forgotten. This feature is turned off by default. With this feature enabled, an acknowledged incident will **re-trigger** after a specified amount of time. When the incident re-triggers, it re-notifies assigned responders and, if on-call responsibilities have rotated, the current on-call user, too. You can configure the timeout’s length, or turn it off completely, on service’s settings page: 1. Go to **Services** → **Service Directory** and select the service you wish to edit. 2. Select the **Settings** tab and click **Edit** next to **Assign and Notify**. 3. Enable the checkbox **Re-trigger acknowledged incidents after [TIME] and re-notify assigned responders** and select the timeout period from the dropdown. 4. Click **Save Changes**. If you need to set the timeout to a value that is not offered in the web app, you may also adjust it using the [REST API](/developer/api/reference/rest/services/update-service). > **Snooze an Incident:** If you need to quiet an individual incident for a different length of time than the service's incident ack timeout, you can [snooze the incident](/incident-management/incidents/edit-incidents#snooze-an-incident) instead. ## Auto-Resolution If you would like an incident to automatically resolve after a given amount of time, you can set a service to auto-resolve incidents. By default, this feature is not turned on. Auto-resolution is recommended for services that are expected to produce a high number of active incidents, or for monitoring systems that send **trigger** events but not **resolve** events (e.g., some email-based monitoring systems). This feature can be useful when there are a large number of active incidents on a service (such as in a CentralOps/NOC environment), because if an incident is not resolved automatically by a monitoring system or manually by a user, responders may not be aware of any recurrences of the issue. With this feature enabled, an incident automatically resolves after the specified time has passed, and no further notifications will be sent for the incident. Note that an incident contributes to the auto-resolution timer as long as it is in a **triggered** or **acknowledged** state. **Snoozed** incidents will reset the auto-resolution timer. Also please note that this feature will only affect incidents that are created **after it is enabled** and will **not retroactively resolve** incidents that are currently open. > **High Open Incident Volume:** For services with over 100,000 open incidents, we will automatically enable and require to have the [auto-resolve feature](/incident-management/services/configurable-service-settings#auto-resolution) enabled. When this feature is enabled, all new incidents for that particular service will be auto-resolved after they have been open for 24 hours, and no further notifications will be sent for those incidents. > > It will not be possible to disable this feature for the service in question unless the service's open incident count is reduced to under 100,000. To reduce the open incident count, we recommend using the [update an incident API](/developer/api/reference/rest/incidents/update-incident) to bulk resolve incidents. Additionally, you can use [this script](https://github.com/PagerDuty/public-support-scripts/blob/master/mass_update_incidents/mass_update_incidents.py) for an automated way to bulk resolve incidents. ### Configure Auto-Resolution 1. Go to **Services** → **Service Directory** and select your preferred service. 2. Select the **Settings** tab and click **Edit** next to **Assign and Notify**. 3. Mark the checkbox **Resolve open incidents after [TIME]** and select a time period from the dropdown. 4. Click **Save Changes**. If you need to set this to a time period that is not available in the web app, you can do so with our [REST API](/developer/api/reference/rest/services/update-service). ### Turn Off Auto-Resolution 1. Go to **Services** → **Service Directory** and select your preferred service. 2. Select the **Settings** tab and click **Edit** next to **Assign and Notify**. 3. Unmark the checkbox **Resolve open incidents after [TIME]**. 4. Click **Save Changes**. ## Manage AIOps AIOps Service Configuration (Signal Intelligence on PD Reliability Platform) provides you with flexibility and control over how and where AIOps features apply. This feature allows you to enable or disable AIOps on services. Please see our [PagerDuty AIOps](/ai-automation/aiops/overview#aiops-service-configuration) article for more information. > **Required User Permissions:** - Account Owner > - Admin and Global Admins > - Manager base role and team roles > - Manager team roles can only manage services associated with their team > **Disable Behavior:** Please note that when you disable AIOps Service Configuration on a service, you can expect the following to occur: > > - **Event Throughput**: If an AIOps integration key requests an increased throughput and you subsequently disable AIOps, it will default back to a maximum of 120 events/min. > - **Operations Console**: Only incidents created on an AIOps service will be visible. > - **Incidents**: The following features will no longer be available on the service’s incidents: > - Outlier Incident > - Probable Origin > - Past Incidents > - Related Incidents > - Recent Changes > - **Noise Reduction**: The following service features will be disabled, with any relevant data used to enhance the models deleted. > - Auto Pause > - Alert Grouping > - **Recent Changes**: > - The system will block non-AIOps services from creating integrations on the Recent Changes page. > - The system will hide Recent Changes on the Service Activity tab. > - **AIOps Service Orchestration Rules**: Only AIOps-enabled services will have access. The system will skip any existing rules using AIOps-required functionality during event ingestion. > - **Routing to AIOps-Enabled Services Using an Event Orchestration**: Only AIOps-enabled Event Orchestrations can route to AIOps-enabled services. If a non-AIOps Event Orchestration has an invalid routing rule that routes to an AIOps service, the event will still route to the service to ensure it does not miss an incident. However, this incident will have all AIOps features disabled, including skipped Orchestration rules. This may result in unintended consequences such as increased noise. 1. Navigate to **Services** → **Service Directory**. 2. Select your preferred **service** and open the **Settings** tab. 3. Under the **AIOps** section, perform the following based on your use case: - Click **Enable AIOps**. In the confirmation modal that appears, click **Enable** to complete the process. - Click **Disable AIOps**. In the confirmation modal that appears, click **Disable** to complete the process. > **Time to Application:** Changes to AIOps configurations may take up to five minutes to take effect. ## Alert Grouping Alert Grouping allows you to configure a service to group alerts in a variety of ways, thereby reducing noise and accelerating teams’ responses. > **Pricing Plan:** Alert Grouping is available with our PagerDuty AIOps add-on. The feature is also available for the duration of an AIOps trial. Please contact our [Sales Team](https://www.pagerduty.com/contact-sales/) to upgrade to a pricing plan with this feature. To configure a service’s Alert Grouping behavior: 1. Go to **Services** → **Service Directory** and select your preferred service. 2. Select the **Settings** tab and click **New Grouping** or **Edit** in the section **Reduce Noise**. 3. Select one of the following options: - **Intelligent** - **Alert Content** - **Time only** 4. Click **Save Settings**. Read more about each Alert Grouping option: - [Intelligent Alert Grouping](/ai-automation/aiops/noise-reduction/alert-grouping/intelligent-alert-grouping) - [Content Based Alert Grouping](/ai-automation/aiops/noise-reduction/alert-grouping/content-based-alert-grouping) - [Global Alert Grouping](/ai-automation/aiops/noise-reduction/alert-grouping/global-alert-grouping) - [Time Based Alert Grouping](/ai-automation/aiops/noise-reduction/alert-grouping/time-based-alert-grouping) ## Auto-Pause Incident Notifications Automatically pause notifications for transient alerts, giving time for them to resolve before distracting responders. > **Availability:** This feature is available on PD Reliability Platform Plus/Ultimate plans. It's also available as part of the following pricing plans: Digital Operations (legacy) and Enterprise Incident for Management, or it can be purchased via the [AIOps](/ai-automation/aiops/overview) add-on. You can [trial PagerDuty AIOps](/ai-automation/aiops/overview#pagerduty-aiops-trials) or [contact our Sales team](https://www.pagerduty.com/contact-us/#contact-sales) to try this feature. To configure Auto-Pause Incident Notifications on a service: 1. In the PagerDuty web app, go to **Services** → **Service Directory** and select your preferred service. 2. Select the **Settings** tab and click **Edit** next to **Reduce Noise**. 3. In the section **Transient Alerts**, select **Auto-pause incident notifications** and make a selection from the dropdown: - **2 minutes** - **3 minutes** - **5 minutes** - **10 minutes** - **15 minutes** 4. Click **Save Changes**. For more detailed information about this feature, please see [Auto-Pause Incident Notifications](/ai-automation/aiops/noise-reduction/auto-pause-incident-notifications). ## Add a Conference Bridge You can configure a service to include a [Conference Bridge](/incident-management/incidents/conference-bridge) on every incident. PagerDuty supports dial-in numbers and meeting URLs. 1. Go to **Services** → **Service Directory** and select your preferred service. 2. Select the **Settings** tab and click **Edit** next to **Coordinate Responders and Stakeholders**. 3. In the fields **Conference Bridge Dial-In Number** and **Conference Bridge Meeting URL**, enter your conference bridge information. 4. Click **Save Changes**. ## Event Management Event Management can be configured at two different levels: at the service level and at a global level. For more information, see our article on [Event Orchestration](/ai-automation/aiops/event-orchestration). ## Documentation Link You can add a link to documentation that includes routine procedures or troubleshooting steps for a service so that it can be easily referenced during an incident. 1. Navigate to **Services** → **Service Directory** and select your preferred service. 2. Select the **Settings** tab, scroll to the section **Remediate**, and click **Edit**. 3. In the field **Documentation link** enter the full path of the link to your documentation. 4. In the field **Documentation link name**, enter a user-friendly description. 5. Click **Save Changes**. Once configured, responders can view the documentation link in the same section on a service's details page under **Settings** → **Remediate**. ### Delete a Documentation Link 1. Navigate to **Services** → **Service Directory** and select your preferred service. 2. Select the **Settings** tab and click **Edit** to the right of **Remediate**. 3. Click **Remove Documentation**. ## Custom Incident Actions Custom incident actions provide responders with a quick way to execute custom logic housed outside of the PagerDuty system. For more information, please refer to [Custom Incident Actions](/integrations/custom-incident-actions). --- URL: https://docs.pagerduty.com/incident-management/services/custom-fields # Custom Fields on Services Add service metadata to enhance incident management Custom Fields on Services expand PagerDuty’s capabilities by allowing you to define custom metadata for your services. This metadata supports more intelligent incident management, comprehensive reporting, and improved contextual navigation, all of which empower your organization to operate at a higher level of maturity. > **Availability and Limits:** Custom Fields on Services is available with the following pricing plans: > > - **Business** / **PD Reliability Platform Essential**: Up to 15 custom fields > - **Enterprise for Incident Management** / **PD Reliability Platform Plus and Ultimate**: Up to 30 custom fields > > Please note, disabled custom fields do not count towards this limit, however the sum of enabled plus disabled fields cannot exceed 35 for either limit. Please [contact Sales](https://www.pagerduty.com/contact-us/#contact-sales) to upgrade to a pricing plan with this feature. > **Required User Permissions:** The Account Owner and Global Admins can create, edit and delete Custom Fields on Services. > > Users with permission to view and edit a service can also view and edit that service's custom field values. ## Configure Custom Fields on Services 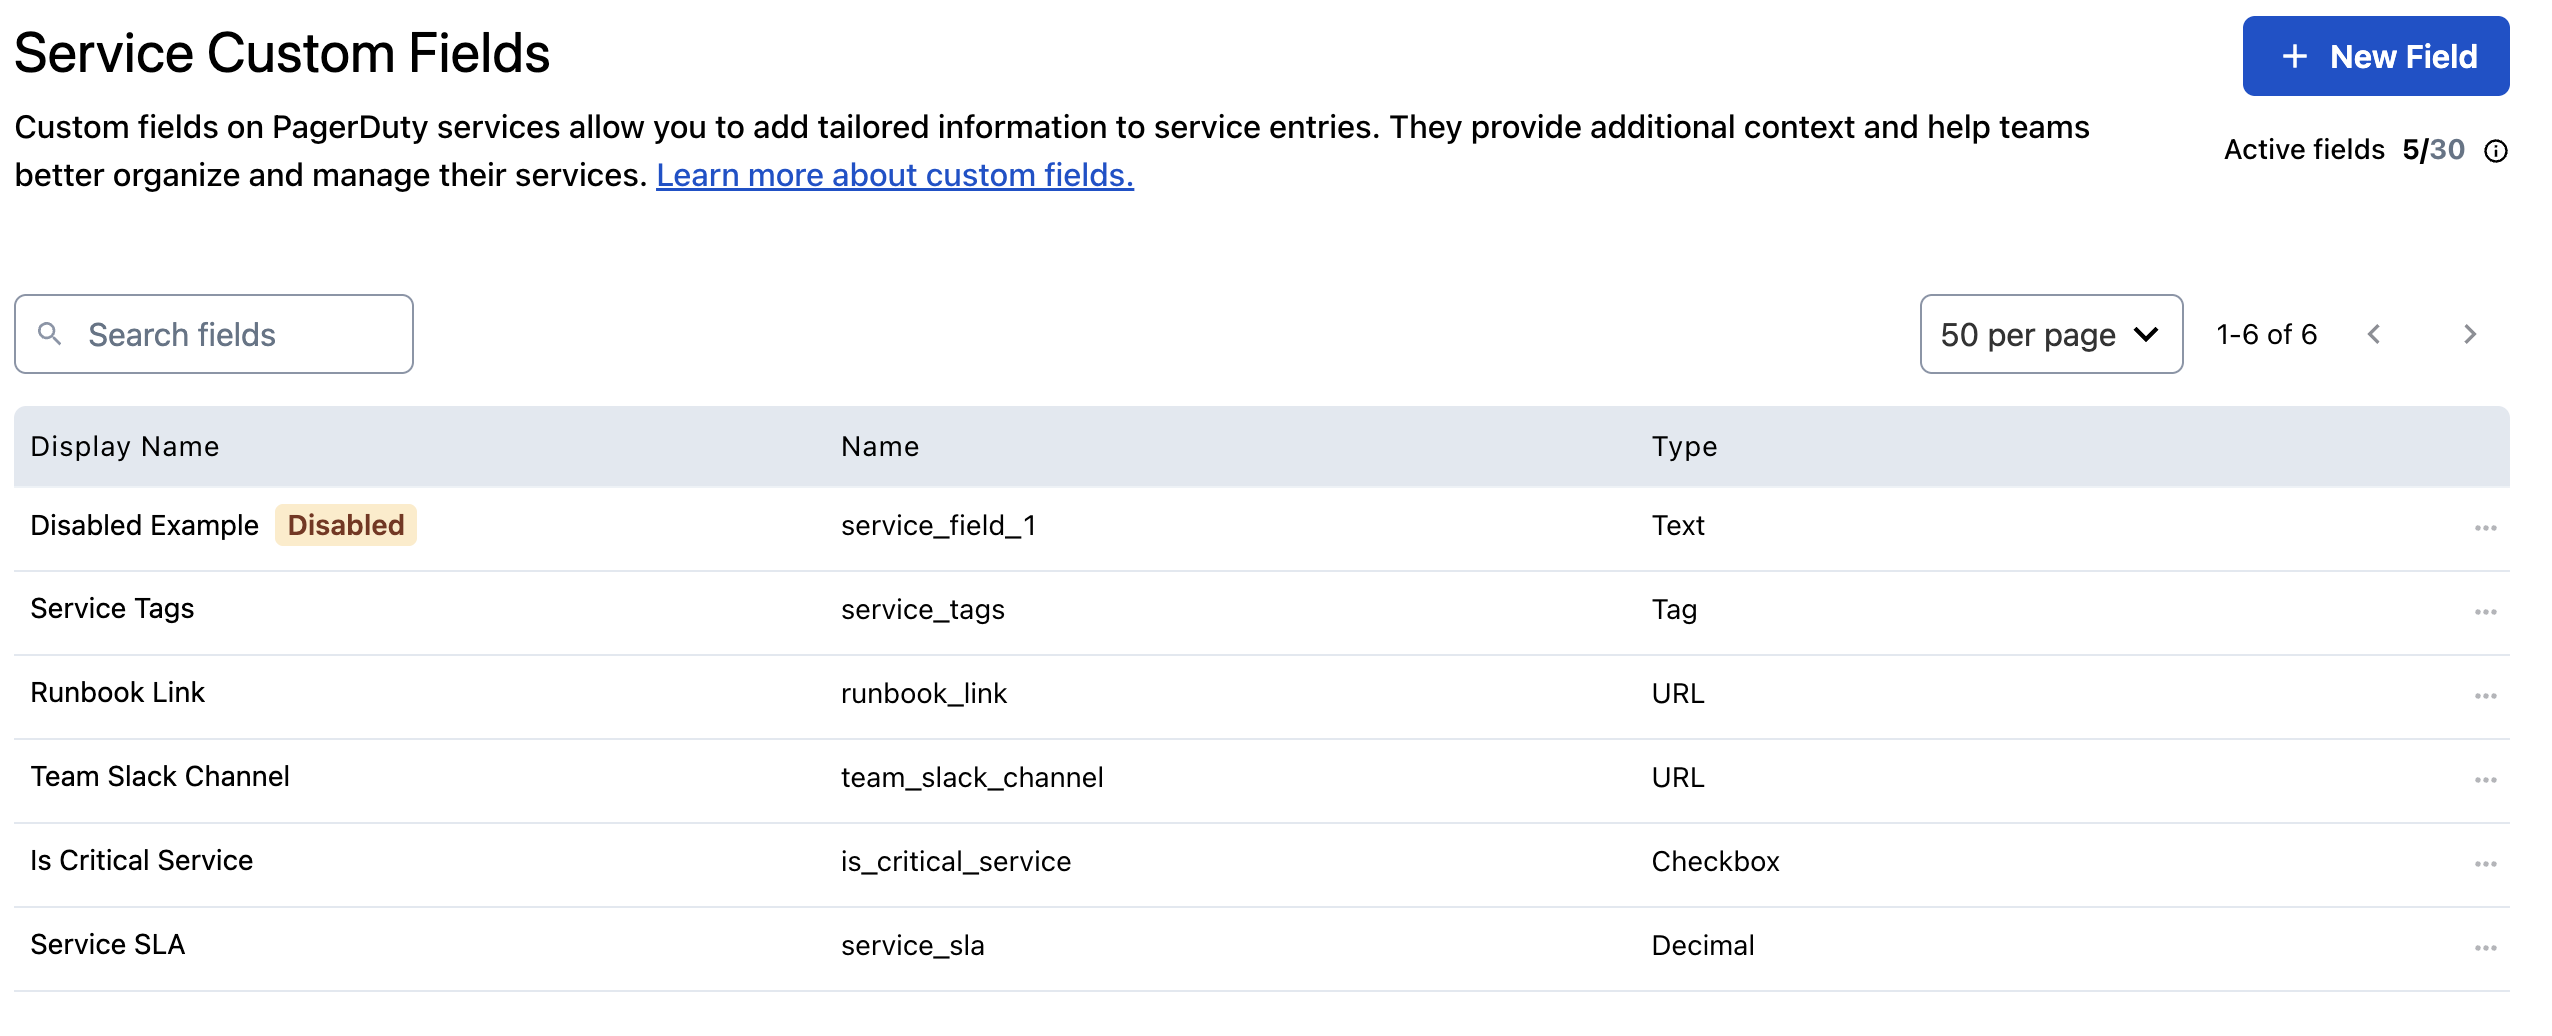 *View and manage Service Custom Fields* ### Create Custom Fields Custom Fields on Services apply across all services on an account. When you create a new custom field, it will appear on all existing and future services in your PagerDuty account. 1. Navigate to **Services** → **Service Custom Fields**. 2. Click **New Field**. 3. Enter the following information: | Field | Instructions | | :----------- | :---------------------------------------------------------------------------------------------------------------------------------------------------------------------------------------- | | Display Name | Enter a name for the field. This name will appear on the service's Custom Fields tab. | | Field Name | Enter a name for use when referencing this field in the API. Can only contain lowercase letters, numbers, and underscores. **Note**: You cannot change this value after initial creation. | | Description | Write a description to help responders understand what this field is or how they should use it. | | Field Type | Select a data type, e.g., **Text**, **Single Select**, **Multi Select**, etc. **Note**: You cannot change this value after initial creation. | | Enable Field | Select **Enable** or **Disable**. Disabled fields remain visible but can’t be edited or have new values added. | 4. Click **Create Field**. Repeat these steps for as many fields as needed. ### Edit Custom Fields 1. Navigate to **Services** → **Service Custom Fields**. 2. Click the menu to the right of the field you would like to edit and select **Edit**. 3. Edit your preferred details and then click **Update Field**. ### Disable a Custom Field When you disable a field, it is no longer editable on services. However, this will not erase values from existing services (i.e., they will still be visible on the service details page). You should disable fields when you want to maintain existing data, but no longer want to use the field. 1. Navigate to **Services** → **Service Custom Fields**. 2. To the right of your desired field, select → **Disable**. 3. In the confirmation modal, click Disable. ### Delete a Custom Field > **Deletion Warning:** Deleting a custom field will permanently delete the field for _all_ services and remove existing data. This action cannot be undone. 1. Navigate to **Services** → **Service Custom Fields**. 2. To the right of your desired field, select → **Delete**. 3. In the confirmation modal, click **Delete**. ## Field Types You can specify the field data type when you add a Custom Field. Data types help standardize and validate field data, preventing users from entering incorrect data types into a field. Custom Field types are: - Text - Single Select - Multiple Select - Tag - URL - Checkbox - Datetime - Decimal - Integer > **Field Restrictions:** You can only set a Custom Field's type once. If you wish to update a Custom Field's type, please delete the old one and create a new one with the preferred type. > > - String values have a maximum of 255 characters. > - Single Select and Multiple Select field types can have a maximum of 55 options. > - A custom field can have a maximum of 55 tags, and one tag can be up to 255 characters. > - URL values can have a maximum of 500 characters. Only absolute URLs are allowed, and must use one of the following schemes: `http`, `https`, `tel`. > - Datetime values must conform to either "full-date" or "date-time" as defined in [RFC3339, section 5.6](https://www.rfc-editor.org/rfc/rfc3339#section-5.6). Examples of supported values: `2025-03-14`, `2024-04-28T11:53:12Z`. ## View Custom Fields To view all Custom Fields on Services, navigate to **Services** → **Service Custom Fields**. To view Custom Fields on a specific service in the PagerDuty web app, navigate to **Services** → **Service Directory**, select your preferred service, and select the tab **Custom Fields**. 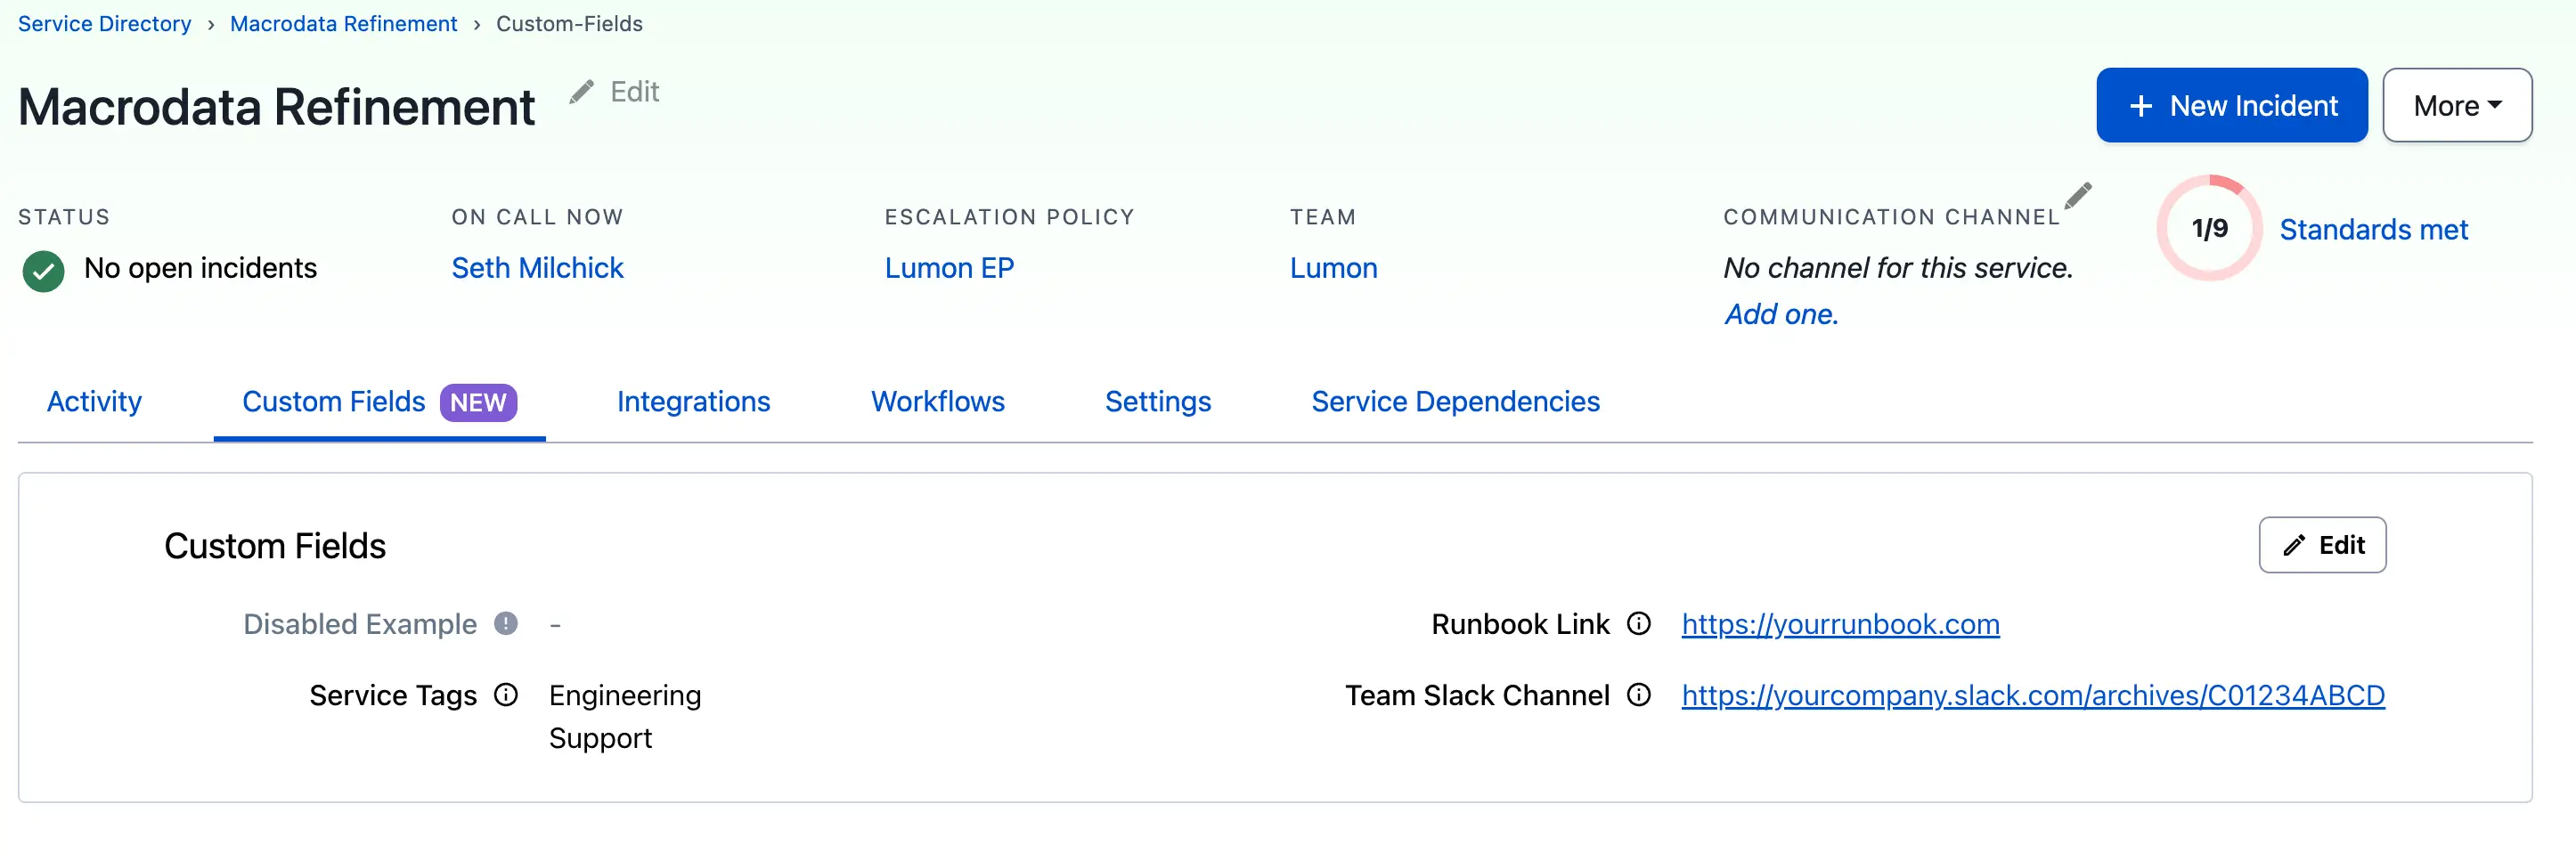 *Custom Fields on Services in the PagerDuty web app* You can also view and search by Service Custom Fields from the Service Directory page using the search bar. The search matches on field values only (not the field names), but both the field name and its value will be displayed in the results. This helps streamline the management and organization of your services, similar to our [contextual search](/account-admin/tagging#filter-objects-by-tag) feature for other objects. 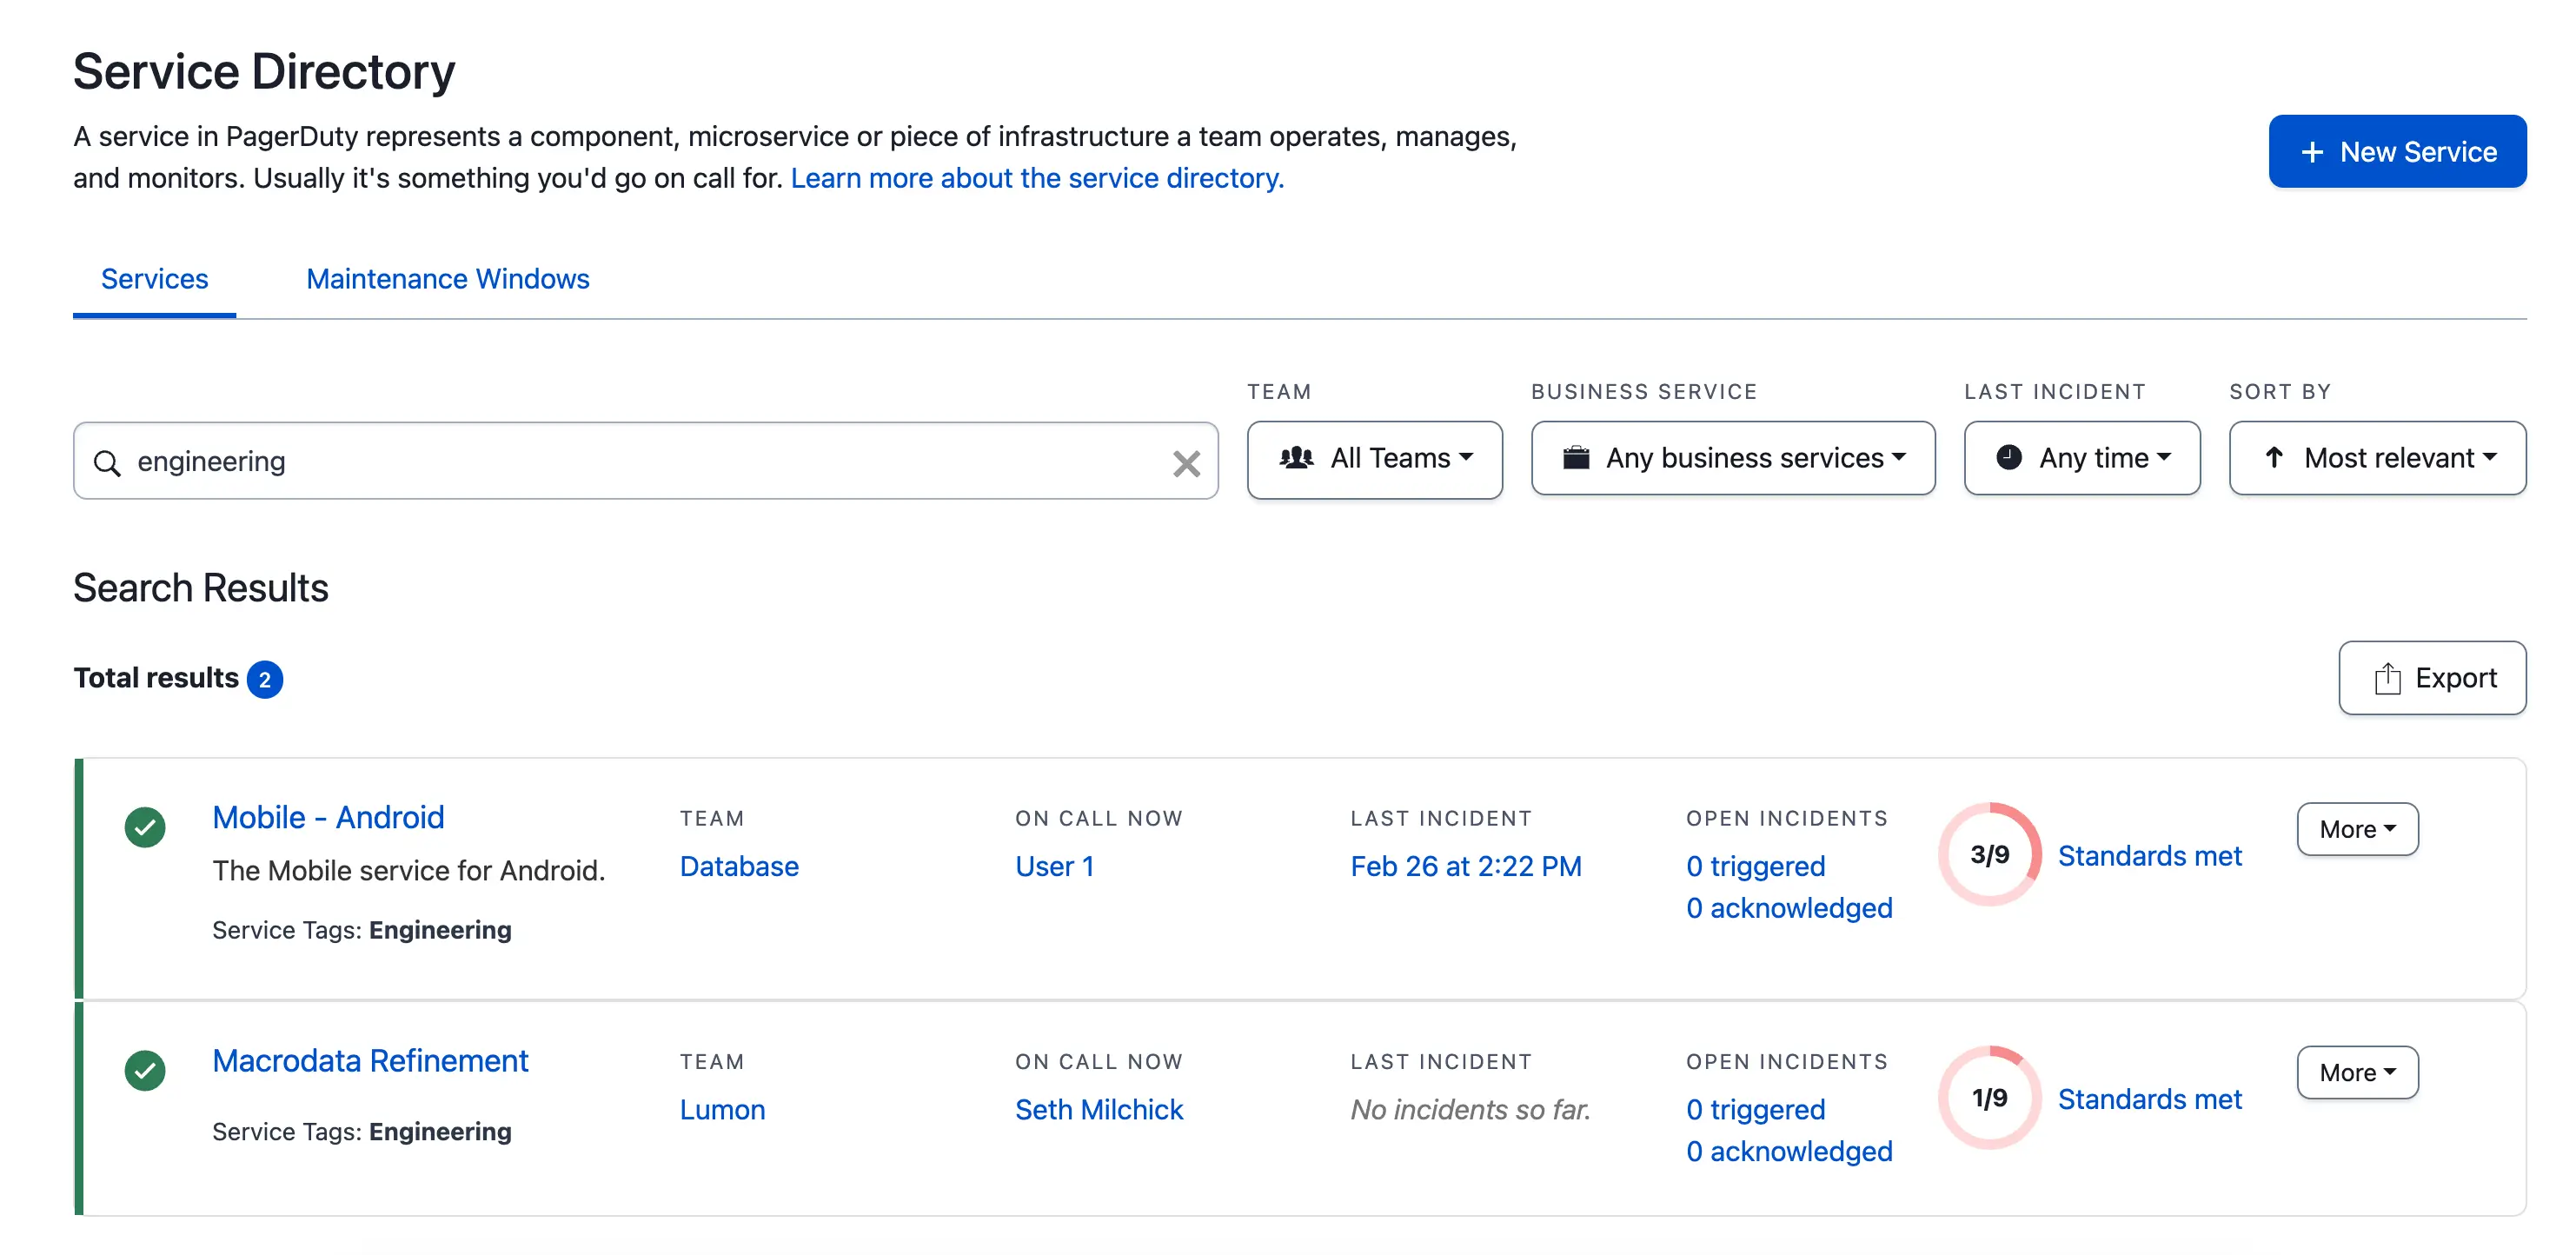 *Search for services by Custom Field values* ## Edit Custom Field Values You can fill out Custom Fields to assist you in service management and incident response. 1. In the PagerDuty web app, navigate to **Services** → **Service Directory** and select your preferred service. 2. On the service's details page, select the tab **Custom Fields** and click **Edit Fields**. 3. Enter your desired value(s) in the applicable field(s). 4. Click **Save**. ## FAQ **Can I create and manage Custom Fields on Services by using Terraform or the API?** Yes, you can create new Custom Fields as well as update, disable or delete existing fields by using our REST API or through Terraform. You can also use these methods to update the Custom Field values on a service. Please refer to our [Developer documentation](/developer/api/reference/rest/service-custom-fields/create-service-custom-field) for more information about using the REST API to manage Custom Fields. Please read our [Terraform engineering blog](https://www.pagerduty.com/eng/how-why-terraform/) and review the [PagerDuty Provider](https://registry.terraform.io/providers/PagerDuty/pagerduty/latest/docs) Terraform documentation for more information about using Terraform. **Can I run reports on Custom Fields on Services data?** Yes, PagerDuty Analytics allows you to leverage the Services Custom Fields you’ve configured to gain deeper insights into how specific services are performing across your organization. To get started, navigate to **Analytics** → **Insights** → **Service Performance**. You can click to open the filter selection. Then select **Add** to choose your desired filters, including Service Custom Fields, to tailor the report to your needs. **Can I sync PagerDuty Custom Fields with ServiceNow incident record fields?** Bi-directional syncing between PagerDuty Custom Fields on Services with ServiceNow incident record fields is currently in development and scheduled for later this year. **Can I view Service Custom Fields in the mobile app?** Service Custom Fields are currently not visible within the mobile app, however the ability to view Custom Fields on the service’s details screen in the mobile app is planned for later this year. --- URL: https://docs.pagerduty.com/incident-management/services/default-mobilization-service # Default Mobilization Service The built-in Default Mobilization EP and schedule handle paging when an incident is declared without an assigned service. When an incident is declared without an impacted service — for example, through [Quick Declare](/incident-management/incidents/quick-declare) — PagerDuty still needs a way to route it and page someone. The Default Mobilization Service is the built-in service that handles this case, so a serviceless incident never goes unassigned. The Default Mobilization Service is a system service that ships with every account. It does not appear in the normal service catalog for selection, and it cannot be deleted or disabled. You do not assign integrations to it. When an incident is backed by this service, its Impacted Service displays as `--` until you set a real service. > **Availability:** The Default Mobilization Service is available on PD Reliability Platform plans. It's also available on Free, Professional, Business, and Enterprise Incident Management plans. It is not available for legacy Digital Operations plans. ## How the Default Mobilization Service Is Structured The Default Mobilization Service consists of: - **Default Mobilization EP** — the escalation policy associated with the service. - **Default Mobilization Schedule** — the on-call schedule on that escalation policy, which determines who is paged. Out of the box, the Default Mobilization EP is empty — no one is on call, so no one is paged automatically. Instead, the responder who declared the incident owns it until someone else is assigned, and you see an in-product alert prompting you to set up the Default Mobilization EP. You can still page users manually at any time using the **Page** button on the incident card. When an administrator has assigned responders to the Default Mobilization EP, those responders are notified as the first responders whenever an incident is declared without a technical service. Either way — empty or configured — setting the impacted service is always the next step toward routing the incident to the team that owns the problem. ## Configure the Default Mobilization Service Configure the Default Mobilization Service so that a known group of responders — for example, a standing set of incident commanders — is paged whenever an incident is declared without a service, instead of no one being paged by default. 1. Navigate to **People** → **Escalation Policies** → **Default Mobilization EP**. 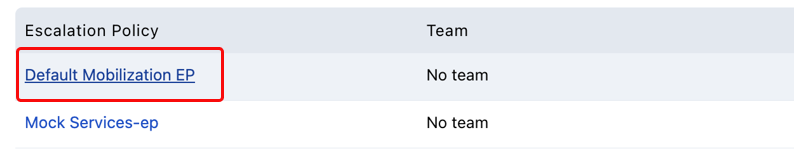 *Default Mobilization EP* 2. Select **Default Mobilization Schedule**. 3. Create [a new rotation](/incident-management/schedules/shift-based-schedules). This rotation determines who is paged when an incident is declared without a service. 4. Click **Save**. > **Required User Permissions:** Configuring the Default Mobilization EP and its schedule follows the same permissions as any other escalation policy. See [Escalation Policies](/incident-management/schedules/escalation-policies) for details. ## Disable Default Mobilization Default Mobilization is enabled by default. An administrator can disable it by navigating to **Account Settings** → **Incident Settings** and deselecting **Allow default mobilization**. By disabling this, the **Impacted Service** field will be required when declaring incidents. 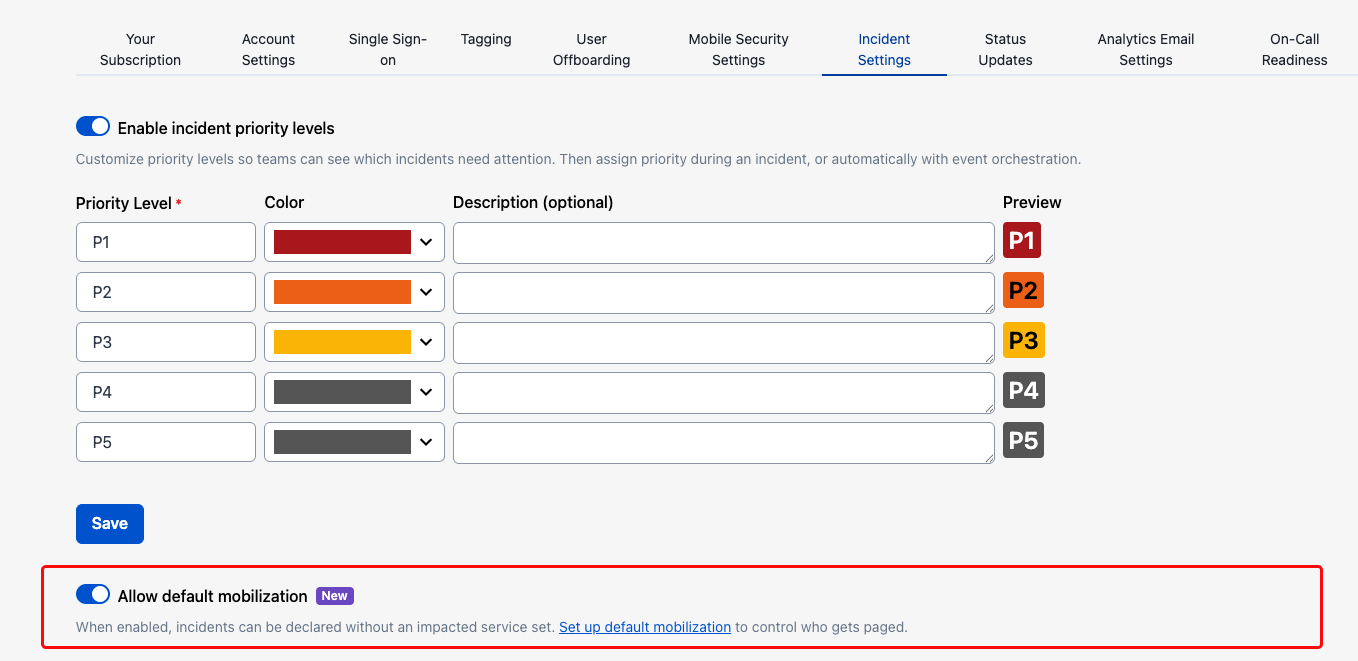 *Allow default mobilization toggle*
--- URL: https://docs.pagerduty.com/incident-management/services/maintenance-windows # Maintenance Windows Temporarily disable a service, along with its integrations and incidents Maintenance windows temporarily disable a service, including all of its integrations, for a set period of time. While a service is in a maintenance window, its integrations are disabled and no new incidents will trigger. When a maintenance window ends, incidents can trigger on the service again. Existing open incidents will not resolve when a maintenance window begins; they will remain open and continue to notify users as expected unless they are manually resolved. Additionally, while a service is in a maintenance window, incidents cannot be resolved through the [Events API](/developer/events-api-v2-overview). > **Required User Permissions:** The following roles can create, edit and delete maintenance windows: > > - User > - Manager base roles and Team roles > - Manager Team roles can only manage maintenance windows associated with their Team. > - Admin/Global Admin > - Account Owner > > If you're not sure what role you have, or if you need your permissions adjusted, visit our sections [Check Your User Role](/account-admin/user-roles#check-your-user-role) or [Edit User Roles](/account-admin/manage-users#edit-user-roles). ## Create a Maintenance Window You can schedule a maintenance window to begin immediately or at a later date and time. ### Web App 1. Navigate to **Services** → **Service Directory** and select a service you’d like to put into maintenance mode. 2. On the service’s detail page, select **More** → **Schedule Maintenance** in the top right. 3. In the **Create Maintenance Window** modal, your service will already be populated under **Services Affected** and you may _optionally_ select other services from the dropdown. 4. _Optional_: Enter a **Description** to give team members context on why the service is going into a maintenance window. 5. Select **Start now and end in** and one of the predefined intervals : **15 minutes, 30 minutes, 60 minutes, 2 hours** or **4 hours**, _or_, to schedule a maintenance window that begins in the future, select **Start at a scheduled time**, select your **Time Zone**, and enter **Start** and **End** dates. 6. Click **Create Maintenance Window**. ### Mobile App To immediately start a maintenance window in the mobile app: 1. Tap **Services** in the bottom navigation and select your preferred service. 2. Tap in the top-right corner. 3. Tap **Create Maintenance Window**. 4. _Optional_: In the section **Description**, tap **Add Description**, enter text describing why the maintenance is happening, and tap **Done**. 5. In the section **Schedule Time**, select a duration (i.e., **End in 15 Minutes**, **End in 30 Minutes**, **End in 60 Minutes**, **End in 2 Hours**, **End in 4 Hours**), _or_ to schedule a maintenance window that begins in the future, select the tab **Schedule Later** and enter start and end times that outline when the maintenance window should be active. - **Note**: Tap **Time Zone** to set the start and end times in your preferred time zone. 6. Tap **Create Maintenance Window**. 7. In the modal, confirm your selection. > **Create Maintenance Windows for Multiple Services:** In the mobile app, you can only create a maintenance window for one service at a time. If you'd like to create maintenance windows for multiple services at once, you can do this in the [web app](#web-app). ## View Maintenance Windows ### Web App You can review which services are in maintenance mode by navigating to **Services** → **Service Directory** and selecting the **Maintenance Windows** tab. This page prominently displays all services that are currently in a maintenance window (i.e., **Maintenance Happening Now**). Below that, the table **All Maintenance Windows** lists all future, ongoing and past maintenance windows. You can restrict results with a search term, service status or Team. The **Services** tab also indicates which services are in maintenance mode. An icon indicates whether a service in maintenance mode: - appears next to a service that is in maintenance mode. - appears next to a service that is disabled. On a service’s detail page, **Maintenance** appears under the **Status** heading while it is in maintenance mode. ### Mobile App To view maintenance windows in the mobile app: 1. Tap **Services** in the bottom navigation and select your preferred service. 2. Tap in the top-right corner. 3. The list view displays all current and future maintenance windows for the selected service. - **Note**: Past and terminated maintenance windows are not displayed. 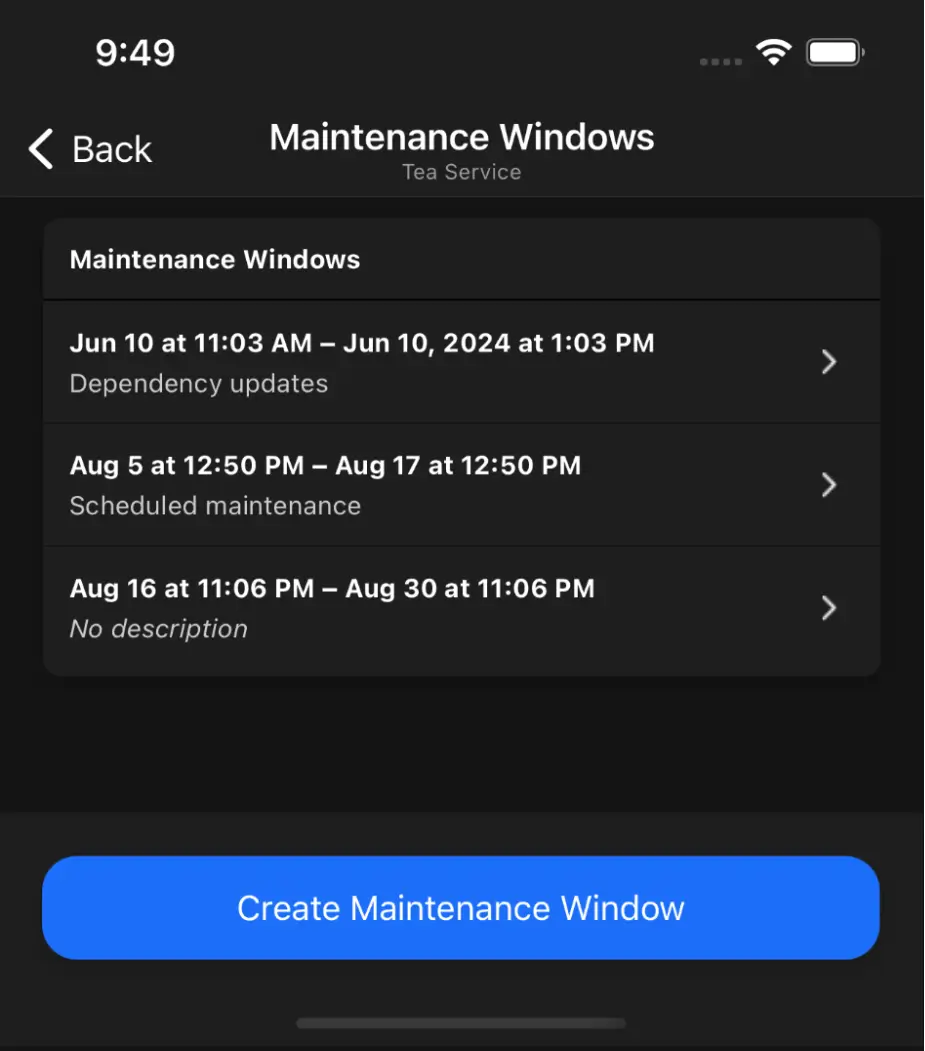 *View maintenance windows in the mobile app* ## Update a Maintenance Window ### Web App To update a current or future maintenance window: 1. Navigate to **Services** → **Service Directory** and select the **Maintenance Windows** tab. 2. In the table **All Maintenance Windows**, click **Update** to the right of the maintenance window you’d like to update. 3. In the **Update Maintenance Window** modal, update maintenance window’s details. 4. Click **Save Changes**. ### Mobile App To update a current or future maintenance window: 1. Tap **Services** in the bottom navigation and select the service with the maintenance window you'd like to update. 2. Tap in the top-right corner. On the next screen, select the maintenance window you would like to update. - _Optional_: In the section **Description**, tap **Add Description**, enter or update the text describing why the maintenance is happening, and tap **Done**. 3. In the section **Schedule Time**, tap the **End** time row and select a new date and time. 4. Tap **Update Maintenance Window**. 5. In the modal, confirm your selection. 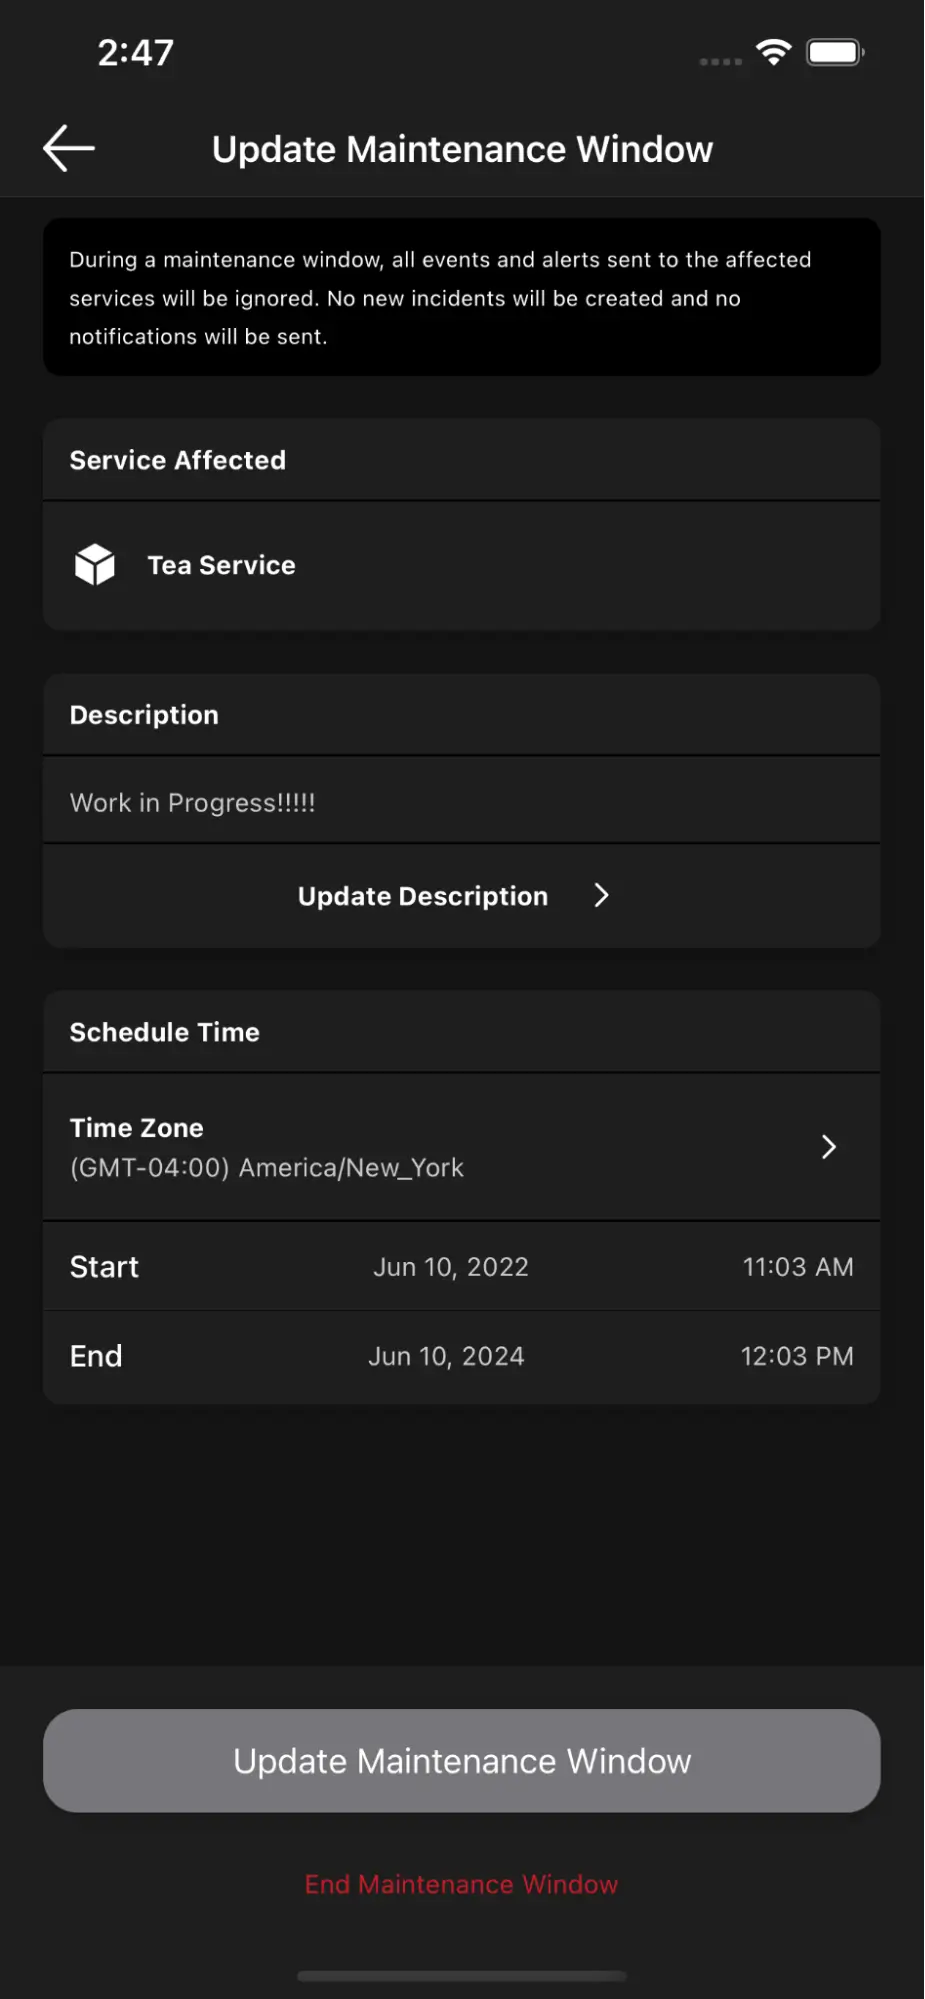 *Update a maintenance window in the mobile app* > **Update Maintenance Windows for Multiple Services:** Please note that if a maintenance window affects multiple services (e.g., if you created the maintenance window in the [web app](#web-app) and selected multiple services), updating the maintenance window will affect _all_ associated services. ## Delete a Maintenance Window You can delete any maintenance window that is scheduled to take place in the future. Past maintenance windows are kept for historical records and cannot be deleted. To end an in-progress maintenance window before its scheduled end time, please read [End a Maintenance Window](#end-a-maintenance-window). 1. Navigate to **Services** → **Service Directory** and select the **Maintenance Windows** tab. 2. In the table **All Maintenance Windows**, click **Update** to the right of the maintenance window you’d like to delete. 3. In the **Update Maintenance Window** modal, click **Delete**. ## End a Maintenance Window ### Web App To end a maintenance window early: 1. Go to **Services** → **Service Directory** and select the **Maintenance Windows** tab. 2. Under **All Maintenance Windows**, find your desired maintenance window and click **Update** to the right. 3. Click **End Now**. ### Mobile App You can immediately end any in-progress maintenance window in the mobile app: 1. Tap **Services** in the bottom navigation and select the service with the maintenance window you'd like to end. 2. Tap in the top-right corner. 3. At the bottom of the screen, tap **End Maintenance Window**. 4. In the confirmation modal, tap **End Maintenance Window**. > **End Maintenance Windows for Multiple Services:** Please note that if a maintenance window affects multiple services (e.g., if you created the maintenance window in the [web app](#web-app) and selected multiple services), ending the maintenance window will affect _all_ associated services. ## Disable a Service If you’d like to indefinitely put a service into maintenance mode: 1. In the PagerDuty web app, navigate to **Services** → **Service Directory** and select a service to disable. 2. Select **More** → **Disable Service**. 3. In the prompt, click **Disable** to confirm your selection. This service is now disabled and will not trigger incidents until it is [manually enabled](#enable-a-service). ### Enable a Service To manually enable a disabled service: 1. Navigate to **Services** → **Service Directory** and select a [disabled service](#disable-a-service). 2. Select **More** → **Enable Service**. New incidents can now trigger on the service. ## FAQ **How can I create recurring maintenance windows?** If you find that you need to regularly put a service into maintenance mode, you can use our REST API to create recurring maintenance windows. The following script can be customized and run in the command line: - [Python 3 Compatible Script](https://github.com/PagerDuty/public-support-scripts/tree/master/maintenance_windows_bulk_operations) (**Note**: You will need a [REST API key](/account-admin/api-access-keys#rest-api-keys)). Please note that the script above will not run as is, and requires you to substitute your own email address, v2 REST API key and service ID where indicated. Once the substitutions have been made, the script will allow you to create maintenance windows programmatically. You may wish to adjust other values in the example, too. For instance, the maintenance duration is set to 30 minutes. Please change this value to adjust the maintenance windows’ duration. The example as written will also create eight maintenance windows, separated from each other by a week's time. Please adjust this value if you’d like a different number of maintenance windows. --- URL: https://docs.pagerduty.com/incident-management/services/regular-expressions # Regular Expressions Match and extract text using regex Regular expressions (regex) are a standard, well-documented way to match and extract text. In the context of [Event Orchestration](/ai-automation/aiops/event-orchestration), you can use regex to determine [event routing rules](/ai-automation/aiops/event-orchestration#create-a-routing-rule) and define [Event Fields](/ai-automation/aiops/event-orchestration#event-fields). In the context of PagerDuty email integrations, you can use regex to fine-tune your [email filters](/integrations/email-integration-guide/email-management-filters-and-rules#email-filters) and [email management rules](/integrations/email-integration-guide/email-management-filters-and-rules#email-management). - [Extract an Alert Key](#extract-an-alert-key) - [Case Sensitivity](#case-sensitivity) - [Test Your Regex](#test-your-regex) - [Capture Group Implementation](#capture-group-implementation) - [Examples](#examples) ## Extract an Alert Key You can use regex to modify the alert key to manage how alerts [deduplicate](/incident-management/incidents/alerts#view-deduplicated-alerts). Regex can capture the full value of the matched text or a partial value by using a [capture group](#capture-group). You can follow the steps outlined in our article on [Event Orchestration](/ai-automation/aiops/event-orchestration#deduplication) to set a new deduplication key with regular expressions. For email events sent to an email integration, you can set an alert key with a regular expression via the email integration’s settings in the web app.  *Use a regular expression to extract an alert key in an email integration* ### Capture Group In regex, the definition of a capture group is anything between a set of parentheses, `(...)`. A capture group will tell PagerDuty to create an incident/alert key from the text between a set of parentheses, `(...)`. If the unique identifier within the capture group is likely to change (e.g., a numeric string like a ticket ID or host ID), you can use `\d+`, which tells PagerDuty to capture all subsequent digits. Similarly, if you want to capture a specific number of digits you could use `\d` to stand in place of each digit. For example, you could use `\d\d\d\d` or `\d{4}` if the unique identifier always contains four digits. #### Capture Parentheses in the Unique Identifier In some instances your unique identifier may contain parentheses. For example, Zendesk ticket IDs typically contain parentheses: `This ticket (#27415) has been assigned to group ‘Support’, of which you are a member.`  *Unique identifier with parentheses* To capture the parentheses in a regex, use a backslash (`\`) before each parenthesis, for example: `\(#\d+\)`. The backslash acts as an escape character that tells PagerDuty, "treat the following character as text."  *Regular expression to capture parentheses* ### HTML Emails and Content Encoding Email management regular expressions compare on the text of the email _after decoding_, per the encoding specified by `Content-Transfer-Encoding`. However, `Content-Type` is ignored. If you decode a base64-encoded email and it has an underlying message in HTML (and there is no plain text copy of the email included), then the regex will run on the HTML code. It would not run on the text that would result after rendering the HTML or stripping out HTML tags. This means that if you only send emails as HTML (`Content-Type: text/html`), regular expressions written to match the text content alone may not work. HTML tags, hidden line breaks and whitespace can potentially interfere with your regular expressions’ ability to match the input. Read [Email Integration Troubleshooting Guide](/integrations/email-integration-guide/email-integration-troubleshooting-guide#a-regular-expression-is-not-matching-the-email-body-as-expected) for more information. ## Case Sensitivity Regular expressions are case sensitive. This means "DOWN", "down", and "Down" are all considered different strings and will not all match against the same regex. You can make your email management rules case insensitive by adding `(?i)` to the beginning of the line, for example: `(?i)(critical)` This will capture all cases: "critical", "CRITICAL", "cRiTicAL", etc.  *Case-insensitive regular expression* > **Tip:** The case insensitivity modifier `(?i)` works in [email management rules](/integrations/email-integration-guide/email-management-filters-and-rules#email-management), however it is **not supported** with [email filters](/integrations/email-integration-guide/email-management-filters-and-rules#email-filters). With this in mind, we suggest using a pipe character (`|`) to capture different upper/lowercase strings for email filters, for example: `(Down|DOWN|down)` > > For Event Orchestration rules, comparisons are case-insensitive by default, however this can be overridden when using the [PagerDuty Conditional Language](/developer/pcl-overview#string-comparison-operations) (PCL). ## Test Your Regex We recommend [Regex101](https://regex101.com/) to compose, edit and test your regular expressions. To test a regular expression in Regex101, enter your test string (in this example, you’d like to extract the node, `A74U-138`, from the email body and use it as the incident/alert key) and make sure that the regex show a _Group 1_ **match**. 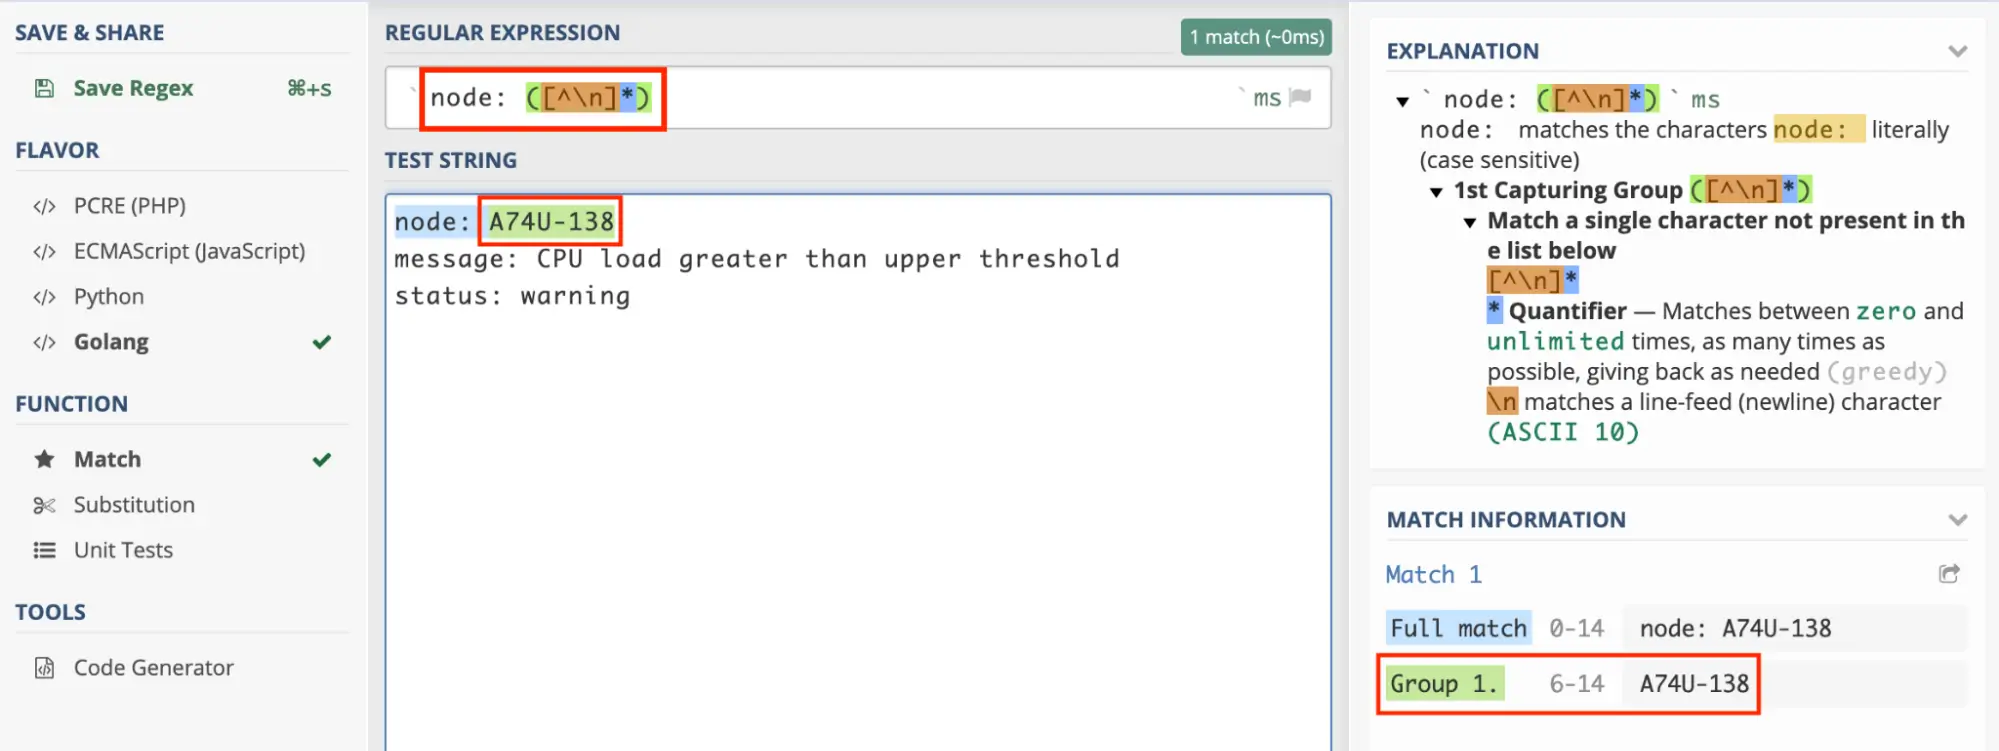 *Test your regex* > **Regex Testing Tip:** When using the external site [Regex101](https://regex101.com/) to test your regex, please select the following options: > > - **Golang** flavor > - **multi line** > - **single line** > > If your regular expression matches on the sample text you enter into Regex101, it should work for the same text in PagerDuty. ## Capture Group Implementation PagerDuty's email management rules use Google's [RE2](https://github.com/google/re2) for regular expression handling, and additionally adds some custom behavior. Some specific things to be aware of: - Nested capture groups are not supported. The following regular expression will generate an error when saving the service: `(([0-9])[0-9])`. - If you define multiple [capture groups](#capture-group), we will concatenate the captured material in each group together, using a `-` character. For example, if you match `([a-z])([a-z])` against `ab`, PagerDuty will extract this as `a-b`. - Two options are always added to your regular expression (documented in the RE2 documentation) when extracting data: - `s` (single-line mode) means that the `.` special character will also match newlines (`\n`). - `m` (multi-line mode) causes `^` and `$` to match the beginning and end of lines, in addition to the beginning and end of the entire text. - A consequence of these two behaviors and regex greediness is that `(.*)$` will match everything until the end of the document. We recommend using `([^\n]*)` if you’d like to match everything until the end of the line. ## Examples The following is an example of a common use case using a regular expression in the context of an email integration: Your PagerDuty service receives emails from a monitoring tool, however you only want to trigger incidents if the subject line starts with “CRITICAL” or “SEVERE”. The regular expression you would use to match incidents of this type would be: `^(CRITICAL|SEVERE)`. The `^` character means the subject line starts with this, and `(CRITICAL|SEVERE)` means the starting word can be either "CRITICAL" or "SEVERE". **Other Common Regex Examples** | Filtering For | Filter Options and Regular Expression | | :-------------------------------------------------------------------------------------------------------------------------------------------------------------------------------------------------------------- | :------------------------------------------------------------------------------------------------------------------------------------------------------------------------------------------------------------------ | | "Open Escalations" or "[JIRA] Commented:" | `Open Escalations\|\[JIRA\] Commented:` | | - All emails that contain "Priority 1" or "Priority 2" and "Failed" in the subject - AND contains "Warning to Failed" or "Normal to Failed" in the message body - AND only accepts emails from `test@email.com` | - The email subject matches the regex: `(?:Priority 1\|Priority 2).*Failed` - AND the email body matches the regex: `Warning to Failed\|Normal to Failed` - AND the from address exactly matches: `test@email.com` | | Only trigger incidents from specific domains | The email from address matches the regex:`domain1.com\|domain2.com\|domain3.com\|domain4.com` | | Filter out email replies that include "RE:" or "FWD:" at the beginning of the emails | The email subject does not match the regex `\A(?:RE:\|FWD:)` | --- URL: https://docs.pagerduty.com/incident-management/services/service-dependencies # Service Dependencies Use Service Dependencies to define relationships between technical and business services. [Service dependency](/incident-management/services/service-profile#service-dependencies-tab) data provides a broader understanding of the environment surrounding their incident, allowing you to identify the root cause more efficiently. When a service is experiencing an incident and has defined dependencies, relevant service dependency data is available on the incident details page. If the service does not yet have dependencies defined or is missing possible dependencies, you can view suggested dependencies and easily add them. ## View Technical Service Dependencies in an Incident To view the impacted service’s **Technical Service Dependencies**, click an incident’s **Title** to view the incident details page. You will see the **Technical Service Dependencies** section on the right, below **Notes** section. 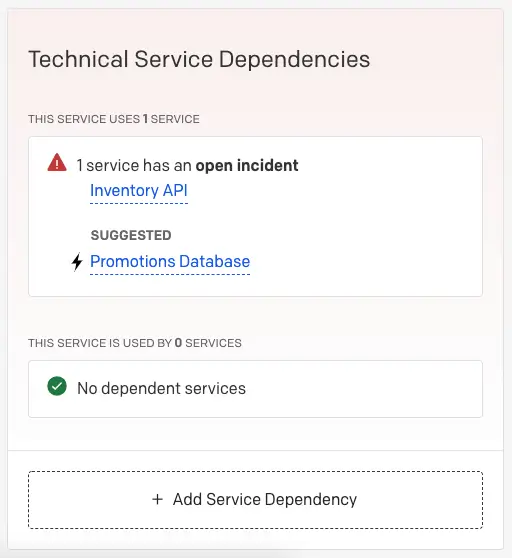 *Technical service dependencies* Each dependency includes the following details: - **Service Name** - **Status**: **Open Incidents** or **Operational** (no open incidents). If you click the dependency’s **Service Name**, you can view more granular details: - **On Call Now**: Responder(s) currently on call for the service. - **Open Incidents**: A list of current open incidents on the service. ## Suggested Technical Service Dependencies in an Incident If incidents on your service tend to be followed by incidents on another service, or vice versa, suggested technical service dependencies will also be provided. If available, they appear under a **Suggested** header with next to the service's name:  *Suggested service* To add a **Suggested Service Dependency**, click the **service name** → **Add**, next to **Add this service as a dependency?**. 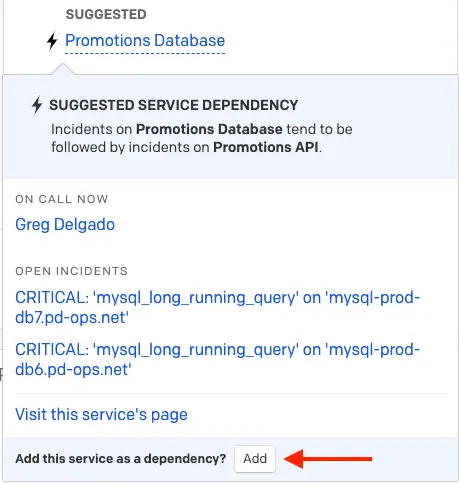 *Add service as a dependency* ## Add Technical Service Dependencies From an Incident 1. Click an incident’s **Title** to view the incident details page. 2. View the **Technical Service Dependencies** section on the right, below **Notes**. 3. Click **Add Service Dependency**. You will be directed to the service’s [Service Dependencies](/incident-management/services/service-profile#service-dependencies-tab) page. There are two sections to this page: other services that this service **uses** or is **used by**. 4. Click **Edit Services** to add the appropriate dependency. 5. On the **Edit Services** screen, search by service name, or select one of the **Business Services** or **Technical Services** tabs. 6. Click to add the desired services; you may add multiple business and technical services. 7. (_Optional_) Create a new business or technical service on this screen by clicking **Create a new business service** or **Create a new technical service** from the corresponding tabs. This launches the [Business Service](/incident-management/services/business-services#create-a-business-service) or [Technical Service](/incident-management/services/services-and-integrations#create-a-service) configuration screen in a new tab. 8. Click **Save Changes**. --- URL: https://docs.pagerduty.com/incident-management/services/service-directory # Service Directory Use the Service Directory's flexible search engine to drill into relevant information and perform actions on services The Service Directory is a searchable, high-level aggregate view of all PagerDuty services in your organization, and their corresponding owners. It allows everyone to search for the services they support and learn more about other services in their organization. From the Service Directory, you can learn more about individual services, adjust settings, and review [Service Standards](#service-standards). > **Required User Permissions:** All users can view the Service Directory. The displayed results may vary, however, depending on a user’s [permissions](/account-admin/advanced-permissions). Only users who have permission to create or edit a service can take those actions from the Service Directory. ## Navigate to the Service Directory In the PagerDuty web app, navigate to **Services** → **Service Directory**. The Service Directory provides the following information about services: - **Service incident state** - **No open incidents**: There are currently no open incidents on the service. - **Awaiting response**: There are one or more open incidents on the service with a triggered status. - **Response in progress**: There are one or more open incidents on the service with an acknowledged status - **Disabled**: The service is currently [disabled](/incident-management/services/services-and-integrations#disable-and-re-enable-services) and will not trigger any new incidents. - **Maintenance**: The service is currently in a [Maintenance Window](/incident-management/services/maintenance-windows). - **Service name and description** - **Team** - A service's [Team](/account-admin/teams) is determined by the Team its escalation policy is associated with. - If your account does not have Teams, the associated [Escalation Policy](/incident-management/schedules/escalation-policies) will be displayed. - **On Call Now** - The user who is currently on call for the service. - If there are three or more users on call, this field will display the total number. You can click a service's name to view its details page and the full list of current on-call users. - If no one is currently on call for the service, this information will be highlighted so that you can easily identify gaps in on-call coverage. - **Last incident** - The date and time of the last incident that was triggered on the service. You can click the link to quickly access the details for that last incident. - **Open incidents** - The current number of triggered and acknowledged incidents on the service. - **Standards met** - The number of [Service Standards](#service-standards) that the service meets, displayed as a fraction, e.g., 7/10. ## Search With the **Services** tab selected, you can search for a service by name or description. By default, results are ordered by highest relevance to lowest. If services do not populate, check to see if you have any filters applied. You may want to adjust your Team filter to **All Teams** and your incident filter to **Any time**. If you still do not see any results, you may need to contact your PagerDuty administrator to confirm that you have the correct permissions to view the service(s) in question. 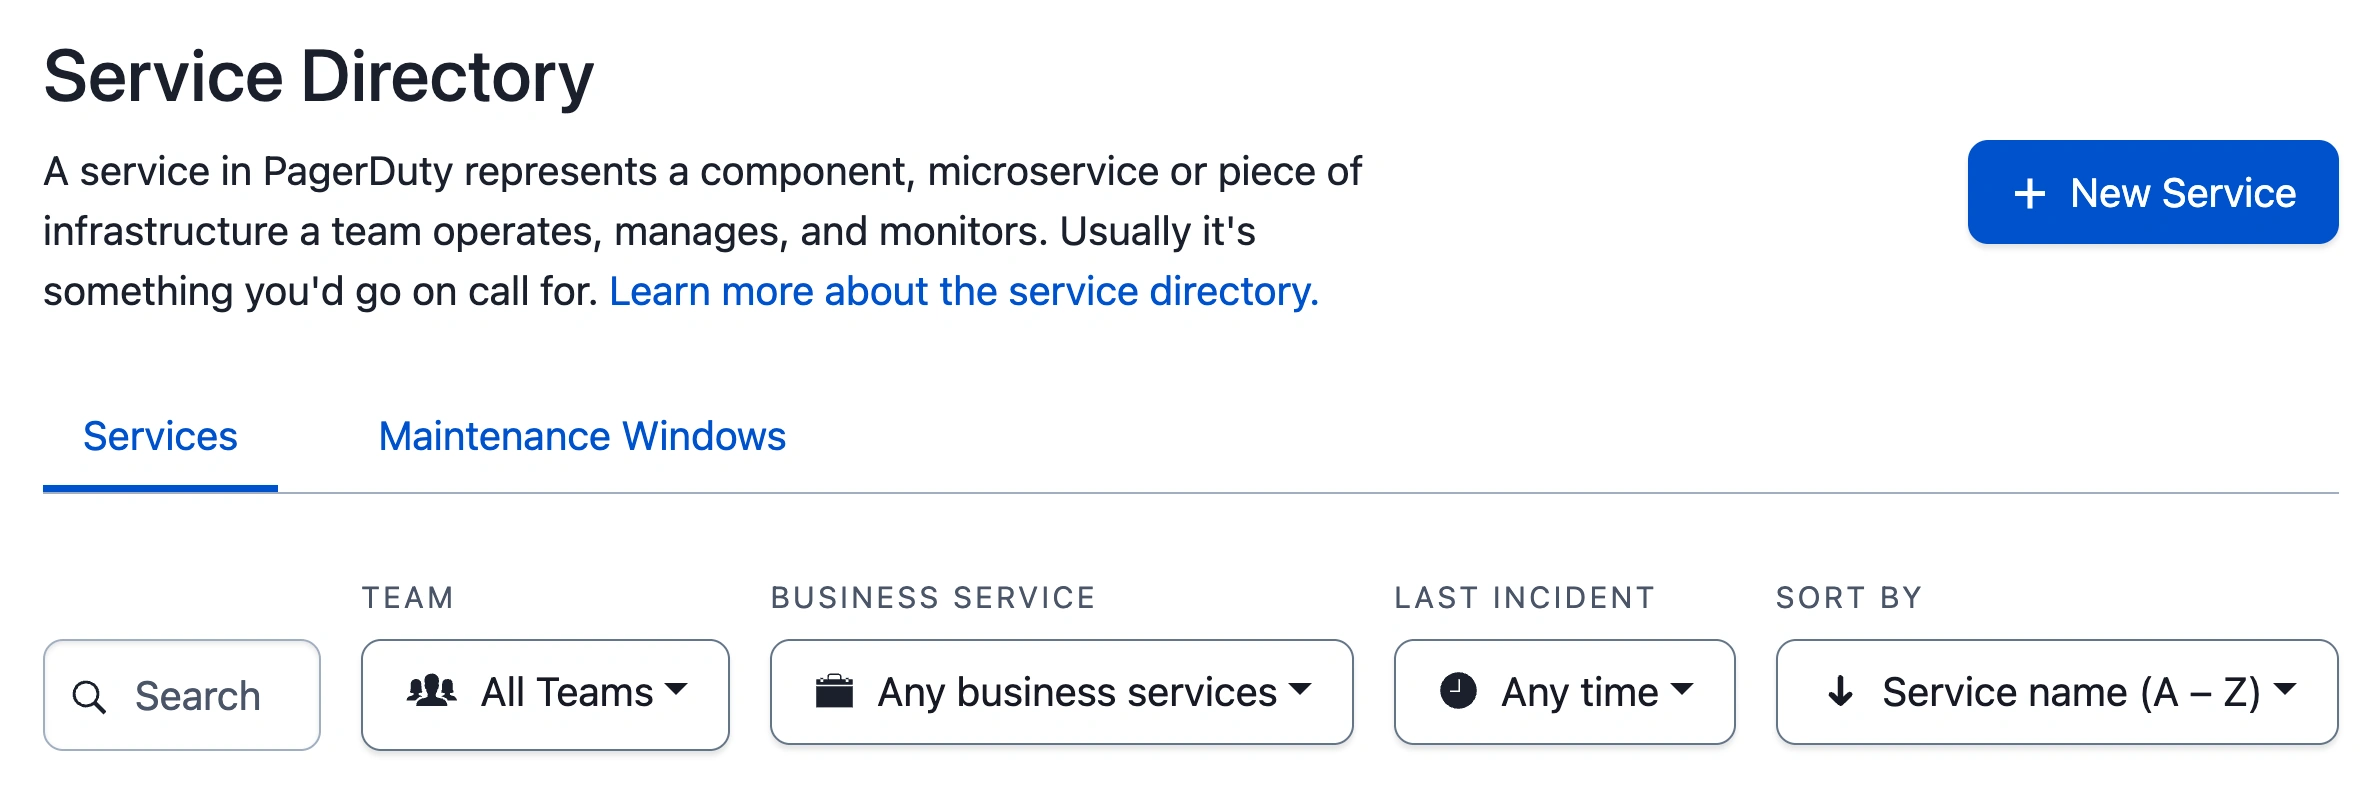 *Search for services* ### Search by Integration Key You can enter an integration key as a search term to return a list of services that have a matching key. To search by integration key, prepend your search with `key:`, i.e., `key:INTEGRATION-KEY-HERE`. ## Filter and Sort Refine your results by combining search queries, filters and sorting. You can use the following filters to narrow down search results: - **AIOps Service** - **Team** - **Business Service** - **Last Incident** - **Sort By** ### AIOps Service > **AIOps Notes:** This filter only appears if you disabled AIOps on any of your services. Otherwise, all services have AIOps enabled by default. On PD Reliability Platform plans, Signal Intelligence is disabled by default on newly created services. The AIOps Service filter allows you to filter for: **AIOps services**, **Non-AIOps services** or **All services**. Please see our [AIOps Service Configuration](/ai-automation/aiops/overview#aiops-service-configuration) article for more information. ### Team The Team filter defaults to all of your teams, but can easily be adjusted to include **All Teams**, **No teams** or a specific Team. If a service is not associated with a Team, it will not appear when a Team filter is active. Please note that this filter is only available to accounts with the [Teams](/account-admin/teams) feature. ### Business Service The Business Service filter allows you to filter for the technical services associated with a specific [Business Service](/incident-management/services/business-services). Please note that you will need to configure Business Services in order to return any results with this filter. ### Last Incident The Last Incident filter allows you to filter by services that have had a recent open incident. The options in the dropdown are **Any time**, **Within 24 hours** and **Within 7 days**. ### Sort By The Sort By dropdown further organizes your search results. When first visiting the page, this defaults to alphabetical order. Once you enter a search term, the sort will default to order by relevance. The sorting options are **Service name (A-Z)**, **Service name (Z-A)**, **Oldest incident** and **Most recent incident**. **Note**: For the **Most recent incident** option, services that have never had an incident will be placed after all other services. ## Maintenance Windows You can review and manage Maintenance Windows in the Service Directory by selecting the **Maintenance Windows** tab. Read [Maintenance Windows](/incident-management/services/maintenance-windows) to learn more. 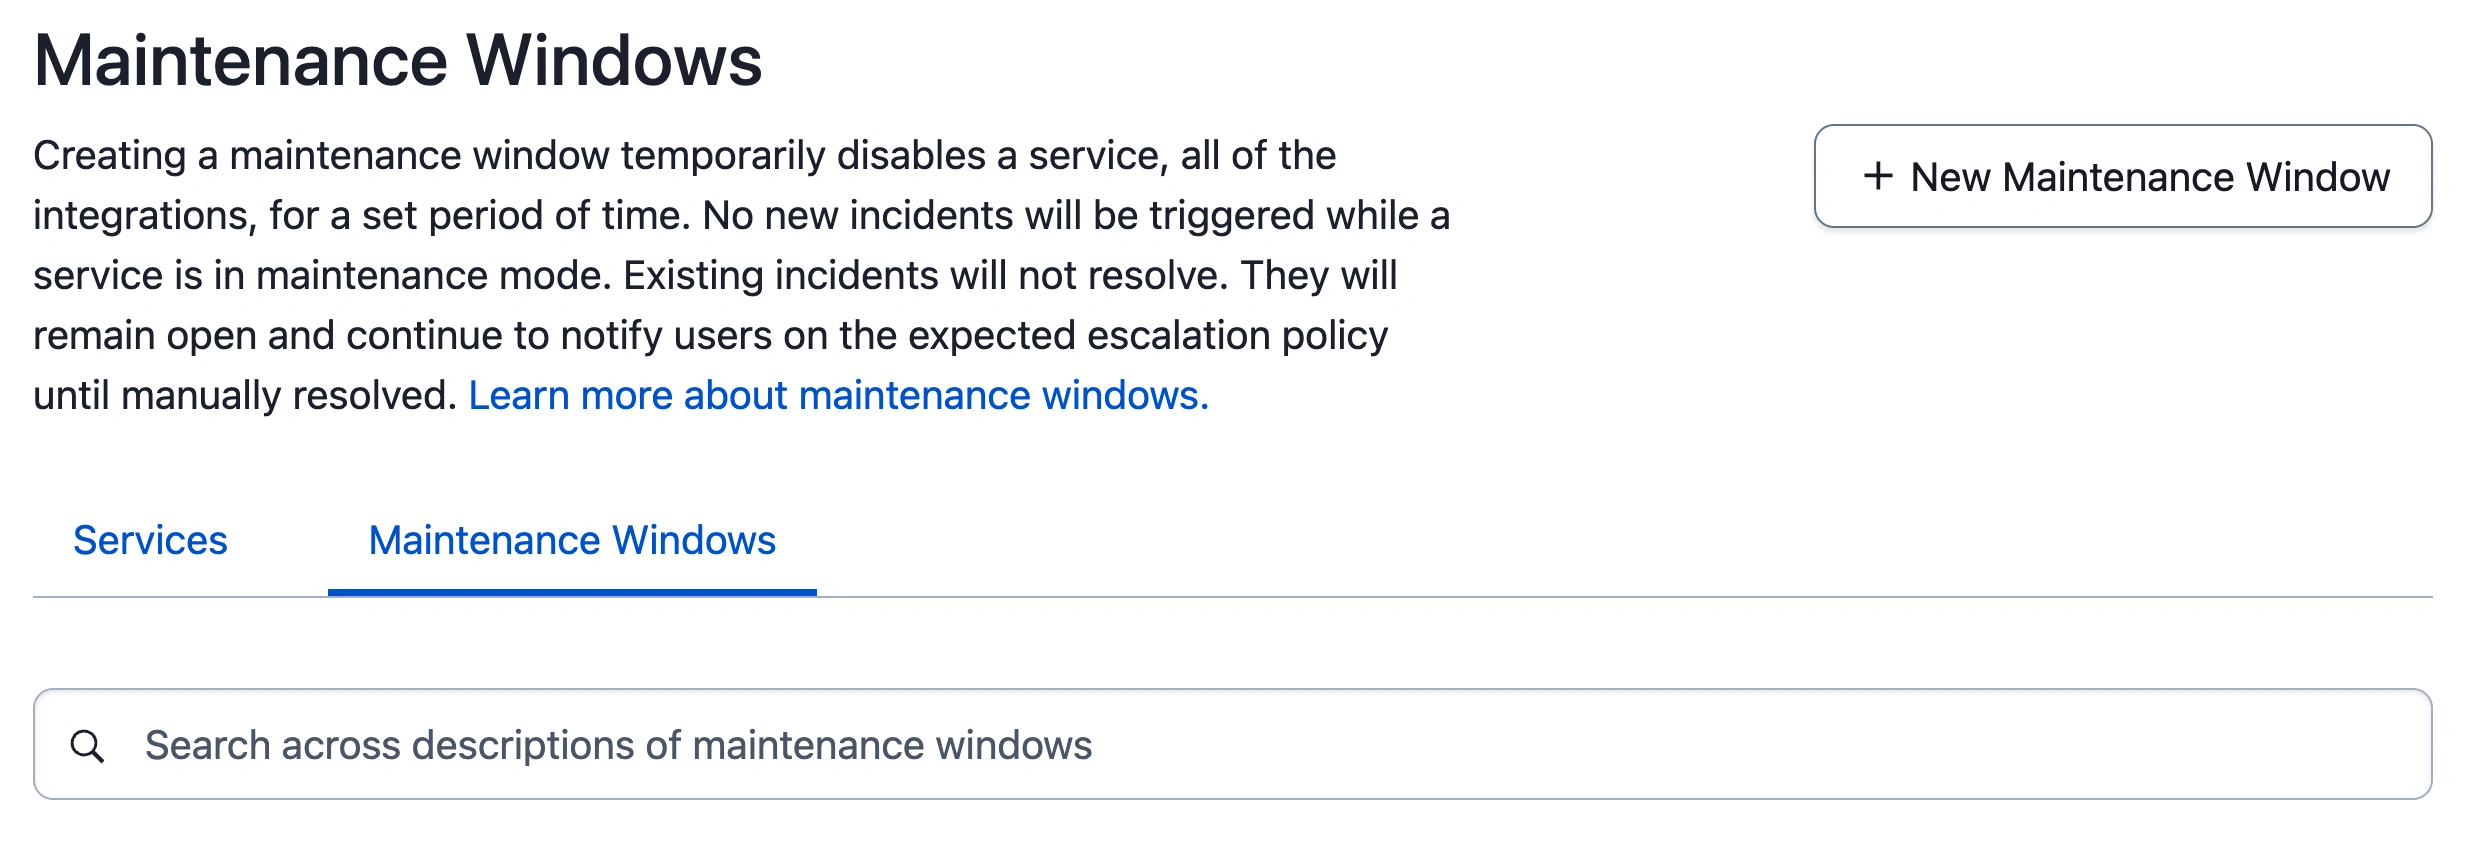 ## Service Standards Organizations can use Service Standards to easily define, share and track service configuration criteria. This provides individual teams clear guidelines for setting up and managing their services in PagerDuty. Service Standards improve consistency and predictability during incident response, and they support enhanced analytics and better comparability among services and teams. > **Required User Permissions:** - Service Standards will only be viewable to Admins and the Account Owner by default. Admins and the Account Owner have the option to adjust settings to allow all users to view Service Standards. > - A user needs to have permissions to view a given service in order to view the Service Standards associated with it. ### Configure Service Standards Settings 1. In the PagerDuty web app, navigate to **Services** → **Service Directory** and click **Standards met** to the right of any service. 2. In the side panel that appears, click **Settings** in the top right. 3. _Optional_: To edit who can view Service Standards, under **Visibility**, select **Admins only**, **Everyone** or **No One**. 4. You may also edit settings for each standard under the **[#] Active Standards** section: - **To edit a standard's description**: Click the icon, edit the **description** and then click **Save**. - **To edit the Service name matches [Regex] standard**: Click the icon to the right of the title, enter your preferred **Regex** and then click **Save**. - **To edit which services the standard applies to**: Click the link under **Applies to** (**All Services** or **Some Services**, depending on configuration). Under **Apply standard to**, select **All Services** or **Selected Services**. - **If you select Selected Services**: Select **is** or **is not** from the dropdown to filter for matches or exclusions. Search and select your preferred service(s). Click **Save**. - **To disable a standard**: Click the **toggle** to the right of the standard to the off position. If all standards are disabled, the Service Standards feature will be disabled for your account and will no longer be visible in the Service Directory or Service Profile. - **To re-enable a standard**: Click the **toggle** to the right of the standard to the on position. ### View Service Standards #### Service Standards Score The Service Standards score will be viewable for each service within the Service Directory and Service Profile. The initial benchmarks for services are based on [PagerDuty’s best practices for service configuration](/ops-guides/service-ownership). The score is presented as a ratio of how many standards have been met out of the total standards established. - [Service Directory](/incident-management/services/service-directory): The Service Standards score is viewable on the right side of the services table within the Service Directory. - [Service Profile](/incident-management/services/service-profile): The Service Standards score is viewable on the right of the Service Profile header.  *Service Standards Score: Service Directory*  *Service Standards Score: Service Profile* #### Service Standards Panel To view more details about each score, click **Standards met** to the right of the score. A right-side panel will display, which shows whether the service meets the Service Standards criteria. To view a description of the standard and why it matters, select the **dropdown** to the right of any of the individual standards. Under this dropdown, you can also click a contextual button to view guided help to remediate a Service Standard that has not met the criteria. 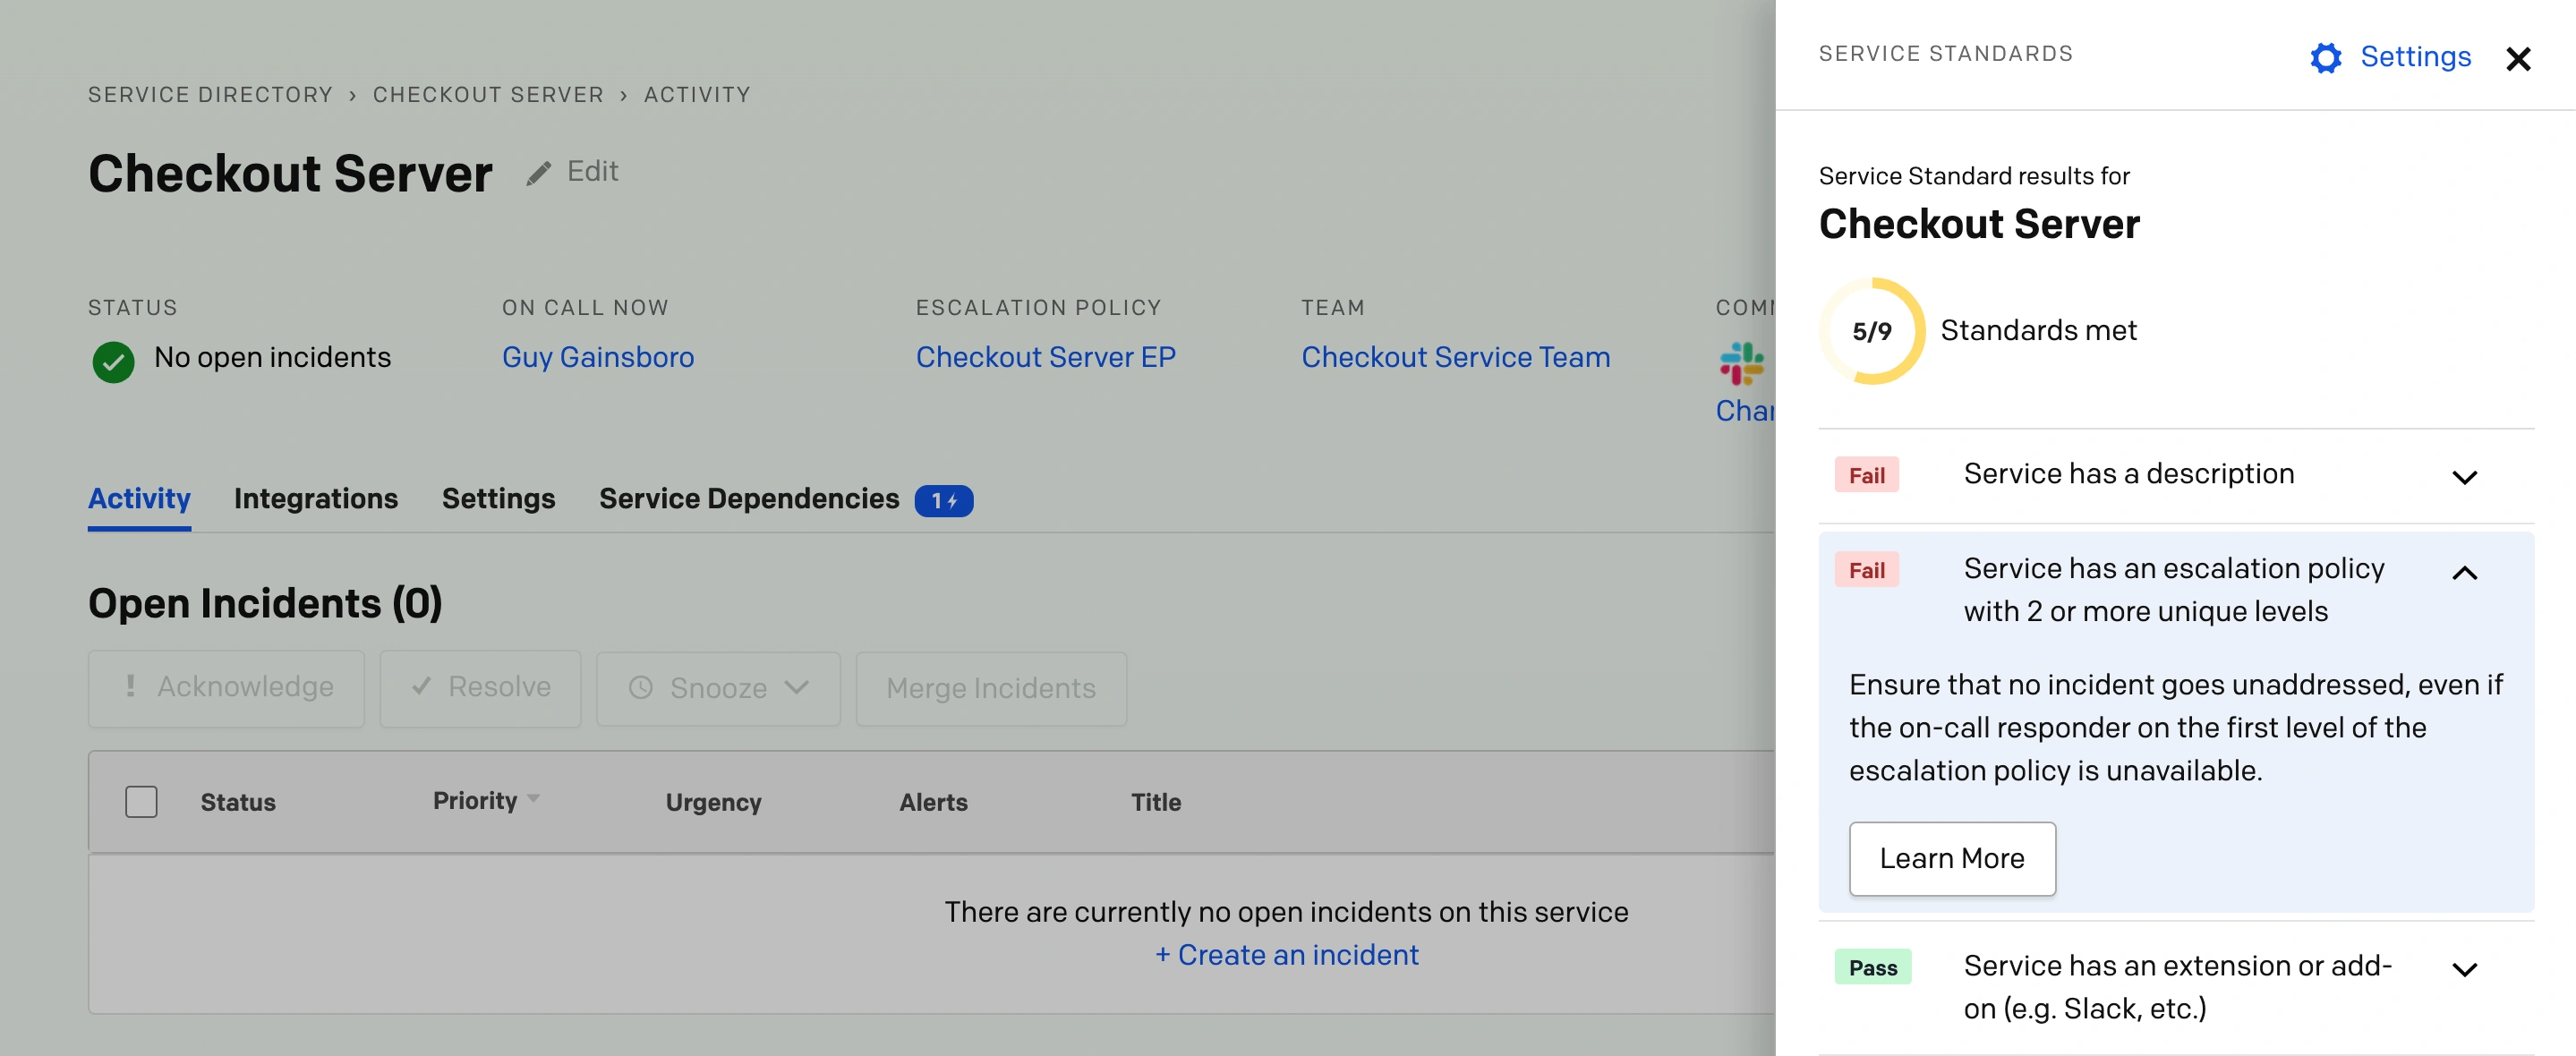  #### List Service Standards via API If you would like to list all Service Standards within your account, please reference our [API documentation](/developer/api/reference/rest/standards/list-standards). ## Additional Service Directory Actions ### Create a New Service Users with appropriate permissions can click **New Service** in the top right to create a new service. For more info, please read [Create a Service](/incident-management/services/services-and-integrations#create-a-service). ### View Service Incidents To view a service’s incidents, as well as information about the on-call rotation and upcoming maintenance windows, select **More** → **View Incidents** to the right of a service’s listing.  ### View Service Integrations For quick access to integrations, users with appropriate permissions can use the shortcut **More** → **View Integrations** to the right of a service’s listing.  ### Dynamically-Built URL As you enter search criteria and apply filters, query parameters are dynamically added to the URL in your browser’s address bar. This can be useful for adding bookmarks, sharing the link with others, or addressing the following questions: - _Which services owned by my Teams had incidents in the last week?_ - _How many of the services in my organization have the word “database” in them?_ - _Are there any services that have never had an incident and are currently unowned by a team? Should we delete those services from PagerDuty?_ --- URL: https://docs.pagerduty.com/incident-management/services/service-graph # Service Graph Interact with the topology of all technical and business service dependencies in your account The Service Graph is an interactive mapping of all technical and business service dependencies in your PagerDuty account. The Service Graph supports the following benefits: - View the health of the full service topology at a glance, identify gaps in service relationships, and seamlessly create dependencies. - Easily understand how services combine to deliver customer-facing or business capabilities. - During incident response, understand the full blast radius of an issue, zero in on the probable cause, and facilitate cross-team collaboration. 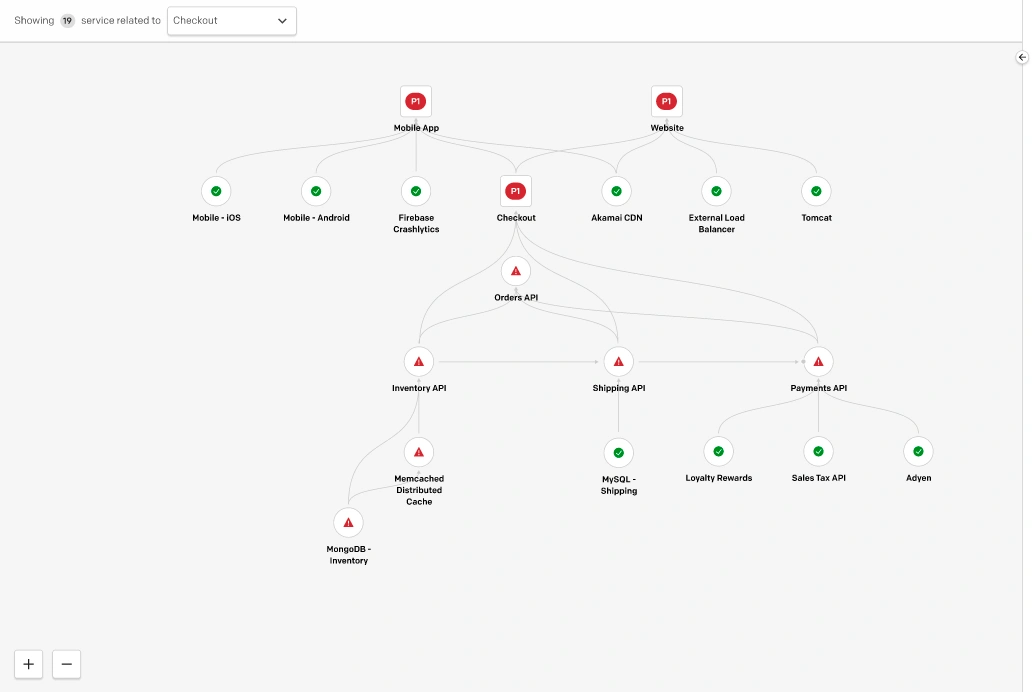 ## View the Service Graph > **Requirements:** - Users with [permission to view each service](/incident-management/services/service-profile) in a dependency relationship will be able to see that relationship in the Service Graph. If a user does not have permission to view a service, that service and relationship will not display in the graph. > - The Service Graph is available as soon as one or more [technical](/incident-management/services/services-and-integrations#create-a-service) or [business services](/incident-management/services/business-services) is configured. No further configuration is necessary. > - If you would like to configure dependencies in bulk, you can do so [via the REST API](/developer/api/reference/rest/service-dependencies/create-service-dependency), Terraform, or by [provisioning them from ServiceNow](/integrations/servicenow-integration-guide/servicenow-provisioning). In the PagerDuty web app, navigate to **Services** → **Service Graph**. The Service Graph will display services that have at least one [dependency relationship](/incident-management/services/service-profile#service-dependencies-tab). Any services that do not yet have dependency relationships will be listed in the right panel under **Services without Dependencies**, which are sorted into two tabs: **Technical Services** and **Business Services**. ### Service Cards Each service in the graph is represented by a service card. Service cards contain the following critical information about a service: - **Service Name** - **Team**: Only available on accounts with [Teams](/account-admin/teams), and when the view is sufficiently zoomed in. - **Operational Status of the Service**: Operational technical services and business services will show a **green** checkmark. Impacted technical services will show a **red** exclamation mark. Impacted business services will display the most-impacting incident's [Priority](/incident-management/incidents/incident-priority). #### Service Display Actions Users can zoom in and out, hover, and select to display more or fewer services: - **Zoomed out view**: Business services are square and technical services are circular. - **Zoomed in view**: Business services are rectangular and technical services have rounded edges. - **Hover**: Hovering over a service card will highlight the selected service, as well as one level of relationship from that service in both the **Uses** and **Used By** directions. - **Select**: Clicking on a service will highlight the selected service as well as one level of relationship from that service in both the **Uses** and **Used By** directions. It will also display a right panel with service and incident information. ### Right Panel The information displayed in the right panel includes: - **Service Name** - **Service Description** - **Status** - **On Call Now**: Technical services only. - **Escalation Policy**: Technical services only. - **Owner**: Business services only. - **Team** - **Open Incidents**: Up to three of the most recent incidents with priority, as applicable. If there are more than three incidents impacting the service, there will also be a link to **View All Incidents**. - **View Service Profile**: A link to view the service profile page. - **Manage Service Dependencies**: A link to manage dependencies in the service profile page. Click in the top-right corner of the panel, or on the graph’s background, to close the panel. 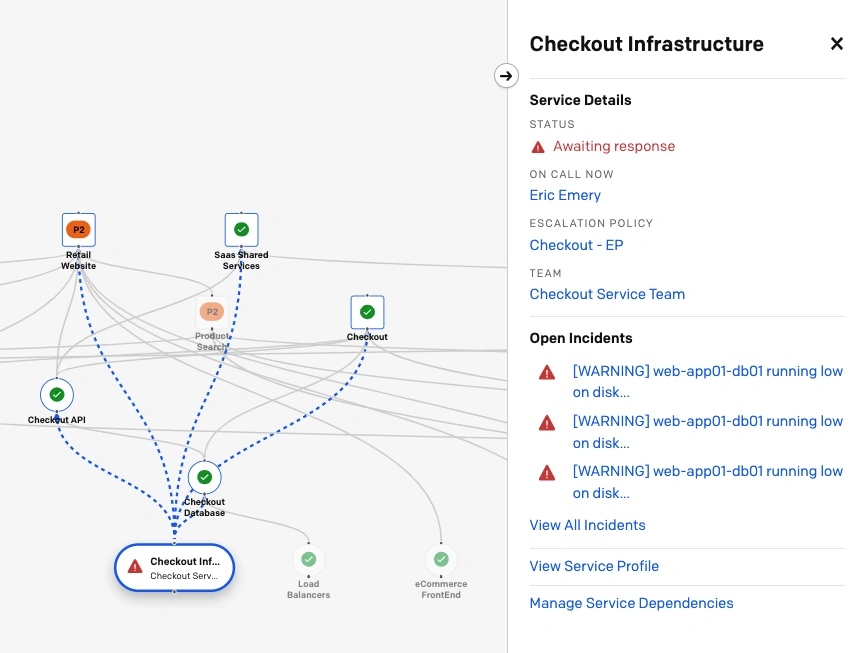 *Service details in the right panel* In the cases where there are many relationships or services, the Service Graph will display the top-most or root nodes, as well as two levels of relationships below that. If there are too many relationships or services to load an optimal view of the service graph, users can select a business service or technical service to focus the graph. The filtered view will display the selected service as well as the two levels of relationships from that service in both the **Uses** and **Used By** directions. 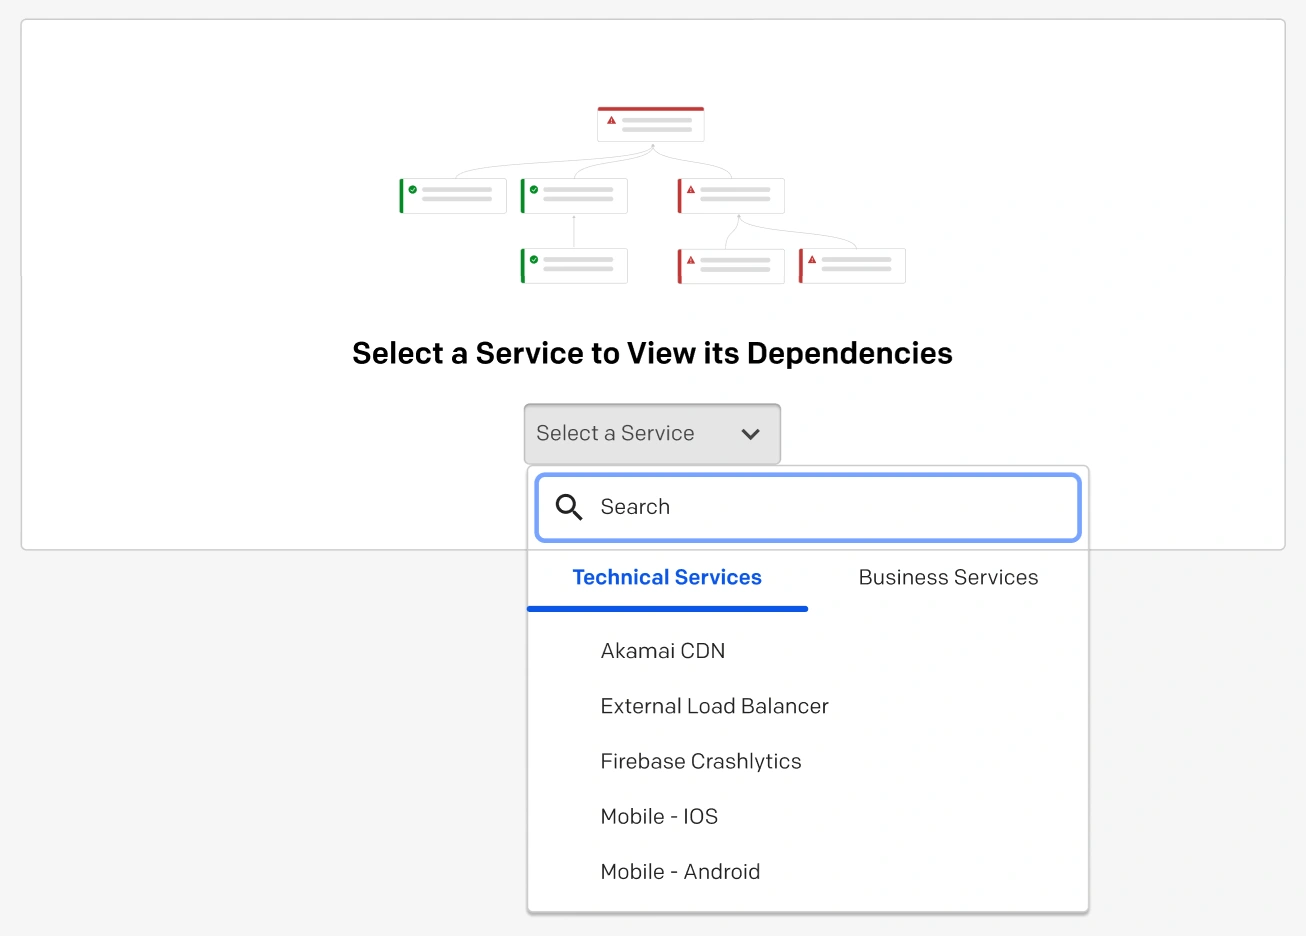 *Select a service* Additional service relationships will be aggregated into grouped nodes. You can click on a grouped node to expand additional relationships.  ## Create Service Dependencies > **Required User Permissions:** Users with [permission to create dependency relationships between services](/incident-management/services/service-profile#add-or-remove-service-dependencies-via-the-web-app) are able to draw connections between nodes in the Service Graph. 1. In the PagerDuty web app, navigate to **Services** → **Service Graph**. 2. Search or scroll for your desired technical or business service in the right panel, then drag and drop the service into the service graph. 3. **Hover over a service** in the graph to display draggable gray nodes at the top and bottom, which can be used to draw relationships between two services. - The arrow denotes the direction of the relationship. For example, drawing a line from Service A to Service B would denote that Service B is dependent on Service A.  *Service cards with draggable nodes* 4. Draw an arrow between the services by **selecting a node and dragging it** in your desired direction to denote the dependency relationship. ### Disconnect Dependency Relationships You can disconnect a relationship in the Service Graph by **clicking on the line between two services** and selecting **Disconnect** in the prompt that appears.  *Disconnect dependency relationship* --- URL: https://docs.pagerduty.com/incident-management/services/service-profile # Service Profile An overview of each service's details The service profile provides a high-level view of a service’s current details. When collaborating across teams, you can see at-a-glance who owns the service, who is on call, or how to contact the Team responsible for the service. To access a service’s profile, navigate to **Services** → **Service Directory** and click the desired service’s **name**.  *Service profile in the web app* > **Required User Permissions:** Full Stakeholders, Observers, Responders, Managers, Admins and the Account Owner can view all services. Restricted Access users will only be able to view services that they have been added to via [team or object permissions](/account-admin/advanced-permissions#manage-roles). Limited Stakeholders cannot view services. ## Service Details ### Service Name and Description The name and description of the service. Managers of a service and Global Admins can edit a service’s name and description by clicking **Edit**. For best practices on naming your services, please see our [Full Service Ownership Guide](/ops-guides/service-ownership/service-ownership-functions#service-name). ### Status The status is the current state of the service with regards to whether there are any open incidents. - **No Open Incidents**: There are currently no open incidents on the service. - **Awaiting Response**: There are one or more open incidents on the service with a triggered status that have not been acknowledged yet. - **Response in Progress**: There are one or more open incidents on the service with an **Acknowledged** status. - **Disabled**: The service is currently disabled and will not trigger any new incidents. - **Maintenance**: The service is currently in maintenance mode. When determining which status to display on a service’s profile, PagerDuty follows this order of precedence: **Disabled** → **Maintenance Window** → **Active with/without incidents**. For example, a disabled service with active incidents will still show as **Disabled**. ### On Call Now The current user(s) on call for the service. This will display the full list of users on call at the _first level_ of the escalation policy. If no one is currently on call for the service, this information will be highlighted so that you can easily identify gaps in on-call coverage. > **Cached Value:** For performance's sake, our system caches this value for up to 10 minutes. While updates to escalation policies are immediate, there may be a short delay displaying the most current responder(s) in the UI after updating an escalation policy. ### Escalation Policy The [Escalation Policy](/incident-management/schedules/escalation-policies) that the service uses. You may click the name of the escalation policy to view its details. ### Team The [Team](/account-admin/teams) that is associated with this service. If your account does not have the Teams feature available, the escalation policy associated with this service will be displayed instead. ### Communication Channel The **Communication Channel** field allows you to configure a link back to your preferred communication channel where the service’s owner and/or Team can best be reached. This may be an email address, URL to a Slack channel, or a link to another form of contact. To configure a service’s **Communication Channel**: 1. Navigate to **Services** → **Service Directory** and select the **name** of your desired service. 2. To the right of **Communication Channel**, click . 3. Enter a **Link or email address** and a **Communication channel name** _(optional)_. 4. Click **Save**. > **Communication Channel:** The **Communication Channel** added here is for your Teams’ internal use, and doesn’t impact any webhooks you may have configured. ### Service Standards Please read our [Service Standards](/incident-management/services/service-directory#service-standards) article for more information. ## Activity Tab The **Activity** tab gives an overview of your service’s activity related to incidents, change events, suppressed alerts and maintenance windows. ### Open Incidents The **Open Incidents** table allows you to view open incidents on your service, search by incident ID, and take bulk actions such as acknowledge, resolve, merge or snooze. You may view alerts from each incident by clicking **Show Details** under the incident's **Title**. ### Recent Changes If your service has a [change events integration](/ai-automation/aiops/recent-changes) configured, the **Recent Changes** section will provide a list of the most recent change events. You will be able to view the change event **Summary**, **Type** of integration and the **Created** date and time. To view more details about the change event, click the **Summary** title. If your service does not have a change events integration configured, there will be an empty table with the ability to **Add a Change Integration** on the right. ### Resolved Incidents The **Resolved Incidents** table allows you to view resolved incidents on your service, search by incident ID, or merge resolved incidents. ### Suppressed Alerts If you have configured [Event Orchestration](/incident-management/incidents/event-management#alert-suppression) to suppress specific alerts on your service, you can view the most recent alerts in the **Suppressed Alerts** table. ### Maintenance Windows If you have [Maintenance Windows](/incident-management/services/maintenance-windows) on your service, they will be listed in the **Maintenance Windows** section in the order that they are scheduled. ## Integrations Tab The **Integrations** tab includes any integrations and extensions that you have configured on a service. ### Integrations In the **Integrations** section, you can view and configure the inbound integrations that send events to the service. You can view and copy an integration key by clicking to the right of the integration and then to the right of the key: 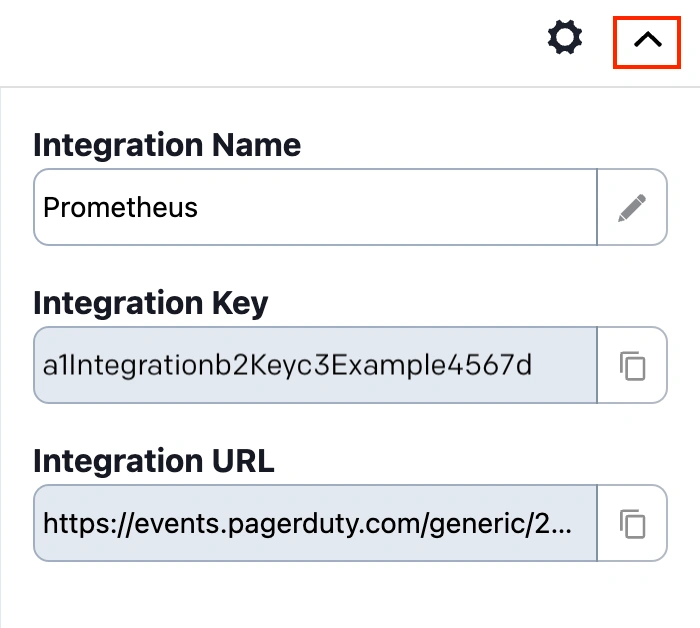 *Copy integration key* #### Add an Integration to a Service Please read our Services and Integrations article for instructions on how to [create a new service and add integrations](/incident-management/services/services-and-integrations#create-a-service), or [add integrations to an existing service](/incident-management/services/services-and-integrations#add-integrations-to-an-existing-service). #### Edit an Existing Integration Please read our Services and Integrations article for instructions on how to [edit an existing integration](/incident-management/services/services-and-integrations#edit-an-integration). ### Extensions and Add-Ons In this section you can view and manage your extensions and add-ons. Please read our [Extensions and Add-Ons](/integrations/extensions#manage-extensions-on-the-service-details-page) article for more information on managing extensions. ### Webhooks In this section, you may view and manage your service’s webhooks. Please read our [Webhooks article](/integrations/webhooks#manage-v3-webhook-subscriptions) for more information on managing webhooks via the service details page. ## Workflows Tab The **Workflows** tab displays [Incident Workflows](/ai-automation/automation/incident-workflows) associated with the service. Click **Associate Workflow** to associate a workflow with the service. ## Settings Tab The **Settings** tab includes settings that help your team respond to incidents. ### Assign and Notify Assign and notify your responders when an incident triggers with an [escalation policy](/incident-management/schedules/escalation-policies), [notification behavior](/incident-management/services/configurable-service-settings#notification-urgency), and re-trigger and auto-resolve actions. 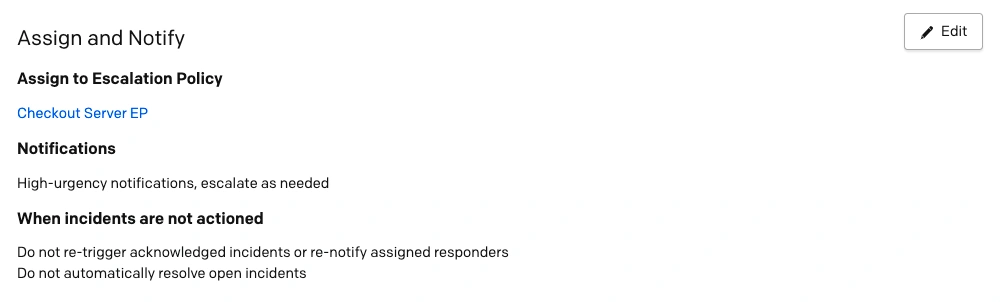 *Assign and Notify settings* To edit these settings, you can click **Edit** and then adjust the settings. There are four options to configure how your team is notified for an incident: - **High-urgency notifications, escalate as needed**: Any incidents triggered with this setting will notify the on-call responder based on their [high-urgency notification settings](/account-admin/user-profile/notification-rules#when-a-high-urgency-incident-is-assigned-to-me). The incident will escalate using the rules defined in the service's escalation policy. - **Low-urgency notifications, do not escalate**: Any incidents triggered with this setting only notify the current on-call responder based on their [low-urgency notification settings](/account-admin/user-profile/notification-rules#when-a-low-urgency-incident-is-assigned-to-me). The incident will not escalate the incident. - **Dynamic Notifications based on alert severity**: Notify users about incidents classified as either high-urgency or low-urgency based on an alert’s severity. - **Based on support hours**: Responders will only be notified within your predefined Support Hours. You may designate specific notification settings during and outside of Support Hours. _Optional_: You may also choose to check the **Raise urgency of unacknowledged incidents to high** checkbox. Learn more about Notification Urgency in our [Configurable Service Settings](/incident-management/services/configurable-service-settings#notification-urgency) article. ### Reduce Noise Reduce the noise of incoming alerts with [Alert Grouping](/ai-automation/aiops/overview#noise-reduction) and [Auto-Pause Incident Notifications](/ai-automation/aiops/noise-reduction/auto-pause-incident-notifications). 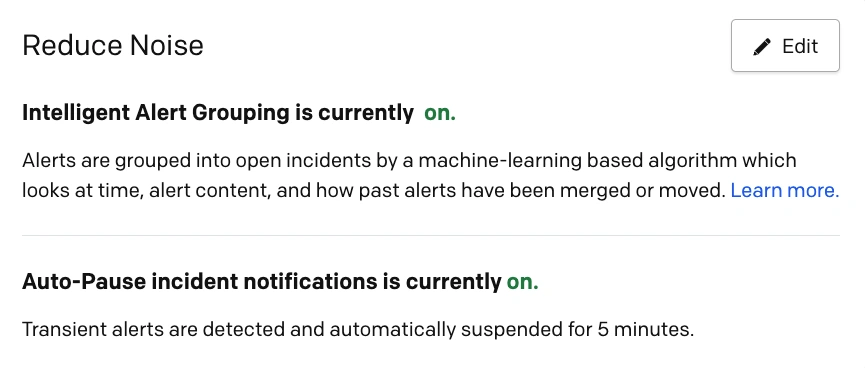 *Reduce Noise settings* ### Coordinate Responders and Stakeholders Coordinate responders and stakeholders by automatically adding a default [conference bridge](/incident-management/incidents/conference-bridge) to incidents on this service and immediately [run an Incident Workflow](/ai-automation/automation/incident-workflows#run-a-workflow) to engage stakeholders. 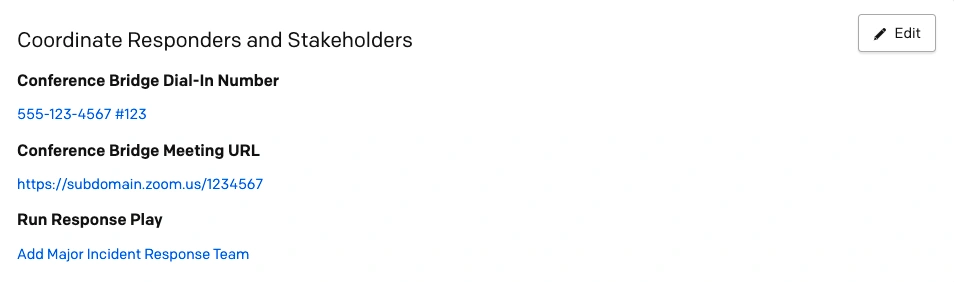 *Coordinate Responders and Stakeholders settings* ### Event Management Automate how the service manages incoming alerts with [Event Orchestration](/ai-automation/aiops/event-orchestration#manage-service-orchestration-rules).  *Manage Service Event Orchestration settings* ### Remediate Remediate incidents faster with a link to your team’s runbook for triaging incidents, or a [custom incident action](/integrations/custom-incident-actions). 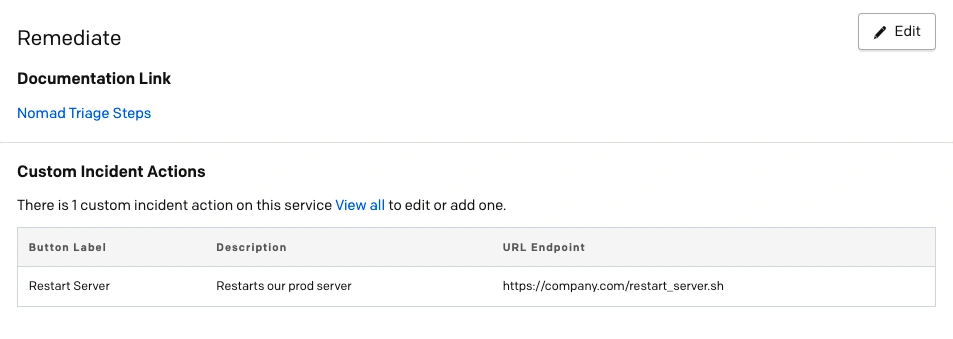 *Remediate settings* ## Service Dependencies Tab > **Required User Permissions:** Users with permission to view each service in a dependency relationship will be able to see **Service Dependencies**. If a user does not have permission to view one or both of the services, they will not be able to see the dependency relationship. Service dependencies can be used to define the relationship between this service and other technical services or [Business Services](/incident-management/services/business-services). If an issue arises on your service for one of the dependencies you have configured, you can use the **Service Dependencies** tab to quickly assess the impact's scope. 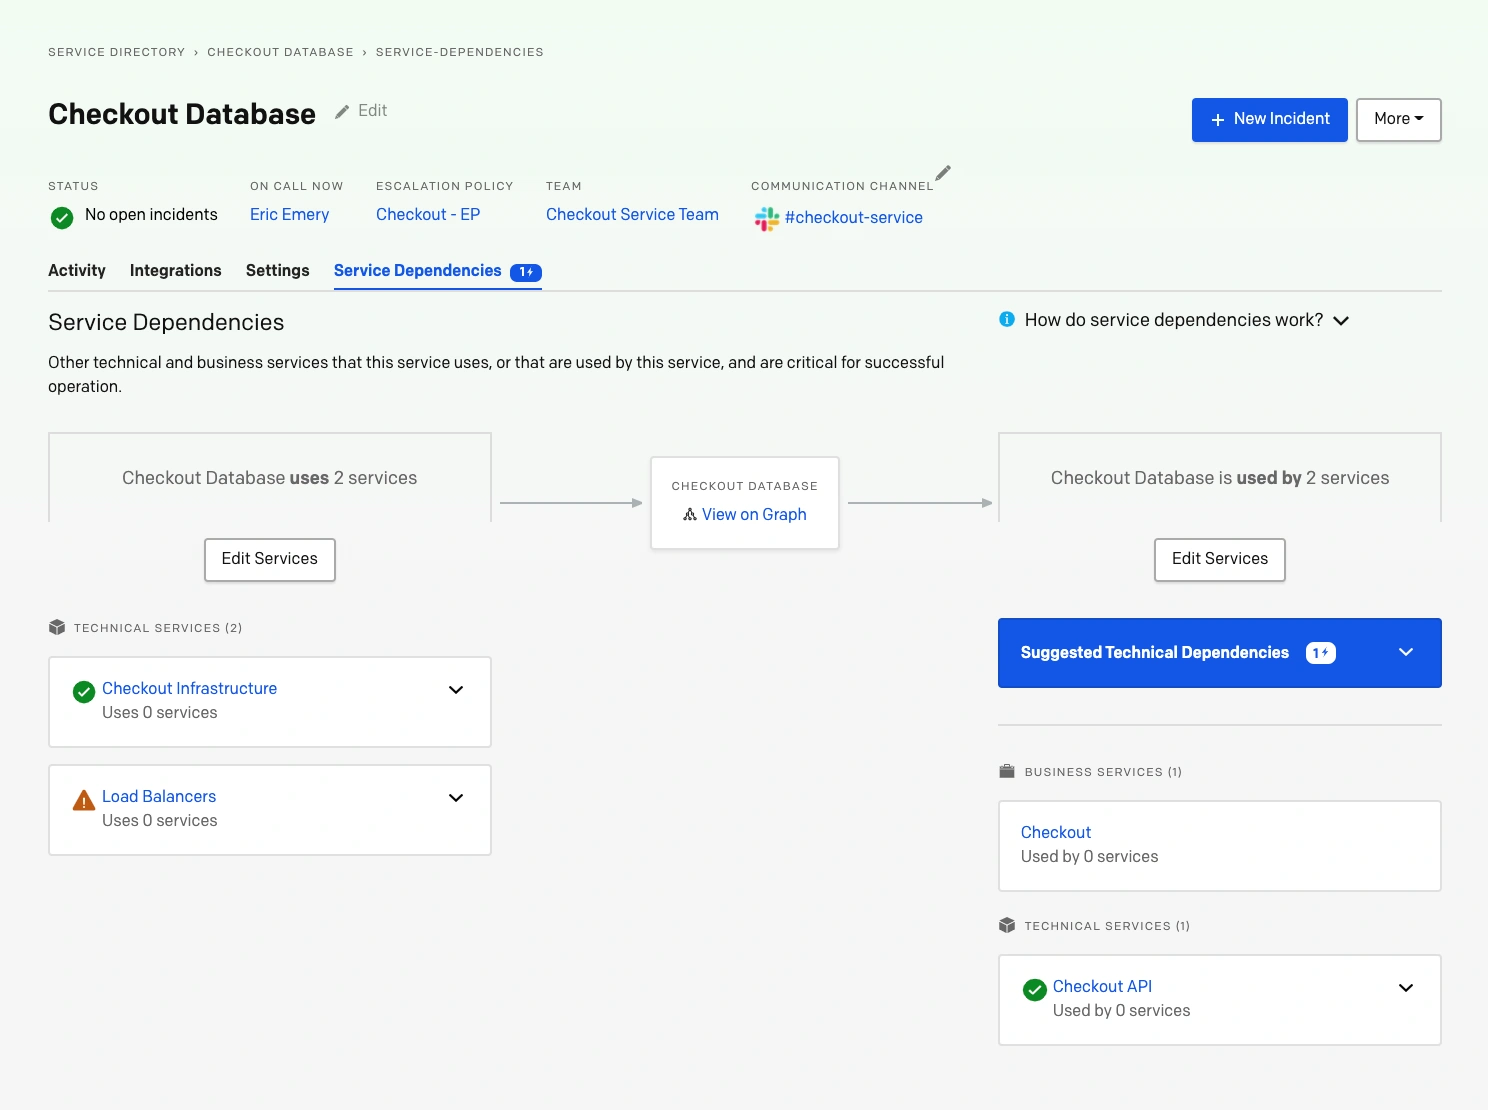 *Service dependencies chart* You can expand each technical service to see details such as the associated escalation policy and who is currently on call. ### Add or Remove Service Dependencies via the Web App > **Required User Permissions:** Managers, Admins and Account Owners can add or remove service dependencies. 1. Navigate to **Services** → **Service Directory** and click the **title** of your desired service. 2. Select the **Service Dependencies** tab. - There are two sections: **Add/Edit Services** that this service _uses_ or add/edit ones that this service is _used by_. Click **Add Services** or **Edit Services** depending on your desired use case. 3. In the Edit Services modal, you may search by service name, or select one from the **Business Services** or **Technical Services** tabs. - **To add a service dependency**: Click to add your preferred service(s); you may add multiple business and technical services. _Optional_: You may also create a new business or technical service from this screen by selecting **Create a new business service** or **Create a new technical service** on their respective tabs. This will open the [Business Service](/incident-management/services/business-services#create-a-business-service) or [Technical Service](/incident-management/services/services-and-integrations#create-a-service) configuration screen in a new tab. - **To remove a service dependency**: Click next to a service's name. 4. Click **Save Changes**. 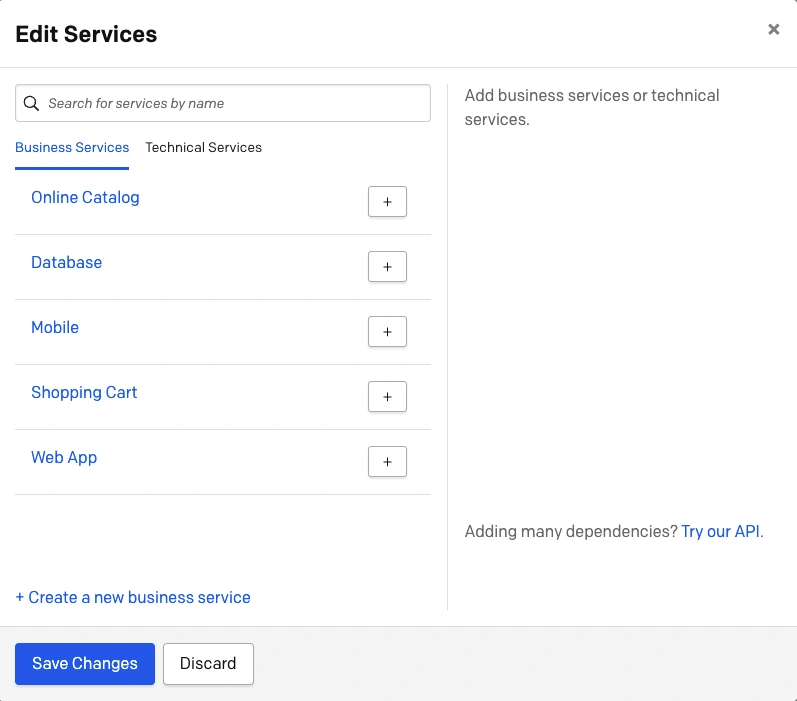 *Edit service dependencies* ### Add Service Dependencies via API You may [add service dependencies using our REST API](/developer/api/reference/rest/service-dependencies/create-service-dependency). ### Service Dependencies in Incidents You may view and add service dependencies from incidents using our [Service Dependencies](/incident-management/services/service-dependencies) feature. ### Suggested Service Dependencies Suggested Service Dependencies uses machine learning to suggest other services that may depend on your service, or that your service depends on. If incidents on your service tend to be followed by incidents on another service, or vice versa, Suggested Technical Service Dependencies will be provided. This feature ensures that a service’s dependency topography is continually up-to-date as your technical infrastructure evolves and changes. You may view **Suggested Service Dependencies** on individual services’ **Service Dependencies** tabs or on an active incident, which will have a blue pill with the number of suggested dependencies, if they are available:  *Service dependencies indicator* #### View and Add Suggested Service Dependencies 1. Navigate to **Services** → **Service Directory**, click your desired service’s **name**, and select the **Service Dependencies** tab. - **Note**: If your service has suggested dependencies, you will be able to view them by clicking the blue **Suggested Technical Dependencies** dropdown. If the machine learning algorithm has not detected any suggested dependencies, this blue dropdown will not be available. 2. **To accept a Suggested Service Dependency**: Click ✓ next to the service name. - **To dismiss a Suggested Service Dependency**: If you do not feel that a Suggested Service Dependency correlates with your service, click ✗ next to the service name to dismiss the suggestion. **Please Note**: Once you dismiss a suggestion, it will never be shown again as a suggestion. If you change your mind, however, you may always [manually add the dependency](/incident-management/services/service-profile#add-or-remove-service-dependencies-via-the-web-app) at a later time. 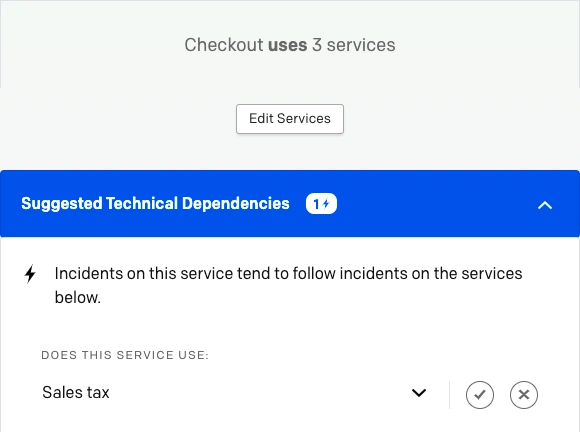 *Suggested service dependencies* ### Service Dependencies in the Mobile App You can view service dependencies in the mobile app by navigating to **Services** → select your desired service → tap the **Dependencies** row. This will take you to the Service Dependencies screen, which will list the business or technical service(s) it uses or is used by. 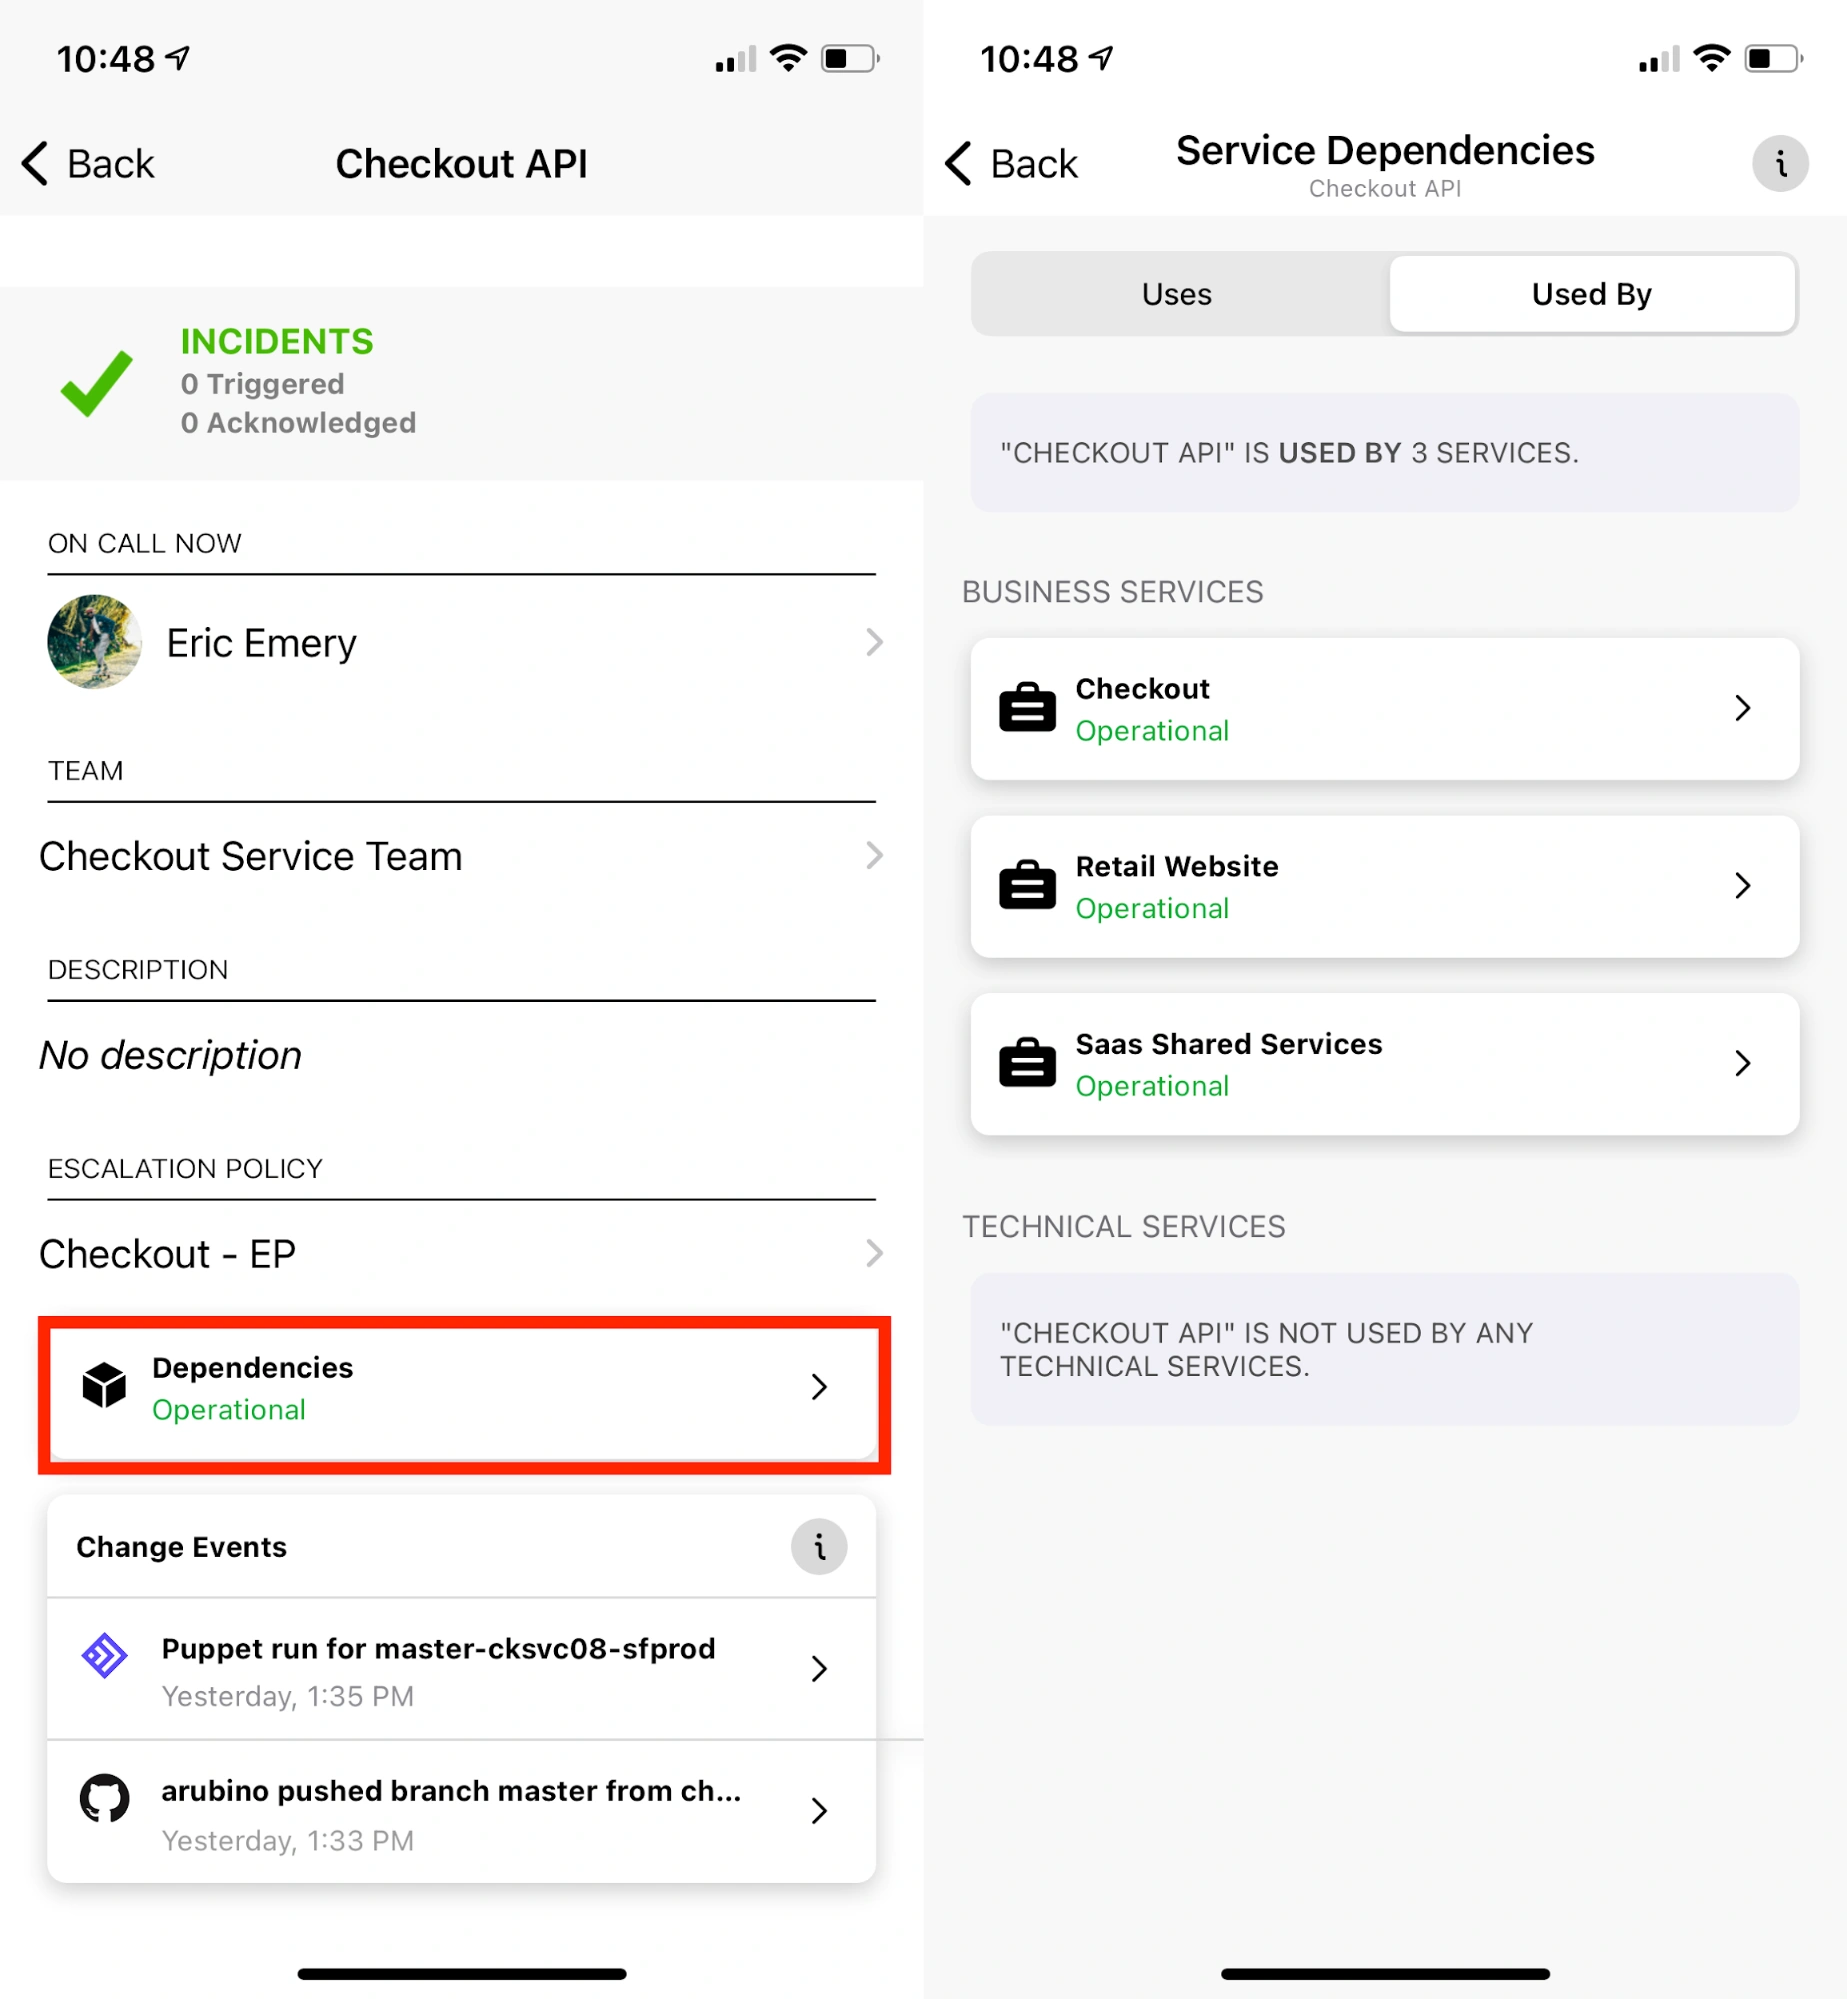 *Service dependencies in the mobile app* ## FAQ **I already have a Slack channel configured for my service, why is it not appearing under Communication Channel?** Communication Channels are configured for a service separately from Slack extensions. You may have a channel where you’ve configured your PagerDuty notifications to appear, but the Communication Channel should be where other teams can best reach out to your team. This may or may not be the same as the channel where your Slack extension is configured. --- URL: https://docs.pagerduty.com/incident-management/services/services-and-integrations # Services and Integrations Create a service and add integrations to begin receiving incident notifications A technical service reflects a discrete piece of functionality that is wholly owned by one team. One or more technical services combine to deliver business capabilities. You can add one or more [integrations](/integrations) to a technical service to receive events from those tools. > **Best Practices:** Read the [Full Service Ownership](/ops-guides/service-ownership) guide when creating new services. This guide provides best practices that software delivery operations teams can use to ensure they are equipped to fully own their services. > **Required User Permissions:** The following roles can create, edit, and delete services: > > - User > - Admin > - Manager base roles and team roles. Manager team roles can only manage services associated with their team. > - Global Admin > - Account Owner ## Create a Service To create a service in the web app: 1. Navigate to **Services** → **Service Directory** and click **New Service**. 2. Enter the following details: | Field | Value | | --------------- | -------------------------------------------------------------------- | | **Name** | Enter a name based on the function that the service provides. | | **Description** | Enter a description based on the function that the service provides. | 3. Click **Next**. 4. Select **Generate a new escalation policy** or **Select an existing escalation policy**. Click **Next**. - If you generate a new escalation policy, you are the first-level on-call for the service. You can [edit the escalation policy](/incident-management/schedules/escalation-policies#edit-an-escalation-policy) at any time after the service is created. 5. Configure **AIOps** settings: > **AIOps / Signal Intelligence Notes:** - Alert grouping is only available with [PagerDuty AIOps / Signal Intelligence](/ai-automation/aiops/overview). If you do not have this feature, skip ahead to **Integrations** in step 6. > - On AIOps plans, all newly created services have AIOps enabled by default. Refer to the [Manage AIOps](/incident-management/services/configurable-service-settings#manage-aiops) section for steps to disable AIOps after service creation. > - On PD Reliability Platform plans, Signal Intelligence is disabled by default on newly created services and Event Orchestrations.
1. Select one of the following options:
- **[Intelligent](/ai-automation/aiops/noise-reduction/alert-grouping/intelligent-alert-grouping)**: Select this option to group intelligently, based on alert content and past groups.
- **[Content-Based](/ai-automation/aiops/noise-reduction/alert-grouping/content-based-alert-grouping)**: To group alerts when contents of specified alert fields match, click **Create Grouping** and select your alert grouping criteria. You can choose to group alerts based on **Any** or **All** of the following fields, then select your preferred **Field Name**.
- **[Unified Alert Grouping](/ai-automation/aiops/noise-reduction/alert-grouping/unified-alert-grouping)**: Combines content-based alert grouping and intelligent alert grouping with a flexible time window.
- **[Time-Based](/ai-automation/aiops/noise-reduction/alert-grouping/time-based-alert-grouping)**: To group for a selected duration, select your preferred **duration** from the dropdown.
- **Turn Off Alert Grouping**: Select this option if you do not want to use alert grouping.
2. Click **Next**.
6. **Integrations**: Select the integrations you use to send alerts to this service from the search bar, dropdown, or from the list of most popular integrations.
- If you do not want to add an integration, click **Create service without an integration** at the bottom of the page.
7. Click **Create Service**.
- If you add an integration to your service, you are directed to the service's **Integrations** tab, where you can find the integration guide, along with an integration key. **Follow the integration guide instructions to complete configuration**. Once you complete the integration guide instructions, your service configuration is complete.
- If you do not add an integration to the service, no further configuration is necessary.
- You can also customize your service to include other attributes such as [urgency](/incident-management/services/configurable-service-settings#notification-urgency), [acknowledgment timeouts](/incident-management/services/configurable-service-settings#acknowledgement-timeout), [auto-resolution](/incident-management/services/configurable-service-settings#auto-resolution), or [incident workflows](/ai-automation/automation/incident-workflows).
## Edit Service Settings
To edit an existing service's settings:
1. Navigate to **Services** → **Service Directory** and select or search for your service.
2. Click **Edit** to the right of the [service detail or setting](/incident-management/services/configurable-service-settings) you want to change.
3. Once you edit your preferred settings, click **Save changes**.
### Edit a Service's Escalation Policy
1. Navigate to **Services** → **Service Directory** and select or search for your service.
2. Select the **Settings** tab and click **Edit** to the right of **Assign and Notify**.
3. Under **Assign to escalation policy**, search for and select an escalation policy.
4. Click **Save changes**.
## Disable and Re-Enable Services
Disabling a service is a choice in the following cases:
- A service is no longer in use and you want to preserve its settings for future use.
- To prevent incidents from triggering.
Disabling a service is similar to [putting a service in maintenance mode](/incident-management/services/maintenance-windows). New incidents do not trigger while a service is in either of these states.
The main difference is that a maintenance window eventually ends and brings a service back online. A disabled service must be manually re-enabled.
### Disable a Service
1. Navigate to **Services** → **Service Directory** and select or search for your service.
2. On the right side, navigate to **More** → **Disable Service**.
3. In the confirmation dialog, click **Disable**.
### Re-Enable a Service
1. Navigate to **Services** → **Service Directory** and select or search for your service.
2. On the right side, navigate to **More** → **Enable Service**.
## Delete a Service
1. Navigate to **Services** → **Service Directory** and select or search for your service.
2. In the top right, navigate to **More** → **Delete Service**.
3. Read the confirmation modal and click **Delete Service**.
## Add Integrations to an Existing Service
You can add more than one integration to a service, which allows you to represent the components in your tech stack as services in PagerDuty. Components can be applications, micro-services in an application's architecture, or cross-cutting shared infrastructure (for example, networks and security). Consolidating integrations into appropriate services also helps improve accuracy with service-level reporting in [Insights](/incident-management/analytics/insights) reports.
1. In the [Integrations Directory](/integrations), search for and select your integration's guide.
2. Navigate to **Services** → **Service Directory** and select the service where you want to add the integration.
3. Select the **Integrations** tab and click **Add another integration**.
4. Select the integrations you use to send alerts to this service from the search bar, dropdown, or from the most popular integrations list.
5. Click **Add**.
> **Product Limit:** A service cannot have more than 250 integrations.
6. Find your integration in the list and click on the right to view and copy your **Integration Key**.
7. Continue with the instructions in the integration guide to complete configuration.
For information on how to add extensions to a service, refer to [Extensions](/integrations/extensions).
## Edit an Integration
To edit an integration that exists on a service:
1. Navigate to **Services** → **Service Directory** and select or search for the service with the integration you want to edit.
2. Select the **Integrations** tab and click the gear icon to the right of your integration.
3. In the top right, click **Edit Integration**.
4. Enter a new value for the **Integration name**.
5. Click **Save changes**.
### Generate a New Integration Key
You can rotate an integration key for routine security or if it becomes compromised.
1. Navigate to **Services** → **Service Directory** and select or search for the service with the integration key you want to rotate.
2. Select the **Integrations** tab and click the gear icon to the right of your integration.
3. In the top right, click **Edit Integration**.
4. Select **Generate a new integration key**
- A browser alert asks you to confirm your decision before generating the new key. If you click **Cancel**, the integration key remains unchanged. If you confirm the change, the key is overwritten immediately, even if you leave the edit page.
5. Click **Save changes**.
### Move an Integration to Another Service
You can move an integration from one service to another. You can move integrations between as many services as needed, as many times as needed, and all incidents tied to that integration follow.
> **Note:** - Your integration key does **not** change after moving the integration from one service to another.
> - If there are more than 8,000 open (that is, triggered or acknowledged) incidents associated with an integration, you cannot move the integration unless you resolve some first. [Contact the Support team](https://www.pagerduty.com/contact-us/#contact-support) if you want to move an integration with more than 8,000 open incidents.
1. Navigate to **Services** → **Service Directory** and select or search for the service with the integration you want to move.
2. Select the **Integrations** tab and click the gear icon to the right of the integration.
3. On the right side of the screen, select **Move to Another Service**.
4. In the **Destination Service** dropdown, select the new service where you want to move the integration.
> **Note:** If the settings on the destination service differ from the current service, you receive a warning message alerting you to the configuration differences.
5. Select **Confirm & Move Integration**.
## Delete an Integration
If an integration is no longer needed, it can be deleted from the service. A deleted integration cannot be recovered. If you need to use the integration again, you can create a new one of the same type on the service.
1. Navigate to **Services** → **Service Directory** and select or search for the service with the integration you want to delete.
2. Select the **Integrations** tab and click the gear icon to the right of the integration you want to delete.
3. On the right side, select **Delete Integration**.
4. Confirm your selection in the dialog window.
> **Note:** - To temporarily deactivate an integration instead, you can either place the service in [maintenance mode](/incident-management/services/maintenance-windows), or temporarily [move the integration](/incident-management/services/services-and-integrations#move-an-integration-to-another-service) to an inactive service.
> - When an integration is deleted, PagerDuty does not remove the incidents. There are no changes to the open or resolved incidents.
## Create a Generic Events API Integration
If there is not an out-of-the-box integration for your tool, so long as your system can make outbound HTTP calls, you can integrate using the Events API.
> **Required User Permissions:** The following roles can add integrations:
>
> - Manager\*
> - Admin
> - Global Admin
> - Account Owner
>
> \*Permissions for adding integrations can vary. Check for notes on requirements in the introduction of the integration guide.
To add a generic integration:
1. Follow the instructions to [add an integration to an existing service](#add-integrations-to-an-existing-service), or to [create a service with an integration](#create-a-service), and select **Events API V2** or **Events API V1** on the Integrations page.
2. Once complete, you can find the **Integration Key** in the Integrations tab by clicking to the right of the integration. Use this key in your monitoring tool to send events to PagerDuty.
### Events API v2
The Events API allows monitoring tools to directly send events in the [PD-CEF](/developer/api/pd-cef) format. If you are using custom monitoring, you can also use this format to take advantage of PD-CEF's display and workflow features.
## Create a Vendor Specific Service via API
You can create a service with a vendor-specific integration (for example, AWS CloudWatch) via the [REST API](/developer/rest-api-overview).
You must know the vendor details, which are not shown in the web app, but can be obtained from the [Vendors API](/developer/api/reference/rest/vendors/get-vendor). Afterward, you can create a [new service](/developer/api/reference/rest/services/create-service) or [new integration](/developer/api/reference/rest/services/create-service-integration) with the details you received from the Vendors API.
## FAQ
**Should I use Events API v1 or v2?**
Events API v2 is designed to handle machine-generated monitoring and event data, such as infrastructure monitoring (Nagios, SignalFX, Datadog), application performance monitoring (New Relic, AppDynamics), and external site checks (Pingdom, Wormly).
For human-generated events, tickets, or incidents, such as those from ServiceNow or JIRA, use the [REST API](/developer/api/reference/rest/incidents/create-incident) to enable direct, streamlined creation of PagerDuty incidents.
If you are using a custom monitoring tool, library, or script that has not yet been updated to v2, select [Events API v1](/developer/events-api-v1-overview).
---
URL: https://docs.pagerduty.com/integrations
# Integration Catalog
Browse setup guides for PagerDuty's documented integrations
PagerDuty integrates with 750+ tools. This page lists the integrations with a setup guide documented here. For the full searchable catalog — including integrations without a dedicated guide — visit the [PagerDuty Integrations Directory](https://www.pagerduty.com/integrations/).
## Catalog
- [Amazon CloudWatch Integration Guide](/integrations/amazon-cloudwatch-integration-guide)
- [Amazon EventBridge Integration Guide](/integrations/amazon-eventbridge-integration-guide)
- [Amazon GuardDuty Integration Guide](/integrations/aws-guardduty-integration-guide)
- [AWS CloudTrail Integration Guide](/integrations/aws-cloudtrail-integration-guide)
- [AWS Health Dashboard Integration Guide](/integrations/aws-health-dashboard)
- [AWS Security Hub Integration Guide](/integrations/aws-security-hub-integration-guide-pagerduty)
- [Backstage Plugin Guide](/integrations/backstage-integration-guide)
- [Bitbucket Integration Guide](/integrations/bitbucket)
- [Datadog Apps Integration Guide](/integrations/datadog-apps-integration-guide)
- [Email Integration Guide](/integrations/email-integration-guide)
- [GitHub Changes Integration Guide](/integrations/github-changes)
- [GitLab Changes Integration Guide](/integrations/gitlab-changes)
- [Google Workspace Integration Guide](/integrations/google-workspace-integration-guide)
- [Jenkins Changes Integration Guide](/integrations/jenkins-changes)
- [Jira Cloud Integration Guide](/integrations/jira-cloud)
- [Jira Server Integration Guide](/integrations/jira-server)
- [Microsoft Teams Integration Guide](/integrations/microsoft-teams)
- [Nagios Troubleshooting Guide](/integrations/nagios-troubleshooting-guide)
- [PagerDuty Agent Integration Guide](/integrations/pagerduty-agent-integration-guide)
- [Salesforce Service Cloud Integration Guide](/integrations/salesforce-service-cloud-integration-guide)
- [ServiceNow CSM Integration Guide](/integrations/servicenow-csm-integration-guide)
- [ServiceNow Integration Guide](/integrations/servicenow-integration-guide)
- [Slack Integration Guide](/integrations/slack-integration-guide)
- [SolarWinds Orion Troubleshooting Guide](/integrations/solarwinds-orion-troubleshooting-guide)
- [Zabbix Troubleshooting Guide](/integrations/zabbix-troubleshooting-guide)
- [Zendesk Integration Guide](/integrations/zendesk-integration-guide)
- [Zoom Integration Guide](/integrations/zoom-integration-guide)
## Build
If you're looking to connect a tool that doesn't have a dedicated guide, build your own integration or app, or send data to and from PagerDuty in a general-purpose way.
- [Add-ons](/integrations/add-ons)
- [Apps](/integrations/apps)
- [Custom Incident Actions](/integrations/custom-incident-actions)
- [Custom Integration](/integrations/custom)
- [Events API (Inbound)](/integrations/events-api)
- [Extensions](/integrations/extensions)
- [Generic Webhooks](/integrations/webhooks)
- [Live Call Routing](/integrations/live-call-routing)
---
URL: https://docs.pagerduty.com/integrations/add-ons
# Add-ons
Enhance PagerDuty's capabilities with your own scripts, web apps and dashboards
Add-ons enhance your PagerDuty experience with apps hosted outside of the core PagerDuty product, but are still accessible within the PagerDuty web app. For example, you can add your own scripts, web apps, and dashboards to your PagerDuty environment. Add-ons can interact with the [APIs](/developer/introduction), which means you can customize the PagerDuty web app to provide additional functionality that is not currently available.
> **Required User Permissions:** The Account Owner and Admin users can manage Add-ons. If you are not sure what role you have, or if you need your permissions adjusted, view [Check Your User Role](/account-admin/user-roles#check-your-user-role) or [Edit User Roles](/account-admin/manage-users#edit-user-roles).
## View Add-ons
Add-ons may appear in two different places, depending on which option you select during [installation](#install-add-ons):
- **Its own page**: This option adds a link under **Your Integrations** when you hover over **Integrations** in the web app.
*View add-ons*
- **Incidents on these services**: This option embeds your add-on on the incidents detail page of any services you select during [configuration](#install-add-ons).
*Custom dashboard*
## Install Add-ons
1. In the PagerDuty web app, navigate to **Integrations** → **Add-On Settings**.
2. Click **New Add-on**.
3. Enter a **Name**, choose a [display preference](#view-add-ons) value for **Shown on** (i.e., **Its own page** or **Incidents on these services**), and a **URL** where the add-on is hosted.
4. Click **Save**.
> **Response Header Requirements:** Set the following response headers for the server that hosts add-ons to load the document in a frame:
>
> `X-Frame-Options: allow-from https://YOUR-SUBDOMAIN-HERE.pagerduty.com`
> `Access-Control-Allow-Origin: https://YOUR-SUBDOMAIN-HERE.pagerduty.com`
## Edit Add-ons
1. In the PagerDuty web app, navigate to **Integrations** → **Add-On Settings**.
2. Next to your desired add-on, select **Edit**.
3. Make your required changes and click **Save**.
> **Tip:** Add-ons installed with the display option **Incidents on these services** can be customized after installation to display on different services, or all services, without re-installing the add-on. However, it is not possible to change an add-on's display preference between **Incidents on these services** and **Its own page** without uninstalling and re-installing the add-on.
## Delete Add-ons
1. In the PagerDuty web app, navigate to **Integrations** → **Add-On Settings**.
2. Next to your desired add-on, select **Delete**.
3. Click **Delete** in the confirmation modal.
1. **Note**: This is a non-reversible action and cannot be undone.
--- URL: https://docs.pagerduty.com/integrations/advanced-servicenow-configuration-v7 # Advanced ServiceNow v7 Configuration How to leverage the full power and versatility of the ServiceNow v7 and PagerDuty integration > **Integration Customizations:** The following article illustrates ways you may choose to customize workflows in the ServiceNow integration. Please note, however, that any customizations which alter the integration's out-of-the-box behavior are not supported by the PagerDuty Support team. > > For assistance with advanced ServiceNow configurations, please contact your account manager/sales representative or reach out to [PagerDuty Services](https://www.pagerduty.com/services/). ServiceNow is a robust, highly-customizable enterprise integration that you can configure in concert with your PagerDuty account to meet your business's needs. Below are some guidelines to customize your ServiceNow integration with advanced features. ## Best Practices for Automation It is strongly recommended that you do not configure any overlap, in terms of automated modifications to ServiceNow records (e.g., Assignment Rules), between inbound field rules, priority synchronization, webhook import customization, and the basic behavior of the integration (i.e., mapping between Configuration Items, assignment groups, PagerDuty services and escalation policies, etc.). In other words, please ensure that your automations do not modify any fields that another feature of the integration acts upon, or that the integration uses to map objects between ServiceNow and PagerDuty. For example, if you map Configuration Items to PagerDuty services in the integration, do not set the CI field of an incident in the inbound field rules. Especially if you have enabled priority synchronization, do not define any rules that set the **Urgency**, **Impact** or **Priority** fields in ServiceNow incidents. Keeping automation simple and non-overlapping will help you avoid unpredictable or unstable behavior. ## Inbound Field Rules You can define rules to automatically set fields in a ServiceNow incident based on the field values in PagerDuty webhooks. The integration can automatically set required fields when incidents are created or modified. Additionally, you can run custom JavaScript code when incident lifecycle data is imported into ServiceNow. Two example rules, which are disabled by default, but available for reference and adaptation, are available with the base installation of the app: - **Configuration item - set from payload on trigger** - **Configuration Item - set default on trigger**  *Inbound Field Rules* ### Basic Setup 1. In ServiceNow, go to **PagerDuty** → **Configuration** → **Inbound Field Rules** → **New** to open the form to create a new field rule. - If you wish to make the rule active immediately, check **Active**. 2. Select the **PagerDuty Webhook Type** to specify which incident lifecycle event the rule should be applied at. - For a list of webhook types, see [Webhooks Overview: Webhook Types](/developer/webhooks-v2-overview#webhook-types). 3. Select the **ServiceNow incident field** to be populated, and define how the field should be set: - **Set Default Value:** use a fixed value to populate the field. - **Set From PagerDuty Webhook Payload:** Using [dot notation](https://developer.mozilla.org/en-US/docs/Web/JavaScript/Reference/Operators/Property_accessors#dot_notation), specify the namespace path to the property of the PagerDuty webhook to be used. 4. When setting a default value, a free form text field will appear, in which you can specify the default value for the field. 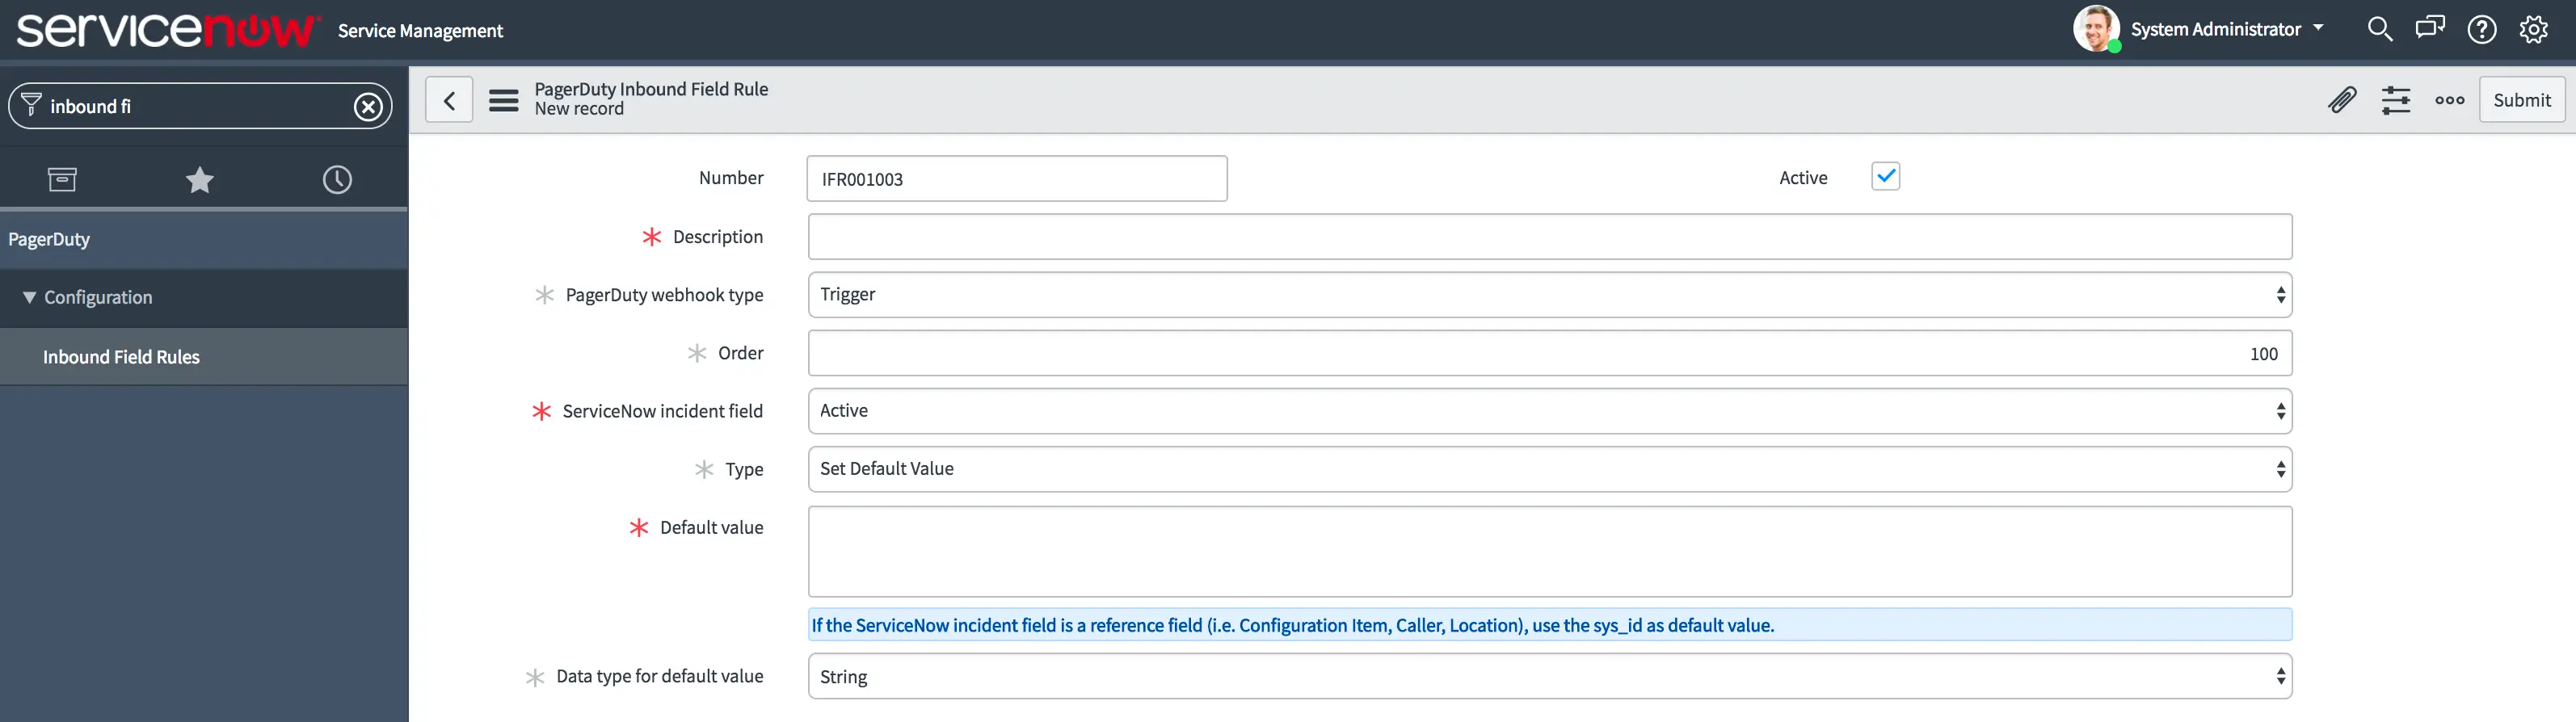 *Inbound Field Rule definition form* ### Set Values Based on the Webhook Payload When setting values based on the webhook payload, a field named **PagerDuty webhook payload field** will appear in which you can enter the property of the webhook to reference. To see available properties, you can look in **Webhook Import Rows**; sample JSON-encoded objects should be saved in the **Payload** column. A few examples of fields in the PagerDuty webhook payload you might specify: - `log_entries`: the log entry object associated with the incident lifecycle event. See [Log Entries API](/developer/api/reference/rest/log-entries/list-log-entries) for the expected schema of such objects. - `log_entries.channel`: if the event is `incident.trigger`, this will be the original data received by PagerDuty that triggered the incident. This could be useful if the incident originated from an upstream monitoring tool. - `log_entries.service`: The service on which the incident was triggered / to which it corresponds. - `log_entries.teams`: An array of `TeamReference` objects - `event`: the [Webhook Type](/developer/webhooks-v2-overview#webhook-types) - `incident`: the incident object (see "Response Schema" in the [Incidents API reference](/developer/api/reference/rest/incidents/get-incident)) ### Run a Lookup Script Enable this option to run custom JavaScript that performs additional actions and define the final value to be applied to a ServiceNow incident field, instead of defining field rules to obtain the additional data. A text box will appear when you check **Run lookup script**. Within the script's body there is a variable named `value`, whose value will be retrieved from the webhook payload specified in the **PagerDuty webhook payload field**. By the end of the script, define a value for the variable `result`, and that value will be used to populate the field. It is not necessary to commit or save the record at the end of the script. ### Test Your Inbound Field Rule If you are setting a field from PagerDuty webhooks, you can test the rule by selecting **Test Set From PagerDuty Webhook Payload**. This will allow you to specify the **Webhook Payload Field** name (such as `log_entries.channel`), provide a sample payload (copied from one of your **Webhook Import Rows** table), then verify the returned value. ## Priority Synchronization Priority levels set for incidents in PagerDuty can automatically set the priority levels on the linked incident in ServiceNow, and vice versa. When the priority is modified on the incident in ServiceNow, it is updated in real-time in PagerDuty. Similarly, the incident priority is set when initially triggering the incident in PagerDuty. When changing the priority on a PagerDuty incident, the change will be reflected in ServiceNow after it receives the next webhook event for the incident. > **Tip:** If you need to change an incident's priority, we recommend leaving a text note to keep relevant stakeholders informed. ### Import PagerDuty Priorities First, define incident priorities in your PagerDuty account by going to **User Icon** → **Account Settings** → **Incident Priorities**. For more information, please see [Incident Priority](/incident-management/incidents/incident-priority). Next, in ServiceNow navigate to **PagerDuty** → **Actions** → **Refresh PagerDuty Priorities.** After this, priorities will populate in the table `x_pd_integration_pagerduty_priority`, whose contents are displayed under **Priorities**. ### Define the Priority Mapping Once you have [imported PagerDuty priorities](#import-pagerduty-priorities), in ServiceNow navigate to **PagerDuty** → **Configuration** → **Priorities**. Here you will find a predefined list of your PagerDuty [priorities](/incident-management/incidents/incident-priority), which can then be mapped to ServiceNow urgency and impact value pairs. The computed ServiceNow priority value will also be shown in the table.  *PagerDuty priorities in ServiceNow* To edit how incident priorities in PagerDuty map to priorities in ServiceNow, select **PagerDuty priority** in the desired mapping to edit the record and set a value for its corresponding ServiceNow impact and urgency. After saving, the ServiceNow priority will be computed and shown in the table.  *Priority mapping* ## Customized Automation If you need to customize the webhook import process (when data and events from PagerDuty are synchronized to ServiceNow) beyond what inbound field rules offer, we recommend using the `PagerDutyInboundCustomScript` Script Include. This script include will not be modified in future releases, so you can safely modify its source code without concern for incorporating changes from software updates. You can find this script include in ServiceNow under **PagerDuty** → **Configuration** → **Configuration Files** → **Script Includes**. Within this script include's source code, you will find a function `customPostTransformActivity` defined in the prototype declaration. This is the function where you can define what code to run in place of all other actions that are taken when webhook data from PagerDuty is translated into incident data in ServiceNow. This function will be executed during the **Webhook Import** process. Within the scope of the `customPostTransformActivity` function, three parameters are available as local variables: 1. `source` ([GlideRecord](https://developer.servicenow.com/dev.do#!/learn/courses/sandiego/app_store_learnv2_scripting_sandiego_scripting_in_servicenow/app_store_learnv2_scripting_sandiego_server_side_scripting/app_store_learnv2_scripting_sandiego_gliderecord)): the webhook import row. Note the property `source.payload`, which contains a JSON string representing the webhook's payload. 2. `target` ([GlideRecord](https://developer.servicenow.com/dev.do#!/learn/courses/sandiego/app_store_learnv2_scripting_sandiego_scripting_in_servicenow/app_store_learnv2_scripting_sandiego_server_side_scripting/app_store_learnv2_scripting_sandiego_gliderecord)): the ServiceNow incident to be created or updated, depending on the action. 3. `action` (string): will be `insert` if a new incident record in ServiceNow is being created, or `update` if an existing one is being updated. --- URL: https://docs.pagerduty.com/integrations/amazon-cloudwatch-integration-guide # Amazon CloudWatch Integration Guide | PagerDuty Configure the Amazon Cloudwatch integration ## Amazon CloudWatch + PagerDuty Benefits - Amazon CloudWatch provides monitoring for AWS resources and customer-run applications. The service can collect data, gain insight, and alert users to fix problems within applications and organizations. - Amazon CloudWatch gives system-wide visibility into resource utilization, and notifications can be set for metrics that cross specified thresholds. These notifications can be automatically sent to PagerDuty, which reliably alerts the correct on-call responder through their preferred contact methods. ## Requirements **General**: - The integration expects to find a nested JSON-encoded object in the `Message` property. If PagerDuty does not receive it, an alert does not trigger. **To Configure the Integration**: - **In PagerDuty**: Managers, Admins, Global Admins, and the Account Owner can configure the integration. > **Compatibility:** This integration is available for Amazon CloudWatch on AWS Cloud or AWS Outposts. ## How it Works - When an AWS service metric goes beyond a predefined threshold, a CloudWatch alert sends a notification to a PagerDuty endpoint and triggers an incident. - When the AWS service metric returns to an OK state below the predefined threshold, a resolve event is sent to the same endpoint, and the PagerDuty incident resolves. ## Version This guide details configuration of the **Amazon CloudWatch V1** integration. ## Integration Walkthrough ### In PagerDuty There are two ways to integrate Amazon CloudWatch with PagerDuty: - [Integrate With Event Orchestration](#integrate-with-event-orchestration): Integrating with [Event Orchestration](/ai-automation/aiops/event-orchestration) may be beneficial if you want to build nested rules based on the payload coming from AWS. - [Integrate With a PagerDuty Service](#integrate-with-a-pagerduty-service): Integrating directly with a [PagerDuty service](/incident-management/services/services-and-integrations) can be beneficial if you do not need to route alerts from AWS to different responders based on the event payload. You can still use service-level [Event Orchestration](/ai-automation/aiops/event-orchestration#incident-data) to perform actions such as alert suppression. #### Integrate With Event Orchestration ##### Configure a Global Orchestration Integration 1. [Configure a Global Orchestration](/ai-automation/aiops/event-orchestration#global-orchestrations) in your PagerDuty account. 2. Navigate to **AIOps** → **Event Orchestration** → click the **name** of your Global Orchestration. 3. Click the **Global Orchestration Key** dropdown and then copy the **Integration Key**. 4. Once you have your **Integration Key**, the **Integration URL** is: `https://events.pagerduty.com/x-ere/[YOUR_INTEGRATION_KEY_HERE]` You can now proceed to the [In the AWS Management Console](#in-the-aws-management-console) section below. ##### Configure a Service Orchestration Integration 1. [Configure a Service Orchestration](/ai-automation/aiops/event-orchestration#service-orchestrations) in your PagerDuty account. 2. Create a [Generic Events API integration](/incident-management/services/services-and-integrations#create-a-generic-events-api-integration) on the same service. 3. Once complete, copy the **Integration Key** and paste it into the following URL: `https://events.pagerduty.com/x-ere/[YOUR_INTEGRATION_KEY_HERE]` You can now proceed to the [In the AWS Management Console](#in-the-aws-management-console) section below. #### Integrate With a PagerDuty Service ##### Add to a New Service 1. To [add the integration to a new service](/incident-management/services/services-and-integrations#create-a-new-service), navigate to **Services** → **Service Directory** and click **New Service**. 2. Follow the prompts and [configure the service](/incident-management/services/services-and-integrations#create-a-new-service) to your preferences. On the Integrations screen, select **Amazon CloudWatch** from the search bar dropdown, or from the most popular integrations list. 3. Once you are done entering your service settings, click **Create Service**. 4. You will now be in the service's Integrations tab. Find your integration in the list and click the to view and copy your **Integration URL**. Keep it in a safe place for later use. 5. You can now proceed to the [In the AWS Management Console](#in-the-aws-management-console) section below. ##### Add to an Existing Service 1. To [add an integration to an existing service](/incident-management/services/services-and-integrations#add-integrations-to-an-existing-service), go to **Services** → **Service Directory** and select the **service** where you would like to configure the integration. Select the **Integrations** tab and click **Add another integration**. 2. Select **Amazon CloudWatch** from the search bar dropdown, or from the most popular integrations list. 3. Click **Add**. Find your integration in the list and click the to the right to view and copy your **Integration URL**. Keep it in a safe place for later use. 4. You can now proceed to the [In the AWS Management Console](#in-the-aws-management-console) section below. ### In the AWS Management Console 1. In the Services search bar, search and select **Simple Notification Service**. In the SNS dashboard left menu, select **Topics** and click **Create Topic** on the right. This topic is used to route alerts to PagerDuty from AWS. 2. Select the **Standard** Topic **Type**. 3. Next, perform the following: - **Name**: Enter a **name** for your topic. You may want to name your topic after your PagerDuty service's name. - **Display name** (_optional_): Enter an optional **display name**. - Click **Create topic**. 4. Next, select **Subscriptions** in the left menu and click **Create Subscription**. 5. Perform the following: - **Topic ARN**: Select the **Topic ARN** of the topic you just created. - **Protocol**: Select **HTTPS**. - **Endpoint**: Paste your **Integration URL** (generated in steps above). - Ensure that the **Enable raw message delivery** checkbox is **unchecked**. - Click **Create Subscription**. 6. Your subscription should be automatically confirmed. Refresh the page to make sure the **Status** is `Confirmed` and not `PendingConfirmation`. 7. Next, you will create a CloudWatch alarm that sends notifications to your SNS topic when a metric falls outside of a predefined threshold. 8. In the Services search bar, search and select **Cloudwatch**. Select **Alarms** → **All Alarms** and then click **Create Alarm** on the right. 9. Click **Select metric**. Select your [metric](https://docs.aws.amazon.com/AmazonCloudWatch/latest/monitoring/working_with_metrics.html) using either of the following methods: - Select the **service namespace** that contains the metric. Continue selecting your preferred options, which narrows down your choices until a list of metrics appears. Select the **check box** next to your desired **Metric Name**. - In the search field, enter the name of a metric, dimension, or resource ID and hit **Enter**. Then select your desired results and continue selecting your preferred options until a list of metrics appears. Select the **check box** next to your desired metric. [Read more about commonly used metrics](#commonly-used-metrics). 10. Next, select the **Graphed metrics** tab. Under **Statistic**, select one of the statistics or predefined percentiles, or specify a custom percentile (for example, p95.45). Under **Period**, select the evaluation period for the alarm. Click **Select metric** to continue. 11. On the next page under Conditions, select from the following **Threshold types**: | Threshold Type | Instructions | | :---------------------------------------------------------------------------------------------------------------------- | :------------------------------------------------------------------------------------------------------------------------------------------------------------------------------------------------------------ | | [Static](https://docs.aws.amazon.com/AmazonCloudWatch/latest/monitoring/ConsoleAlarms.html) | a) Under **Whenever NumberOfObjects is…**, select **Greater**, **Greater/Equal**, **Lower/Equal**, or **Lower**.
b) Under **than…** enter your desired **threshold value**. | | [Anomaly detection](https://docs.aws.amazon.com/AmazonCloudWatch/latest/monitoring/Create_Anomaly_Detection_Alarm.html) | a) Under **Whenever BucketSizeBytes is…** select **Outside of the band**, **Greater than the band**, or **Lower than the band**.
b) Under **Anomaly detection threshold**, set your **threshold value**. | Click **Next** to continue. 12. First, you will configure the **In alarm** state notification, which triggers a PagerDuty incident when the metric has met your predefined threshold. Select the **In alarm** and **Select an existing SNS topic** radio buttons, and then select the **SNS Topic** (created above) from the **Send a notification to…** field. 13. Next, you will configure the **OK** state notification, which automatically resolves the PagerDuty incident if the metric has fallen back into an OK state (not meeting or exceeding the threshold). Click **Add Notification**. Select the **OK** and **Select an existing SNS topic** radio buttons, and then select the **SNS Topic** (created above) from the **Send a notification to…** field. Click **Next** to continue.  *Notification settings* 14. On the next page, enter an **Alarm name** and **Alarm description**. Click **Next** to continue. 15. On the Preview and Create screen, review your alarm's details. If you need to edit any details, click **Edit** to the right of each step. Once you have confirmed all details, click **Create alarm**. 16. You should then see a confirmation modal that your alarm was saved successfully. 17. The integration is now complete. When your alarm threshold is met, it will trigger an incident in PagerDuty. Once that alarm is back in an OK state, the incident automatically resolves in PagerDuty.  *Resolved incident* ## Commonly Used Metrics [Metrics](https://docs.aws.amazon.com/AmazonCloudWatch/latest/monitoring/working_with_metrics.html) that are commonly used with the Amazon CloudWatch integration include, but are _not limited to_: ### EC2 To use the CloudWatch integration with [EC2](https://docs.aws.amazon.com/ec2/?id=docs_gateway) instance metrics, follow the instructions in the Integration Walkthrough and perform the following when you [Create a CloudWatch Alarm](#in-the-aws-management-console): 1. In step 9 above, select **EC2** → **Per instance metrics**. 2. Check the **checkbox** next to the **Instance Name** with your preferred **Metric Name** on the right. Commonly used metrics are **CPU Utilization** and **Status Check Failed**. Read [AWS' documentation](https://docs.aws.amazon.com/AWSEC2/latest/UserGuide/viewing_metrics_with_cloudwatch.html) for more information on EC2 metrics. 3. Continue with the instructions in steps 10-17. ### S3 Storage Lens To use the CloudWatch integration with [S3 Storage Lens](https://docs.aws.amazon.com/AmazonS3/latest/userguide/storage_lens.html) metrics, follow the instructions in the Integration Walkthrough and perform the following when you [Create a CloudWatch Alarm](#in-the-aws-management-console): 1. In step 9 above, select **S3** → **Storage Metrics**. 2. Check the **checkbox** next to the **BucketName** with your preferred **Metric Name** on the right. Commonly used metrics are **Incomplete Multipart Upload Storage Bytes**, **Unencrypted Storage Bytes**, and **Non-Current Version Storage Bytes**. Read [AWS' documentation](https://docs.aws.amazon.com/AmazonS3/latest/userguide/storage_lens_metrics_glossary.html) for more information on S3 Storage Lens metrics. 3. Continue with the instructions in steps 10-17. ### EKS To use the CloudWatch integration with [EKS](https://docs.aws.amazon.com/eks/?id=docs_gateway) metrics, follow the instructions in the Integration Walkthrough and perform the following when you [Create a CloudWatch Alarm](#in-the-aws-management-console): 1. In step 9, select **EKS** → **Container Insights**. 2. Check the **checkbox** next to your preferred **Metric Name** on the right. Commonly used metrics are **cluster\_failed\_node\_count** and **node\_cpu\_utilization**. Read [AWS' documentation](https://docs.aws.amazon.com/AmazonCloudWatch/latest/monitoring/Container-Insights-metrics-EKS.html) for more information on EKS metrics. 3. Continue with the instructions in steps 10-17. ## FAQ **What alarm statuses affect PagerDuty incidents?** An alarm with status `ALARM` triggers incidents, and status `OK` resolves them. Alarms with status `INSUFFICIENT_DATA` **only** trigger PagerDuty incidents. If you need `INSUFFICIENT_DATA` to resolve an incident, PagerDuty recommends using an [email integration](/integrations/email-integration-guide) instead. **If I use an email integration, how can I verify my PagerDuty service's email address?** If you send a confirmation email to your service's PagerDuty address, you can view the message body and verify that address from the PagerDuty console. To do so, find the incident that is created by the email and view its details to verify the email address. The link to verify will be in the incident details. The SNS confirmation page requires JavaScript, which cannot be executed in the iframe the message is rendered in. To confirm your subscription, open the confirmation link in a new tab or window by right-clicking on the link and choosing **Open Link in New Tab/Window**. **How can I change how events from CloudWatch are deduplicated into PagerDuty?** By default, CloudWatch events are deduplicated based on `AlarmName`. This value may not be unique across regions, so you may want to change how your events are deduplicated. Navigate to your PagerDuty **Service** → click the **Integrations** tab → click to the right of your Amazon CloudWatch integration → click **Edit** → change the value for the **Correlate events by** option. **Why are my CloudWatch events not triggering incidents in PagerDuty?** Events that are not sent properly from CloudWatch are dropped and do not trigger alerts in PagerDuty. This integration expects to find a nested JSON-encoded object in the `Message` property, from which meaningful data about the alert can be extracted to compose the PagerDuty incident. You can find details on [Amazon's SNS Message attributes here](https://docs.aws.amazon.com/sns/latest/dg/sns-message-attributes.html). AWS also offers a [troubleshooting guide](https://docs.aws.amazon.com/AmazonCloudWatch/latest/events/CWE_Troubleshooting.html#NeverDeliveredToTarget). **Why is my CloudWatch event triggering duplicate incidents or automatically resolving an incident?** If you have Event Orchestration rules that override event actions or `dedup_key`, they may unexpectedly interact with how PagerDuty handles `INSUFFICIENT_DATA` alarm states from CloudWatch. When CloudWatch sends an `ALARM` type event, AWS may first send an `INSUFFICIENT_DATA` event (before the alarm has collected enough data) followed by a second event once sufficient data is available. To ensure you are notified promptly, PagerDuty triggers an incident on the `INSUFFICIENT_DATA` event. When the subsequent sufficient-data event arrives, PagerDuty automatically sends a resolve event for the `INSUFFICIENT_DATA` incident and triggers a new incident with the full alarm details. This prevents duplicate incidents from being triggered for the same alarm while still alerting you to the initial irregularity. Event Orchestration rules that are applied to all incoming events, without accounting for `INSUFFICIENT_DATA` events, can disrupt this process in two ways: - A rule that forces a trigger action on all events also applies to the resolve `INSUFFICIENT_DATA` event, causing a duplicate incident to be triggered unintentionally. - A rule that overrides the `dedup_key` on all events causes the resolve `INSUFFICIENT_DATA` event to share the same key as the subsequent alarm incident, resulting in that incident being unexpectedly auto-resolved. To prevent this unexpected behavior, add an Event Orchestration rule condition that excludes `INSUFFICIENT_DATA` events. For example, add a condition `event.summary does not match part Insufficient data`, so that the rule does not apply to these events. For more details on configuring conditions in Event Orchestration, see [Event Orchestration](/ai-automation/aiops/event-orchestration). --- URL: https://docs.pagerduty.com/integrations/amazon-eventbridge-integration-guide # Amazon EventBridge Integration Guide | PagerDuty Configure the Amazon EventBridge integration ## Amazon EventBridge + PagerDuty Benefits - Amazon EventBridge allows teams to easily create event-driven workflows that connect native AWS services with third-party SaaS solutions like PagerDuty. - With Amazon EventBridge, PagerDuty customers can leverage the full breadth of AWS-supported integrations and functionality. ## Requirements **To Configure the Integration**: - **In AWS**: For each account that you would like to integrate with PagerDuty, obtain the AWS account ID(s) from your AWS account administrator. - **In PagerDuty**: This integration requires a Manager, Admin, Global Admin or Account Owner base role to configure. **To Use the Integration**: - **In PagerDuty**: All users, except Limited Stakeholders and Full Stakeholders, can [trigger incidents](/incident-management/incidents/overview#trigger-an-incident-via-web-app) in order to use the EventBridge integration. ## How it Works - When you create or update a PagerDuty incident, it sends an event or webhook to notify a designated Event Source in your AWS Account and Region. - You can create an Event Bus to retrieve these notifications and deliver them to an AWS target (such as Lambda) to run a specific function, workflow, SNS topic for another notification delivery, etc. ## Version This guide details configuration of the **Amazon EventBridge v1** integration. ## Integration Walkthrough ### In PagerDuty 1. Navigate to **Services** → **Service Directory** → click the **name** of the service where you would like to configure the integration. 2. Select the **Integrations** tab. Under the **Extensions and Add-Ons** section, click **Add or manage extensions**. 3. Click the **New Extension** button. In the **Extension Type** dropdown, search and select **Amazon EventBridge**. A dialog will pop up prompting you to open the configuration page. Click **Open**. 4. On the Amazon EventBridge configuration page, click the **Add Service** button and perform the following: - **Name**: Enter a **name** for this extension. - **AWS Account ID**: Enter your **AWS account ID**. - **AWS Region**: Select the **AWS region** where you would like to deliver PagerDuty webhooks. For example, if the Lambda functions that you want to target exist in us-west-1, please select N. California. - **Services**: Select the same **Service** that you selected in step 1, above. The incidents created on this service will send updates to the AWS Account ID and Region specified above. - **Event Source Name**: Enter a **name** that will be identifiable when it's received in Amazon EventBridge. There are different naming schemes that you can follow. To start, PagerDuty will automatically prepend your PagerDuty subdomain to this Event Source Name. The full Partner Event Source name will follow this format: `aws.partner/pagerduty.com/{pagerduty-subdomain}-{eventSourceName}` - It’s a good practice to label your Event Source Name such that the PagerDuty technical service sending incident webhooks is easily identifiable by the appropriate teams with access. - Click **Create** to save. 5. After creation, the Amazon EventBridge configuration page will display the new extension that will send incident-related information to the specified AWS account ID and region. Keep this page up for reference as you continue to the next section.  ### In the AWS Console To complete configuration, you will need to create an Event Bus in the AWS Console to receive incident information from PagerDuty. 6. Navigate to the [Partner Event Sources](https://console.aws.amazon.com/events/home#/partners) page under the **Integration** header in the left menu. 7. In the top menu, select the **region dropdown** and change the **AWS Region** to the one specified on the Amazon EventBridge configuration page (Step 4, above). 8. In the **Partner event sources** search bar, search and select the **Event Source Name** that you entered on the Amazon EventBridge configuration page (Step 4, above). Next, click **Associate with event bus** in the top right. 9. On the next screen, click **Associate**. You should see a dialog confirming that you successfully associated the event source with the event bus. 10. Next, select **Rules** in the left menu. From the **Event Bus** dropdown, select the **Event Bus** you just associated, and click **Create rule**. 11. On the next screen, perform the following: - **Name**: Enter a name that can be easily identified. - **Description** _(optional)_: Enter a description of the rule, pattern and target(s). - **Enable the rule on the selected event bus**: Toggle to the **on** position. - **Rule with an event pattern**: This will automatically be preselected. - Click **Next** to continue. 12. On the next page, perform the following: - **Event source**: Select **Other**. - **Sample event** (_optional_): If you would like to view sample events, you may do so in this section. - **Event Pattern**: Select the **Custom Patterns (JSON Editor)** tab. Enter the following in the Event Pattern field: `{"detail-type":["PagerDuty Webhook"]}` - Click **Next** to continue. 13. On the next page, perform the following: - **Target types**: Select **AWS service**. - **Select a target**: Select your **target** (e.g., Lambda). - **Function**: Select **what you would like to happen** once an event matching the Event Pattern (e.g., executing a specific Lambda function). - Configure other additional settings to your preference. - Click **Next** to continue. 14. On the next page, _optionally_ add tags to your preference. Click **Next** to continue. 15. On the final page, review your settings and click **Create Rule**. The integration is now complete. To test the integration, create an incident on the integrated PagerDuty service. ## FAQ **Can you configure the same service to send events to different AWS Accounts?** Yes. You can follow the steps above again, entering different AWS account IDs and regions for the same service. **When configuring the Rule Pattern in AWS, what does the typical event look like coming out of PagerDuty?** PagerDuty can send nine different types of events (or webhooks) to the Partner Event Source for the service(s) where you have EventBridge configured. You can build the Event Pattern in AWS to look for specific values based on the following format: **Note**: You can use your right and left arrow keys to move through these tabs. ```json incident.acknowledge { "version": "0", "id": "f1420bc9-aca1-dc6b-7cb1-65bbdbd96e89", "detail-type": "PagerDuty Webhook", "source": "aws.partner/pagerduty.com/example-example", "account": "999999999999", "time": "2019-07-12T23:30:39Z", "region": "us-west-1", "resources": [ "pagerduty" ], "detail": { "event": "incident.acknowledge", "log_entries": [ { "id": "R01VZ6VKNDJ0CJHSW30OHVHMQV", "type": "acknowledge_log_entry", "summary": "Acknowledged by Pagey the Pager", "self": "https://api.pagerduty.com/log_entries/R01VZ6VKNDJ0CJHSW30OHVHMQV", "html_url": null, "created_at": "2019-07-12T23:30:33Z", "agent": { "id": "PHLAIIG", "type": "user_reference", "summary": "Pagey the Pager", "self": "https://api.pagerduty.com/users/PHLAIIG", "html_url": "https://example.pagerduty.com/users/PHLAIIG" }, "channel": { "type": "website", "details_omitted": false }, "service": { "id": "P6MZ15N", "type": "service_reference", "summary": "pd sandbox eventbridge", "self": "https://api.pagerduty.com/services/P6MZ15N", "html_url": "https://example.pagerduty.com/services/P6MZ15N" }, "incident": { "id": "P8E12U3", "type": "incident_reference", "summary": "[#2618] Taco Shells", "self": "https://api.pagerduty.com/incidents/P8E12U3", "html_url": "https://example.pagerduty.com/incidents/P8E12U3" }, "teams": [], "contexts": [], "acknowledgement_timeout": 600, "event_details": {} } ], "webhook": { "endpoint_url": null, "name": "eventbridge-999999999999-us-west-1-example", "description": null, "webhook_object": { "id": "P6MZ15N", "type": "service_reference", "summary": "pd sandbox eventbridge", "self": "https://api.pagerduty.com/services/P6MZ15N", "html_url": "https://example.pagerduty.com/services/P6MZ15N" }, "config": {}, "outbound_integration": { "id": "PF8FPF1", "type": "outbound_integration_reference", "summary": "Amazon EventBridge", "self": "https://api.pagerduty.com/outbound_integrations/PF8FPF1", "html_url": null }, "accounts_addon": { "id": "PH4YM53", "addon_id": "PXFR4L8", "name": "Amazon EventBridge", "version": "0.0.1", "location": "extension", "key": "com.pagerduty.amazon_bridge", "url": "https://{pagerduty}/integration-eventbridge-ui?accountsAddonId={accountsAddon.id}", "description": "Deliver webhooks to Amazon EventBridge", "help_url": "", "config": {}, "type": "accounts_addon", "summary": "Amazon EventBridge", "self": "https://api.pagerduty.com/accounts_addons/PH4YM53", "html_url": "https://example.pagerduty.com/accounts_addons/PH4YM53" }, "id": "P7X0R2I", "type": "webhook", "summary": "eventbridge-999999999999-us-west-1-example", "self": "https://api.pagerduty.com/webhooks/P7X0R2I", "html_url": null }, "incident": { "incident_number": 2618, "title": "Taco Shells", "description": "Taco Shells", "created_at": "2019-07-12T23:26:41Z", "status": "acknowledged", "incident_key": "4338c648a3614c0ea46b534344f73b10", "service": { "id": "P6MZ15N", "name": "example eventbridge", "description": null, "created_at": "2019-07-12T15:36:28Z", "status": "critical", "teams": [], "alert_creation": "create_alerts_and_incidents", "addons": [], "scheduled_actions": [], "support_hours": null, "last_incident_timestamp": "2019-07-12T23:26:41Z", "escalation_policy": { "id": "PYIM1C5", "type": "escalation_policy_reference", "summary": "Default", "self": "https://api.pagerduty.com/escalation_policies/PYIM1C5", "html_url": "https://example.pagerduty.com/escalation_policies/PYIM1C5" }, "incident_urgency_rule": { "type": "constant", "urgency": "high" }, "acknowledgement_timeout": 600, "auto_resolve_timeout": null, "alert_grouping": null, "alert_grouping_timeout": null, "integrations": [], "metadata": { "conference_number": "", "conference_url": "" }, "response_play": null, "type": "service", "summary": "example eventbridge", "self": "https://api.pagerduty.com/services/P6MZ15N", "html_url": "https://example.pagerduty.com/services/P6MZ15N" }, "assignments": [ { "at": "2019-07-12T23:30:33Z", "assignee": { "id": "PHLAIIG", "type": "user_reference", "summary": "Pagey the Pager", "self": "https://api.pagerduty.com/users/PHLAIIG", "html_url": "https://example.pagerduty.com/users/PHLAIIG" } } ], "last_status_change_at": "2019-07-12T23:30:33Z", "first_trigger_log_entry": { "id": "RNNXHZY9ZKI3FQIGVSIL4UO9Q3", "type": "trigger_log_entry_reference", "summary": "Triggered through the website", "self": "https://api.pagerduty.com/log_entries/RNNXHZY9ZKI3FQIGVSIL4UO9Q3", "html_url": "https://example.pagerduty.com/incidents/P8E12U3/log_entries/RNNXHZY9ZKI3FQIGVSIL4UO9Q3" }, "alert_counts": { "all": 0, "triggered": 0, "resolved": 0 }, "is_mergeable": true, "escalation_policy": { "id": "PYIM1C5", "type": "escalation_policy_reference", "summary": "Default", "self": "https://api.pagerduty.com/escalation_policies/PYIM1C5", "html_url": "https://example.pagerduty.com/escalation_policies/PYIM1C5" }, "teams": [], "impacted_services": [ { "id": "P6MZ15N", "type": "service_reference", "summary": "pd sandbox eventbridge", "self": "https://api.pagerduty.com/services/P6MZ15N", "html_url": "https://example.pagerduty.com/services/P6MZ15N" } ], "pending_actions": [ { "type": "unacknowledge", "at": "2019-07-12T23:40:33Z" } ], "acknowledgements": [ { "at": "2019-07-12T23:30:33Z", "acknowledger": { "id": "PHLAIIG", "type": "user_reference", "summary": "Pagey the Pager", "self": "https://api.pagerduty.com/users/PHLAIIG", "html_url": "https://example.pagerduty.com/users/PHLAIIG" } } ], "basic_alert_grouping": null, "alert_grouping": null, "last_status_change_by": { "id": "PHLAIIG", "type": "user_reference", "summary": "Pagey the Pager", "self": "https://api.pagerduty.com/users/PHLAIIG", "html_url": "https://example.pagerduty.com/users/PHLAIIG" }, "metadata": {}, "external_references": [], "priority": null, "incidents_responders": [], "responder_requests": [], "subscriber_requests": [], "urgency": "high", "id": "P8E12U3", "type": "incident", "summary": "[#2618] Taco Shells", "self": "https://api.pagerduty.com/incidents/P8E12U3", "html_url": "https://example.pagerduty.com/incidents/P8E12U3", "alerts": [] }, "id": "0c282730-a4fd-11e9-8326-0a5ff7c88466", "created_on": "2019-07-12T23:30:33Z", "account_features": { "response_automation": true } } } ``` ```json incident.annotate { "version": "0", "id": "9ed903a2-e6ba-ad1d-3017-39099d80ab85", "detail-type": "PagerDuty Webhook", "source": "aws.partner/pagerduty.com/example-example", "account": "999999999999", "time": "2019-07-12T23:29:11Z", "region": "us-west-1", "resources": [ "pagerduty" ], "detail": { "event": "incident.annotate", "log_entries": [ { "id": "RPXWOZF8SFUEZB295YOQ5BPHF4", "type": "annotate_log_entry", "summary": "Note added by Pagey the Pager", "self": "https://api.pagerduty.com/log_entries/RPXWOZF8SFUEZB295YOQ5BPHF4", "html_url": null, "created_at": "2019-07-12T16:29:07-07:00", "agent": { "id": "PHLAIIG", "type": "user_reference", "summary": "Pagey the Pager", "self": "https://api.pagerduty.com/users/PHLAIIG", "html_url": "https://example.pagerduty.com/users/PHLAIIG" }, "channel": { "type": "note", "summary": "More Cheese Please", "content": "More Cheese Please", "details_omitted": false }, "service": { "id": "P6MZ15N", "type": "service_reference", "summary": "pd sandbox eventbridge", "self": "https://api.pagerduty.com/services/P6MZ15N", "html_url": "https://example.pagerduty.com/services/P6MZ15N" }, "incident": { "id": "P8E12U3", "type": "incident_reference", "summary": "[#2618] Taco Shells", "self": "https://api.pagerduty.com/incidents/P8E12U3", "html_url": "https://example.pagerduty.com/incidents/P8E12U3" }, "teams": [], "contexts": [] } ], "webhook": { "endpoint_url": null, "name": "eventbridge-999999999999-us-west-1-example", "description": null, "webhook_object": { "id": "P6MZ15N", "type": "service_reference", "summary": "example eventbridge", "self": "https://api.pagerduty.com/services/P6MZ15N", "html_url": "https://example.pagerduty.com/services/P6MZ15N" }, "config": {}, "outbound_integration": { "id": "PF8FPF1", "type": "outbound_integration_reference", "summary": "Amazon EventBridge", "self": "https://api.pagerduty.com/outbound_integrations/PF8FPF1", "html_url": null }, "accounts_addon": { "id": "PH4YM53", "addon_id": "PXFR4L8", "name": "Amazon EventBridge", "version": "0.0.1", "location": "extension", "key": "com.pagerduty.amazon_bridge", "url": "https://{pagerduty}/integration-eventbridge-ui?accountsAddonId={accountsAddon.id}", "description": "Deliver webhooks to Amazon EventBridge", "help_url": "", "config": {}, "type": "accounts_addon", "summary": "Amazon EventBridge", "self": "https://api.pagerduty.com/accounts_addons/PH4YM53", "html_url": "https://example.pagerduty.com/accounts_addons/PH4YM53" }, "id": "P7X0R2I", "type": "webhook", "summary": "eventbridge-999999999999-us-west-1-pdwpsandbox", "self": "https://api.pagerduty.com/webhooks/P7X0R2I", "html_url": null }, "incident": { "incident_number": 2618, "title": "Taco Shells", "description": "Taco Shells", "created_at": "2019-07-12T23:26:41Z", "status": "triggered", "incident_key": "4338c648a3614c0ea46b534344f73b10", "service": { "id": "P6MZ15N", "name": "pd sandbox eventbridge", "description": null, "created_at": "2019-07-12T08:36:28-07:00", "status": "critical", "teams": [], "alert_creation": "create_alerts_and_incidents", "addons": [], "scheduled_actions": [], "support_hours": null, "last_incident_timestamp": "2019-07-12T16:26:41-07:00", "escalation_policy": { "id": "PYIM1C5", "type": "escalation_policy_reference", "summary": "Default", "self": "https://api.pagerduty.com/escalation_policies/PYIM1C5", "html_url": "https://example.pagerduty.com/escalation_policies/PYIM1C5" }, "incident_urgency_rule": { "type": "constant", "urgency": "high" }, "acknowledgement_timeout": null, "auto_resolve_timeout": null, "alert_grouping": null, "alert_grouping_timeout": null, "integrations": [], "metadata": {}, "response_play": null, "type": "service", "summary": "example eventbridge", "self": "https://api.pagerduty.com/services/P6MZ15N", "html_url": "https://example.pagerduty.com/services/P6MZ15N" }, "assignments": [ { "at": "2019-07-12T23:26:42Z", "assignee": { "id": "PBYY5X7", "type": "user_reference", "summary": "Anna Marie", "self": "https://api.pagerduty.com/users/PBYY5X7", "html_url": "https://example.pagerduty.com/users/PBYY5X7" } } ], "last_status_change_at": "2019-07-12T23:26:41Z", "first_trigger_log_entry": { "id": "RNNXHZY9ZKI3FQIGVSIL4UO9Q3", "type": "trigger_log_entry_reference", "summary": "Triggered through the website", "self": "https://api.pagerduty.com/log_entries/RNNXHZY9ZKI3FQIGVSIL4UO9Q3", "html_url": "https://example.pagerduty.com/incidents/P8E12U3/log_entries/RNNXHZY9ZKI3FQIGVSIL4UO9Q3" }, "alert_counts": { "all": 0, "triggered": 0, "resolved": 0 }, "is_mergeable": true, "escalation_policy": { "id": "PYIM1C5", "type": "escalation_policy_reference", "summary": "Default", "self": "https://api.pagerduty.com/escalation_policies/PYIM1C5", "html_url": "https://example.pagerduty.com/escalation_policies/PYIM1C5" }, "teams": [], "impacted_services": [ { "id": "P6MZ15N", "type": "service_reference", "summary": "pd sandbox eventbridge", "self": "https://api.pagerduty.com/services/P6MZ15N", "html_url": "https://example.pagerduty.com/services/P6MZ15N" } ], "pending_actions": [], "acknowledgements": [], "basic_alert_grouping": null, "alert_grouping": null, "last_status_change_by": { "id": "P6MZ15N", "type": "service_reference", "summary": "example eventbridge", "self": "https://api.pagerduty.com/services/P6MZ15N", "html_url": "https://example.pagerduty.com/services/P6MZ15N" }, "metadata": {}, "external_references": [], "priority": null, "incidents_responders": [], "responder_requests": [], "subscriber_requests": [], "urgency": "high", "id": "P8E12U3", "type": "incident", "summary": "[#2618] Taco Shells", "self": "https://api.pagerduty.com/incidents/P8E12U3", "html_url": "https://example.pagerduty.com/incidents/P8E12U3", "alerts": [] }, "id": "d8817f30-a4fc-11e9-b635-0249c42ac030", "created_on": "2019-07-12T23:29:07Z", "account_features": { "response_automation": true } } } ``` ```json incident.assign { "version": "0", "id": "137ee981-3976-e3c4-f12a-4ba59a40dc08", "detail-type": "PagerDuty Webhook", "source": "aws.partner/pagerduty.com/example-pdwpsandbox", "account": "999999999999", "time": "2019-07-12T23:30:35Z", "region": "us-west-1", "resources": [ "pagerduty" ], "detail": { "event": "incident.assign", "log_entries": [ { "id": "R26TJS87SQC937OAWL4EC8ERPE", "type": "assign_log_entry", "summary": "Assigned to Pagey the Pager", "self": "https://api.pagerduty.com/log_entries/R26TJS87SQC937OAWL4EC8ERPE", "html_url": null, "created_at": "2019-07-12T23:30:33Z", "agent": { "id": "P6MZ15N", "type": "service_reference", "summary": "pd sandbox eventbridge", "self": "https://api.pagerduty.com/services/P6MZ15N", "html_url": "https://example.pagerduty.com/services/P6MZ15N" }, "channel": { "type": "auto", "details_omitted": false }, "service": { "id": "P6MZ15N", "type": "service_reference", "summary": "pd sandbox eventbridge", "self": "https://api.pagerduty.com/services/P6MZ15N", "html_url": "https://example.pagerduty.com/services/P6MZ15N" }, "incident": { "id": "P8E12U3", "type": "incident_reference", "summary": "[#2618] Taco Shells", "self": "https://api.pagerduty.com/incidents/P8E12U3", "html_url": "https://example.pagerduty.com/incidents/P8E12U3" }, "teams": [], "contexts": [], "assignees": [ { "id": "PHLAIIG", "type": "user_reference", "summary": "Pagey the Pager", "self": "https://api.pagerduty.com/users/PHLAIIG", "html_url": "https://example.pagerduty.com/users/PHLAIIG" } ] } ], "webhook": { "endpoint_url": null, "name": "eventbridge-999999999999-us-west-1-pdwpsandbox", "description": null, "webhook_object": { "id": "P6MZ15N", "type": "service_reference", "summary": "pd sandbox eventbridge", "self": "https://api.pagerduty.com/services/P6MZ15N", "html_url": "https://example.pagerduty.com/services/P6MZ15N" }, "config": {}, "outbound_integration": { "id": "PF8FPF1", "type": "outbound_integration_reference", "summary": "Amazon EventBridge", "self": "https://api.pagerduty.com/outbound_integrations/PF8FPF1", "html_url": null }, "accounts_addon": { "id": "PH4YM53", "addon_id": "PXFR4L8", "name": "Amazon EventBridge", "version": "0.0.1", "location": "extension", "key": "com.pagerduty.amazon_bridge", "url": "https://{pagerduty}/integration-eventbridge-ui?accountsAddonId={accountsAddon.id}", "description": "Deliver webhooks to Amazon EventBridge", "help_url": "", "config": {}, "type": "accounts_addon", "summary": "Amazon EventBridge", "self": "https://api.pagerduty.com/accounts_addons/PH4YM53", "html_url": "https://example.pagerduty.com/accounts_addons/PH4YM53" }, "id": "P7X0R2I", "type": "webhook", "summary": "eventbridge-999999999999-us-west-1-pdwpsandbox", "self": "https://api.pagerduty.com/webhooks/P7X0R2I", "html_url": null }, "incident": { "incident_number": 2618, "title": "Taco Shells", "description": "Taco Shells", "created_at": "2019-07-12T23:26:41Z", "status": "acknowledged", "incident_key": "4338c648a3614c0ea46b534344f73b10", "service": { "id": "P6MZ15N", "name": "pd sandbox eventbridge", "description": null, "created_at": "2019-07-12T15:36:28Z", "status": "critical", "teams": [], "alert_creation": "create_alerts_and_incidents", "addons": [], "scheduled_actions": [], "support_hours": null, "last_incident_timestamp": "2019-07-12T23:26:41Z", "escalation_policy": { "id": "PYIM1C5", "type": "escalation_policy_reference", "summary": "Default", "self": "https://api.pagerduty.com/escalation_policies/PYIM1C5", "html_url": "https://example.pagerduty.com/escalation_policies/PYIM1C5" }, "incident_urgency_rule": { "type": "constant", "urgency": "high" }, "acknowledgement_timeout": 600, "auto_resolve_timeout": null, "alert_grouping": null, "alert_grouping_timeout": null, "integrations": [], "metadata": { "conference_number": "", "conference_url": "" }, "response_play": null, "type": "service", "summary": "pd sandbox eventbridge", "self": "https://api.pagerduty.com/services/P6MZ15N", "html_url": "https://example.pagerduty.com/services/P6MZ15N" }, "assignments": [ { "at": "2019-07-12T23:30:33Z", "assignee": { "id": "PHLAIIG", "type": "user_reference", "summary": "Pagey the Pager", "self": "https://api.pagerduty.com/users/PHLAIIG", "html_url": "https://example.pagerduty.com/users/PHLAIIG" } } ], "last_status_change_at": "2019-07-12T23:30:33Z", "first_trigger_log_entry": { "id": "RNNXHZY9ZKI3FQIGVSIL4UO9Q3", "type": "trigger_log_entry_reference", "summary": "Triggered through the website", "self": "https://api.pagerduty.com/log_entries/RNNXHZY9ZKI3FQIGVSIL4UO9Q3", "html_url": "https://example.pagerduty.com/incidents/P8E12U3/log_entries/RNNXHZY9ZKI3FQIGVSIL4UO9Q3" }, "alert_counts": { "all": 0, "triggered": 0, "resolved": 0 }, "is_mergeable": true, "escalation_policy": { "id": "PYIM1C5", "type": "escalation_policy_reference", "summary": "Default", "self": "https://api.pagerduty.com/escalation_policies/PYIM1C5", "html_url": "https://example.pagerduty.com/escalation_policies/PYIM1C5" }, "teams": [], "impacted_services": [ { "id": "P6MZ15N", "type": "service_reference", "summary": "pd sandbox eventbridge", "self": "https://api.pagerduty.com/services/P6MZ15N", "html_url": "https://example.pagerduty.com/services/P6MZ15N" } ], "pending_actions": [ { "type": "unacknowledge", "at": "2019-07-12T23:40:33Z" } ], "acknowledgements": [ { "at": "2019-07-12T23:30:33Z", "acknowledger": { "id": "PHLAIIG", "type": "user_reference", "summary": "Pagey the Pager", "self": "https://api.pagerduty.com/users/PHLAIIG", "html_url": "https://example.pagerduty.com/users/PHLAIIG" } } ], "basic_alert_grouping": null, "alert_grouping": null, "last_status_change_by": { "id": "PHLAIIG", "type": "user_reference", "summary": "Pagey the Pager", "self": "https://api.pagerduty.com/users/PHLAIIG", "html_url": "https://example.pagerduty.com/users/PHLAIIG" }, "metadata": {}, "external_references": [], "priority": null, "incidents_responders": [], "responder_requests": [], "subscriber_requests": [], "urgency": "high", "id": "P8E12U3", "type": "incident", "summary": "[#2618] Taco Shells", "self": "https://api.pagerduty.com/incidents/P8E12U3", "html_url": "https://example.pagerduty.com/incidents/P8E12U3", "alerts": [] }, "id": "0bbf5340-a4fd-11e9-9e74-0632db1b4ce2", "created_on": "2019-07-12T23:30:33Z", "account_features": { "response_automation": true } } } ``` ```json incident.custom { "version": "0", "id": "7e1303b1-092e-b7a3-e219-a146a8bf987d", "detail-type": "PagerDuty Webhook", "source": "aws.partner/pagerduty.com/example-pdwpsandbox", "account": "999999999999", "time": "2019-07-12T23:29:44Z", "region": "us-west-1", "resources": [ "pagerduty" ], "detail": { "event": "incident.custom", "log_entries": [ { "id": "R1NVJN7NEIPIPJ5EUG7CJIO2PR", "type": "custom_log_entry", "summary": "Custom action 'eventbridge-999999999999-us-west-1-pdwpsandbox' triggered by Pagey the Pager", "self": "https://api.pagerduty.com/log_entries/R1NVJN7NEIPIPJ5EUG7CJIO2PR", "html_url": null, "created_at": "2019-07-12T23:29:38Z", "agent": { "id": "PHLAIIG", "type": "user_reference", "summary": "Pagey the Pager", "self": "https://api.pagerduty.com/users/PHLAIIG", "html_url": "https://example.pagerduty.com/users/PHLAIIG" }, "channel": { "type": "custom_web_trigger", "name": "eventbridge-999999999999-us-west-1-pdwpsandbox", "addon_id": "PXFR4L8", "accounts_addon_id": "PH4YM53", "details_omitted": false }, "service": { "id": "P6MZ15N", "type": "service_reference", "summary": "pd sandbox eventbridge", "self": "https://api.pagerduty.com/services/P6MZ15N", "html_url": "https://example.pagerduty.com/services/P6MZ15N" }, "incident": { "id": "P8E12U3", "type": "incident_reference", "summary": "[#2618] Taco Shells", "self": "https://api.pagerduty.com/incidents/P8E12U3", "html_url": "https://example.pagerduty.com/incidents/P8E12U3" }, "teams": [], "contexts": [], "event_details": {} } ], "webhook": { "endpoint_url": null, "name": "eventbridge-999999999999-us-west-1-pdwpsandbox", "description": null, "webhook_object": { "id": "P6MZ15N", "type": "service_reference", "summary": "pd sandbox eventbridge", "self": "https://api.pagerduty.com/services/P6MZ15N", "html_url": "https://example.pagerduty.com/services/P6MZ15N" }, "config": {}, "outbound_integration": { "id": "PF8FPF1", "type": "outbound_integration_reference", "summary": "Amazon EventBridge", "self": "https://api.pagerduty.com/outbound_integrations/PF8FPF1", "html_url": null }, "accounts_addon": { "id": "PH4YM53", "addon_id": "PXFR4L8", "name": "Amazon EventBridge", "version": "0.0.1", "location": "extension", "key": "com.pagerduty.amazon_bridge", "url": "https://{pagerduty}/integration-eventbridge-ui?accountsAddonId={accountsAddon.id}", "description": "Deliver webhooks to Amazon EventBridge", "help_url": "", "config": {}, "type": "accounts_addon", "summary": "Amazon EventBridge", "self": "https://api.pagerduty.com/accounts_addons/PH4YM53", "html_url": "https://example.pagerduty.com/accounts_addons/PH4YM53" }, "id": "P7X0R2I", "type": "webhook", "summary": "eventbridge-999999999999-us-west-1-pdwpsandbox", "self": "https://api.pagerduty.com/webhooks/P7X0R2I", "html_url": null }, "incident": { "incident_number": 2618, "title": "Taco Shells", "description": "Taco Shells", "created_at": "2019-07-12T23:26:41Z", "status": "triggered", "incident_key": "4338c648a3614c0ea46b534344f73b10", "service": { "id": "P6MZ15N", "name": "pd sandbox eventbridge", "description": null, "created_at": "2019-07-12T15:36:28Z", "status": "critical", "teams": [], "alert_creation": "create_alerts_and_incidents", "addons": [], "scheduled_actions": [], "support_hours": null, "last_incident_timestamp": "2019-07-12T23:26:41Z", "escalation_policy": { "id": "PYIM1C5", "type": "escalation_policy_reference", "summary": "Default", "self": "https://api.pagerduty.com/escalation_policies/PYIM1C5", "html_url": "https://example.pagerduty.com/escalation_policies/PYIM1C5" }, "incident_urgency_rule": { "type": "constant", "urgency": "high" }, "acknowledgement_timeout": null, "auto_resolve_timeout": null, "alert_grouping": null, "alert_grouping_timeout": null, "integrations": [], "metadata": {}, "response_play": null, "type": "service", "summary": "pd sandbox eventbridge", "self": "https://api.pagerduty.com/services/P6MZ15N", "html_url": "https://example.pagerduty.com/services/P6MZ15N" }, "assignments": [ { "at": "2019-07-12T23:29:23Z", "assignee": { "id": "P6CH8TU", "type": "user_reference", "summary": "Wade Wilson", "self": "https://api.pagerduty.com/users/P6CH8TU", "html_url": "https://example.pagerduty.com/users/P6CH8TU" } } ], "last_status_change_at": "2019-07-12T23:29:23Z", "first_trigger_log_entry": { "id": "RNNXHZY9ZKI3FQIGVSIL4UO9Q3", "type": "trigger_log_entry_reference", "summary": "Triggered through the website", "self": "https://api.pagerduty.com/log_entries/RNNXHZY9ZKI3FQIGVSIL4UO9Q3", "html_url": "https://example.pagerduty.com/incidents/P8E12U3/log_entries/RNNXHZY9ZKI3FQIGVSIL4UO9Q3" }, "alert_counts": { "all": 0, "triggered": 0, "resolved": 0 }, "is_mergeable": true, "escalation_policy": { "id": "PYIM1C5", "type": "escalation_policy_reference", "summary": "Default", "self": "https://api.pagerduty.com/escalation_policies/PYIM1C5", "html_url": "https://example.pagerduty.com/escalation_policies/PYIM1C5" }, "teams": [], "impacted_services": [ { "id": "P6MZ15N", "type": "service_reference", "summary": "pd sandbox eventbridge", "self": "https://api.pagerduty.com/services/P6MZ15N", "html_url": "https://example.pagerduty.com/services/P6MZ15N" } ], "pending_actions": [], "acknowledgements": [], "basic_alert_grouping": null, "alert_grouping": null, "last_status_change_by": { "id": "P6MZ15N", "type": "service_reference", "summary": "pd sandbox eventbridge", "self": "https://api.pagerduty.com/services/P6MZ15N", "html_url": "https://example.pagerduty.com/services/P6MZ15N" }, "metadata": {}, "external_references": [], "priority": null, "incidents_responders": [], "responder_requests": [], "subscriber_requests": [], "urgency": "high", "id": "P8E12U3", "type": "incident", "summary": "[#2618] Taco Shells", "self": "https://api.pagerduty.com/incidents/P8E12U3", "html_url": "https://example.pagerduty.com/incidents/P8E12U3", "alerts": [] }, "id": "eae2b270-a4fc-11e9-aa49-0257859f8942", "created_on": "2019-07-12T23:29:38Z", "account_features": { "response_automation": true } } } ``` ```json incident.delegate { "version": "0", "id": "1efc511b-c08b-290e-2bb3-865dcf5d6558", "detail-type": "PagerDuty Webhook", "source": "aws.partner/pagerduty.com/example-pdwpsandbox", "account": "999999999999", "time": "2019-07-12T23:44:54Z", "region": "us-west-1", "resources": [ "pagerduty" ], "detail": { "event": "incident.delegate", "log_entries": [ { "id": "R2K5ME9HUO315VAI0UAKBBVROB", "type": "delegate_log_entry", "summary": "Delegated Default by Pagey the Pager", "self": "https://api.pagerduty.com/log_entries/R2K5ME9HUO315VAI0UAKBBVROB", "html_url": null, "created_at": "2019-07-12T23:44:52Z", "agent": { "id": "PHLAIIG", "type": "user_reference", "summary": "Pagey the Pager", "self": "https://api.pagerduty.com/users/PHLAIIG", "html_url": "https://example.pagerduty.com/users/PHLAIIG" }, "channel": { "type": "website", "details_omitted": false }, "service": { "id": "P6MZ15N", "type": "service_reference", "summary": "pd sandbox eventbridge", "self": "https://api.pagerduty.com/services/P6MZ15N", "html_url": "https://example.pagerduty.com/services/P6MZ15N" }, "incident": { "id": "P8E12U3", "type": "incident_reference", "summary": "[#2618] Taco Shells", "self": "https://api.pagerduty.com/incidents/P8E12U3", "html_url": "https://example.pagerduty.com/incidents/P8E12U3" }, "teams": [], "contexts": [], "assignees": [ { "id": "PYIM1C5", "type": "escalation_policy_reference", "summary": "Default", "self": "https://api.pagerduty.com/escalation_policies/PYIM1C5", "html_url": "https://example.pagerduty.com/escalation_policies/PYIM1C5" } ] } ], "webhook": { "endpoint_url": null, "name": "eventbridge-999999999999-us-west-1-pdwpsandbox", "description": null, "webhook_object": { "id": "P6MZ15N", "type": "service_reference", "summary": "pd sandbox eventbridge", "self": "https://api.pagerduty.com/services/P6MZ15N", "html_url": "https://example.pagerduty.com/services/P6MZ15N" }, "config": {}, "outbound_integration": { "id": "PF8FPF1", "type": "outbound_integration_reference", "summary": "Amazon EventBridge", "self": "https://api.pagerduty.com/outbound_integrations/PF8FPF1", "html_url": null }, "accounts_addon": { "id": "PH4YM53", "addon_id": "PXFR4L8", "name": "Amazon EventBridge", "version": "0.0.1", "location": "extension", "key": "com.pagerduty.amazon_bridge", "url": "https://{pagerduty}/integration-eventbridge-ui?accountsAddonId={accountsAddon.id}", "description": "Deliver webhooks to Amazon EventBridge", "help_url": "", "config": {}, "type": "accounts_addon", "summary": "Amazon EventBridge", "self": "https://api.pagerduty.com/accounts_addons/PH4YM53", "html_url": "https://example.pagerduty.com/accounts_addons/PH4YM53" }, "id": "P7X0R2I", "type": "webhook", "summary": "eventbridge-999999999999-us-west-1-pdwpsandbox", "self": "https://api.pagerduty.com/webhooks/P7X0R2I", "html_url": null }, "incident": { "incident_number": 2618, "title": "Taco Shells", "description": "Taco Shells", "created_at": "2019-07-12T23:26:41Z", "status": "triggered", "incident_key": "4338c648a3614c0ea46b534344f73b10", "service": { "id": "P6MZ15N", "name": "pd sandbox eventbridge", "description": null, "created_at": "2019-07-12T15:36:28Z", "status": "critical", "teams": [], "alert_creation": "create_alerts_and_incidents", "addons": [], "scheduled_actions": [], "support_hours": null, "last_incident_timestamp": "2019-07-12T23:26:41Z", "escalation_policy": { "id": "PYIM1C5", "type": "escalation_policy_reference", "summary": "Default", "self": "https://api.pagerduty.com/escalation_policies/PYIM1C5", "html_url": "https://example.pagerduty.com/escalation_policies/PYIM1C5" }, "incident_urgency_rule": { "type": "constant", "urgency": "high" }, "acknowledgement_timeout": 600, "auto_resolve_timeout": null, "alert_grouping": null, "alert_grouping_timeout": null, "integrations": [], "metadata": { "conference_number": "", "conference_url": "" }, "response_play": null, "type": "service", "summary": "pd sandbox eventbridge", "self": "https://api.pagerduty.com/services/P6MZ15N", "html_url": "https://example.pagerduty.com/services/P6MZ15N" }, "assignments": [ { "at": "2019-07-12T23:44:52Z", "assignee": { "id": "PBYY5X7", "type": "user_reference", "summary": "Anna Marie", "self": "https://api.pagerduty.com/users/PBYY5X7", "html_url": "https://example.pagerduty.com/users/PBYY5X7" } } ], "last_status_change_at": "2019-07-12T23:44:52Z", "first_trigger_log_entry": { "id": "RNNXHZY9ZKI3FQIGVSIL4UO9Q3", "type": "trigger_log_entry_reference", "summary": "Triggered through the website", "self": "https://api.pagerduty.com/log_entries/RNNXHZY9ZKI3FQIGVSIL4UO9Q3", "html_url": "https://example.pagerduty.com/incidents/P8E12U3/log_entries/RNNXHZY9ZKI3FQIGVSIL4UO9Q3" }, "alert_counts": { "all": 0, "triggered": 0, "resolved": 0 }, "is_mergeable": true, "escalation_policy": { "id": "PYIM1C5", "type": "escalation_policy_reference", "summary": "Default", "self": "https://api.pagerduty.com/escalation_policies/PYIM1C5", "html_url": "https://example.pagerduty.com/escalation_policies/PYIM1C5" }, "teams": [], "impacted_services": [ { "id": "P6MZ15N", "type": "service_reference", "summary": "pd sandbox eventbridge", "self": "https://api.pagerduty.com/services/P6MZ15N", "html_url": "https://example.pagerduty.com/services/P6MZ15N" } ], "pending_actions": [ { "type": "escalate", "at": "2019-07-12T23:49:52Z" } ], "acknowledgements": [], "basic_alert_grouping": null, "alert_grouping": null, "last_status_change_by": { "id": "P6MZ15N", "type": "service_reference", "summary": "pd sandbox eventbridge", "self": "https://api.pagerduty.com/services/P6MZ15N", "html_url": "https://example.pagerduty.com/services/P6MZ15N" }, "metadata": {}, "external_references": [], "priority": null, "incidents_responders": [], "responder_requests": [], "subscriber_requests": [], "urgency": "high", "id": "P8E12U3", "type": "incident", "summary": "[#2618] Taco Shells", "self": "https://api.pagerduty.com/incidents/P8E12U3", "html_url": "https://example.pagerduty.com/incidents/P8E12U3", "alerts": [] }, "id": "0c3e0e40-a4ff-11e9-bb78-0297ae80f8e2", "created_on": "2019-07-12T23:44:52Z", "account_features": { "response_automation": true } } } ``` ```json incident.escalate { "version": "0", "id": "c847c469-8b2e-c7c6-7a02-f7ec77ffd5b0", "detail-type": "PagerDuty Webhook", "source": "aws.partner/pagerduty.com/example-pdwpsandbox", "account": "999999999999", "time": "2019-07-12T23:49:54Z", "region": "us-west-1", "resources": [ "pagerduty" ], "detail": { "event": "incident.escalate", "log_entries": [ { "id": "R1UEB7F9X4Y6LE1M3P2KPSLNWY", "type": "escalate_log_entry", "summary": "Escalated to Remy LeBeau through the API", "self": "https://api.pagerduty.com/log_entries/R1UEB7F9X4Y6LE1M3P2KPSLNWY", "html_url": null, "created_at": "2019-07-12T16:49:52-07:00", "agent": { "id": "P6MZ15N", "type": "service_reference", "summary": "pd sandbox eventbridge", "self": "https://api.pagerduty.com/services/P6MZ15N", "html_url": "https://example.pagerduty.com/services/P6MZ15N" }, "channel": { "type": "timeout", "details_omitted": false }, "service": { "id": "P6MZ15N", "type": "service_reference", "summary": "pd sandbox eventbridge", "self": "https://api.pagerduty.com/services/P6MZ15N", "html_url": "https://example.pagerduty.com/services/P6MZ15N" }, "incident": { "id": "P8E12U3", "type": "incident_reference", "summary": "[#2618] Taco Shells", "self": "https://api.pagerduty.com/incidents/P8E12U3", "html_url": "https://example.pagerduty.com/incidents/P8E12U3" }, "teams": [], "contexts": [], "assignees": [ { "id": "P0H8W5I", "type": "user_reference", "summary": "Remy LeBeau", "self": "https://api.pagerduty.com/users/P0H8W5I", "html_url": "https://example.pagerduty.com/users/P0H8W5I" } ] } ], "webhook": { "endpoint_url": null, "name": "eventbridge-999999999999-us-west-1-pdwpsandbox", "description": null, "webhook_object": { "id": "P6MZ15N", "type": "service_reference", "summary": "pd sandbox eventbridge", "self": "https://api.pagerduty.com/services/P6MZ15N", "html_url": "https://example.pagerduty.com/services/P6MZ15N" }, "config": {}, "outbound_integration": { "id": "PF8FPF1", "type": "outbound_integration_reference", "summary": "Amazon EventBridge", "self": "https://api.pagerduty.com/outbound_integrations/PF8FPF1", "html_url": null }, "accounts_addon": { "id": "PH4YM53", "addon_id": "PXFR4L8", "name": "Amazon EventBridge", "version": "0.0.1", "location": "extension", "key": "com.pagerduty.amazon_bridge", "url": "https://{pagerduty}/integration-eventbridge-ui?accountsAddonId={accountsAddon.id}", "description": "Deliver webhooks to Amazon EventBridge", "help_url": "", "config": {}, "type": "accounts_addon", "summary": "Amazon EventBridge", "self": "https://api.pagerduty.com/accounts_addons/PH4YM53", "html_url": "https://example.pagerduty.com/accounts_addons/PH4YM53" }, "id": "P7X0R2I", "type": "webhook", "summary": "eventbridge-999999999999-us-west-1-pdwpsandbox", "self": "https://api.pagerduty.com/webhooks/P7X0R2I", "html_url": null }, "incident": { "incident_number": 2618, "title": "Taco Shells", "description": "Taco Shells", "created_at": "2019-07-12T23:26:41Z", "status": "triggered", "incident_key": "4338c648a3614c0ea46b534344f73b10", "service": { "id": "P6MZ15N", "name": "pd sandbox eventbridge", "description": null, "created_at": "2019-07-12T08:36:28-07:00", "status": "critical", "teams": [], "alert_creation": "create_alerts_and_incidents", "addons": [], "scheduled_actions": [], "support_hours": null, "last_incident_timestamp": "2019-07-12T16:26:41-07:00", "escalation_policy": { "id": "PYIM1C5", "type": "escalation_policy_reference", "summary": "Default", "self": "https://api.pagerduty.com/escalation_policies/PYIM1C5", "html_url": "https://example.pagerduty.com/escalation_policies/PYIM1C5" }, "incident_urgency_rule": { "type": "constant", "urgency": "high" }, "acknowledgement_timeout": 600, "auto_resolve_timeout": null, "alert_grouping": null, "alert_grouping_timeout": null, "integrations": [], "metadata": { "conference_number": "", "conference_url": "" }, "response_play": null, "type": "service", "summary": "pd sandbox eventbridge", "self": "https://api.pagerduty.com/services/P6MZ15N", "html_url": "https://example.pagerduty.com/services/P6MZ15N" }, "assignments": [ { "at": "2019-07-12T23:49:52Z", "assignee": { "id": "P0H8W5I", "type": "user_reference", "summary": "Remy LeBeau", "self": "https://api.pagerduty.com/users/P0H8W5I", "html_url": "https://example.pagerduty.com/users/P0H8W5I" } } ], "last_status_change_at": "2019-07-12T23:49:52Z", "first_trigger_log_entry": { "id": "RNNXHZY9ZKI3FQIGVSIL4UO9Q3", "type": "trigger_log_entry_reference", "summary": "Triggered through the website", "self": "https://api.pagerduty.com/log_entries/RNNXHZY9ZKI3FQIGVSIL4UO9Q3", "html_url": "https://example.pagerduty.com/incidents/P8E12U3/log_entries/RNNXHZY9ZKI3FQIGVSIL4UO9Q3" }, "alert_counts": { "all": 0, "triggered": 0, "resolved": 0 }, "is_mergeable": true, "escalation_policy": { "id": "PYIM1C5", "type": "escalation_policy_reference", "summary": "Default", "self": "https://api.pagerduty.com/escalation_policies/PYIM1C5", "html_url": "https://example.pagerduty.com/escalation_policies/PYIM1C5" }, "teams": [], "impacted_services": [ { "id": "P6MZ15N", "type": "service_reference", "summary": "pd sandbox eventbridge", "self": "https://api.pagerduty.com/services/P6MZ15N", "html_url": "https://example.pagerduty.com/services/P6MZ15N" } ], "pending_actions": [], "acknowledgements": [], "basic_alert_grouping": null, "alert_grouping": null, "last_status_change_by": { "id": "P6MZ15N", "type": "service_reference", "summary": "pd sandbox eventbridge", "self": "https://api.pagerduty.com/services/P6MZ15N", "html_url": "https://example.pagerduty.com/services/P6MZ15N" }, "metadata": {}, "external_references": [], "priority": null, "incidents_responders": [], "responder_requests": [], "subscriber_requests": [], "urgency": "high", "id": "P8E12U3", "type": "incident", "summary": "[#2618] Taco Shells", "self": "https://api.pagerduty.com/incidents/P8E12U3", "html_url": "https://example.pagerduty.com/incidents/P8E12U3", "alerts": [] }, "id": "be936fe0-a4ff-11e9-b635-0249c42ac030", "created_on": "2019-07-12T23:49:52Z", "account_features": { "response_automation": true } } } ``` ```json incident.resolve { "version": "0", "id": "c17d2ca8-cfc0-5a5a-65b1-5fcf202845b2", "detail-type": "PagerDuty Webhook", "source": "aws.partner/pagerduty.com/example-example", "account": "999999999999", "time": "2019-07-13T23:45:48Z", "region": "us-west-1", "resources": [ "pagerduty" ], "detail": { "event": "incident.resolve", "log_entries": [ { "id": "R14IXGBPNZ2NA2FWILBOPJ9X0X", "type": "resolve_log_entry", "summary": "Resolved by Pagey the Pager", "self": "https://api.pagerduty.com/log_entries/R14IXGBPNZ2NA2FWILBOPJ9X0X", "html_url": null, "created_at": "2019-07-13T23:45:46Z", "agent": { "id": "PHLAIIG", "type": "user_reference", "summary": "Pagey the Pager", "self": "https://api.pagerduty.com/users/PHLAIIG", "html_url": "https://example.pagerduty.com/users/PHLAIIG" }, "channel": { "type": "website", "details_omitted": false }, "service": { "id": "P6MZ15N", "type": "service_reference", "summary": "pd sandbox eventbridge", "self": "https://api.pagerduty.com/services/P6MZ15N", "html_url": "https://example.pagerduty.com/services/P6MZ15N" }, "incident": { "id": "P8E12U3", "type": "incident_reference", "summary": "[#2618] Taco Shells", "self": "https://api.pagerduty.com/incidents/P8E12U3", "html_url": "https://example.pagerduty.com/incidents/P8E12U3" }, "teams": [], "contexts": [], "event_details": {} } ], "webhook": { "endpoint_url": null, "name": "eventbridge-999999999999-us-west-1-example", "description": null, "webhook_object": { "id": "P6MZ15N", "type": "service_reference", "summary": "pd sandbox eventbridge", "self": "https://api.pagerduty.com/services/P6MZ15N", "html_url": "https://example.pagerduty.com/services/P6MZ15N" }, "config": {}, "outbound_integration": { "id": "PF8FPF1", "type": "outbound_integration_reference", "summary": "Amazon EventBridge", "self": "https://api.pagerduty.com/outbound_integrations/PF8FPF1", "html_url": null }, "accounts_addon": { "id": "PH4YM53", "addon_id": "PXFR4L8", "name": "Amazon EventBridge", "version": "0.0.1", "location": "extension", "key": "com.pagerduty.amazon_bridge", "url": "https://{pagerduty}/integration-eventbridge-ui?accountsAddonId={accountsAddon.id}", "description": "Deliver webhooks to Amazon EventBridge", "help_url": "", "config": {}, "type": "accounts_addon", "summary": "Amazon EventBridge", "self": "https://api.pagerduty.com/accounts_addons/PH4YM53", "html_url": "https://example.pagerduty.com/accounts_addons/PH4YM53" }, "id": "P7X0R2I", "type": "webhook", "summary": "eventbridge-999999999999-us-west-1-example", "self": "https://api.pagerduty.com/webhooks/P7X0R2I", "html_url": null }, "incident": { "incident_number": 2618, "title": "Taco Shells", "description": "Taco Shells", "created_at": "2019-07-12T23:26:41Z", "status": "resolved", "incident_key": "4338c648a3614c0ea46b534344f73b10", "service": { "id": "P6MZ15N", "name": "pd sandbox eventbridge", "description": null, "created_at": "2019-07-12T15:36:28Z", "status": "critical", "teams": [], "alert_creation": "create_alerts_and_incidents", "addons": [], "scheduled_actions": [], "support_hours": null, "last_incident_timestamp": "2019-07-12T23:26:41Z", "escalation_policy": { "id": "PYIM1C5", "type": "escalation_policy_reference", "summary": "Default", "self": "https://api.pagerduty.com/escalation_policies/PYIM1C5", "html_url": "https://example.pagerduty.com/escalation_policies/PYIM1C5" }, "incident_urgency_rule": { "type": "constant", "urgency": "high" }, "acknowledgement_timeout": 600, "auto_resolve_timeout": null, "alert_grouping": null, "alert_grouping_timeout": null, "integrations": [], "metadata": { "conference_number": "", "conference_url": "" }, "response_play": null, "type": "service", "summary": "pd sandbox eventbridge", "self": "https://api.pagerduty.com/services/P6MZ15N", "html_url": "https://example.pagerduty.com/services/P6MZ15N" }, "assignments": [ { "at": "2019-07-12T23:49:52Z", "assignee": { "id": "P0H8W5I", "type": "user_reference", "summary": "Remy LeBeau", "self": "https://api.pagerduty.com/users/P0H8W5I", "html_url": "https://example.pagerduty.com/users/P0H8W5I" } } ], "last_status_change_at": "2019-07-13T23:45:46Z", "first_trigger_log_entry": { "id": "RNNXHZY9ZKI3FQIGVSIL4UO9Q3", "type": "trigger_log_entry_reference", "summary": "Triggered through the website", "self": "https://api.pagerduty.com/log_entries/RNNXHZY9ZKI3FQIGVSIL4UO9Q3", "html_url": "https://example.pagerduty.com/incidents/P8E12U3/log_entries/RNNXHZY9ZKI3FQIGVSIL4UO9Q3" }, "alert_counts": { "all": 0, "triggered": 0, "resolved": 0 }, "is_mergeable": true, "escalation_policy": { "id": "PYIM1C5", "type": "escalation_policy_reference", "summary": "Default", "self": "https://api.pagerduty.com/escalation_policies/PYIM1C5", "html_url": "https://example.pagerduty.com/escalation_policies/PYIM1C5" }, "teams": [], "impacted_services": [ { "id": "P6MZ15N", "type": "service_reference", "summary": "pd sandbox eventbridge", "self": "https://api.pagerduty.com/services/P6MZ15N", "html_url": "https://example.pagerduty.com/services/P6MZ15N" } ], "pending_actions": [], "acknowledgements": [], "basic_alert_grouping": null, "alert_grouping": null, "last_status_change_by": { "id": "PHLAIIG", "type": "user_reference", "summary": "Pagey the Pager", "self": "https://api.pagerduty.com/users/PHLAIIG", "html_url": "https://example.pagerduty.com/users/PHLAIIG" }, "metadata": {}, "external_references": [], "priority": null, "resolve_reason": null, "incidents_responders": [], "responder_requests": [], "subscriber_requests": [], "urgency": "high", "id": "P8E12U3", "type": "incident", "summary": "[#2618] Taco Shells", "self": "https://api.pagerduty.com/incidents/P8E12U3", "html_url": "https://example.pagerduty.com/incidents/P8E12U3", "alerts": [] }, "id": "56812fe0-a5c8-11e9-9e74-0632db1b4ce2", "created_on": "2019-07-13T23:45:46Z", "account_features": { "response_automation": true } } } ``` ```json incident.trigger { "version": "0", "id": "74b52893-0751-6519-6655-5857207fff3b", "detail-type": "PagerDuty Webhook", "source": "aws.partner/pagerduty.com/example-pdwpsandbox", "account": "999999999999", "time": "2019-07-12T23:26:43Z", "region": "us-west-1", "resources": [ "pagerduty" ], "detail": { "event": "incident.trigger", "log_entries": [ { "id": "RNNXHZY9ZKI3FQIGVSIL4UO9Q3", "type": "trigger_log_entry", "summary": "Triggered through the website", "self": "https://api.pagerduty.com/log_entries/RNNXHZY9ZKI3FQIGVSIL4UO9Q3", "html_url": "https://example.pagerduty.com/incidents/P8E12U3/log_entries/RNNXHZY9ZKI3FQIGVSIL4UO9Q3", "created_at": "2019-07-12T23:26:41Z", "agent": { "id": "PHLAIIG", "type": "user_reference", "summary": "Pagey the Pager", "self": "https://api.pagerduty.com/users/PHLAIIG", "html_url": "https://example.pagerduty.com/users/PHLAIIG" }, "channel": { "type": "web_trigger", "summary": "Taco Shells", "subject": "Taco Shells", "details": null, "details_omitted": false }, "service": { "id": "P6MZ15N", "type": "service_reference", "summary": "pd sandbox eventbridge", "self": "https://api.pagerduty.com/services/P6MZ15N", "html_url": "https://example.pagerduty.com/services/P6MZ15N" }, "incident": { "id": "P8E12U3", "type": "incident_reference", "summary": "[#2618] Taco Shells", "self": "https://api.pagerduty.com/incidents/P8E12U3", "html_url": "https://example.pagerduty.com/incidents/P8E12U3" }, "teams": [], "contexts": [], "event_details": { "description": "Taco Shells" } } ], "webhook": { "endpoint_url": null, "name": "eventbridge-999999999999-us-west-1-pdwpsandbox", "description": null, "webhook_object": { "id": "P6MZ15N", "type": "service_reference", "summary": "pd sandbox eventbridge", "self": "https://api.pagerduty.com/services/P6MZ15N", "html_url": "https://example.pagerduty.com/services/P6MZ15N" }, "config": {}, "outbound_integration": { "id": "PF8FPF1", "type": "outbound_integration_reference", "summary": "Amazon EventBridge", "self": "https://api.pagerduty.com/outbound_integrations/PF8FPF1", "html_url": null }, "accounts_addon": { "id": "PH4YM53", "addon_id": "PXFR4L8", "name": "Amazon EventBridge", "version": "0.0.1", "location": "extension", "key": "com.pagerduty.amazon_bridge", "url": "https://{pagerduty}/integration-eventbridge-ui?accountsAddonId={accountsAddon.id}", "description": "Deliver webhooks to Amazon EventBridge", "help_url": "", "config": {}, "type": "accounts_addon", "summary": "Amazon EventBridge", "self": "https://api.pagerduty.com/accounts_addons/PH4YM53", "html_url": "https://example.pagerduty.com/accounts_addons/PH4YM53" }, "id": "P7X0R2I", "type": "webhook", "summary": "eventbridge-999999999999-us-west-1-pdwpsandbox", "self": "https://api.pagerduty.com/webhooks/P7X0R2I", "html_url": null }, "incident": { "incident_number": 2618, "title": "Taco Shells", "description": "Taco Shells", "created_at": "2019-07-12T23:26:41Z", "status": "triggered", "incident_key": "4338c648a3614c0ea46b534344f73b10", "service": { "id": "P6MZ15N", "name": "pd sandbox eventbridge", "description": null, "created_at": "2019-07-12T15:36:28Z", "status": "critical", "teams": [], "alert_creation": "create_alerts_and_incidents", "addons": [], "scheduled_actions": [], "support_hours": null, "last_incident_timestamp": "2019-07-12T23:26:41Z", "escalation_policy": { "id": "PYIM1C5", "type": "escalation_policy_reference", "summary": "Default", "self": "https://api.pagerduty.com/escalation_policies/PYIM1C5", "html_url": "https://example.pagerduty.com/escalation_policies/PYIM1C5" }, "incident_urgency_rule": { "type": "constant", "urgency": "high" }, "acknowledgement_timeout": null, "auto_resolve_timeout": null, "alert_grouping": null, "alert_grouping_timeout": null, "integrations": [], "metadata": {}, "response_play": null, "type": "service", "summary": "pd sandbox eventbridge", "self": "https://api.pagerduty.com/services/P6MZ15N", "html_url": "https://example.pagerduty.com/services/P6MZ15N" }, "assignments": [ { "at": "2019-07-12T23:26:42Z", "assignee": { "id": "PBYY5X7", "type": "user_reference", "summary": "Anna Marie", "self": "https://api.pagerduty.com/users/PBYY5X7", "html_url": "https://example.pagerduty.com/users/PBYY5X7" } } ], "last_status_change_at": "2019-07-12T23:26:41Z", "first_trigger_log_entry": { "id": "RNNXHZY9ZKI3FQIGVSIL4UO9Q3", "type": "trigger_log_entry_reference", "summary": "Triggered through the website", "self": "https://api.pagerduty.com/log_entries/RNNXHZY9ZKI3FQIGVSIL4UO9Q3", "html_url": "https://example.pagerduty.com/incidents/P8E12U3/log_entries/RNNXHZY9ZKI3FQIGVSIL4UO9Q3" }, "alert_counts": { "all": 0, "triggered": 0, "resolved": 0 }, "is_mergeable": true, "escalation_policy": { "id": "PYIM1C5", "type": "escalation_policy_reference", "summary": "Default", "self": "https://api.pagerduty.com/escalation_policies/PYIM1C5", "html_url": "https://example.pagerduty.com/escalation_policies/PYIM1C5" }, "teams": [], "impacted_services": [ { "id": "P6MZ15N", "type": "service_reference", "summary": "pd sandbox eventbridge", "self": "https://api.pagerduty.com/services/P6MZ15N", "html_url": "https://example.pagerduty.com/services/P6MZ15N" } ], "pending_actions": [], "acknowledgements": [], "basic_alert_grouping": null, "alert_grouping": null, "last_status_change_by": { "id": "P6MZ15N", "type": "service_reference", "summary": "pd sandbox eventbridge", "self": "https://api.pagerduty.com/services/P6MZ15N", "html_url": "https://example.pagerduty.com/services/P6MZ15N" }, "metadata": {}, "external_references": [], "priority": null, "incidents_responders": [], "responder_requests": [], "subscriber_requests": [], "urgency": "high", "id": "P8E12U3", "type": "incident", "summary": "[#2618] Taco Shells", "self": "https://api.pagerduty.com/incidents/P8E12U3", "html_url": "https://example.pagerduty.com/incidents/P8E12U3", "alerts": [] }, "id": "81c70b10-a4fc-11e9-ae25-000d3a31cb72", "created_on": "2019-07-12T23:26:41Z", "account_features": { "response_automation": true } } } ``` ```json incident.unacknowledge { "version": "0", "id": "ae68c1db-a650-6ccd-b1c0-58667e02d42d", "detail-type": "PagerDuty Webhook", "source": "aws.partner/pagerduty.com/example-pdwpsandbox", "account": "999999999999", "time": "2019-07-12T23:40:39Z", "region": "us-west-1", "resources": [ "pagerduty" ], "detail": { "event": "incident.unacknowledge", "log_entries": [ { "id": "RQ1ZS7X5UPYOUYJGH605ESQ9WE", "type": "unacknowledge_log_entry", "summary": "Unacknowledged by timeout", "self": "https://api.pagerduty.com/log_entries/RQ1ZS7X5UPYOUYJGH605ESQ9WE", "html_url": null, "created_at": "2019-07-12T16:40:33-07:00", "agent": { "id": "P6MZ15N", "type": "service_reference", "summary": "pd sandbox eventbridge", "self": "https://api.pagerduty.com/services/P6MZ15N", "html_url": "https://example.pagerduty.com/services/P6MZ15N" }, "channel": { "type": "timeout", "details_omitted": false }, "service": { "id": "P6MZ15N", "type": "service_reference", "summary": "pd sandbox eventbridge", "self": "https://api.pagerduty.com/services/P6MZ15N", "html_url": "https://example.pagerduty.com/services/P6MZ15N" }, "incident": { "id": "P8E12U3", "type": "incident_reference", "summary": "[#2618] Taco Shells", "self": "https://api.pagerduty.com/incidents/P8E12U3", "html_url": "https://example.pagerduty.com/incidents/P8E12U3" }, "teams": [], "contexts": [] } ], "webhook": { "endpoint_url": null, "name": "eventbridge-999999999999-us-west-1-pdwpsandbox", "description": null, "webhook_object": { "id": "P6MZ15N", "type": "service_reference", "summary": "pd sandbox eventbridge", "self": "https://api.pagerduty.com/services/P6MZ15N", "html_url": "https://example.pagerduty.com/services/P6MZ15N" }, "config": {}, "outbound_integration": { "id": "PF8FPF1", "type": "outbound_integration_reference", "summary": "Amazon EventBridge", "self": "https://api.pagerduty.com/outbound_integrations/PF8FPF1", "html_url": null }, "accounts_addon": { "id": "PH4YM53", "addon_id": "PXFR4L8", "name": "Amazon EventBridge", "version": "0.0.1", "location": "extension", "key": "com.pagerduty.amazon_bridge", "url": "https://{pagerduty}/integration-eventbridge-ui?accountsAddonId={accountsAddon.id}", "description": "Deliver webhooks to Amazon EventBridge", "help_url": "", "config": {}, "type": "accounts_addon", "summary": "Amazon EventBridge", "self": "https://api.pagerduty.com/accounts_addons/PH4YM53", "html_url": "https://example.pagerduty.com/accounts_addons/PH4YM53" }, "id": "P7X0R2I", "type": "webhook", "summary": "eventbridge-999999999999-us-west-1-pdwpsandbox", "self": "https://api.pagerduty.com/webhooks/P7X0R2I", "html_url": null }, "incident": { "incident_number": 2618, "title": "Taco Shells", "description": "Taco Shells", "created_at": "2019-07-12T23:26:41Z", "status": "triggered", "incident_key": "4338c648a3614c0ea46b534344f73b10", "service": { "id": "P6MZ15N", "name": "pd sandbox eventbridge", "description": null, "created_at": "2019-07-12T08:36:28-07:00", "status": "critical", "teams": [], "alert_creation": "create_alerts_and_incidents", "addons": [], "scheduled_actions": [], "support_hours": null, "last_incident_timestamp": "2019-07-12T16:26:41-07:00", "escalation_policy": { "id": "PYIM1C5", "type": "escalation_policy_reference", "summary": "Default", "self": "https://api.pagerduty.com/escalation_policies/PYIM1C5", "html_url": "https://example.pagerduty.com/escalation_policies/PYIM1C5" }, "incident_urgency_rule": { "type": "constant", "urgency": "high" }, "acknowledgement_timeout": 600, "auto_resolve_timeout": null, "alert_grouping": null, "alert_grouping_timeout": null, "integrations": [], "metadata": { "conference_number": "", "conference_url": "" }, "response_play": null, "type": "service", "summary": "pd sandbox eventbridge", "self": "https://api.pagerduty.com/services/P6MZ15N", "html_url": "https://example.pagerduty.com/services/P6MZ15N" }, "assignments": [ { "at": "2019-07-12T23:30:33Z", "assignee": { "id": "PHLAIIG", "type": "user_reference", "summary": "Pagey the Pager", "self": "https://api.pagerduty.com/users/PHLAIIG", "html_url": "https://example.pagerduty.com/users/PHLAIIG" } } ], "last_status_change_at": "2019-07-12T23:40:33Z", "first_trigger_log_entry": { "id": "RNNXHZY9ZKI3FQIGVSIL4UO9Q3", "type": "trigger_log_entry_reference", "summary": "Triggered through the website", "self": "https://api.pagerduty.com/log_entries/RNNXHZY9ZKI3FQIGVSIL4UO9Q3", "html_url": "https://example.pagerduty.com/incidents/P8E12U3/log_entries/RNNXHZY9ZKI3FQIGVSIL4UO9Q3" }, "alert_counts": { "all": 0, "triggered": 0, "resolved": 0 }, "is_mergeable": true, "escalation_policy": { "id": "PYIM1C5", "type": "escalation_policy_reference", "summary": "Default", "self": "https://api.pagerduty.com/escalation_policies/PYIM1C5", "html_url": "https://example.pagerduty.com/escalation_policies/PYIM1C5" }, "teams": [], "impacted_services": [ { "id": "P6MZ15N", "type": "service_reference", "summary": "pd sandbox eventbridge", "self": "https://api.pagerduty.com/services/P6MZ15N", "html_url": "https://example.pagerduty.com/services/P6MZ15N" } ], "pending_actions": [], "acknowledgements": [], "basic_alert_grouping": null, "alert_grouping": null, "last_status_change_by": { "id": "P6MZ15N", "type": "service_reference", "summary": "pd sandbox eventbridge", "self": "https://api.pagerduty.com/services/P6MZ15N", "html_url": "https://example.pagerduty.com/services/P6MZ15N" }, "metadata": {}, "external_references": [], "priority": null, "incidents_responders": [], "responder_requests": [], "subscriber_requests": [], "urgency": "high", "id": "P8E12U3", "type": "incident", "summary": "[#2618] Taco Shells", "self": "https://api.pagerduty.com/incidents/P8E12U3", "html_url": "https://example.pagerduty.com/incidents/P8E12U3", "alerts": [] }, "id": "7184fc60-a4fe-11e9-bb78-0297ae80f8e2", "created_on": "2019-07-12T23:40:33Z", "account_features": { "response_automation": true } } } ``` --- URL: https://docs.pagerduty.com/integrations/apps # Apps Add, authorize and remove apps Apps allow you to set up other tools to work with PagerDuty by sending data to PagerDuty or receiving data from PagerDuty. By directly integrating your existing tools, you can take advantage of PagerDuty's incident response capabilities and improve your workflows. > **App Development:** Apps are built by PagerDuty, partners, customers, system integrators, and the open source community. This article is a general overview of adding and managing public apps within your PagerDuty account. > > Refer to the [developer documentation](/developer/app-overview) to learn more about creating and publishing your own app. ## Add Apps Users with the appropriate permissions can add an app to their PagerDuty account following the installation instructions in the app's documentation. You can search for your desired integration's documentation by visiting the [integrations library](/integrations). > **User Permissions:** To add an app directly to a service, you must have a user role with sufficient permissions to edit the [service](/incident-management/services/services-and-integrations). ### Authorize OAuth 2.0 Apps Users are presented with a prompt when authorizing an app with OAuth 2.0 functionality. This prompt displays the name of the app, your [service region](/get-started/service-regions) and user ID, and a list of the permissions requested by the app. 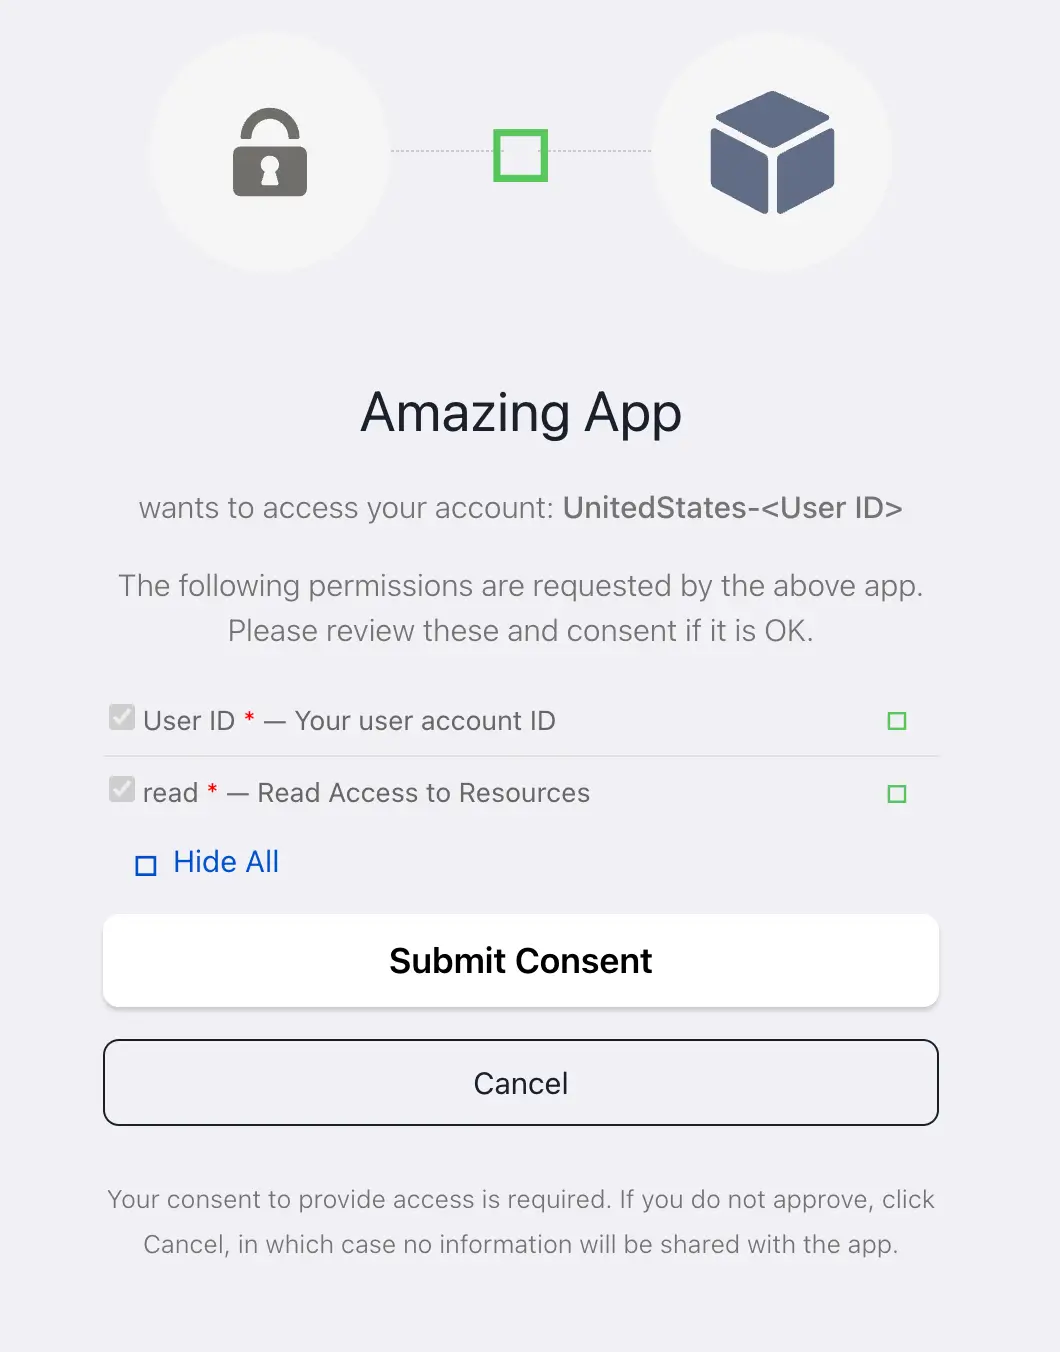 *Authorize app access* > **Scoped OAuth Apps:** [Scoped OAuth apps](/integrations/apps/scoped-oauth-apps) use scopes to limit the resource types an app can access, and give Admins account-wide visibility into installed apps and the tokens they hold. A public Scoped OAuth app must be installed by an Admin before you can authorize it — if the app is not installed, the authorization prompt is unavailable to you. ## Remove Apps Removing an app from an account depends on how the app connects to PagerDuty. Refer to the app's [documentation](/integrations) for specific instructions. General information about removing apps is below: - **Events Integrations**: [Delete the integration](/incident-management/services/services-and-integrations#delete-an-integration) from the service. - **Webhooks**: [Delete the extension](/integrations/extensions#delete-extensions) from the service. - **Scoped OAuth Apps**: An Admin can revoke tokens or uninstall the app from **Integrations** → **OAuth Apps**. For more information, visit [Scoped OAuth Apps](/integrations/apps/scoped-oauth-apps).
--- URL: https://docs.pagerduty.com/integrations/apps/scoped-oauth-apps # Scoped OAuth Apps Review, authorize, and manage third-party apps with scoped access to your PagerDuty data Third-party apps hold access to your PagerDuty data, and until now you had no single place to see which apps those were, what each one could reach, or who had granted it access. Scoped OAuth apps give you that visibility and control. Before a public app can access data in your account, an Admin must install it. From there you can see every installed app, review the scopes each app is allowed to use, see who in your account has authorized an app, revoke tokens, and uninstall apps. Third-party developers build these apps to integrate their services with PagerDuty — for example, monitoring who retains access to your account, or mapping their triage process to your on-call schedules. Scoped OAuth apps are built on the industry-standard OAuth framework and use scopes to limit the kind of resources an app can access. For example, an app can be limited to reading and writing incidents, or to only reading service data. > **Required User Permissions:** The Account Owner and Admins can install and uninstall apps and revoke tokens across the account. Anyone in your account can view installed apps and revoke their own authorizations. If you are not sure which role you have, visit [User Roles](/account-admin/user-roles). ## How Scoped OAuth Apps Work ### Scopes Scopes define the resource types an app can access, and whether it can read or write them — for example, `incidents.read` or `services.write`. When an Admin installs an app, they review and approve the scopes the app requests. Access tokens issued to the app are limited to the scopes approved at installation, even if the developer later updates the app to request more. Scopes follow the principle of least privilege — an app can access only the resource types you approve, and nothing else. For the full list of scopes and the API endpoints they gate, see [OAuth Functionality](/developer/oauth-functionality) in the developer documentation. ### Public and Private Apps Public apps are built by third-party developers, reviewed and approved by PagerDuty, and work across accounts. Public apps must be installed by an Admin before they can access your account. Private apps are created by your own account for your own use. They do not require installation, and you manage them separately from the **Manage Private Apps** page. ### Classic and Scoped Apps Classic User OAuth is PagerDuty's legacy app type. Classic apps do not use resource-type scopes and continue to work as they do today. Classic apps that have been authorized in your account appear in your installed apps list so that Admins have a complete picture of third-party OAuth access. ### User Tokens When someone authorizes an app, the app obtains a user token that acts on that person's behalf. A user token can only access data the authorizing person can access, further limited by the app's approved scopes. Actions the app takes appear in PagerDuty with that person's attribution — for example, the incident timeline shows that they acknowledged an incident. > **App Tokens:** In this release, public apps obtain user tokens. App tokens — server-to-server access where the app acts as itself rather than on someone's behalf — remain available only to private apps created by your own account. ## Install an OAuth App Installation begins from the app's installation page. Developers link to this page from their website or documentation. Only Admins and the Account Owner can install apps. 1. From the developer's site, open the app's installation page. The page lives in your PagerDuty account at `https://
annotations: `pagerduty.com/account: [PAGERDUTY-ACCOUNT] ` #### Add the Backend Plugin to Your Application > **Note:** Version 0.6.0 of the backend plugin (`@pagerduty/backstage-plugin-backend`) introduced support for the Backstage [new backend system](https://backstage.io/docs/backend-system/) which simplifies the backend configuration and requires less code. Once you complete steps in [Install the PagerDuty Plugin](#install-the-pagerduty-plugin), you have added the PagerDuty backend plugin to your application. To expose its capabilities to the frontend plugin, you must configure it. There are two approaches for configuration: - [Legacy Backend System](#legacy-backend-system) - [New Backend System](#new-backend-system) > **Warning:** If you used the PagerDuty plugin for Backstage before the release of `@pagerduty/backstage-plugin-backend@0.6.0`, you already have the backend configured. In this case, see our [migration guidance](https://pagerduty.github.io/backstage-plugin-docs/advanced/backend-system-migration) instead of following the steps in the following section. ##### Legacy Backend System Create a new file named `pagerduty.ts` at `packages/backend/src/plugins/pagerduty.ts` and add the following content: ``` import { Router } from 'express'; import { PluginEnvironment } from '../types'; import { createRouter } from '@pagerduty/backstage-plugin-backend'; export default async function createPlugin( env: PluginEnvironment, ): Promise
In `packages/backend/src/index.ts`, import your plugin and add a route for the APIs exposed by the PagerDuty backend plugin. ``` import pagerduty from './plugins/pagerduty'; // ... async function main() { // … const pagerdutyEnv = useHotMemoize(module, () => createEnv('pagerduty')); // ... apiRouter.use('/pagerduty', await pagerduty(pagerdutyEnv)); ``` ##### New Backend System The Backstage new backend system requires less code to set up plugins. Open the `packages/backend/src/index.ts` file and add the PagerDuty backend plugin to your Backstage app: ``` // pageduty plugin backend.add(import('@pagerduty/backstage-plugin-backend')); ``` #### Configure API Authorization The PagerDuty plugin requires access to PagerDuty APIs. Configure your PagerDuty plugin for Backstage with the necessary credentials to reach them. This step requires using an OAuth access token or an API token. > **Note:** If you do not already have this information, follow the steps in the previous section to [Configure PagerDuty](#configure-pagerduty) to obtain the client ID and client secret for OAuth authorization, or [Generate a General Access REST API Token](/account-admin/api-access-keys#generate-a-general-access-rest-api-key) to generate a REST API token. ##### Single PagerDuty Account If all your services exist in a single PagerDuty account, follow the instructions in the following section. **Scoped OAuth (recommended)** In the `app-config.yaml` file, add the following configuration and set your OAuth configuration: ``` pagerDuty: oauth: clientId: ${PD_CLIENT_ID} clientSecret: ${PD_CLIENT_SECRET} subDomain: ${PD_ACCOUNT_SUBDOMAIN} region: ${PD_ACCOUNT_REGION} // Optional. // Allowed values: 'us', 'eu'. // Defaults to 'us'. ``` > **Note:** The `subDomain` property requires only the first segment of your PagerDuty account URL. **Example**: If your PagerDuty account URL is `https://myaccount.pagerduty.com` then your `subDomain` value is `myaccount`. Configuring it with an invalid value can cause authentication to fail. **REST API Token** In the `app-config.yaml` file, add the following configuration to set your REST API token: ``` pagerDuty: apiToken: ${PAGERDUTY_TOKEN} ``` ##### Multiple PagerDuty Accounts If your organization uses multiple PagerDuty accounts, multi-account support is available on version 0.14.0 or higher of the frontend plugin (`@pagerduty/backstage-plugin`). To configure multiple accounts, follow the steps in the following section. **Scoped OAuth (recommended)** In the `app-config.yaml` file, add the following configuration and set your OAuth configuration: ``` pagerDuty: accounts: - id: ${PD_ACCOUNT_SUBDOMAIN_1} // The ID must be the subdomain for the account isDefault: true // Only one account can be defined as the default/fallback apiBaseUrl: ${PD_API_BASE_URL_1} oauth: clientId: ${PD_CLIENT_ID_1} clientSecret: ${PD_CLIENT_SECRET_1} subDomain: ${PD_ACCOUNT_SUBDOMAIN_1} region: ${PD_ACCOUNT_REGION_1} // Optional. allowed values: 'us', 'eu'. // Defaults to 'us'. - id: ${PD_ACCOUNT_SUBDOMAIN_2} apiBaseUrl: ${PD_API_BASE_URL_2} oauth: clientId: ${PD_CLIENT_ID_2} clientSecret: ${PD_CLIENT_SECRET_2} subDomain: ${PD_ACCOUNT_SUBDOMAIN_2} ``` > **Note:** The `subDomain` property requires only the first segment of your PagerDuty account URL. **Example**: If your PagerDuty account URL is `https://myaccount.pagerduty.com` then your `subDomain` value is `myaccount`. Configuring it with an invalid value can cause authentication to fail. **REST API Token** In the `app-config.yaml` file, add the following configuration to set your REST API token: ``` pagerDuty: accounts: - id: ${PD_ACCOUNT_SUBDOMAIN_1} // The ID must be the subdomain for the account isDefault: true // Only one account can be defined as the default/fallback apiBaseUrl: ${PD_API_BASE_URL_1} apiToken: ${PAGERDUTY_TOKEN} - id: ${PD_ACCOUNT_SUBDOMAIN_2} apiToken: ${PAGERDUTY_TOKEN} ``` > **Note:** In the multi-account setup, you can configure accounts with Scoped OAuth and others with a REST API token. You can optionally specify the custom API base URL and events URL for specific accounts. All optional properties revert to default values if they are not present. #### Test Your Configuration Start your Backstage app and pass the PagerDuty API token or OAuth parameters as environment variables. **For Scoped OAuth** ``` PD_CLIENT_ID='
--- URL: https://docs.pagerduty.com/integrations/bitbucket # Bitbucket Integration Guide | PagerDuty Integration Guide for Bitbucket ## Bitbucket + PagerDuty Benefits - Bitbucket is Atlassian’s Git solution for professional teams, featuring pull requests, branch permissions and inline comments. - Notify on-call engineers about failures within your Bitbucket pipelines. ## Requirements - **In PagerDuty**: This integration requires a Manager base role or higher to configure. - **In Bitbucket**: This integration requires users to be able to edit repository settings. ## How it Works - When there is a failure in your Bitbucket pipelines, a PagerDuty incident will notify on-call responders. - When the failure recovers, a `SUCCESSFUL` message is sent to PagerDuty and the PagerDuty incident will automatically resolve. ## Version This integration is intended for Bitbucket Cloud. ## Integration Walkthrough ### In PagerDuty 1. In the PagerDuty web app, go to **Services** → **Service Directory**. 2. Select the PagerDuty service you wish to integrate with, then select the **Integrations** tab. 3. Click **Add an integration**. 4. Search for and select **Atlassian Bitbucket Pipelines**, then click **Add**. 5. You will be taken back to the **Integrations** tab showing the newly added integration. Click the name of the **Atlassian Bitbucket Pipelines** integration you created in the previous step. 6. Click to copy the **Integration URL** to your clipboard, which will be in the following format: `https://events.pagerduty.com/integration/xxxxxxxxxxxxxxxxxxxxxxxxxxxxxxxx/enqueue`. Keep this URL in a safe place, since you will need it in the [next section](#in-bitbucket) when you configure a webhook in your Bitbucket account. 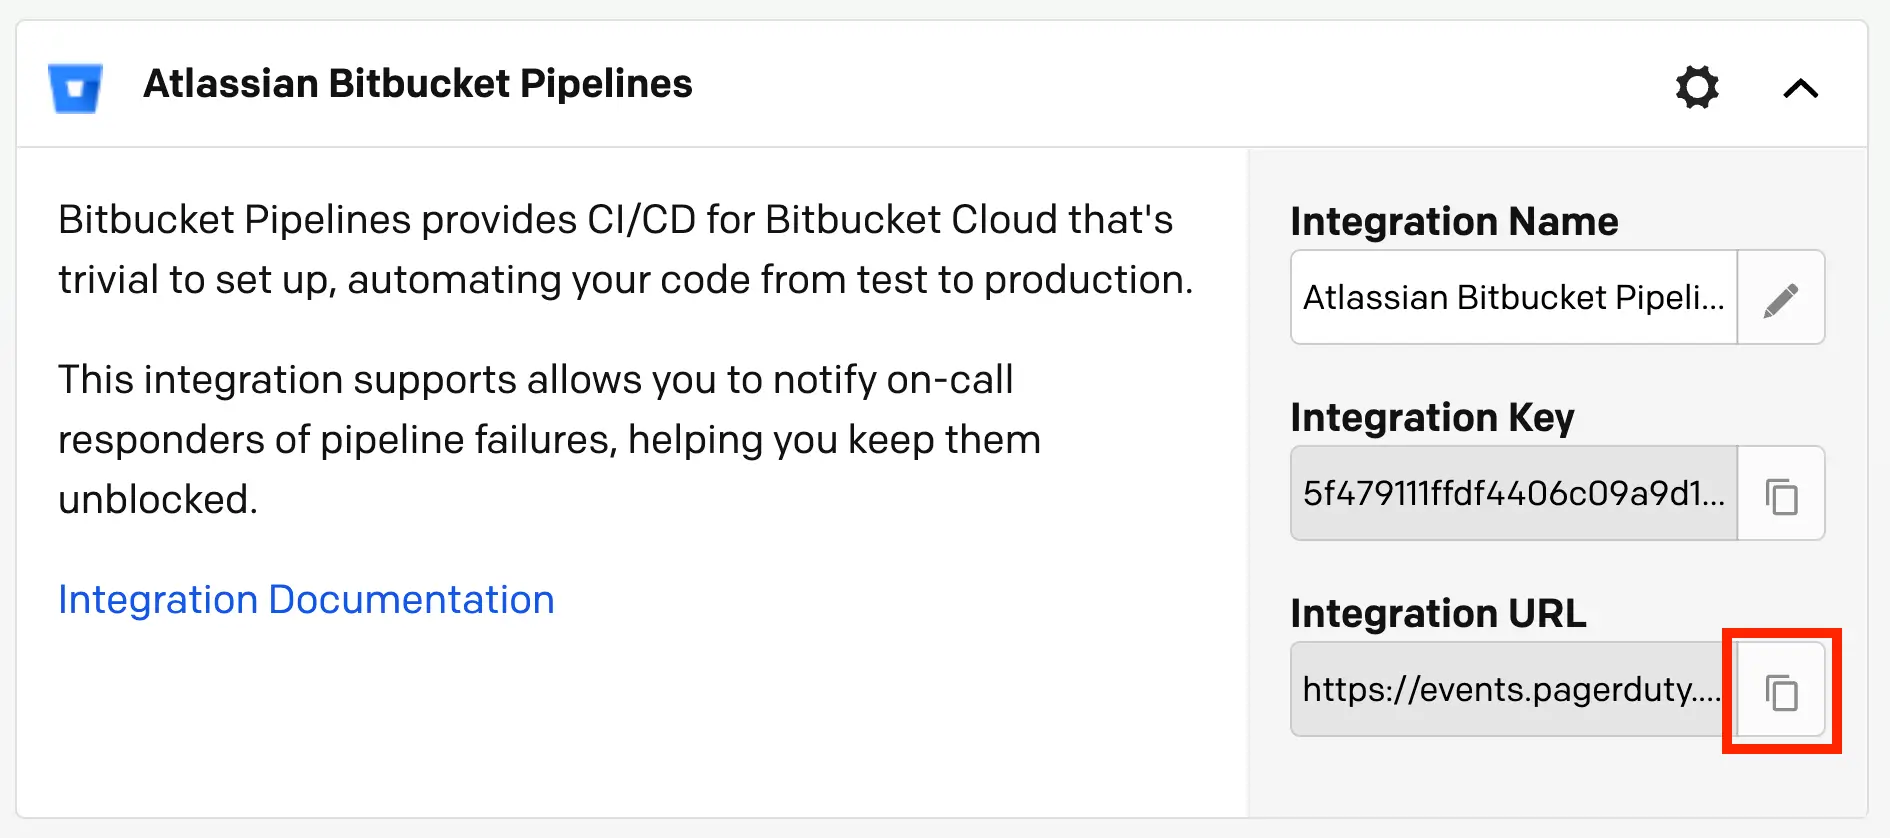 *Copy integration URL* ### In Bitbucket You will complete the rest of the configuration in Bitbucket, where you will add a webhook that sends build information to PagerDuty. 7. Open the repository you want to integrate with PagerDuty. From the left-side navigation, select **Repository settings**. 8. Select **Webhooks** from the **Workflow** subheading and click **Add Webhook**. 9. Enter a title, then paste the PagerDuty URL you copied from the [previous section](#in-pagerduty) into the field **URL**. 10. In the section **Triggers**, select **Build status updated** under **Repository**. 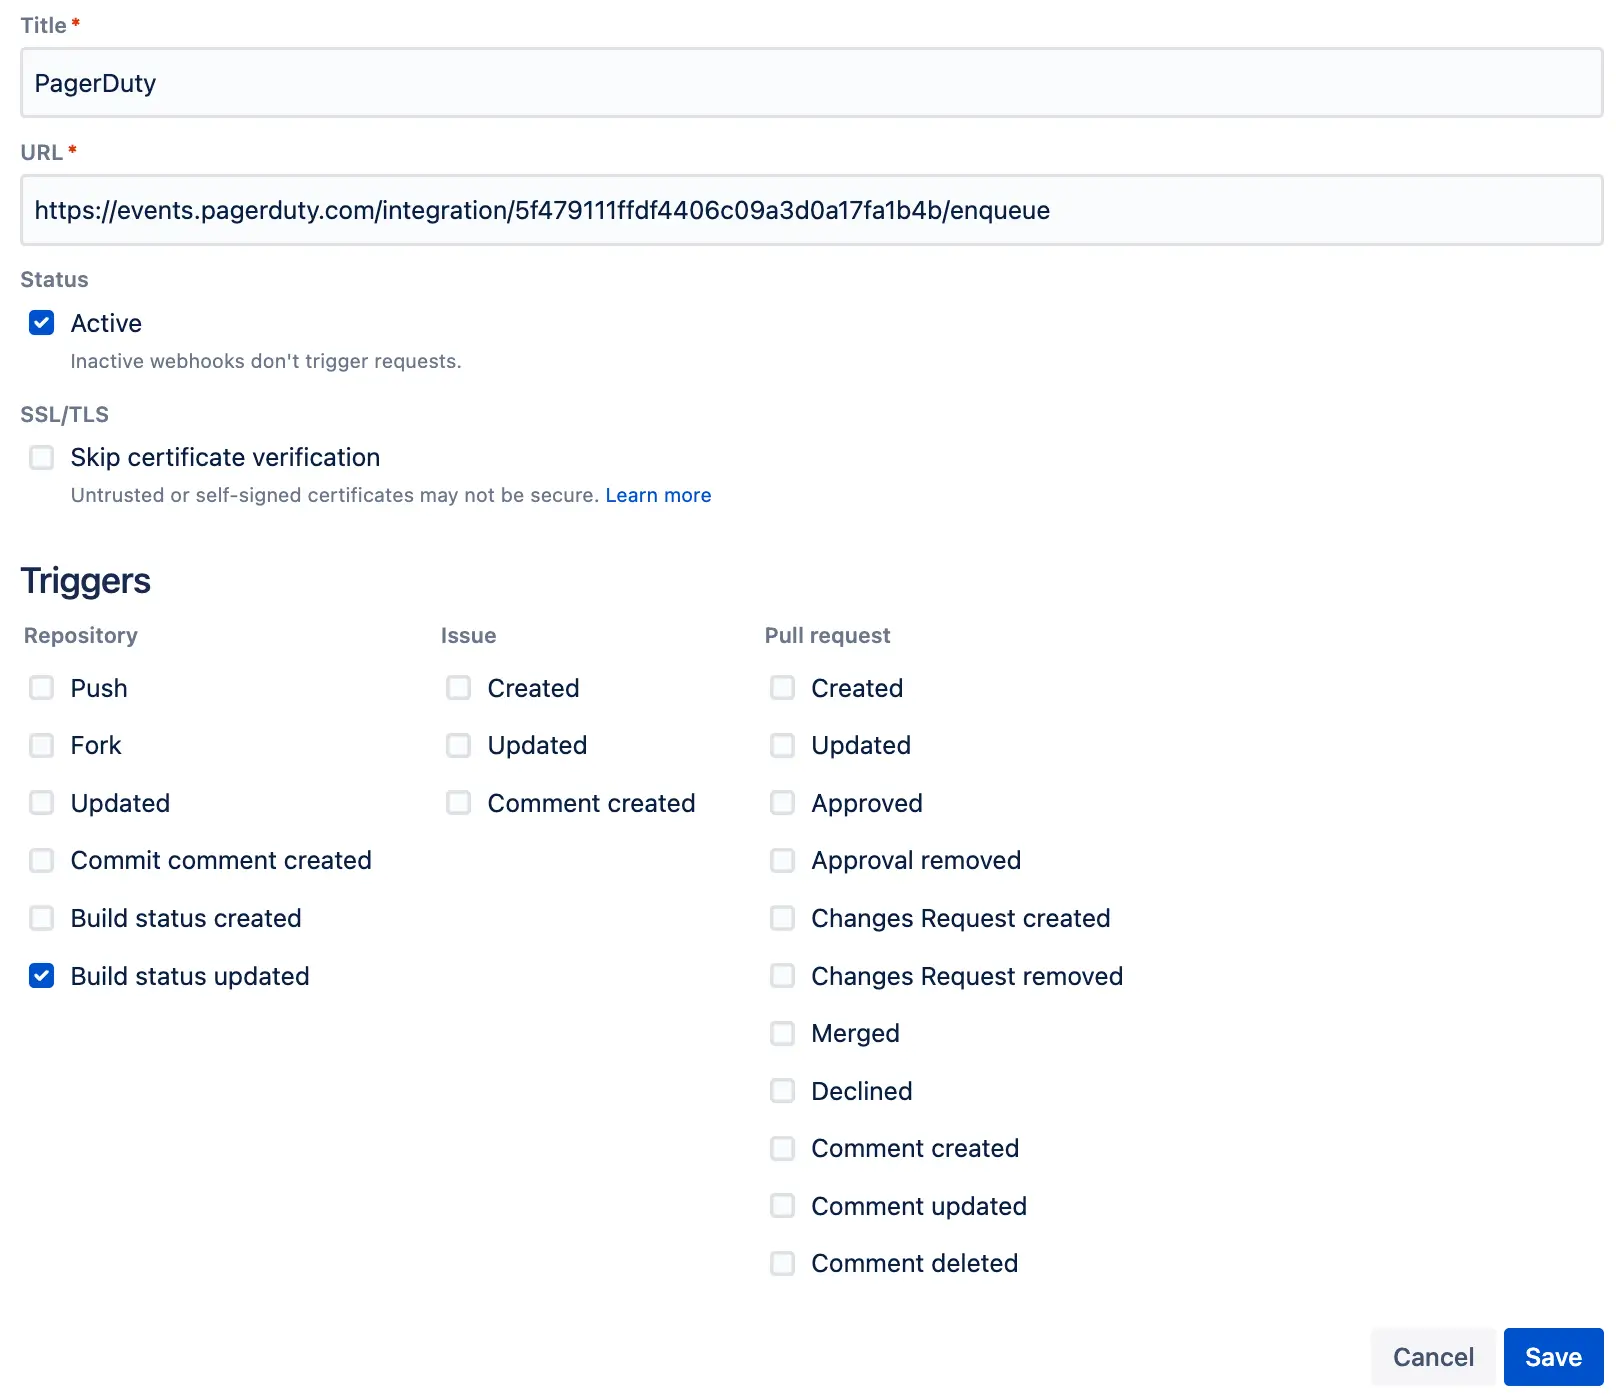 *Configure webhook* 11. Click **Save**. 12. _Optional_: Each repository in Bitbucket can be configured to send failure information to a different PagerDuty service. You can repeat the [Integration Walkthrough](#integration-walkthrough) as many times as needed, if you’d like to integrate PagerDuty with more than one Bitbucket repository. --- URL: https://docs.pagerduty.com/integrations/custom-incident-actions # Custom Incident Actions Create custom incident action buttons that trigger your own hosted scripts via webhook when responders click them during an incident. Custom Incident Actions allow incident responders to quickly execute custom logic that is housed outside of the PagerDuty system. Customers can host their own custom scripts that execute when these actions are triggered, which provides users with a nearly limitless number of possible actions. ## Create a Custom Incident Action > **Required User Permissions:** - Managers, Global Admins, and the Account Owner can create custom incident actions. > - Responder users with a Manager [Team role](/account-admin/advanced-permissions#team-roles) can create custom incident actions for services associated with their Team. 1. In the PagerDuty web app, navigate to **Integrations** → **Custom Incident Actions**. 2. Click **New Action**. 3. Enter the following fields: | Field | Instructions | | :------------------------------ | :---------------------------------------------------------------------------------------------------------------------------------------------------------------------------------------------------------------------------------------------------------------------------------------------------------------------------------------------------------------------------------------------------------------------------------------------------------------- | | **Button Label** | Enter a name for the button that appears in PagerDuty incidents. | | **URL Endpoint** | Enter the URL endpoint where PagerDuty sends the HTTP POST request when a user selects the Custom Incident Action's button. | | **Description** | Enter a description of what happens when users click the Custom Incident Action button. | | **Select Service** | Select the service where you would like incidents to display this button. | | **Custom Headers** _(Optional)_ | Click **Add Custom Header** and enter a **Header Name** and **Header Value**. These headers are included on each webhook sent from this custom incident action. You may click **Add Custom Header** again to add multiple custom headers. **Note**: With V3 Webhook Subscriptions, [all header names must be unique](/developer/webhooks-overview#custom-headers). To delete a custom header, click to the right. | 4. When you have finished configuring your custom action, click **Create Action**. For more information about the payload you receive through a PagerDuty webhook, visit the [Developer Documentation](/developer/webhooks-overview#webhook-payload). 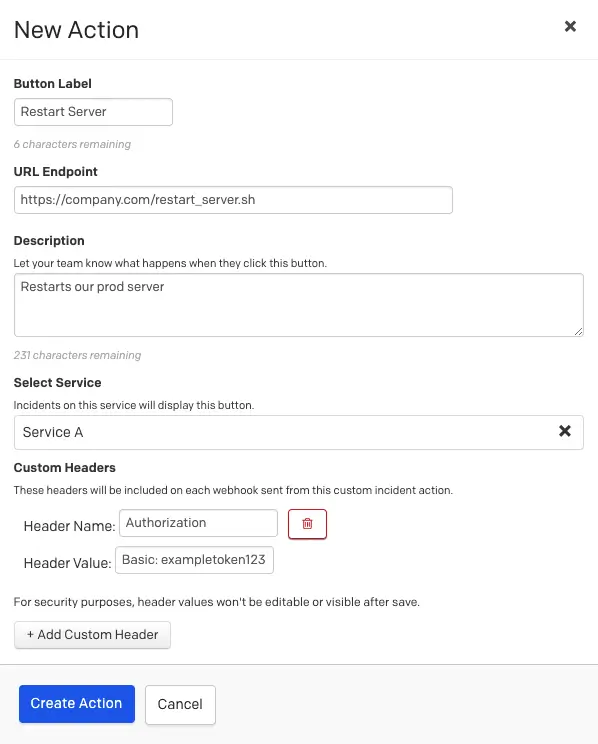 *Create a Custom Incident Action* ### Copy the Custom Incident Action Webhook ID 1. Navigate to **Integrations** → **Custom Incident Actions** and find Custom Incident Action in the extensions list. 2. Click to the right of your desired custom incident action and select **Copy webhook ID**. ## Edit a Custom Incident Action 1. Navigate to **Integrations** → **Custom Incident Actions** and find Custom Incident Action in the extensions list. 2. Click to the right of your desired custom incident action and select **Edit**. 3. Make the necessary changes and then click **Save Changes**. ## Remove a Custom Incident Action 1. Navigate to **Integrations** → **Custom Incident Actions** and find Custom Incident Action in the extensions list. 2. Click to the right of your desired custom incident action and select **Remove**. 3. In the confirmation modal, click **Delete**. ## Execute a Custom Incident Action > **Required User Permissions:** Responders, Managers, Global Admins, and Account Owners can execute custom incident actions. Observers can execute custom incident actions on incidents they are assigned to. After you have created a custom action, you see the action button available on all incidents on that service under the **More** dropdown menu. 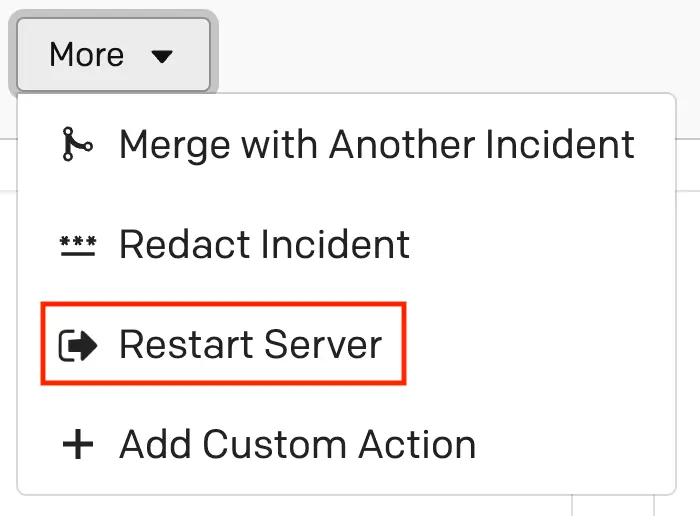 *Execute a Custom Incident Action* When a user clicks the Custom Incident Action's button in a PagerDuty incident, it sends an HTTP POST request with data on the incident to the action's configured endpoint URL. You can then build a script that listens for this request, for example, and executes custom logic when a request is received. > **Product Limit:** There is a maximum of three Custom Incident Actions per service. ## Common Use Cases ### Restart Server Create a **Restart Server** button on your incidents that, when selected, restarts the server associated with the incident. The custom action's POST request includes details on the incident that would allow a single script to dynamically determine the server in need of a restart. ### Add Diagnostics Create an **Add Diagnostics** button that fetches diagnostic data on the affected infrastructure and appends the data as a note on your PagerDuty incident. This gives your users visibility into key infrastructure data directly in the PagerDuty incident. ### Revert Last Commit Create a **Revert Last Commit** button that reverts the last commit in the repository that houses the affected service's source code. This allows your users to quickly roll back a bad deploy without leaving the PagerDuty platform. ### Update Status Page Create an **Update Status Page** button that lets your users update your status page with one click. This lets your users update your customers as soon as an incident occurs. --- URL: https://docs.pagerduty.com/integrations/datadog-apps-integration-guide # Datadog Apps Integration Guide | PagerDuty Configure the Datadog Apps integration ## Datadog Apps and PagerDuty Benefits You can view information from PagerDuty in your Datadog dashboard. You can take action on PagerDuty incidents in your Datadog dashboard. You can navigate quickly from Datadog to PagerDuty to view details. ## Requirements To use Datadog apps, you must first install the PagerDuty UI integration in your Datadog account. 1. In Datadog, navigate to **Integrations**. 2. Search for the PagerDuty UI integration and click **Install**. After the PagerDuty UI integration is installed, follow the individual configuration steps for each app. The following apps are available: - [Status Dashboards by PagerDuty](#status-dashboards-by-pagerduty) - [Incidents by PagerDuty](#incidents-by-pagerduty) ## Status Dashboards by PagerDuty - View the [status](/incident-management/communicate/internal-status-page#business-service-statuses) of PagerDuty business services from your Datadog dashboard. - Navigate quickly from Datadog to PagerDuty business services and their incident details. ### Requirements **In PagerDuty**: - The PagerDuty status dashboard feature is only available on the following pricing plans: Business, Digital Operations (legacy) and Enterprise for incident management. [Contact the PagerDuty Sales Team](https://www.pagerduty.com/contact-sales/) to upgrade to a plan including the status dashboard feature. **In Datadog**: - This integration requires the `dashboards_write` permission in Datadog. ### How It Works - When a PagerDuty business service is impacted by an incident on one of its supporting services, the Status Dashboards by PagerDuty app updates with its status. ### Integration Walkthrough #### Configure PagerDuty 1. To use the Status Dashboards by PagerDuty app, [configure an Internal Status Page](/incident-management/communicate/internal-status-page#configure-the-internal-status-page) in your PagerDuty account. #### Configure Datadog 2. In your Datadog account, navigate to **Dashboards**. Select the dashboard where you want to add the Status Dashboard app, or [create a new dashboard](https://docs.datadoghq.com/dashboards/#new-dashboard). 3. In the dashboard, click **Add Widgets** to the right of the dashboard title. With the widgets pane expanded, select the **UI Extensions** tab and click **Incidents by PagerDuty**. 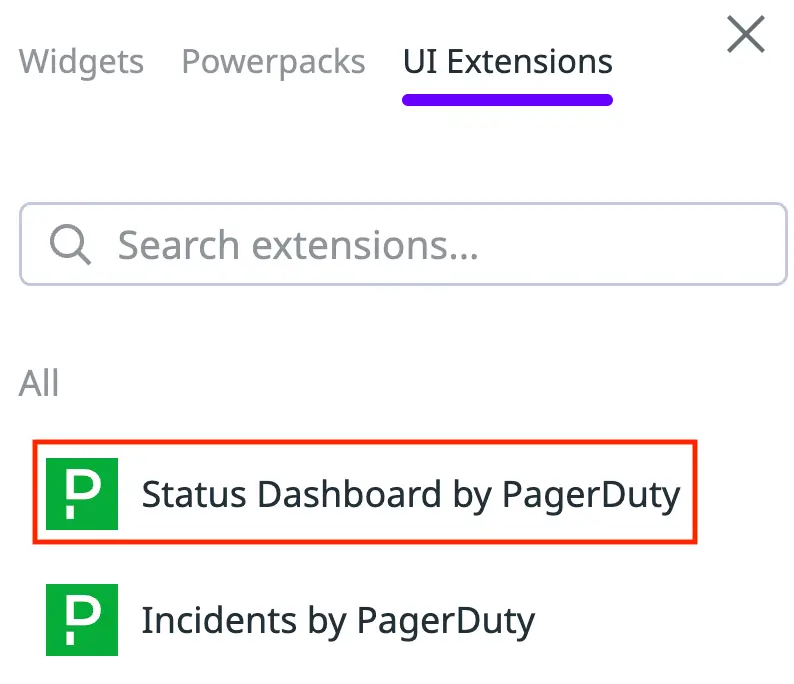 *Status Dashboard by PagerDuty* 4. In the **Status Dashboard by PagerDuty Editor** modal, click **Connect**. 5. Click **Sign in to PagerDuty** and complete the login process. 6. You are redirected to the **Editor** modal where you see a preview of how the app appears. Configure the following fields: | Field | Value | | ---------------- | ------------------------------------------------------------------------------------------------------------------------------------------- | | **Options** | Select from the dropdown to choose which [Internal Status Page](/incident-management/communicate/internal-status-page#create-custom-dashboards) is displayed by default. | | **Widget title** | (Optional) Enter a title for the widget. | 7. Click **Save** to add the app to your dashboard. ### Using Status Dashboards by PagerDuty #### View Status Dashboards by PagerDuty Navigate to **Dashboards** and select the dashboard with the app configured. #### View Related Business Services Click **** to the right of a business service to view related business services. #### View Details in PagerDuty Click the **Business Service name** to view it within PagerDuty. To view the PagerDuty status dashboard, click **Go to PagerDuty**. #### Log Out of the Status Dashboard To log out of the status dashboard of this account, click **** → **** and select **Log out**. ## Incidents by PagerDuty - View and take action on up to 20 active incidents from your teams within the Datadog dashboard. - Navigate quickly from Datadog to PagerDuty to view full incident and service details. ### Requirements **In Datadog**: - This integration requires the `dashboards_write` permission in Datadog. ### How It Works - When there are active, high-urgency PagerDuty incidents associated with your team, the Incidents by PagerDuty app updates its incident list. - Incidents by PagerDuty displays up to 20 active incidents. You can navigate to PagerDuty to view individual incidents and their services, or view all incidents. ### Integration Walkthrough #### Configure Datadog 1. In your Datadog account, navigate to **Dashboards**. Select the dashboard where you want to add the Incidents by PagerDuty app, or [create a new dashboard](https://docs.datadoghq.com/dashboards/#new-dashboard). 2. In the dashboard, click **Add Widgets** to the right of the dashboard title. With the widgets pane expanded, select the **UI Extensions** tab and click **Incidents by PagerDuty**. 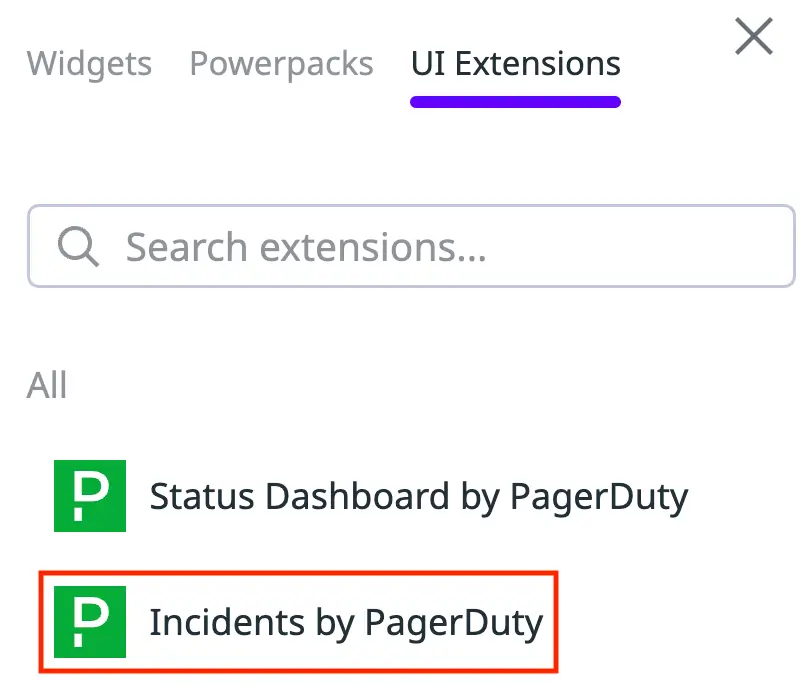 *Incidents by PagerDuty* 3. In the **Incidents by PagerDuty Editor** modal, click **Connect**. 4. Click **Sign in to PagerDuty** and complete the login process. 5. You are redirected to the **Editor** modal where you see a preview of how the app appears. Configure the following field: | Field | Value | | ---------------- | ---------------------------------------- | | **Widget title** | (Optional) Enter a title for the widget. | 6. Click **Save** to add the app to your dashboard. ### Using Incidents by PagerDuty #### Incident Details in Datadog Each incident in the Incidents by PagerDuty app displays the following information: - **Status**: The [status of the incident](/incident-management/incidents/overview#incident-statuses) as Triggered, Acknowledged or Resolved. - **Priority**: The [priority level of the incident](/incident-management/incidents/incident-priority). - **Incident Title**: The title of the incident, linked to view in PagerDuty. - **Service**: The [service of the incident](/incident-management/services/services-and-integrations), linked to view in PagerDuty. - **Escalation Policy**: The [escalation policy of the incident](/incident-management/schedules/escalation-policies), linked to view in PagerDuty. - **Duration**: The duration of the incident. - **Assigned to**: The assigned responder of the incident. - **Outlier Incident**: Context on [how often similar incidents occur on a specific service](/ai-automation/aiops/outlier-incident). **Note**: This feature is only available to accounts with the Event Intelligence add-on, or those on the following pricing plans: Digital Operations (legacy) and Enterprise for incident management. #### Acknowledge or Resolve an Incident 1. **Check the box** to the left of the incident. 2. Click **Acknowledge** or **Resolve** in the bottom menu. #### View Incident or Service Details in PagerDuty 1. Click the **Incident Title** or **Service** to view more details in PagerDuty. 2. To view a list of all incidents in PagerDuty, click **View all Incidents** in the bottom right. ## FAQ **Can I add two Status Dashboard apps with two different Status Dashboard views enabled?** Yes, as long as each Internal Status Page view is from the same PagerDuty account. Using two different PagerDuty accounts on the same dashboard is currently not supported. --- URL: https://docs.pagerduty.com/integrations/email-integration-guide # Email Integration Guide | PagerDuty Route monitoring emails into PagerDuty by connecting an integration email address to an Event Orchestration or a service directly. This guide describes how to integrate PagerDuty with any service capable of sending an email. Please note that we offer integration guides and plugins for many popular [monitoring services](/integrations). Furthermore, tools that don’t yet have dedicated guides can often be integrated with PagerDuty using our [Events API](/developer/events-api-v2-overview). ## How it Works Events and alerts from monitoring tools will be sent as emails to your desired PagerDuty integration email address. PagerDuty will open and trigger an incident when it receives an email to this integration address. ## Requirements - You must have a User, Admin, Manager, Global Admin or Account Owner role to configure the integration. - Your monitoring tool must be able to send emails. - One of the following integration types in PagerDuty: - [Event Orchestration](/ai-automation/aiops/event-orchestration): Integrating with Event Orchestrations may be beneficial if you want to build nested rules based on the events coming from the integrated tool. - [PagerDuty Service](/incident-management/services/services-and-integrations#create-a-service): Integrating with a PagerDuty service directly can be beneficial if you don’t need to route alerts from the integrated tool to different responders based on the event payload. **Note**: Email integrations at the service-level are not evaluated by [Service Orchestrations](/ai-automation/aiops/event-orchestration#service-orchestrations). Instead, you can configure [rules and filters](#email-management) to manage these events. ## Integration Walkthrough You can use the following methods to integrate with PagerDuty via email: - [Event Orchestration](#integrate-with-event-orchestration) - [PagerDuty Service](#integrate-with-a-pagerduty-service) ### Integrate with Event Orchestration 1. In the PagerDuty web app, navigate to **AIOps** → **Event Orchestration**. 2. Select your desired **Global Orchestration** and then click **Integrations**. 3. To the right of the field **Email Address**, click **Copy to Clipboard** and **refer to your monitoring tool’s documentation on connecting with an email address in order to complete the integration**. PagerDuty will open and trigger an incident when it receives an email to this integration address. The [Email Incident Example](#email-incident-example) section displays a screenshot of what a test incident will look like. ### Integrate with a PagerDuty Service > **Event Orchestration:** [Service Orchestration rules](/ai-automation/aiops/event-orchestration#service-orchestrations) are not applied to service-level email integration events. If you would like to utilize Orchestration rules with email events, please integrate directly with an [Event Orchestration](#integrate-with-event-orchestration). 1. In the PagerDuty web app, navigate to **Services** → **Service Directory**. 2. Click the **name** of the service you want to add the integration to. Then select the **Integrations** tab and click **Add an integration**. 3. Search and select **Email** from the dropdown **Select the integration(s) you use to send alerts to this service**. 4. Click **Add** to save your new integration. You will be redirected to the Integrations tab for your service. 5. Find your integration in the list and click to the right. Copy the **Integration Email** address and **refer to your monitoring tool’s documentation on connecting with an email address in order to complete the integration**. PagerDuty will open and trigger an incident when it receives an email to this integration address. #### Edit an Email Integration Address You can customize an email integration's username in the PagerDuty web app: 1. Navigate to **Services** → **Service Directory** and select your desired service from the list. 2. Select the **Integrations** tab and click to the right of the email integration. 3. In the **Integration Email** section, click and enter a new value. 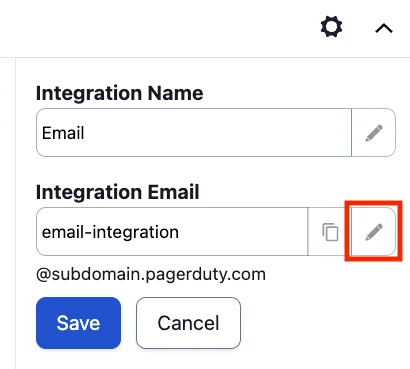 *Edit email integration address* 4. Click **Save**. ### Email Incident Example Below is a test incident triggered via email: 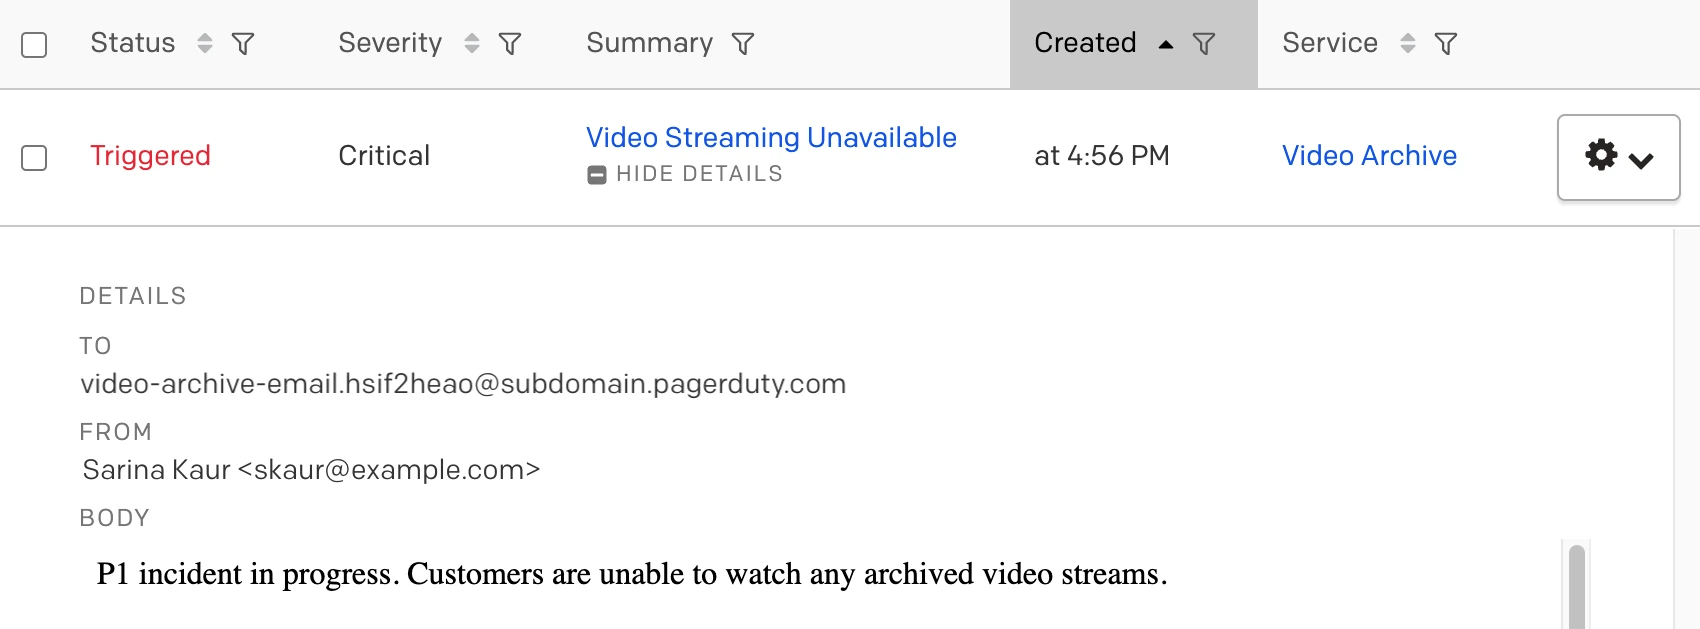 *Email incident* ## Email Management > **Requirement:** The following instructions are for [service-level email integrations](#integrate-with-a-pagerduty-service). If you are integrating with an Event Orchestration, please refer to our [Event Orchestration](/ai-automation/aiops/event-orchestration#configure-a-global-or-service-orchestration-rule) article for guidance on managing email events. By default, PagerDuty opens a new incident every time an email is received at the integration address. You can change this behavior by changing the Email Management setting for your service. See [Email Management: Filters and Rules](/integrations/email-integration-guide/email-management-filters-and-rules#email-management) for more information. ### Email Filters Filters allow you to disregard certain messages arriving at the integration email address. Each email’s subject, body, and from address can be checked against either a safelist or blocklist regular expression filter. Messages that don’t pass the filter will be silently discarded. This feature is handy if you have a monitoring tool that sends out emails that you don’t want to trigger incidents in PagerDuty. See [Email Filters](/integrations/email-integration-guide/email-management-filters-and-rules#email-filters) for more information. ### TLS Encrypted Emails PagerDuty email servers are configured to accept TLS-protected SMTP sessions when your outbound mail servers are configured to use TLS opportunistically. When the message is encrypted, the last hop listed in the receive headers will mention a TLS-enabled connection.  ## Email Requirements and Behavior ### Email Encoding Emails sent to an email integration endpoint must be sent in UTF-8. ### Email Attachments If your email (including headers, attachments, etc.) is under 96 KB, the message can pass through without truncation. However, PagerDuty will strip all attachments from emails and truncate messages if the email is over 96 KB. In those cases, the following can happen: 1. Any parts of the email body where the Content-Type does not match the following regular expression will be discarded: `/(text\/(plain|html)|multipart\/)/` This means PDF files and similar attachments will be stripped. 2. Text parts (i.e., Content-Type of `text/plain` or `text/html`) will be truncated to 32 KB. 3. If the resulting total email size including headers, attachments, etc. still exceeds 2 MB then PagerDuty will reject the message. You can tell if a message has been truncated or had attachments removed by checking for the headers `X-PagerDuty-Truncated-Part` or `X-PagerDuty-Removed-Attachments` when viewing the raw message. You can view the raw message on the incident's detail page by clicking **View Message** on an incident log entry, then **View Raw Message**.  *Truncated email* See [Email Notifications](/incident-management/notifications/notification-content-and-behavior/email-notifications) for more details on email content and behavior. ### Email Size Limits If an email is over 10 MB (including headers and attachments), our server will reject it. This rejection happens _prior_ to any processing or truncation. The email server which sent the message will receive an error notification indicating that the "Message size exceeds fixed limit". If an email is still over 2MB _after_ truncation and being stripped of headers and attachments, it will be silently dropped and your server will _not_ receive a notification. ### Incident Key Truncation If the incident key of the email that triggered an incident is more than 255 characters, it will be truncated to 255 characters. ### Truncation of Incident Details in Email Notifications When you receive a PagerDuty email notification, the **Details** section of each incident will be truncated to 500 characters. You can access the complete email body in the PagerDuty web app via the incident logs and details, or via the [PagerDuty Mobile App](/get-started/mobile-app). ## Email Event Ingestion Limit Email events have an ingestion rate limit of 60 events/min, per key. If you require a higher limit, please contact your account team or consider using the [Events API](/developer/events-api-v2-overview), which supports higher rate limits and can be [increased even further for PagerDuty AIOps customers](/ai-automation/aiops/overview#increased-event-ingestion). --- URL: https://docs.pagerduty.com/integrations/email-integration-guide/email-integration-troubleshooting-guide # Email Integration Troubleshooting Guide Learn how to troubleshoot email integration issues Here are some solutions to issues that may come up when working with [email management rules](/integrations/email-integration-guide/email-management-filters-and-rules): - [Replies and Email Forwards Trigger a New Incident](#replies-and-email-forwards-trigger-a-new-incident) - [Trigger Emails are not Accepted](#trigger-emails-are-not-accepted) - [Resolve Emails are not Resolving Incidents](#resolve-emails-are-not-resolving-incidents) - [Capture Group Error Message](#capture-group-error-message) - [A Regular Expression is Not Matching the Email Body as Expected](#a-regular-expression-is-not-matching-the-email-body-as-expected) ## Replies and Email Forwards Trigger a New Incident By default, PagerDuty email integrations accept any messages from any sender, including messages addressed to multiple recipients. When someone replies to all recipients on an email with recipients that include the email integration address, they also send an email to the email integration address. This can trigger a new incident, in addition to the original incident. You can configure an email management [trigger rule](/integrations/email-integration-guide/email-management-filters-and-rules#create-a-trigger-rule) to prevent replies and forwards from triggering duplicate incidents: 1. Configure the rule to **trigger** an alert/incident if **Any of the following conditions apply**. 2. Configure a condition: The email **subject matches the regular expression:** `.*` 3. For the incident/alert key, have the rule state: **In the email subject, match this regular expression:** `(?:(?i)re: |fwd: )?(.*)`. 4. Click **Save changes**. > **Case Insensitive:** This regular expression is case insensitive, so any version of "RE:" or "FWD:" will deduplicate the email trigger into the open incident. 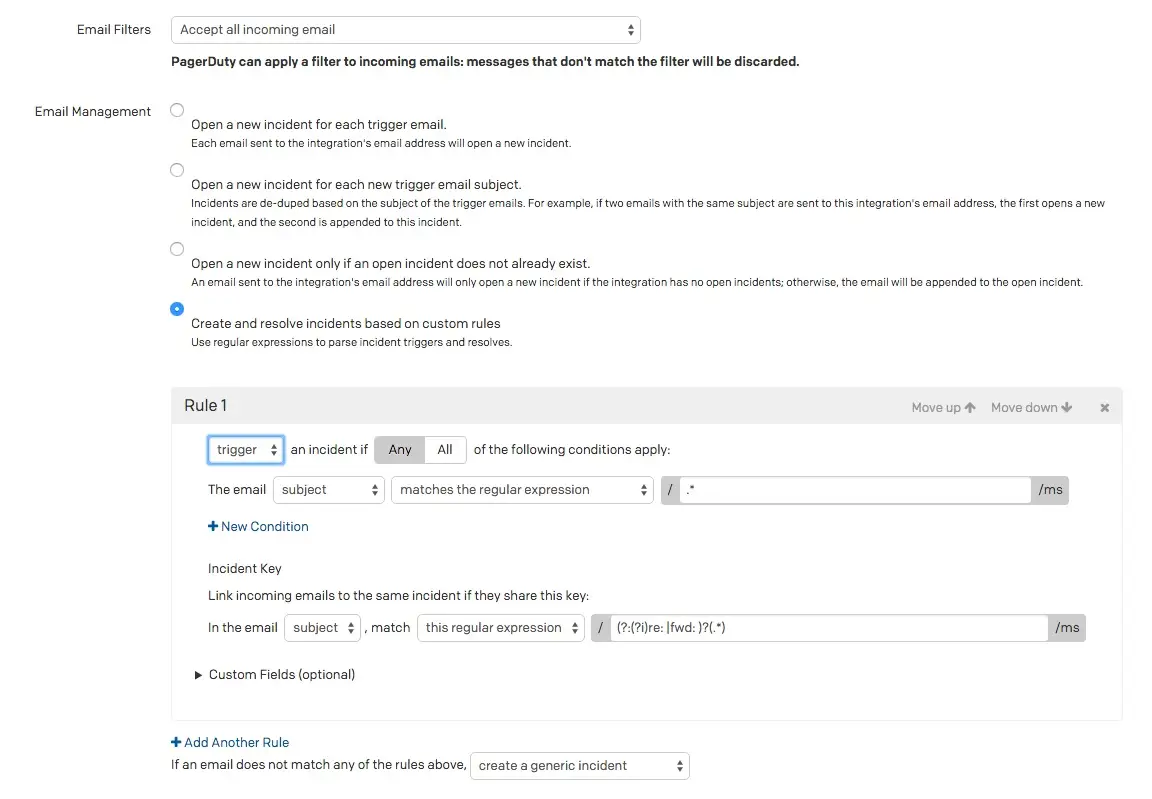 Replies and forwards will now be appended to the existing incident’s [Alert Log](/incident-management/incidents/alerts#view-alerts-in-the-web-app) . 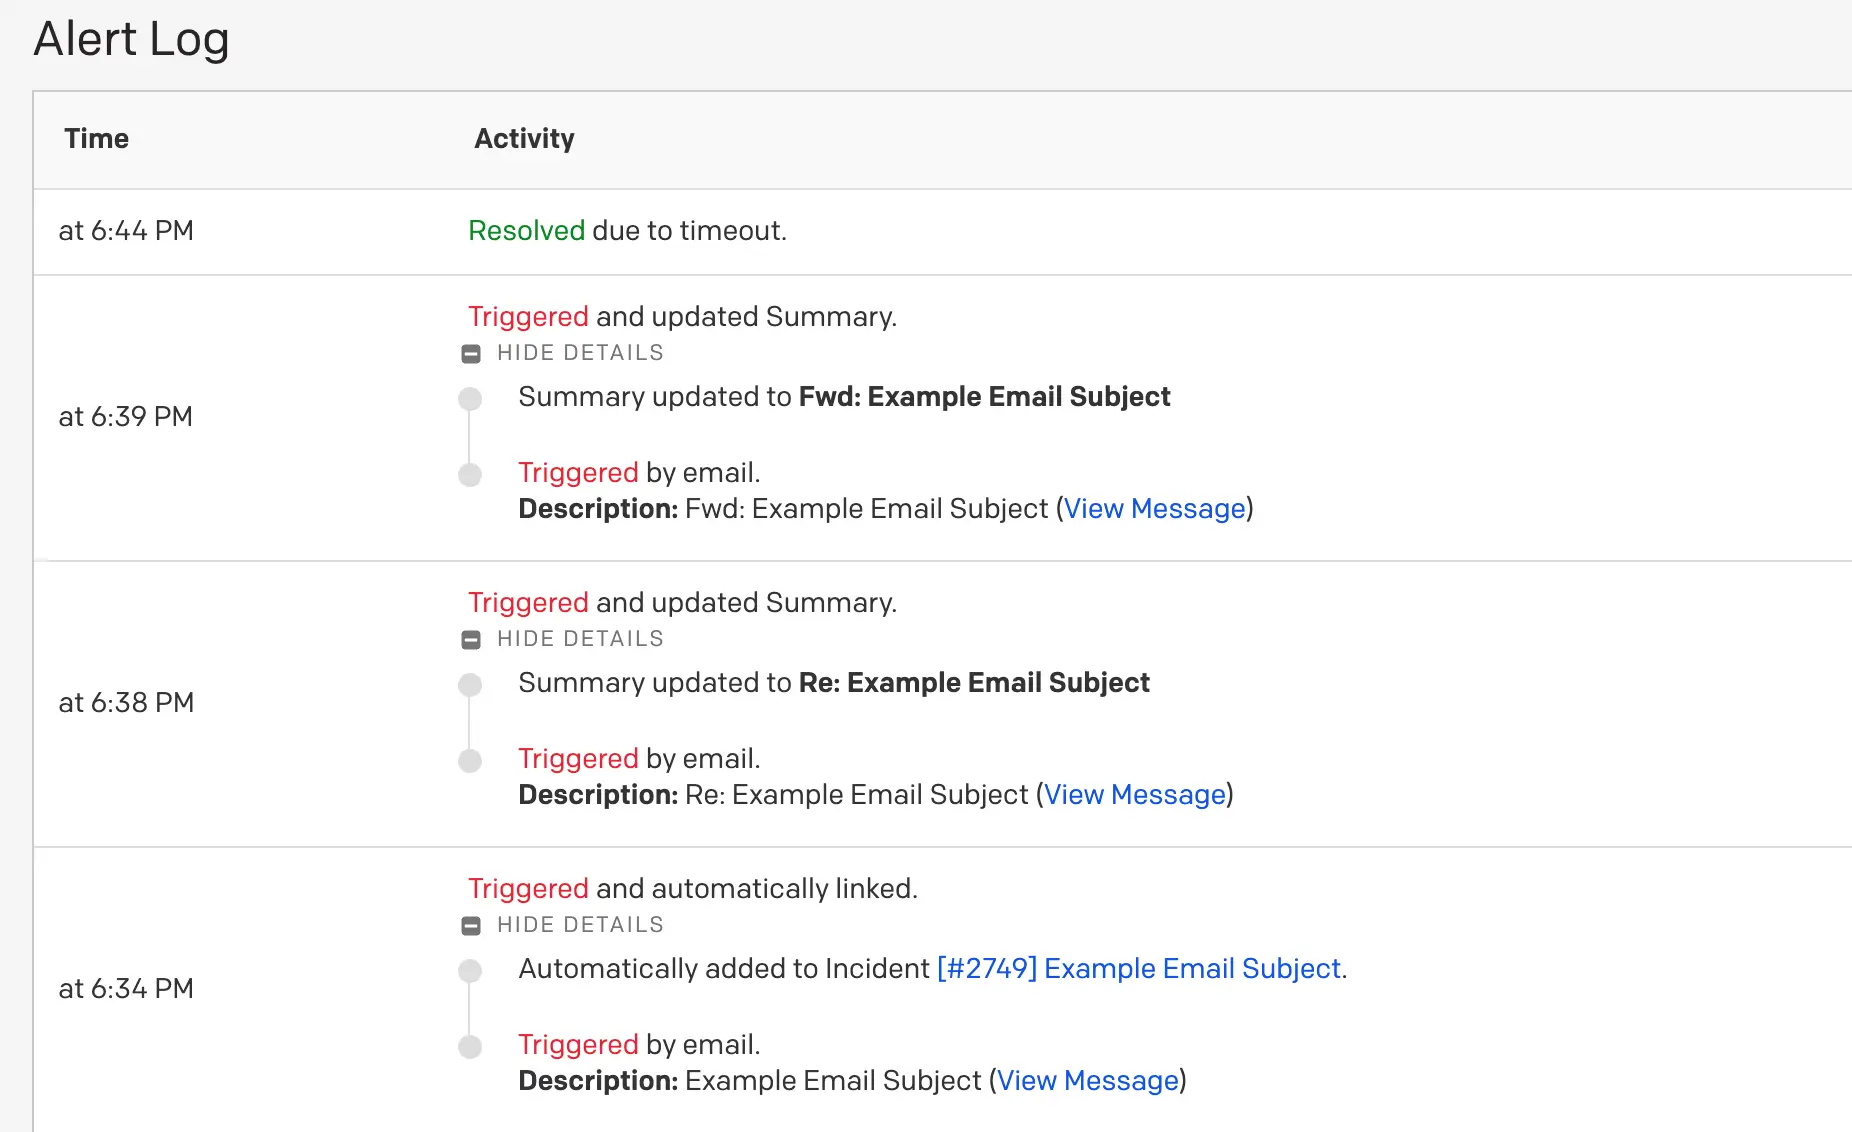 ## Trigger Emails are not Accepted > **Check for Deduplication:** If you are able to trigger some incidents but not others, check to see if the alerts created by your emails are being deduplicated into an existing alert within the **Alert Log**. > > You can view the Alert Log by navigating to an open incident on your service, scrolling down to the **Alerts** tab and clicking the **Summary** for the incident’s alert. Deduplicated alerts will appear as additional **Triggered** entries in the Alert Log. By default, PagerDuty email integrations accept any messages from any sender. If you are using [email filters](/integrations/email-integration-guide/email-management-filters-and-rules#email-filters), check to see if your configuration is discarding desired emails. PagerDuty evaluates email filters before management rules in order to reduce noise and ensure all emails come from a verified source. If you think the filters might be discarding desired emails, try setting them to **Accept all incoming email** and test again. Keep in mind that changes to your email filters will not affect events that were received before the changes were made. If you are using email filters, double-check your [regular expressions](/incident-management/services/regular-expressions) to ensure that desired emails are accepted. If emails are still not triggering incidents as you’d expect, check the integration’s email management rules. If you are using the **Open and resolve alerts based on custom rules** setting, check the [default behavior](/integrations/email-integration-guide/email-management-filters-and-rules#configure-default-behavior-if-no-rules-match); **Create a generic alert** should be selected. This is the default setting, but if another user changed it, for example, any unmatched emails will be discarded. ## Resolve Emails are not Resolving Incidents Three things are required to successfully resolve an incident: 1. A rule that [triggers](/integrations/email-integration-guide/email-management-filters-and-rules#create-a-trigger-rule) an incident in PagerDuty. 2. A rule that [resolves](/integrations/email-integration-guide/email-management-filters-and-rules#create-a-resolve-rule) an incident in PagerDuty. 3. A shared alert key that can be extracted from both emails. Verify that your rules are correct. PagerDuty will display the extracted alert key on an incident’s alert. Use this piece of information to verify that the key is the same in both the trigger and resolve emails. 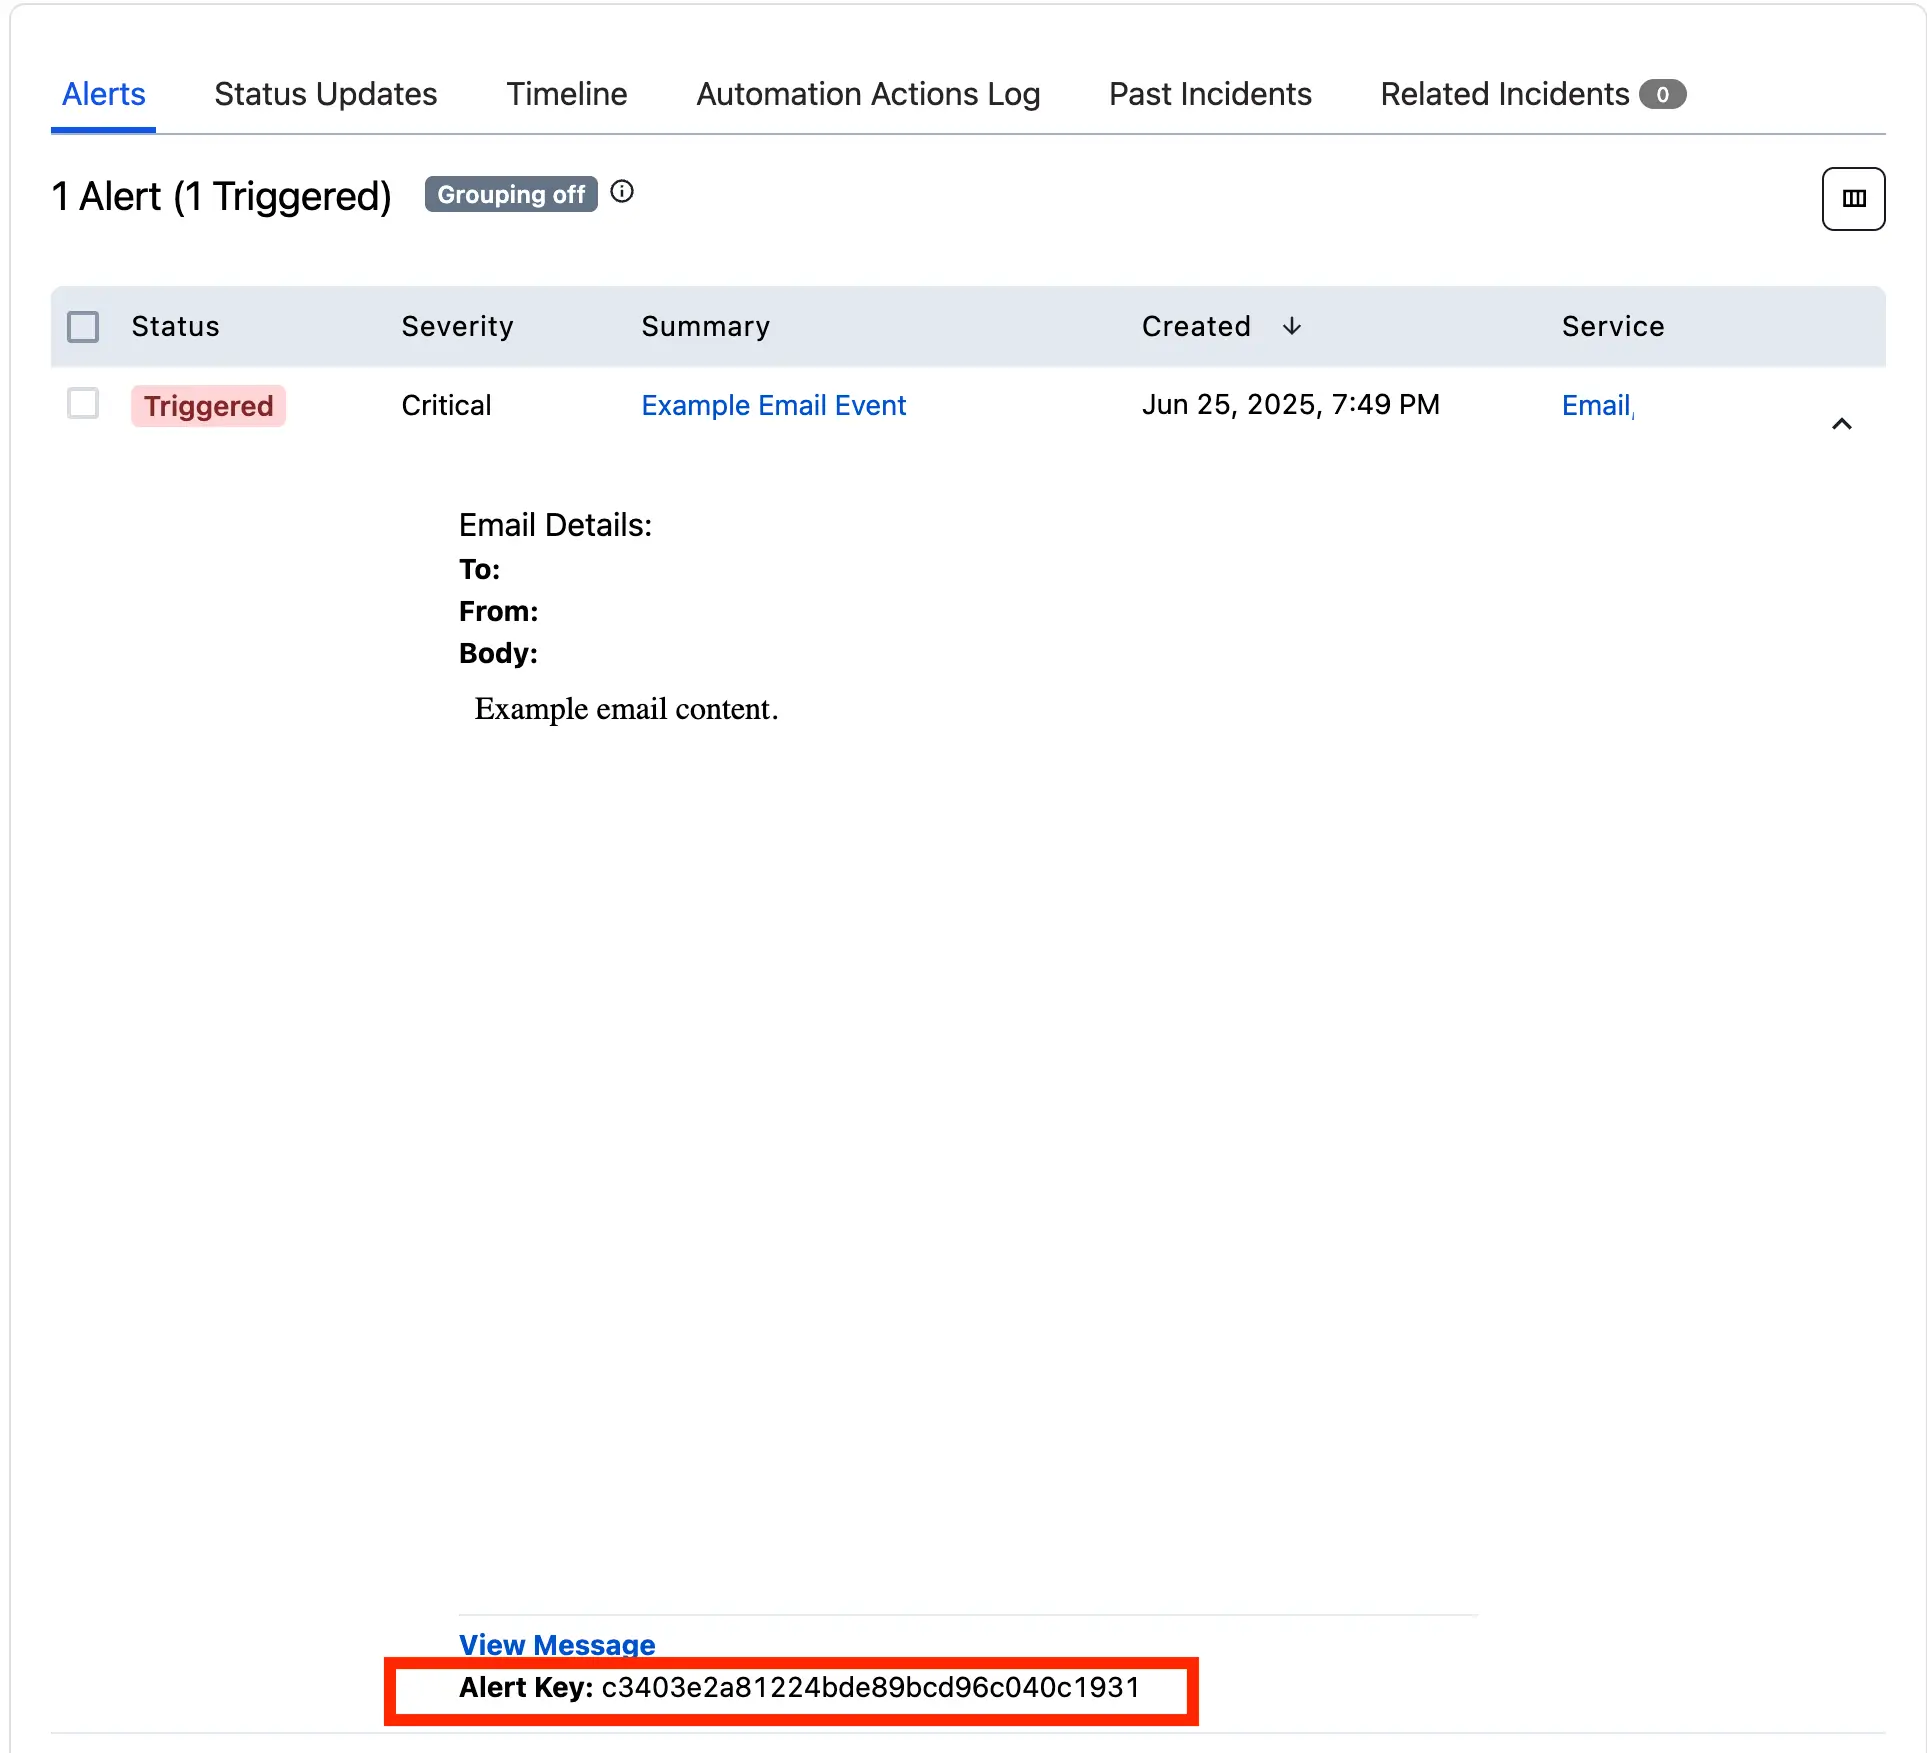 *Extracted alert key* Specific reasons a resolve email might not be successfully resolving: - There is an issue with a [regular expression extracting the incident/alert key](/incident-management/services/regular-expressions#extract-an-alert-key). - There is an issue with the email body’s encoding (for example, if it was UTF-8 encoded, but contained the byte `\xFF`). - There is a trailing space, for example, in either your [trigger rule](/integrations/email-integration-guide/email-management-filters-and-rules#create-a-trigger-rule) or [resolve rule](/integrations/email-integration-guide/email-management-filters-and-rules#create-a-resolve-rule), but not in both. This means that one email has an alert key with an additional space, and therefore will not match. ## Capture Group Error Message If you receive the following error, it means that you need to specify a capture group in your [regular expression](/incident-management/services/regular-expressions#capture-group): `Email handler email action rules value extractors matcher must have at least one capture group` Oftentimes, this can be resolved by enclosing your regular expression in parentheses. ## A Regular Expression is Not Matching the Email Body as Expected If a regular expression that should match the email body is not working for some reason, check to see whether emails are sent in both plain text and HTML, or plain text. If the emails are only sent in HTML, the HTML tags may be interfering with the regex’s pattern matching. If the email also includes a plain text version, then the rule will still be able to find a match. However, if the emails are being sent as HTML-only, note that the regular expression may not match because there are HTML tags and elements interspersed within the text content that makes up the searched-for pattern. It may help to view the raw email that was checked for a match in the email rules. > **View the Email Source Code:** Go to **View Message** in the incident detail view. This will take you to a page displaying the full details of the original event sent in. The URL should be formatted as follows: > > ``` https://{subdomain}.pagerduty.com/incidents/{incident_id}/log_entries/{log_entry_id} ``` > > Next, click **View Raw Message** to see the email’s source code, including headers. While viewing the source code, note that email management rules that operate on the body of the email use the raw body as input, after decoding (i.e., if the body’s `Content-Transfer-Encoding` is `base64`, it will be decoded from Base64, or if it's `quoted-printable`, then QP escape sequences will be replaced with the actual characters that represent the message’s underlying content). With this in mind, to view the true source of the email that the regular expressions are compared against, one must decode the text. ### Base64-encoded Text Base64-encoded messages will show the following information in their header: ``` Content-Transfer-Encoding: base64 ``` [Base64](https://en.wikipedia.org/wiki/Base64)-encoded messages are not humanly readable, but are easily decoded into plain text using readily available software. We recommend the `base64` command line program, which is found on many Linux-based and Unix-based systems, including macOS. > **Example of Base64-encoded text:** **Decoded** (Regex runs on this text): > > ``` All work and no play makes Jack a dull boy. All work and no play makes Jack a dull boy. The quick fox jumps over the lazy brown dog. ``` > > **Encoded** (Regex does not run on this text): > > ``` QWxsIHdvcmsgYW5kIG5vIHBsYXkgbWFrZXMgSmFjayBhIGR1bGwgYm95LiBBbGwgd29yayBhbmQg bm8gcGxheSBtYWtlcyBKYWNrIGEgZHVsbCBib3kuClRoZSBxdWljayBmb3gganVtcHMgb3ZlciB0 aGUgbGF6eSBicm93biBkb2cuCg= ``` > > Decoding with `base64`: > > ``` base64 -D < file-containing-base64-message.txt # or this: cat file-containing-base64-message.txt | base64 -D ``` ### Quoted-Printable Text Quoted-Printable messages will show the following information in their header: ``` Content-Transfer-Encoding: quoted-printable ``` Messages with [Quoted-Printable](https://en.wikipedia.org/wiki/Quoted-printable) encoding can be easier for humans to read, but a variety of tools are available for decoding them. When reading raw Quoted-Printable encoded text, please be aware of _escape sequences_ that constitute part of the encoding, or that are a representation of a character and not the literal character. Non-[ASCII](https://en.wikipedia.org/wiki/ASCII) characters will be represented as escape sequences, as will equals signs (`=`). Furthermore, lines are limited to 76 characters. If a line’s length needs to be limited, a line may be encoded as two or more lines with a line break and an equals sign at the end of every line except the last in the series. > **Example of Quoted-Printable encoding:** **Decoded** (Regex runs on this text): > > ``` All work and no play makes Jack a dull boy. All work and no play makes Jack a dull boy. The quick fox jumps over the lazy brown dog. E = mc^2 ``` > > **Encoded** (Regex does not run on this text): > > ``` All work and no play makes Jack a dull boy. All work and no play makes Jack= a dull boy. The quick fox jumps over the lazy brown dog. E =3D mc^2 ``` --- URL: https://docs.pagerduty.com/integrations/email-integration-guide/email-management-filters-and-rules # Email Management: Filters and Rules Use filters and create rules to customize how email integrations process events [Email integrations](/integrations/email-integration-guide) allow users to integrate PagerDuty with any service capable of sending email alerts. PagerDuty provides a number of features to assist with administering email integrations, which can be broken down into the two following broad categories: - [Email Filters](#email-filters) - [Email Management](#email-management) ## Email Filters Email filters allow you to determine which messages your email integration should accept. Only messages that meet your specified criteria will trigger an incident. The integration will discard any messages that do not pass the filter. ### Configure an Email Filter To set up an email filter, in the web app: 1. Go to **Services** → **Service Directory** and select the service with the desired email integration. 2. Select the **Integrations** tab → next to the email integration you want to edit → click **Edit Integration**. 3. In the section **Email Filters**, make a selection from the dropdown, depending on your needs: - **Accept all incoming email**: PagerDuty will not filter out any emails that are sent to your integration email address. - **Accept email only if it matches ONE OR MORE rules below**: Emails will only be accepted if they match at least one filter rule. - **Accept email only if it matches ALL of the rules below**: Emails will only be accepted if they match all filter rules. 4. Configure appropriate rules: - The dropdowns for **subject**, **body**, and **from** default to **is anything**. Next to your desired field, select the appropriate action (**matches the regex** or **does not match the regex**) and enter a [regular expression](/incident-management/services/regular-expressions). 5. _Optional:_ If required, click **Add New Rule** and repeat the previous step to add more filtering criteria. 6. Click **Save**. ### Delete an Email Filter 1. Go to **Services** → **Service Directory** and select the service with the desired email integration. 2. Select the **Integrations** tab, then next to the email integration you want to edit, then click **Edit Integration**. 3. Click in the top right of the email filter you’d like to delete. 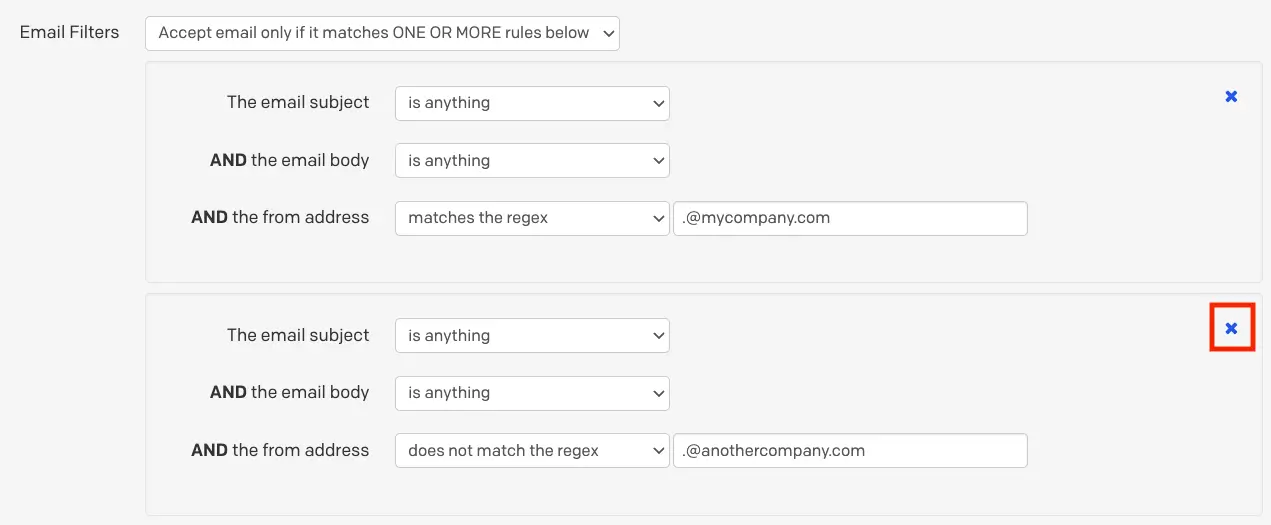 4. Click **Save changes**. ### Email Filter Example Below is an example of how to configure email filters based on an event’s critical/noncritical status. In this example, you have a system that sends emails with the subjects `CRITICAL` and `NONCRITICAL` to PagerDuty, but you only want those with `CRITICAL` in the subject line to trigger incidents. 1. In the web app, go to **Services** → **Service Directory** and select the **name** of the service with an email integration. 2. Select the **Integrations** tab → click to the right of the email integration you want to edit → click **Edit Integration**. 3. Under **Email Filters**, select **Accept email only if it matches ALL of the rules below**. 4. Add two filter rules: 1. For the first rule, enter **The email subject matches the regex** `CRITICAL`. 2. For the second rule, enter **The email subject does not match the regex** `NONCRITICAL`. 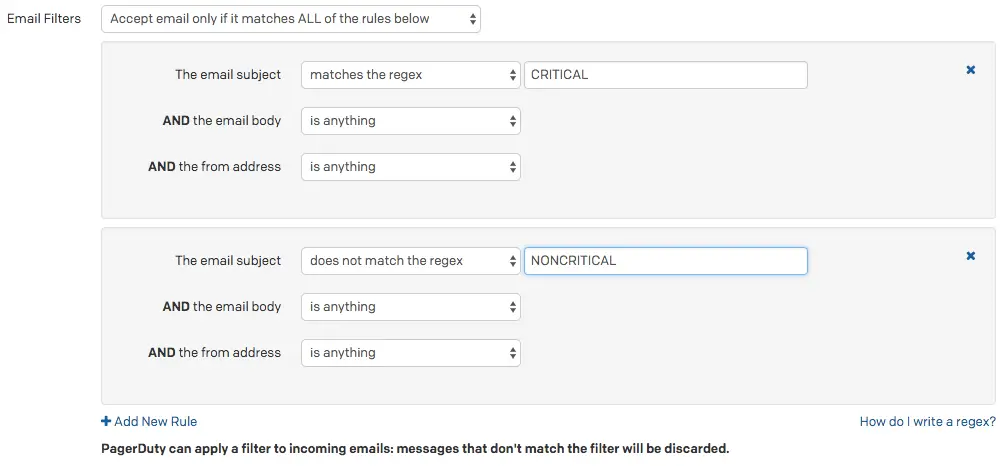 - The option **Accept email only if it matches ALL of the rules below** ensures that both rules must match with the incoming events. A second filter for `NONCRITICAL` is needed, since it contains the substring `CRITICAL`. In other words, the second rule prevents messages with the subject `NONCRITICAL` from triggering incidents, since it also matches the regex `CRITICAL`. Please also note that regex is [case sensitive](/incident-management/services/regular-expressions#case-sensitivity). 5. Click **Save changes**. ## Email Management By default, PagerDuty opens a new incident every time an email is received at the integration address of an email integration. Depending on how your monitoring tool works and your organization’s needs, this behavior might not be desirable. As a first step, we recommend configuring one or more [email filters](#email-filters) to ensure that your service only accepts valid email events. When your email filters determine that an event is valid, you can use email management rules to fine tune how the events behave. For example, the email management feature allows you to create custom rules that parse inbound messages and automatically resolve incidents. - [Configure When Incidents or Alerts Trigger](#configure-when-incidents-or-alerts-trigger) - [Trigger and Resolve Alerts/Incidents](#trigger-and-resolve-alertsincidents) ### Configure When Incidents or Alerts Trigger You can control when PagerDuty creates new incidents or alerts in response to emails by adjusting your email integration’s settings in the web app: 1. Navigate to **Services** → **Service Directory**. 2. Select the **name** of the service with the desired email integration → **Integrations** tab → to the right email integration → click **Edit Integration**. 3. In the section **Email Management**, select your desired setting: - **Open a new incident/alert for each new trigger email subject** (default): Emails with the same subject line will deduplicate. For example, if PagerDuty triggers an incident in response to an email with the subject `Host Down`, subsequent emails with the same subject will _not_ trigger a new incident. You will find the new email appended to the existing _alert's_ timeline. - **Open a new incident/alert for each trigger email**: Each email sent to the integration email address opens a new incident. - **Open a new incident/alert only if an open incident does not already exist**: The integration will only trigger one open incident at any time. If an email is received while the integration already has an open incident (regardless of its subject line), it is appended to the existing incident’s activity log. - **Open and resolve incidents/alerts based on custom rules**: This option is explored in-depth in the section [Trigger and Resolve Alerts/Incidents](#trigger-and-resolve-alertsincidents). 4. Click **Save**. ### Trigger and Resolve Alerts/Incidents Selecting the option **Open and resolve alerts/incidents based on custom rules** allows you to configure rules that determine when an incident should trigger and resolve, based on the message’s content. There are two components to configure, and both are accessed in the web app by navigating to **Services** → **Service Directory** → select the **name** of your desired service → **Integrations** tab → click next to the desired email integration → click **Edit Integration**: - [Create a Trigger Rule](#create-a-trigger-rule) - [Create a Resolve Rule](#create-a-resolve-rule) #### Create a Trigger Rule 1. From the dropdown, select **trigger**. 2. Select **Any (default)** or **All** depending on whether you’d like to trigger an incident when any or all following conditions match.  3. **Determine the matching condition:** - Select from the dropdown whether you’d like to match on the email **from address**, **subject** or **body**. - Select from the following matching options: - **contains** - **does not contain** - **matches the regular expression** - **does not match the regular expression** - **exactly matches** - **is anything except** - Enter your desired matching criteria 4. _Optional:_ If you’d like to configure more than one trigger condition, click **New Condition** and repeat step 3. 5. **Configure an incident/alert key:** It is important that this information matches in the corresponding [resolve rule](#create-a-resolve-rule). - In the section **Alert/Incident Key**, select **subject** or **body** from the dropdown. - Select from the following matching options: - **all text between** - **this regular expression** - **everything** - **all text after** - **all text before** > **Use Regex to Extract an Incident/Alert Key:** If you plan to use a regular expression to generate the unique key for an incident/alert, please refer to the section [Extract an Alert Key](/incident-management/services/regular-expressions#extract-an-alert-key) for more information. 6. _Optional:_ **Configure Custom Fields**. This feature can be helpful if your trigger emails contain information that you’d like to be included in incident details. - Enter a **Name** for the field. - **Configure the Value:** - Select **subject** or **body** from the dropdown. - Select from the following matching options: - **all text between** - **this regular expression** - **everything** - **all text after** - **all text before** - You may add more custom fields by clicking **New custom field** and repeating the steps above. 7. Click **Save changes**. #### Create a Resolve Rule A resolve rule is required if you’d like incidents to automatically resolve when PagerDuty receives a valid email event. > **Auto-Resolve Using an Alert/Incident Key:** For a pair of email management [trigger](#create-a-trigger-rule) and resolve rules to work together, the alert/incident key in both rules _must be a perfect match_. The alert/incident key is what allows your service to pair events and apply resolve rules to open incidents. 1. Select **Add Another Rule** at the bottom of the page.  2. Configure the resolve rule similarly to the [trigger rule](#create-a-trigger-rule), however you will select **resolve** from the dropdown, and configure the condition(s) that should resolve incidents/alerts. The information for **Incident/Alert Key** should _exactly_ match the corresponding trigger rule.  > **No Matching Open Incident:** If an email matches your "resolve" rule but there is no open incident for that email to resolve _OR_ the email's incident key does not match an existing open incident, then this rule will not be applied. #### Create Multiple Rules In some cases, you may want to create more than one trigger and/or resolve rules. To do this, click **Add Another Rule**. When you create multiple email management rules, PagerDuty will attempt to apply the first rule to the incoming email. If it does not match it will attempt to apply the second rule, and so on. The hierarchy continues in this order until it reaches your last rule. There is a limit of ten rules per service. You can change the order rules are applied in by clicking **Move up** and **Move down** buttons on each rule.  #### Configure Default Behavior If No Rules Match If an email does not match any email management rules, you can configure whether you’d like to create a generic alert or discard the email. Select your preference from the dropdown: - **create a generic alert** - Generic alerts will use the email’s subject line as the name of the incident. **Note**: Email events, which _do not_ match management rules, but _do_ have matching subject lines, will deduplicate into the same alert. - **discard it**  ### Delete an Email Management Rule 1. Go to **Services** → **Service Directory** and select the service with the desired email integration. 2. Select the **Integrations** tab, then next to the email integration you want to edit, then click **Edit Integration**. 3. Click in the top right of the email management rule you’d like to delete.  4. Click **Save changes**. ### Email Management Example In this example, you want to trigger an incident when PagerDuty receives an email (from a monitoring system, for example) that contains `DOWN` in the subject line. The body of email is always formatted such that a numeric string representing the host follows “Host: “, which can be used as the incident/alert key. We can use a [regular expression] to for this: `Host: (\d+)`. 1. [Create a trigger rule](#create-a-trigger-rule) that captures the scenario outlined above.  2. [Create a resolve rule](#create-a-resolve-rule)  With the email management rules in place, when PagerDuty receives an appropriate email that meets your trigger rule’s conditions, an incident will trigger. 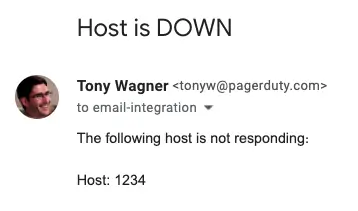 Similarly, when the email integration receives an appropriate resolve message, the incident will automatically resolve 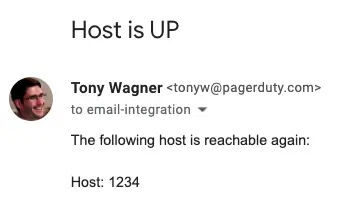 ## Troubleshoot Email Management Rules Please refer to our [Email Integration Troubleshooting Guide](/integrations/email-integration-guide/email-integration-troubleshooting-guide) for helpful tips and solutions if your integration is not functioning as expected. ## Regular Expressions Please see our [Regular Expressions](/incident-management/services/regular-expressions) article for more information. --- URL: https://docs.pagerduty.com/integrations/event-enrichment # Event Enrichment Automatically add contextual data to PagerDuty events before they reach Event Orchestration > **Early Access:** This feature is currently in Early Access (EA). Click [here](https://www.pagerduty.com/early-access/) if you would like to sign up for our Early Access program. ## How Event Enrichment Works Event Enrichment automatically adds contextual data to your PagerDuty events before they reach Event Orchestration, helping you route alerts more effectively and provide responders with the information they need. Accounts can have one Default Event Enrichment that automatically applies to all Services and Event Orchestrations. You can exclude specific Services or Event Orchestrations from the Default if they don't need those rules. Teams can also create custom Event Enrichments for their specific needs and associate them with relevant Services and Event Orchestrations. > **Important:** Each Service or Event Orchestration can only have one Event Enrichment associated with it. ### For Event Orchestrations When an event is ingested via an Event Orchestration global integration key: 1. **Event Enrichment runs first**: - If a custom Event Enrichment is associated → Apply those rules - Otherwise, if a Default Event Enrichment exists → Apply Default rule 2. **Global Orchestration Rules are applied (if configured)** 3. **Service Routing Rules** determine which Service receives the event 4. **Service-level Event Enrichment runs**: - If the Service has a custom Event Enrichment → Apply those rules - Otherwise, if a Default Event Enrichment exists → Apply Default rule 5. **Service Orchestration Rules** are applied (if configured) ### For Services (Direct Integration) When an event is ingested directly via a Service integration key: 1. **Service-level Event Enrichment runs**: - If the Service has a custom Event Enrichment → Apply those rules - Otherwise, if a Default Event Enrichment exists → Apply Default rule 2. **Service Orchestration Rules are applied (if configured)** ## Create an Event Enrichment 1. Navigate to **AIOps** → **Event Enrichments**. 2. Click **New Event Enrichment**. 3. Enter a name, assign an Owning Team, and optionally add a Description. 4. Click **Save**. Navigate to the kabob menu to edit or set as a Default Event Enrichment. ## Associate with Services and Event Orchestrations 1. In the Event Enrichment rule canvas, click the **Associate** button. 2. Choose which Services and Event Orchestrations to associate with the Event Enrichment. - **For Default Event Enrichments**: Select the Services and Event Orchestrations you want to exclude (they will not use the Default enrichment). ## Add Enrichment Rules ### Step 1: Define Conditions 1. Click **+ New Rule** in the canvas (Default node). 2. Select a condition type from the dropdown. 3. Add your conditions (e.g., `event.summary contains CMDB`). - Use **+ And** to combine multiple conditions. - Or **Switch to code editor** to write complex logic using PCL. ### Step 2: Choose Action Type Click **Next**, then choose one of two action types: #### Option A: Enrich Events (Add CDP data) Use this to join data from your CDP tables into the event. 1. **Join data from**: Select the CDP table to pull data from. 2. **Match on**: Choose which event field should match the query field in the CDP table. 3. **Write to**: Specify the `event.custom_details.*` field where enriched data will be added. #### Option B: Transform Events (Extract or modify data) Use this to extract values or compose new fields. **Extract**: - Select the field to extract data from. - Provide a regex pattern to extract values. - Specify the event field to write the extracted data to. **Transform**: - Compose a new value using existing event fields and static text. - Specify the event field to write the composed value to. ## Upload and Manage Enrichment Data To learn more about uploading data to the enrichment service, verifying data, and troubleshooting, see the [Upload and Manage Enrichment Data documentation](/integrations/upload-and-manage-enrichment-data). ### Nested Rules For complex rule structures using **Connect Mode**, see the [Recombining Rules documentation](/ai-automation/aiops/event-orchestration/recombining-rules). ## Troubleshooting **Rule not working** - Verify the rule condition matched the incoming event. **Join not adding data** - Confirm the CDP table exists. - Ensure the join key and value match exactly (case-sensitive, watch for extra whitespace). **Extract not working** - Validate your regex pattern against the actual source field. PagerDuty uses RE2 regex syntax. **Data missing or wrong** - Check if downstream Orchestration rules are overwriting fields ("last rule wins"). --- URL: https://docs.pagerduty.com/integrations/extensions # Extensions Extend PagerDuty's capabilities with third-party tools Service extensions allow you to connect PagerDuty to third-party tools such as Slack, Microsoft Teams, and Jira Cloud. These tools extend capabilities and streamline incident response and communication. Based on your user permissions, there are two places to manage service extensions: - [Service Details Page](#manage-extensions-on-the-service-details-page) - [Extensions Page](#manage-extensions-on-the-extensions-page) > **Extensions With Dedicated Pages:** Some extensions have dedicated pages and the information in the following sections does not apply, for example [Slack](/integrations/slack-integration-guide), [Microsoft Teams](/integrations/microsoft-teams), and [Jira Cloud](/integrations/jira-cloud). Refer to a product's integration guide if the information in this guide is not applicable. ## Manage Extensions on the Service Details Page > **Required User Permissions:** You can manage extensions on both the **Extensions** page and the service details page if you have one of the following roles: > > - Manager [team](/account-admin/teams) role > - **Note**: If you have a Manager team role and a lower-level base role (for example, Responder, Observer, or Restricted Access), you can **only** manage extensions from the service details page. > - Admin or Global Admin > - Account Owner > > If you are not sure what role you have, or if you need your permissions adjusted, view [Check Your User Role](/account-admin/user-roles#check-your-user-role) or [Edit User Roles](/account-admin/manage-users#edit-user-roles). ### View Extensions 1. Navigate to **Services** → **Service Directory** and click the **name** of your desired service. 2. Select the **Integrations** tab and scroll to the **Extensions and Add-ons** section. ### Create Extensions 1. Navigate to **Services** → **Service Directory** and click the **name** of your desired service. 2. Select the **Integrations** tab, scroll to the **No extensions or add-ons found on this service** section, and click **Add an Extension**. - **Note**: If an extension already exists on the service, click **Add or manage extensions**. 3. Complete the following fields on the extension configuration screen: | Field | Value | | :----------------- | :----------------------------------------------------------- | | **Extension Type** | Select your preferred extension type from the dropdown list. | | **Name** | Enter a descriptive name for the extension. | | **Details** | Enter the required details for the configuration. |  *Enter extension details* 4. Click **Save**. ### Edit Extensions 1. Navigate to **Services** → **Service Directory** and click the **name** of your desired service. 2. Select the **Integrations** tab, scroll to the **Extensions and Add-ons** section, and click **Add or manage extensions**. 3. To the right of your desired extension, click **** → **Edit**. 4. Make the required changes and click **Save**. ### Delete Extensions 1. Navigate to **Services** → **Service Directory** and click the **name** of your desired service. 2. Select the **Integrations** tab, scroll to the **Extensions and Add-ons** section, and click **Add or manage extensions**. 3. To the right of your desired extension, click **** → **Remove**. 4. In the confirmation modal, click **Delete**. - **Note**: This action is permanent and cannot be undone. ## Manage Extensions on the Extensions Page The **Extensions** page allows you to view and manage all service extensions, persistent [conference bridges](/incident-management/incidents/conference-bridge), and [add-ons](/integrations/add-ons). > **Required User Permissions:** You can manage extensions on the **Extensions** page if you have an Account Owner, Admin, Global Admin, or Manager role. > > If you are not sure what role you have, or if you need your permissions adjusted, view [Check Your User Role](/account-admin/user-roles#check-your-user-role) or [Edit User Roles](/account-admin/manage-users#edit-user-roles). ### View Extensions 1. Navigate to **Integrations** → **Extensions**. 2. Select the **Service Extensions** tab to view extensions across your account. 3. Select one of the following tabs to filter extensions: - **Account Level**: Displays extensions available at the account level. - **Service Level**: Displays extensions specific to individual services. If you do not see the expected number of extensions, adjust the **Per Page** dropdown or select the next page to view more results.  *View more extensions* ### Add Extensions 1. Navigate to **Integrations** → **Extensions**. 2. Ensure the **Service Extensions** tab is selected and click **New Extension**. 3. Select an extension from the list. If you choose an extension from the **Service Level** category, complete the following fields: | Field | Value | | :----------- | :-------------------------------------------------------- | | **Name** | Enter a descriptive name for the service level extension. | | **Services** | Select the services to connect to the extension. | | **URL** | Enter the destination URL for the extension. | - **Note**: For **Account Level** extensions, click **Continue to Configuration** to set up your extension directly on the extension page. 4. Click **Add**. 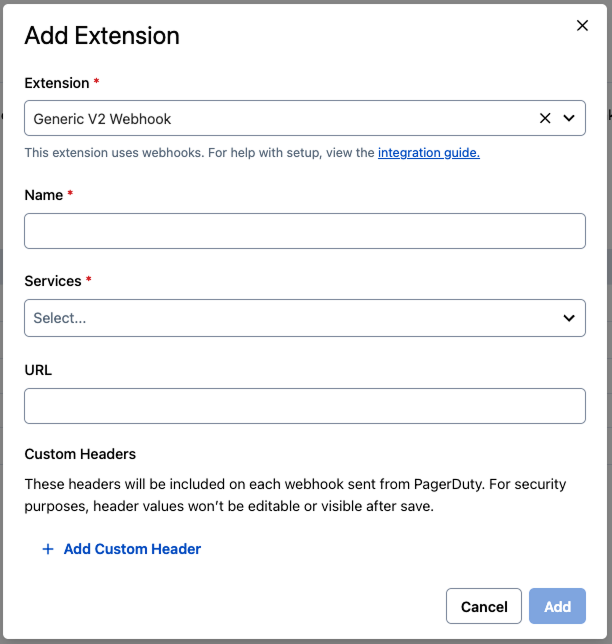 *Add service level extension* ### Update Extensions 1. Navigate to **Integrations** → **Extensions**. 2. Complete one of the following actions depending on the extension level: - For **Service Level** extensions: Click **Edit**, make the required changes, and click **Save**. - For **Account Level** extensions: Click the link under the **Details** column to navigate to the dedicated extension page. ### Delete Extensions 1. Navigate to **Integrations** → **Extensions**. 2. Complete one of the following actions depending on the extension level: - For **Service Level** extensions: Click **Remove** and click **Delete** to confirm. - **Note**: This action is permanent and cannot be undone.  *Delete extension* - For **Account Level** extensions: Click the link under the **Details** column to navigate to the dedicated extension page for more information on how to delete the extension. > **Deleting Account Level Extensions:** Some account level extensions, such as Slack or Microsoft Teams, cannot be deleted. When you navigate to these extension pages, the delete option is not available.
--- URL: https://docs.pagerduty.com/integrations/github-changes # GitHub Changes Integration Guide | PagerDuty Send GitHub pull request and commit events to PagerDuty as Recent Changes, giving responders context during incident triage. ## GitHub Changes + PagerDuty Benefits - Send notification-free events from GitHub or GitHub Enterprise to PagerDuty services regarding important changes, such as new pull requests and commits, to provide context for PagerDuty users. - Users may review change events within a PagerDuty service’s Recent Activity timeline during incident triage or hypercare. They can also see recent changes on the service’s incidents, and navigate across all changes in a comprehensive list of Recent Changes across all services. ## Requirements > **AIOps / Signal Intelligence Feature:** This feature is included with the [PagerDuty AIOps](/ai-automation/aiops/overview) add-on, or included as Signal Intelligence in PD Reliability Platform plans. To sign up for a trial of PagerDuty AIOps features, read [PagerDuty AIOps Trials](/ai-automation/aiops/overview#pagerduty-aiops-trials). > **AIOps Service Configuration:** Your service configuration must have AIOps enabled to use this feature. See [Configurable Service Settings](/incident-management/services/configurable-service-settings#manage-aiops) for more information and enablement steps. - **In PagerDuty**: This integration requires a [Manager base role](/account-admin/advanced-permissions#base-roles) or higher to configure. - **In GitHub**: This integration requires an Admin role to configure. ## How it Works - When a GitHub pull request is closed and the branch is merged, a webhook will be sent to the endpoint of the integrated PagerDuty service. - These events will be viewable as [Recent Changes](/ai-automation/aiops/recent-changes) in the service’s Recent Changes timeline on incidents associated with that service, and in a global list of all change events. ## Integration Walkthrough ### In PagerDuty 1. In the PagerDuty web application, navigate to **Services** → **Service Directory** and click the **name** of your preferred service. 2. Select the **Integrations** tab and click **Add an integration**. 3. Search and select **GitHub**, then click **Add**.  4. On the next screen, find **GitHub** in the list of integrations and click to reveal the integration details.  *Integration details* 5. In the section **Integration URL**, click to copy the integration URL to your clipboard. It will be in the following format: `https://events.pagerduty.com/integration/xxxxxxxxxxxxxxxxxxxxxxxxxxxxxxxx/change/enqueue`. - Keep the URL in a safe place, since you will use it in the [next section](#in-github). > **Branch Tracking:** By default, the integration tracks the `main`/`master` branch. To edit this behavior, please refer to the section [Branch Tracking](#branch-tracking) ### In GitHub 6. Navigate to the GitHub repository where you would like to track changes, select the **Settings** tab, and then select **Webhooks**. 7. Click **Add webhook** on the right. 8. Paste the **Integration URL** that you generated in PagerDuty ([above](#in-pagerduty)) into the **Payload URL** field, and in the **Content type** dropdown select **application/x-www-form-urlencoded**. 9. Under **Which events would you like to trigger this webhook?** select **Let me select individual events**. Check the box next to **Pull requests** and uncheck the box next to **Pushes**. 10. Ensure that the **Active** checkbox is selected, enter any other preferred settings, and click **Add/Update webhook**. > **Push Events:** This integration also supports push events, but they will show less information in PagerDuty. The pull request event is recommended if you use GitHub's pull request functionality. Since selecting both pull request and push events may result in two change events for a single action, we recommend selecting just one or the other. ## Using the Integration To test the integration, merge a pull request to the branch that you are tracking. If needed, you can temporarily change the branch you are tracking from `master` / `main` to another test branch using the [Branch Tracking](#branch-tracking) instructions below. In your PagerDuty account, navigate to the integrated service, click its **title** and you will see a change event in the **Recent Changes** table.  *Recent changes* ### Branch Tracking By default, the integration tracks the `main`/`master` branch. If you would like to track a different branch, or track multiple branches: 1. Navigate to the service with the **GitHub** integration → select the **Integrations** tab → click to the right of your **GitHub** integration.  *Edit integration* 2. Click **Edit Integration** on the right and enter the name of your preferred branch in the **branch** field. To track multiple branches, add a space between each branch’s name, for example: `feature-branch-1 feature-branch-2 feature-branch-3`. 3. Click **Save changes**. ### GitHub Actions The GitHub Changes integration supports creating change events with [GitHub Actions](https://github.com/features/actions). To use this feature, follow the [Integration Walkthrough](#integration-walkthrough) above to complete configuration, and use the **Integration Key** with the [PagerDuty Change Events GitHub Action](https://github.com/marketplace/actions/pagerduty-change-events). ## FAQ **Is it possible to modify change events using Event Orchestration?** Not at this time, but we are interested to learn about what you would like to accomplish, please [contact our Support team](https://www.pagerduty.com/contact-us/#contact-support) with your use cases and feedback. **Is it possible to send change events from multiple GitHub branches?** Yes, you can add any number of integrations to a single technical service in PagerDuty, including multiple GitHub integrations. **Are change events viewable in Slack or the PagerDuty mobile app?** Not at this time, but we would like to hear your feedback. Please [contact our Support team](https://www.pagerduty.com/contact-us/#contact-support). **Does the integration accept events other than push or pull request events?** The integration only accepts push (`push`) and pull request (`pull_request`) events. The integration will not accept other event types, such as `ping` or `issues`. --- URL: https://docs.pagerduty.com/integrations/gitlab-changes # GitLab Changes Integration Guide | PagerDuty Configure the GitLab integration ## GitLab + PagerDuty Benefits - Send merge request events from GitLab to PagerDuty services to provide context for anyone using PagerDuty. - Responders may review change events within the Recent Activity timeline of a PagerDuty service during incident triage or hypercare. They can also see recent changes on the incidents of the service and review all changes in a comprehensive list of recent changes across all services. ## Requirements > **AIOps / Signal Intelligence Feature:** This feature is included with the [PagerDuty AIOps](/ai-automation/aiops/overview) add-on, or included as Signal Intelligence in PD Reliability Platform plans. To sign up for a trial of PagerDuty AIOps features, read [PagerDuty AIOps Trials](/ai-automation/aiops/overview#pagerduty-aiops-trials). > **AIOps Service Configuration:** Your service configuration must have AIOps enabled to use this feature. See [Configurable Service Settings](/incident-management/services/configurable-service-settings#manage-aiops) for more information and enablement steps. **In PagerDuty**: This integration requires a [Manager base role](/account-admin/advanced-permissions#base-roles) or higher to configure. **In GitLab**: This integration requires a Maintainer, Admin, or Owner role to configure. ## How It Works - When a `merge_request` event occurs within a GitLab repository, a webhook is sent to the endpoint of the integrated PagerDuty service. - These events are viewable as [change events](/ai-automation/aiops/recent-changes) in the Recent Activity timeline of the service, on incidents associated with that service, and in a global list of all changes. They do not generate alerts, incidents, or notifications. > **Change Events:** For more information about how PagerDuty surfaces change events on services, incidents, and in the [Service Directory](/incident-management/services/service-directory), see [change events](/ai-automation/aiops/recent-changes). ## Integration Walkthrough ### In PagerDuty > **Tip:** Mapping your GitLab events to the PagerDuty service that represents what you are changing allows responders to quickly identify recent changes on their service when they receive a notification for an incident. 1. In your PagerDuty account, navigate to **Services** → **Service Directory** and click the **name** of your preferred service. 2. Select the **Integrations** tab and click **Add an integration**. 3. Search for and select **GitLab** and click **Add**.  *Select GitLab* 4. In the list of integrations, click **** to the right of the GitLab integration.  *Integration details* 5. In the **Integration URL** section, click **** to copy the integration URL to your clipboard. It is in the following format: `https://events.pagerduty.com/integration/xxxxxxxxxxxxxxxxxxxxxxxxxxxxxxxx/change/enqueue`. Save this URL in a safe place for use in the [following section](#in-gitlab). #### Branch Tracking By default, the integration tracks changes on your `main`/`master` branch. If you would like to change which branch is tracked, or track multiple branches, you can do this in the PagerDuty web app. If you do not wish to change which branch is tracked, skip ahead to the following section [In GitLab](#in-gitlab). 1. In your PagerDuty account, navigate to **Services** → **Service Directory** and click the **name** of the service with your GitLab integration. 2. Select the **Integrations** tab and click **** to the right of the GitLab integration.  *Integration settings* 3. On the right-hand side, click **Edit Integration**. 4. In the **branch** field, enter the name of the branch you would like to track. **Note**: If you would like to track multiple branches, add a space between the name of each branch, for example: `feature-branch-1 feature-branch-2 feature-branch-3`. 5. Click **Save changes**. ### In GitLab 1. In your GitLab account, navigate to the project where you would like to track changes. In the left-side menu, select **Settings** → **Webhooks**. 2. Paste the integration URL you generated in PagerDuty (in the previous section) into the **URL** field. 3. Under the **Trigger** header, deselect **Push events** and select **Merge request events**. 4. Click **Add webhook**. ## Using the Integration After you have [added a webhook to your GitLab project](#in-gitlab), you can test the integration by creating a [merge request](https://docs.gitlab.com/ee/user/project/merge_requests/) in the project. In the PagerDuty web app, navigate to the integrated service, click its **title**, and you see an entry in the **Recent Changes** section:  *Example change event* ## FAQ **Is it possible to modify change events using Event Orchestration?** Not at this time, but we are interested to learn about what you would like to accomplish. [Contact our Support team](https://www.pagerduty.com/contact-us/#contact-support) with your use case and feedback. **Is it possible to send change events from multiple GitLab branches?** Yes, you can add any number of integrations to a single service, including multiple GitLab integrations. See the section [Branch Tracking](#branch-tracking) for information about customizing which branch an integration is associated with. **Are change events viewable in Slack or the mobile app?** Not at this time, but we would like to hear your feedback. [Contact our Support team](https://www.pagerduty.com/contact-us/) with your feedback. --- URL: https://docs.pagerduty.com/integrations/google-workspace-integration-guide # Google Workspace Integration Guide Configure the Google Workspace integration. ## Google Workspace Integration Capabilities * Connect your PagerDuty account with your Google Workspace account. * Allow incident workflows to create on-demand Google Meet meetings and attach them to incidents. > **Availability:** This integration is available on current Business, Enterprise for Incident Management, and Digital Operations (Legacy) plans. Contact the [Sales Team](https://www.pagerduty.com/contact-sales/) to upgrade your account to include this integration. > **Limited Use Policy:** The use of raw or derived data received from Workspace APIs adheres to the [Google User Data Policy](https://developers.google.com/terms/api-services-user-data-policy), including the Limited Use requirements. ## Requirements | Application | Requirement | | :--- | :--- | | **PagerDuty** | You must have the Admin, Global Admin, or Account Owner role to configure the integration. | | **Google** | You must have administrator permissions to configure the integration. | ## How It Works 1. When you connect your PagerDuty account with your Google Workspace account, PagerDuty authenticates with Google via [OAuth 2.0](https://developers.google.com/identity/protocols/oauth2) and establishes a secure connection. 2. When an incident configured with the [Google Meet: Add a Conference Bridge](/workflow-actions/google-meet/google-meet-add-a-conference-bridge-to-an-incident) incident workflow integration triggers, PagerDuty automatically generates an incident-specific meeting ID and adds it to the incident. 3. Responders join the Google Meet conference bridge directly from the incident in the web app or mobile app, from conference-bridge notifications, or via [One Touch to Join](/incident-management/incidents/conference-bridge#one-touch-to-join-conference-bridge). ## Configure the Integration 1. In the PagerDuty web app, navigate to **Integrations** → **Extensions** → **Google**. 2. On the **Google Workspace** page, click **Connect a new Workspace**. 3. On the Google authorization screen, select a Google account. 4. Click **Continue** to allow signing into your account, and click **Allow** to confirm the Google account integration with PagerDuty. After successful integration, you see a confirmation message in the web app and the PagerDuty account connects.  *Google workspace integration* ## Reauthorize the Google Integration To reauthorize the Google integration: 1. In the PagerDuty web app, navigate to **Integrations** → **Extensions** → **Google**. 2. Click **...** and click **Reauthorize** to refresh your Google account integration with PagerDuty and accept required scopes again. ## Remove the Google Integration To remove the Google integration: 1. In the PagerDuty web app, navigate to **Integrations** → **Extensions** → **Google**. 2. Click **...** and click **Disconnect** to disconnect your Google account integration with PagerDuty. ## FAQ **Who can set up the Google Workspace integration?** You must have the Admin, Global Admin, or Account Owner role to configure the integration. **Can I leverage this integration to create a Google Meet conference via incident workflows?** Yes, you can follow the [Incident Workflows guide](/ai-automation/automation/incident-workflows#create-an-incident-workflow-from-scratch) and select [Google Meet: Add a Conference Bridge to an Incident](/workflow-actions/google-meet/google-meet-add-a-conference-bridge-to-an-incident). After publishing, you can add a Google Meet conference via the incident workflow to any incident. **Who can create a Google Meet conference bridge?** You can create a meeting after integrating PagerDuty with Google Workspace. **Where can I join the Google Meet conference from?** You can join the Google Meet conference bridge directly from the incident details page in the web app or mobile app, from conference-bridge notifications in Slack or Microsoft Teams, or via [One Touch to Join](/incident-management/incidents/conference-bridge#one-touch-to-join-conference-bridge). **Can I link multiple Google accounts to the same PagerDuty account?** Yes, you can connect multiple Google accounts with your PagerDuty account. **Can I leverage this integration for Scribe Agent auto-join?** Yes. A valid meeting Scribe Agent can join a Google Meet conference. You can add the Scribe Agent to your conference bridges automatically by following the instructions in [Add PagerDuty AI Scribe Agent](/workflow-actions/pagerduty-advance/add-pagerduty-advance-scribe-agent). --- URL: https://docs.pagerduty.com/integrations/jenkins-changes # Jenkins Changes Integration Guide | PagerDuty Configure the Jenkins Changes | PagerDuty integration ## Jenkins Changes + PagerDuty Benefits - Create PagerDuty [change events](/ai-automation/aiops/recent-changes) from Jenkins post-build events. ## Requirements > **AIOps / Signal Intelligence Feature:** This feature is included with the [PagerDuty AIOps](/ai-automation/aiops/overview) add-on, or included as Signal Intelligence in PD Reliability Platform plans. To sign up for a trial of PagerDuty AIOps features, read [PagerDuty AIOps Trials](/ai-automation/aiops/overview#pagerduty-aiops-trials). - **In PagerDuty**: This integration requires a Manager base role or higher to configure. - **In Jenkins**: This integration requires administrator permissions to [install the Jenkins PagerDuty plugin](https://www.jenkins.io/doc/book/managing/plugins/). ## How it Works - Jenkins build events will be sent to PagerDuty, creating change events on integrated services. ## Integration Walkthrough ### Install the Jenkins Plugin 1. Install the [Jenkins PagerDuty plugin](https://plugins.jenkins.io/pagerduty/). ### In PagerDuty 2. Navigate to **Services** → **Service Directory** and click the **name** of the service that you would like to add the integration to. 3. Select the **Integrations** tab and click **Add an integration**. 4. Search for and select **Jenkins CI**, and click **Add**. 5. From the list of integrations, click to the right of **Jenkins CI**.  6. In the field **Integration Key**, click to copy the integration key to your clipboard. Keep this key in a safe place for use in the [next section](#in-your-jenkins-plugin). ### In Your Jenkins Plugin 7. From your Jenkins dashboard, select your desired job → **Configure** → **Post-build Actions** tab. 8. From the **Add post-build action** dropdown, select **PagerDuty Change Events**. 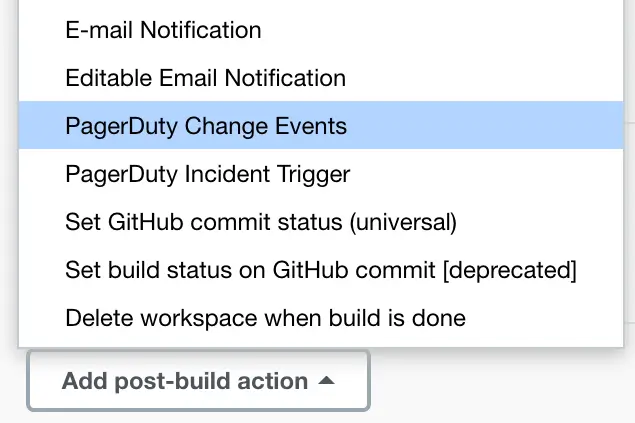 *Select "PagerDuty Change Events"* 9. Paste the PagerDuty integration key from the [previous section](#in-pagerduty) into the **Integration Key** field and select the build result(s) that you would like to create change events. 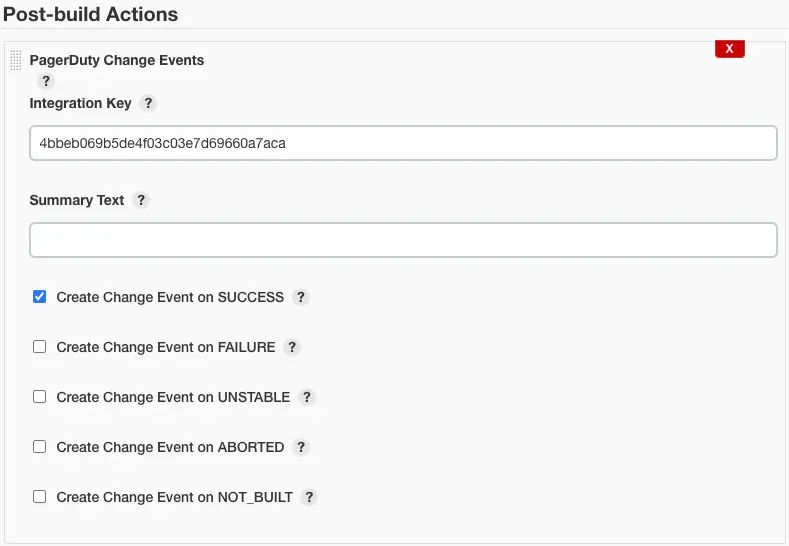 10. Click **Save**. ## Using the Integration Once configured, build events specified in step 9 ([above](#in-your-jenkins-plugin)), will be sent to PagerDuty as [change events](/ai-automation/aiops/recent-changes). --- URL: https://docs.pagerduty.com/integrations/jira-cloud # Jira Cloud Integration Guide | PagerDuty Configure the Jira Cloud integration ## Jira Cloud + PagerDuty Benefits - Tackle critical service requests and accelerate incident resolution with bidirectional sync between Jira Cloud issues and PagerDuty incidents. - Populate out-of-the-box or custom issue fields, sync incident priority and notes, and configure state mapping between Jira and PagerDuty. - Jira Cloud users can leverage PagerDuty’s integrations and [PagerDuty AIOps](/ai-automation/aiops/overview) functionality. - This integration is compatible with both Jira Software and Jira Service Management products. > **Jira On-Prem Integration:** If you're using Jira on-premises (Jira Server/Jira Data Center), please refer to our [Jira Server Integration Guide](/integrations/jira-server). ## Requirements > **Availability:** The Jira Cloud Integration is available on the following pricing plans: > > Professional, Business, Digital Operations (legacy) and Enterprise Incident Management. > > Please [contact our Sales team](https://www.pagerduty.com/contact-us/) if you would like to upgrade your account to include the Jira Cloud Integration. ### To Configure the Integration #### In PagerDuty - You must have an Account Owner or Global Admin base role to add or disconnect a Jira Cloud account. A Manager base role can create, edit, and delete configurations on a Jira Cloud account that is already connected, but cannot add or disconnect an account. Responder and Observer base roles have read-only access to the Jira Cloud configuration page. Users with a Restricted Access base role cannot view the Jira Cloud configuration page. #### In Jira - You must have an Admin role in order to install and manage the PagerDuty app. ### To Use the Integration #### In PagerDuty - You must have a PagerDuty user license to use the integration. #### In Jira - Users in Jira do not need a PagerDuty account to use the PagerDuty app. ## How it Works **If you configure the integration to create incidents and issues manually**: - When a user clicks **Create Jira Issue** on a PagerDuty incident, the action sends an `Issue Created` event to Jira Cloud, creating an issue. - When a user clicks **Create New Incident** on a Jira Cloud issue, the action sends a trigger event to PagerDuty, creating an incident. - PagerDuty incident and Jira issue statuses are mapped during integration configuration, and they are bidirectionally synced throughout the lifecycle of the incident and issue. **If you configure the integration to create incidents and issues automatically**: - When a user creates a PagerDuty incident, it will automatically create a Jira issue. - When a user creates or updates a Jira issue matching a predefined JQL statement, it will automatically trigger a PagerDuty incident. - PagerDuty incident and Jira issue statuses are mapped during integration configuration, and they are bidirectionally synced throughout the lifecycle of the incident and issue. ## Integration Walkthrough ### In Jira Cloud 1. Depending on your [service region](/get-started/service-regions), navigate to one of the following apps in the Atlassian Marketplace: - **US Service Region**: [PagerDuty for Jira Cloud](https://marketplace.atlassian.com/apps/1218243/pagerduty-jira-cloud-extension?hosting=cloud&tab=overview). Click **Get it Now** to download. - **EU Service Region**: [PagerDuty for Jira Cloud (EU only version)](https://marketplace.atlassian.com/apps/1225004/pagerduty-for-jira-cloud-eu-only-version?tab=overview&hosting=cloud). Click **Get it Now** to download. 2. Once the app installs, click **Manage app** in the confirmation dialog that appears. On the following screen, click **Configure**. 3. You will see a **Jira connection code** in the instructions that populate. Copy this key and keep it in a safe place for later use. **Note**: For security reasons, **the key in this step must be used within 48 hours.** 4. _Optional_: To activate PagerDuty in a Jira project’s sidebar, navigate to your **project** → **Project settings** → **Apps** → **PagerDuty Sidebar** and enable the toggle **Enable Sidebar**. 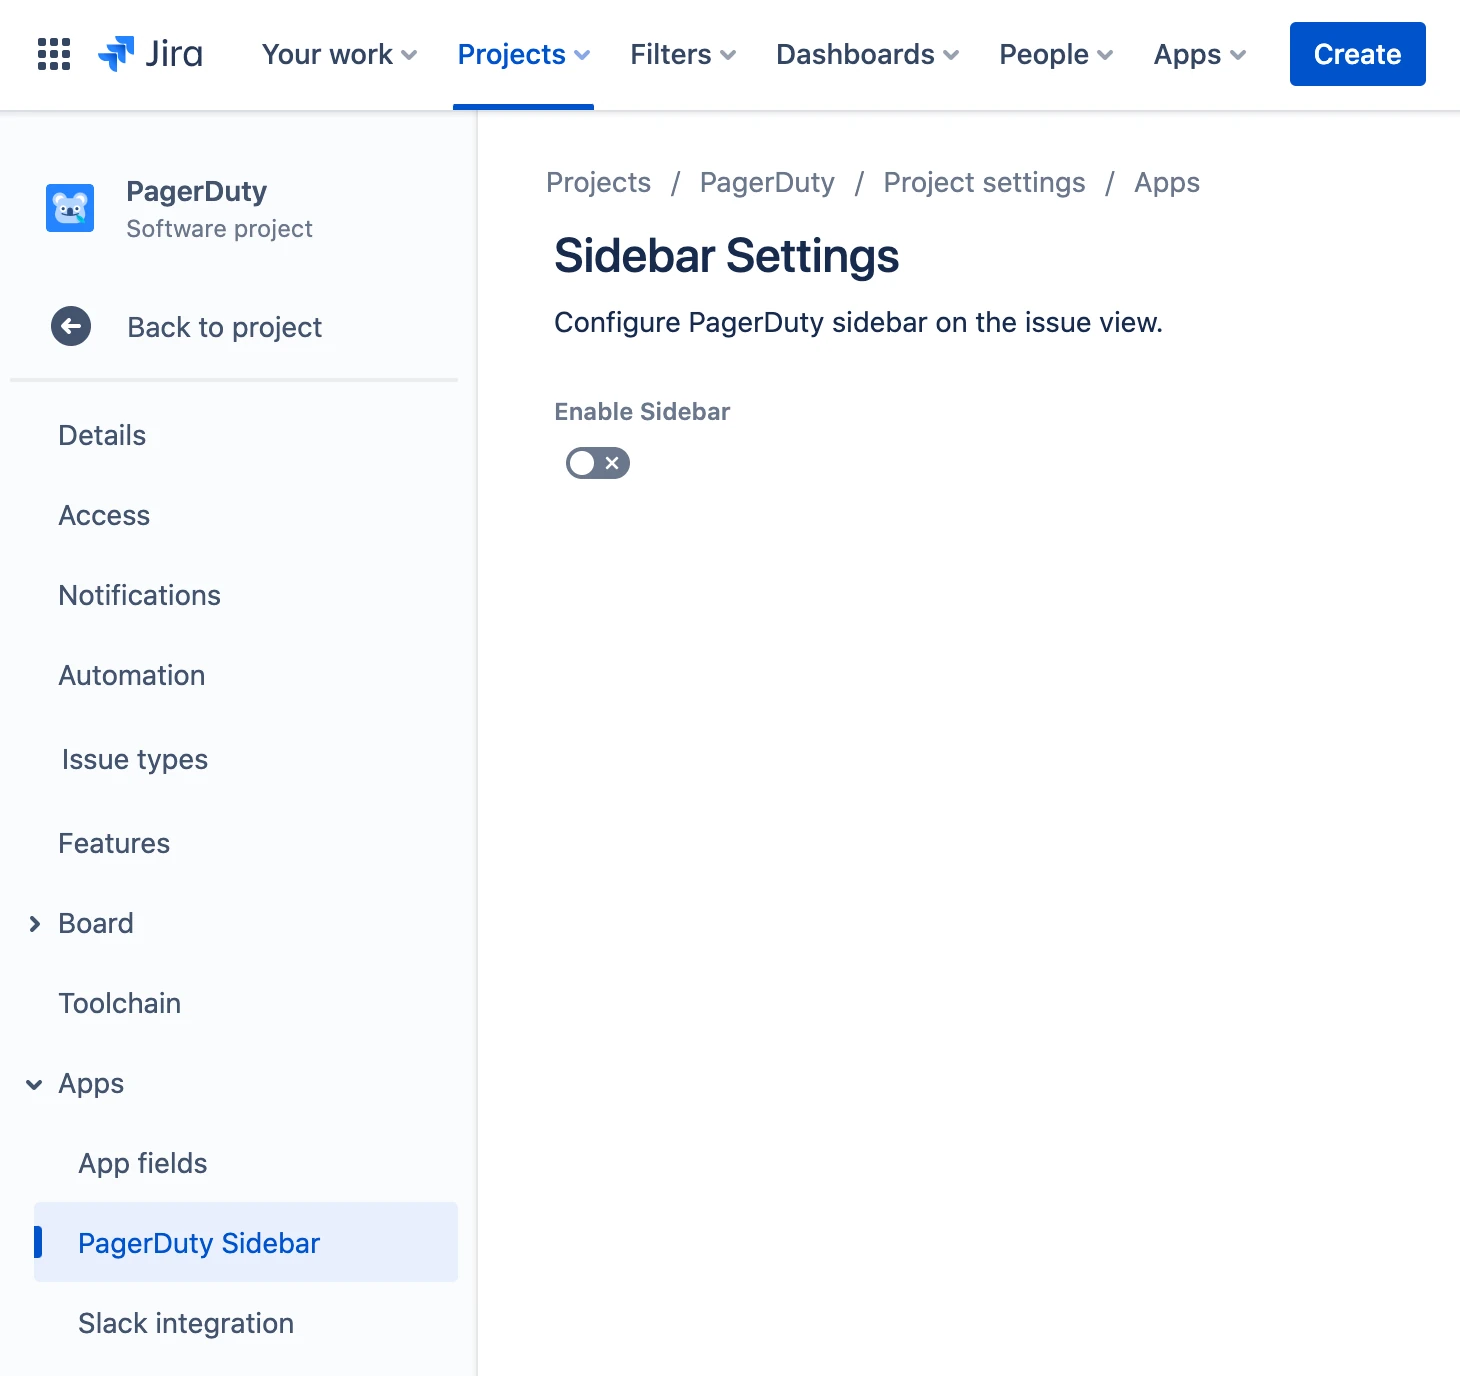 ### In PagerDuty #### Create Jira Extension 5. Navigate to **Integrations** → **Extensions**. 6. On the Extensions page, click **New Extension** and then search and select **Jira Cloud**. The **Add on the JIRA Extension Page** modal will appear; click **Open**. 7. Click **Add Account**. 8. Enter the **Jira connection code** you generated within Jira and then click **Connect Jira Account**. #### Map Jira Project to PagerDuty Service 9. In PagerDuty, navigate to **Integrations** → **Extensions** → **Jira Cloud**. 10. Select the Jira account to view the configuration settings. 11. Click **New Configuration**. 12. Select the desired Jira project and PagerDuty service(s) from the dropdown menus. If you select multiple PagerDuty services, a separate mapping will be created for each service. **Note**: Once you save a mapping, you cannot edit the selected project or service(s). You will need to create a new mapping in order to map a different project or service. 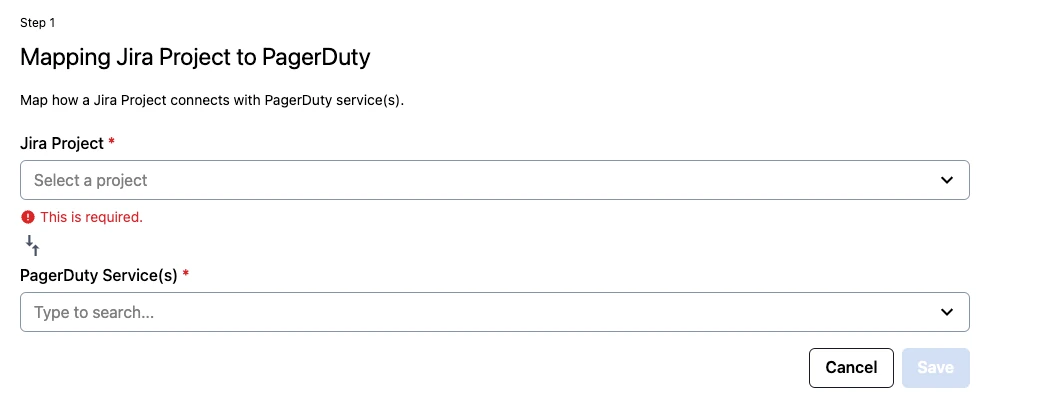 13. Enter the **Configuration Details**: - **Configuration name**: Enter a name for your mapping. - **Issue Type**: Select which issue type this mapping applies to. ##### Create Jira Issues from PagerDuty Incidents 14. Configure your **Jira Issue Creation** settings: - **Creation Type**: Choose either **Automatically create issues when an incident triggers** or **Manually create issues using a Jira Action button on the incident details page**. - **Jira Field Mapping**: Choose which Jira fields will map to PagerDuty fields. To create a new mapping, click **New Mapping** and select your desired fields from the dropdown menus. - **Jira Test Issue**: Click **Create a Test Issue** to test your configuration. This test will only create a Jira issue using placeholder information; it will not create a PagerDuty incident. If the test was successful, you’ll see a message appear with a link to the test issue. ##### Create PagerDuty Incidents from Jira Issues 15. Configure your **PagerDuty Incident Creation with JQL** settings: - To create PagerDuty incidents from Jira, check the box next to **Create an incident if the issue matches the JQL statement**. - Enter your desired **JQL statement**. For example, `status = "To Do" AND summary ~ "PagerDuty Test"` will create a PagerDuty incident when a Jira issue’s status is set to **To Do** and the issue summary contains the words “PagerDuty” and “Test”. Please refer to Atlassian’s [documentation](https://www.atlassian.com/software/jira/guides/jql/cheat-sheet#intro-to-jql) for more information on using JQL. > **Note:** Do not include the Jira **Project** and **Issue** type in your JQL statement. These will be inferred based on what you selected in the **Configuration Details** section. You may see an error if you attempt to include these fields in the statement. ##### Sync Notes 16. If you’d like to sync notes between PagerDuty incidents and Jira issues, click the checkbox next to **Sync notes to issues**: - Choose the PagerDuty user that will be used for posting in the **Account for note syncing** dropdown. This user will be the author for any notes created by the integration. ##### Status Mapping 17. Select the appropriate **Jira Status** for each **PagerDuty Status**: Triggered, Acknowledged and Resolved. > **Incident Acknowledgement:** Jira cannot change the state of an incident in PagerDuty to **Acknowledged**. This ensures only PagerDuty users can acknowledge an incident is being worked on. ##### Priority Mapping 18. If you have configured [incident priorities](/incident-management/incidents/incident-priority) in PagerDuty, you can map these to your Jira priorities. For each priority you want to map, click **New Mapping** and then select your desired PagerDuty priority and Jira priority values. Once you have completed your configuration, click **Save**. The integration is now complete. Please see our [Jira Cloud User Guide](/integrations/jira-cloud/jira-cloud-user-guide) for instructions on using the integration. ## FAQ Please read [Jira Cloud Integration FAQ](/integrations/jira-cloud/jira-cloud-integration-faq) for answers to common questions. --- URL: https://docs.pagerduty.com/integrations/jira-cloud/jira-cloud-integration-faq # Jira Cloud Integration FAQ Answers to common questions about multi-service configuration, subdomain limits, and bidirectional syncing for the Jira Cloud integration. ## FAQ **Can I Configure the Jira Cloud Extension With Multiple Services?** Yes. You can select multiple PagerDuty services in step 7 of the integration guide's [In PagerDuty](/integrations/jira-cloud#in-pagerduty) section. **Can I Connect Jira Cloud With More Than One PagerDuty Subdomain?** No, this integration can only connect multiple Jira Cloud instances with one PagerDuty account. **Is This Integration Bidirectional?** Yes. You can create Jira issues from PagerDuty incidents and PagerDuty incidents from Jira issues. You can create PagerDuty incidents from Jira issues by navigating to **Integrations** → **Extensions** → find **Jira Cloud** in your extensions list → **Edit on Jira Cloud Extension Page** → **Edit the Jira Cloud Configuration** → check the **Create incidents with JQL** box and then input your JQL query in the following field.  *Select "Create incidents with JQL"* > **Limitations:** - Since users are not mapped from PagerDuty to Jira, a Jira status is not able to move the PagerDuty status to **Acknowledged**. > - The flow of status changes cannot move backward in PagerDuty via mapping statuses. **Can I Create Multiple Jira Issues for the Same Incident?** No, only one Jira issue will be created. **Can I Create Jira Issues From Resolved PagerDuty Incidents?** Yes, but it will create them with the status of **Done** in Jira. **What Types of Jira Fields Can I Populate From PagerDuty?** You can populate the following types of fields: - Any field that takes a string - Labels - Number Fields - Select Lists (single and multi-choice) - Text fields (single and multi-line) - URLs - User Pickers (single user) **How Can I Populate the `label` Fields From PagerDuty?** You can populate this field while configuring the Jira Project in PagerDuty: 1. Click the **New Field** button to create a custom field to sync data. 2. Choose **Constant value** as the **PagerDuty Attribute**. 3. A text box input will appear. Enter the value you would like to use for the **label** field. Note you can add multiple values by using a comma as a delimiter (e.g., `blue,red`). However, due to restrictions on Jira's end, **this field does not allow any white space**. **How Can I Populate the `Reporter` or `Assignee` Field From PagerDuty?** You can populate this field while configuring the Jira project in PagerDuty: 1. Under **Jira Field mapping**, click **New Mapping** to map data between Jira issues and PagerDuty incidents. 2. Choose **Reporter** or **Assignee** as the **Jira Field**. 3. Choose **Fixed text** as the **PagerDuty Field**. 4. In the text box, input the Jira username. For this feature to work, your user must be visible to and retrievable by the PagerDuty application, which may require that the PagerDuty user be a member of a Jira group that has the [Browse users and groups](https://support.atlassian.com/jira-cloud-administration/docs/manage-global-permissions/#:~:text=user%20management.-,Browse%20users%20and%20groups,-View%20and%20select) permission. **When I Update the PagerDuty Incident's Status, the Jira Ticket Isn't Getting Updated. What's Happening?** This can happen for the following reasons: - The Jira project's workflow requires that some fields are populated when setting it to that given state, and those fields aren't populated. You can configure the Jira extension to populate them when creating Jira incidents using the method described in the previous section. - The Jira project's workflow does not permit the transition between the issue states corresponding to the previous and current PagerDuty incident states. For instance, if your Jira workflow does not permit setting a To Do status Jira ticket directly to Done, and the Triggered status in PagerDuty maps to To Do while the Resolved status maps to Done, then if a triggered incident is resolved without acknowledging it first, then the ticket will not move to the Done state because this modification is not permitted per your Jira project's configured workflow. **I Just Updated the `priority` of a PagerDuty Incident. Why Didn't the `priority` Update in the Jira Issue?** The Jira issue is only updated when the PagerDuty incident triggers an action via webhook, such as an acknowledgement, assignment, or resolve. Review a full list of actions [in the webhook documentation](/developer/webhooks-v2-overview#webhook-types). For example, an update to priority alone will not prompt the PagerDuty incident to sync with the Jira Issue. However, once the incident subsequently triggers an action via webhook, the priority will then sync. If you would like PagerDuty to trigger an action for incident priority changes, make a feature request by [contacting the Support team](https://www.pagerduty.com/contact-us/). **Why Do I Receive an Error `Jira test failed: cannot change status to requested state` When Trying to Create a Test Issue?** The **Create Test Issue** button in PagerDuty tries to create a Jira issue and automatically maps it to the Resolved status in Jira. You will see this error if the [workflow](https://confluence.atlassian.com/adminjiraserver072/working-with-workflows-828787890.html) for your Jira project does not allow the Jira issue to transition directly from the Triggered status mapping to the Resolved status mapping. Create a Jira issue from a normal PagerDuty incident to determine if the integration works as expected. **How Will the Workflow Action Affect the Workflow Automations That Already Exist in My Jira Cloud Instance?** Jira's automation engine does not monitor PagerDuty incident conditions to determine when to create a Jira issue. Jira's automation engine monitors Jira issue creation and changes to determine if and when to execute a specific action. This differs from PagerDuty incident workflows, which monitor PagerDuty incident conditions to determine when to create a Jira issue. If there are any Jira automation rules configured to update the Jira fields in your workflow action, review those Jira automation rules to avoid conflicts. **Can I Run the Workflow Action on Multiple Jira Cloud Instances?** At this time, the workflow action only allows one Jira Cloud instance to one Workflow mapping. **Can I Run Multiple "Create Jira Issue" Workflow Actions on One PagerDuty Incident?** Yes, you can run multiple Create Jira Issue workflow actions on one PagerDuty incident. **What Happens to Webhook Connections and Configuration Rules if I Delete the PagerDuty App in Jira Cloud?** When you remove the PagerDuty app from Jira Cloud, it will also remove webhook connections and the integration's configuration rules in PagerDuty. Follow the [Jira Cloud Integration Guide](/integrations/jira-cloud) to restore the disconnected webhooks and reconfigure the integration. **How Can I Programmatically Manage the Configuration Rules?** You can fully manage configuration rules with the [PagerDuty API](/developer/api/reference/integration-jira-cloud/account-mappings/get-account-mappings). Read the [Developer Documentation](/developer) to learn more about the concepts and authentication methods supported. Note that PagerDuty does not support using the Extensions API to manage configuration rules. Doing so may disrupt the functionality of your integration. **How Can I Programmatically Set the PagerDuty Sidebar Visibility at the Project Level?** A boolean property with key `pagerdutySidebarEnabled` controls the visibility of the PagerDuty sidebar in a Jira Cloud project. You can set this property by using the [Set project property](https://developer.atlassian.com/cloud/jira/platform/rest/v2/api-group-project-properties/#api-rest-api-2-project-projectidorkey-properties-propertykey-put) operation of the [Jira Cloud REST API](https://developer.atlassian.com/cloud/jira/platform/rest/v2/). --- URL: https://docs.pagerduty.com/integrations/jira-cloud/jira-cloud-troubleshooting-guide # Jira Cloud Troubleshooting Guide Learn to troubleshoot issues with the Jira Cloud integration. ## Step 1: Pre-Checks ### IP Safelisting Requirements Before starting the troubleshooting process, safelist the required PagerDuty IP addresses: - [How to Safelist IPs](/account-admin/safelist-ips#rest-api) - [List of Webhook IPs](/developer/webhook-ips) ## Step 2: General Troubleshooting ### In PagerDuty 1. **Check the Jira Cloud Configurations in PagerDuty**: Navigate to **Integrations** → **Your Integrations** → **Jira Cloud**. Verify if there is a configuration connecting the PagerDuty service to the Jira project and issue type. 2. **Note the Jira Issue Type**: Check if the configuration correctly associates with the affected Jira issue type. Each configuration associates to a specific issue type — for example, if a configuration associates to the type **Task**, then its configuration rules will not apply to other issue types, such as **Bug**. 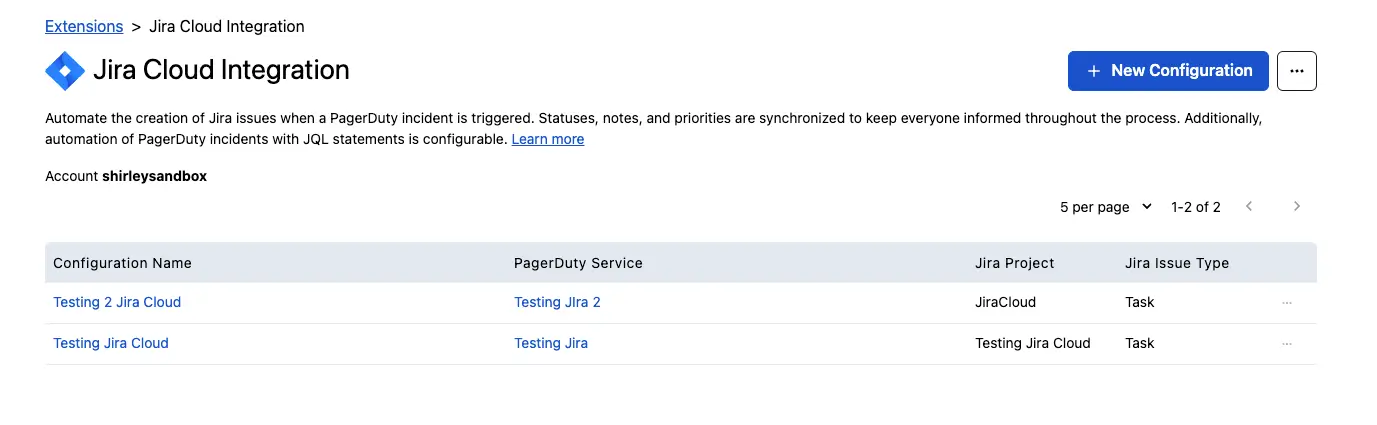 *Jira Cloud configurations list in PagerDuty* 3. **Check the Creation Type**: Navigate to the configuration rule and review the option selected in the **Creation Type** field. Confirm if the option selected matches the expected issue creation behavior. In **Automatic** mode, PagerDuty automatically creates a Jira issue in the associated project. **Manual** mode requires responders to generate a Jira issue from the incident page (navigate to the **More** dropdown → **Create Jira Issue**). 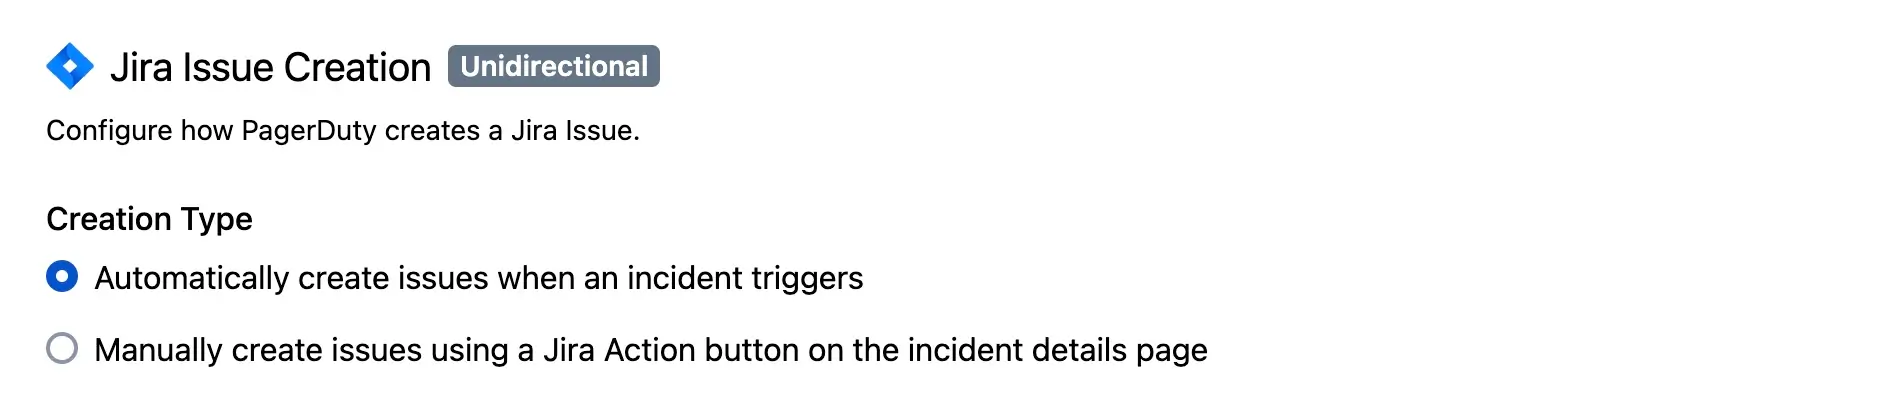 *Jira issue creation type setting* 4. **Review incident status mapping**: Review the PagerDuty incident status to Jira issue status mappings, to confirm that the PagerDuty statuses are mapped correctly to the expected Jira issue status. 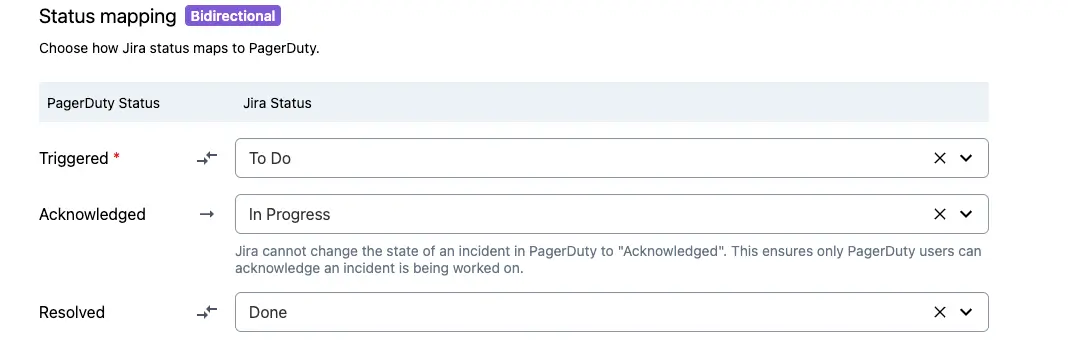 *PagerDuty incident status to Jira issue status mapping* 5. **Complete the priority mapping section**: If you enabled priorities for your PagerDuty account, complete the priority mapping section to map PagerDuty incident priorities to Jira issue priorities. 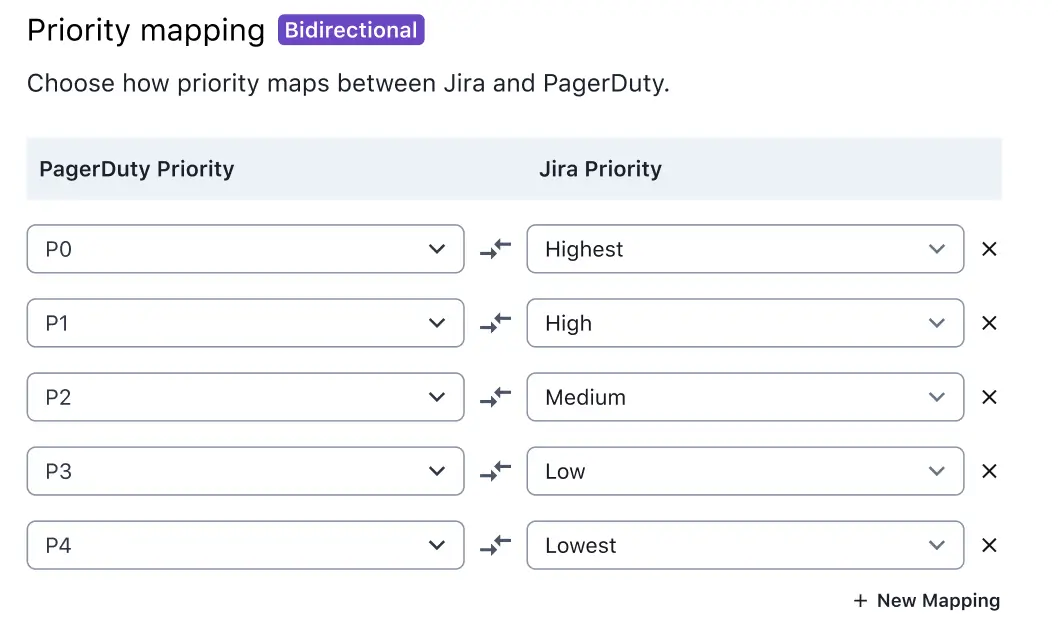 *PagerDuty to Jira priority mapping* 6. **Some Jira issue fields may be required**: Confirm which Jira issue fields are required for that Jira project and issue type. In the **Jira Field mapping** section, there must be a PagerDuty field mapped to each of the required Jira fields. Required fields are indicated with an asterisk: 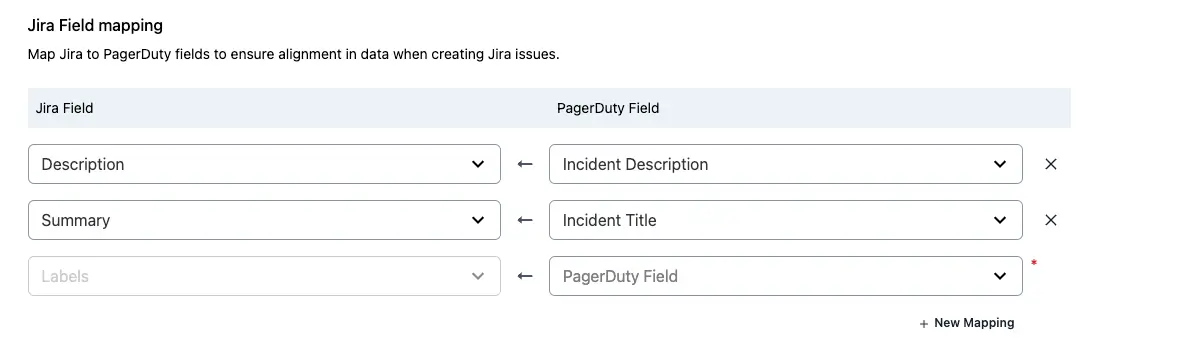 *Jira field mapping section* ### In Jira Cloud 1. **Workflow mapping**: The issue workflow for the Jira project should contain a transition that would allow the issue to change from its current status to the desired status. 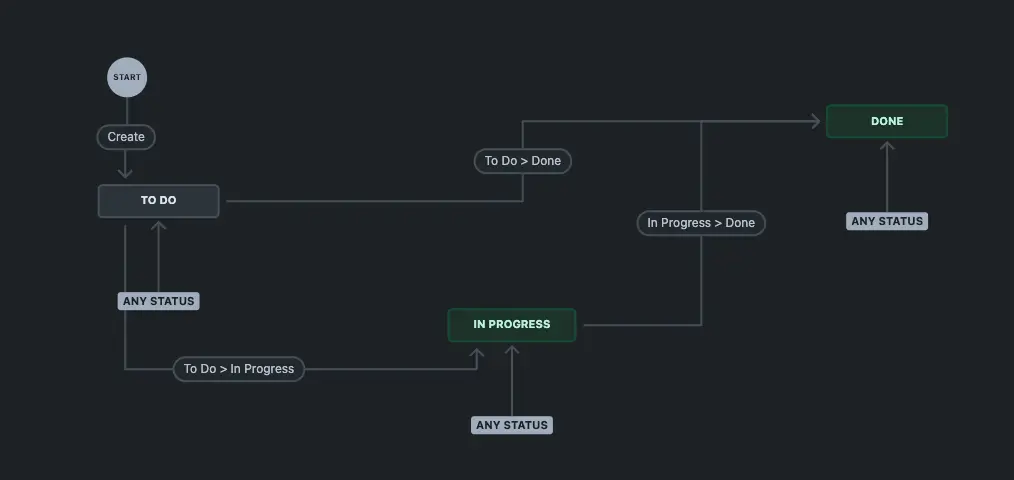 *Jira workflow transition mapping* If the issue persists after completing these general troubleshooting steps, refer to the following section for more specific troubleshooting steps. ## Step 3: Troubleshooting Some Common Jira Cloud Issues **PagerDuty Incident Did Not Create a Jira Issue** **In PagerDuty**: 1. On the Jira Cloud Integration page, there should be a configuration linking the PagerDuty service to the Jira project and issue type. 2. Confirm if the option selected in the **Creation Type** field matches the expected issue creation behavior. If you have selected the **manual** issue mode, the responder must manually create a Jira issue from the **More** dropdown on the incident page.  *Create Jira Issue option in the More dropdown* **In Jira**: 1. Check if there are any conflicting automation rules configured to process incoming webhooks, or handle automatic issue creation. 2. Navigate to the project settings and check the valid issue types for this project. 3. Mapping a PagerDuty field to an incompatible Jira issue field may also prevent Jira issue creation. Check that the PagerDuty fields mapped to each Jira field match the data type expected for that field.  *Jira field mapping section* **Jira Issue Did Not Trigger a PagerDuty Incident** **In PagerDuty**: 1. Navigate to the configuration rule in PagerDuty, and copy the JQL statement. In Jira, verify if that JQL statement returns the Jira issue in the results. 2. If Jira issues matching the JQL statement should trigger a PagerDuty incident, the **Create an incident if the issue matches the JQL statement** setting should be enabled. 3. The Jira project and Jira issue type are automatically appended to the JQL filter, according to the project and issue type selected in the configuration rule. At this time, the JQL filter cannot match other projects or issue types not selected in the configuration rule.  *JQL statement in a configuration rule* **In Jira**: 1. Confirm if the issue matches the project and issue type defined in the configuration. 2. If Jira issues should not automatically trigger a PagerDuty incident, then responders should manually trigger incidents from the PagerDuty widget in the issue sidebar. **PagerDuty Incident Status and Jira Issue Status Did Not Sync** **In PagerDuty**: 1. On the incident page, confirm if the Jira issue is linked to the PagerDuty incident. The Jira issue must be linked to the incident to sync the incident record between the two platforms. 2. In the configuration rule, there should be a mapping between the PagerDuty incident status and the desired Jira issue status. > **Note:** Jira cannot change the state of a PagerDuty incident to **Acknowledged**. This ensures only PagerDuty users can acknowledge an incident is being worked on. **In Jira**: 1. Check if there is a workflow transition for that project and issue type, which would allow the issue to transition from the current status to the desired status. 2. Confirm if any automations are transitioning the Jira issue to a different status than the one you expected. 3. The PagerDuty application cannot transition issues to or from statuses that are not mapped in the configuration rule. To review the issue's status change history, navigate to the issue's **Activity** tab and look for updates indicating a status change. **PagerDuty Incident Fields and Jira Issue Fields Did Not Sync** **In PagerDuty**: 1. In the configuration rule, there should be a mapping between a PagerDuty field and the Jira issue field. Check the mapping to confirm that the correct PagerDuty field is being mapped to that Jira issue field. 2. The mapped fields are synced the moment the Jira issue is created — Jira fields do not get updated or synced after this point. **In Jira**: 1. Navigate to the project settings to verify if the field is available for that issue type. The Jira field data type should correspond with the PagerDuty field data type. 2. Check if there are any conflicting global or project automations that also populate this issue field. 3. The issue field must be placed on a screen that is mapped to the create issue operation via a screen scheme. The screen scheme must be mapped to the issue type via an issue type screen scheme that is associated to the Jira project. **A Jira Ticket Is Triggering Multiple PagerDuty Incidents** **In PagerDuty**: 1. In the configuration rule, the JQL statement for automatically triggering a PagerDuty incident should include an Open/To-Do status (as defined by your company) so that a PagerDuty incident is only triggered when the issue is first opened or created. 2. Confirm if a duplicate incident was triggered manually from PagerDuty, or from the PagerDuty widget in the issue sidebar. 3. Check if there are any project-level or global-level automations which would have created a duplicate ticket. 4. Verify if there is a duplicate configuration rule mapping the Jira project and issue type to the same PagerDuty service. **TLS Certificate Errors** Most commonly, this error occurs when: - A certificate in the chain has expired - The certificate being used is self-signed or from an issuer not trusted by PagerDuty - The certificate chain is out of order - There is a duplicate certificate in the certificate chain PagerDuty expects all certificates in the chain to be active, sent in the correct order (with no duplicates) and signed by a trusted root. The following openssl command, or a tool like [SSL Labs](https://www.ssllabs.com/ssltest/), may be helpful in identifying issues with the certificate chain. Note that the port for your Jira instance may be different from the default 443: ```text openssl s_client -connect
2. XML export of the relevant Jira issue
3. Logs or records showing the updates that have been made to the Jira issue
4. Screenshot of the workflow for that Jira project and issue type, from Open → Done/Closed
5. Screenshots or records of the global/project automations associated to the Jira project
6. Screenshot of the available issue types for the affected Jira project
7. Screenshot of available issue fields for the affected issue type, including the data type defined for these fields
--- URL: https://docs.pagerduty.com/integrations/jira-cloud/jira-cloud-user-guide # Jira Cloud User Guide Using the Jira Cloud integration after installation ## Jira Issue Sidebar > **Required User Permissions:** Jira Project Admin role is required remove the PagerDuty widget from the sidebar in a specific Jira Project. PagerDuty displays as a _standalone_ application in the Jira issue sidebar. In the expanded pane, users are able to: - View the linked incident in PagerDuty - Manually trigger an incident for the Jira issue. - If a PagerDuty incident is linked to the issue, the expanded application modal will also include the incident details. The PagerDuty application may not be first in order in the sidebar (it may appear towards the middle or bottom). At this time, Atlassian does not have any features available which would allow users to modify the order of the widgets in the issue sidebar. > **Note:** By default, PagerDuty will not display on the sidebar for all Jira projects. See [Step 9 in the Jira Integration Guide](/integrations/jira-cloud#in-pagerduty) to enable this feature. 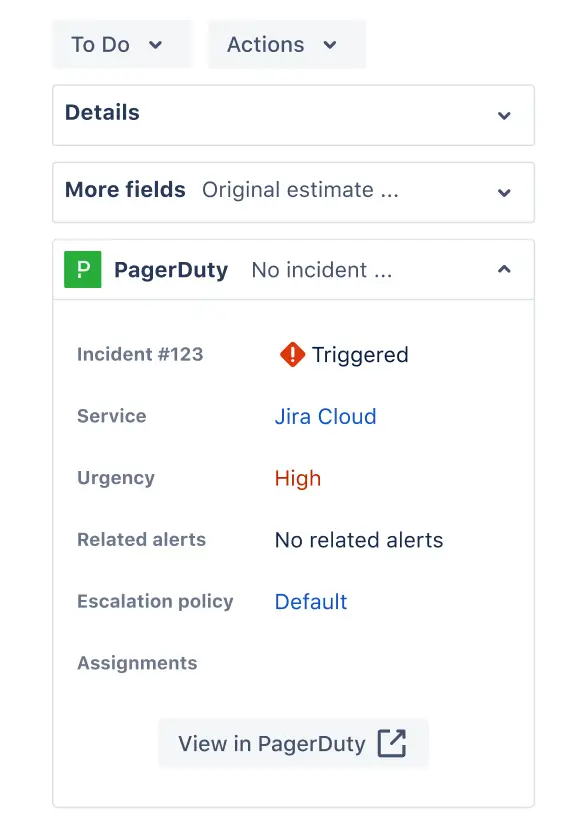 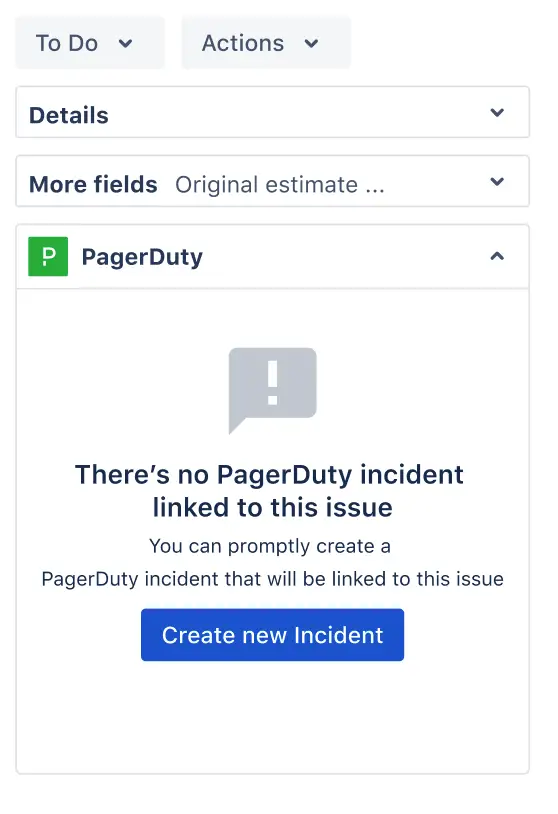 ## Sync Incident Notes and Jira Issue Comments **Create a Comment in Jira Cloud**: - **In Jira Cloud**: The comment associates to the Jira user who posted the comment. - **In PagerDuty**: The incident timeline will show the following: `Note added by [Integration Actor]. [Jira] [Jira User]: [Comment]` **Create an Incident Note in PagerDuty**: - **In PagerDuty**: The incident note associates to the PagerDuty user who created the incident note. - **In Jira Cloud**: The comment record will showing the following: `PagerDuty [PagerDuty User]: [Incident Note]` ## Create a Jira Issue From a PagerDuty Incident **If you configured your Jira Cloud integration [to create issues manually](/integrations/jira-cloud#in-pagerduty)**: 1. [Create a PagerDuty incident](/incident-management/incidents/overview#trigger-an-incident-via-web-app), or click an open incident’s **Title** to view its details page. 2. Click the **More** dropdown and select **Create Jira Issue**. 3. You then will see a confirmation dialog appear with a link to view the Jira issue. You may also view the Jira issue any time by clicking **More** and selecting **View Jira Issue**. **If you configured your Jira Cloud integration [to create issues automatically](/integrations/jira-cloud#in-pagerduty)**: 1. [Create a PagerDuty incident](/incident-management/incidents/overview#trigger-an-incident-via-web-app). 2. In your Jira Cloud instance, an issue will automatically generate. ## Create a PagerDuty Incident From a Jira Issue **If you configured your Jira Cloud integration [to create incidents manually](/integrations/jira-cloud#in-pagerduty)**: 1. [Create a Jira issue](https://support.atlassian.com/jira-software-cloud/docs/create-an-issue-and-a-sub-task/#Createanissueandasubtask-Createanissue), or click an issue’s **Title** to view its details page. 2. In the right panel, click **PagerDuty Incident**. The **Incident Title** will auto-populate the issue’s title. You may enter an _optional_ description. Click **Create New Incident**. **Note**: You may need to scroll down to view the **Create New Incident** button. 3. You will then see the incident’s details within the Jira issue. You may view the incident in PagerDuty by clicking **View in PagerDuty**. **If you configured your integration [to create PagerDuty incidents based on issues matching a JQL statement](/integrations/jira-cloud#in-pagerduty)**: 1. [Create or update a Jira issue](https://support.atlassian.com/jira-software-cloud/docs/create-an-issue-and-a-sub-task/#Createanissueandasubtask-Createanissue) that matches the preconfigured JQL statement. 2. In your PagerDuty instance, an incident will automatically trigger. ## Integration Actor > **Required User Permissions:** The Integration Actor must have a base role of Responder or higher. Changing the Jira Integration Actor requires a base role of Manager or higher. When the integration triggers, updates, or resolves a PagerDuty incident, these actions perform on behalf of a PagerDuty user with a base role of Responder or higher. This user is the Integration Actor. The Integration Actor allows the integration to sync Jira actions back to PagerDuty via webhooks. ### Edit the Integration Actor By default, the Integration Actor is the PagerDuty Account Owner, but you can modify this from the Jira Cloud Integration page: 1. In PagerDuty, navigate to **Integrations** → **Your Integrations** → **Jira Cloud**. 2. Click the menu in the upper right and select **Edit Jira Integration Actor**. 3. In the modal that appears, select a new **Integration Actor** from the dropdown and click **Save**. When you delete an Integration Actor from PagerDuty, the PagerDuty Account Owner will automatically become the new Integration Actor, since they are the default user. ### Incident Timeline Incident actions invoked on behalf of the Integration Actor – e.g. trigger, resolve, update priority – attribute to the Jira Cloud Integration on the incident timeline. The timeline record will indicate that these actions originated from Jira, and will also include the Jira Issue link. When an issue comment syncs to PagerDuty, the timeline record will start with `[Jira]` to denote the origin. The timeline record will also include the name of the Jira user who posted the issue comment. ![A PagerDuty incident timeline entry prefixed with [Jira] showing a synced Jira comment](/images/kb/2b9ed2aa5393e819cf00465347cbfb62cd3317f06608cece45844e8306d3bd55-jira-cloud-ug-incident-actor-timeline.webp) If you want the note record to show that it was ‘added by PagerDuty Integration’ instead: 1. In PagerDuty, [create a user](/account-admin/manage-users#add-users) named ‘PagerDuty Integration’. 2. [Designate](#edit-the-integration-actor) ‘PagerDuty Integration’ as the Integration Actor. ## Jira Cloud Incident Workflow Action > **Configure Incident Workflow Actions:** The following sections detail the capabilities of the [Jira Cloud: Create an Issue for an Incident](/workflow-actions/jira-cloud/jira-cloud-create-an-issue-for-an-incident) workflow action. For more information on how to configure this workflow action, please see our [Incident Workflows](/ai-automation/automation/incident-workflows) article. > **Requirements:** - The Jira Cloud Incident Workflow Action is available on our Professional, Business and Enterprise pricing plans. > - PagerDuty Account Owners and Global Admins can create and edit all Incident Workflows. Other users can edit workflows and triggers for services where they have Manager access. ### Create a Jira Issue With an Incident Workflow In alignment with the conditional workflow trigger, the action to create a Jira Cloud issue will initiate using the data provided in the workflow configuration form. The integration will validate the connection between Jira Cloud and PagerDuty, in addition to the following Jira Cloud information: - Jira Cloud project - Jira Cloud issue type - Jira Cloud issue fields It then sends an API request to create a Jira issue in accordance with the data provided in the workflow configuration form. Following a successful request, the integration will create a new issue in the associated project (created in the **Open** state). ### No Synchronization of Data There is no synchronization of data between the linked Jira issue and the PagerDuty incident, thus maintaining the intended separation between these two processes. Updates to the Jira issue will not cause a corresponding change to the PagerDuty incident, and updates to the PagerDuty incident will not cause a corresponding change to the Jira issue. The linked Jira issue functions as a snapshot, capturing the PagerDuty incident state as it was when the Jira issue was created. ### After the Workflow Executes > **Limit:** There is a maximum of 50 linked issues across all integrated applications. - The Jira issue link will display on the incident details page in PagerDuty as an external reference (Linked Records) field. - A workflow log entry will appear on the incident timeline, indicating the workflow and issue creation status. - The linked Jira issue will include a snapshot of the PagerDuty incident details, along with the incident link. Users can reference this information in the PagerDuty sidebar. 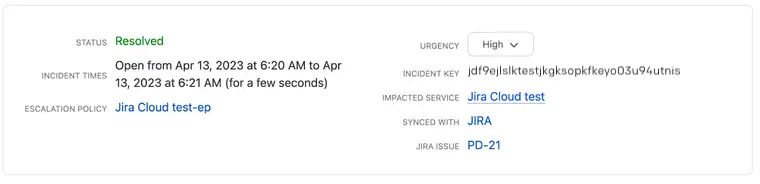 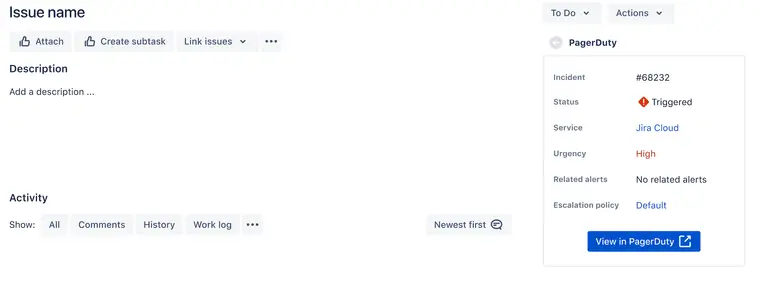 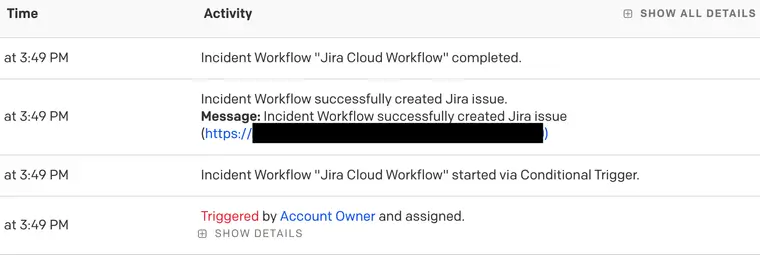 ### Supported Jira Fields and Data Types The currently supported data types for a workflow action: - text - integer - decimal - date - dateTime - boolean - singleChoice - multipleChoice - json - connection - trigger The workflow action supports both standard and custom Jira fields. Users can send any value accessible from the configuration form to Jira. Once the user selects a Jira field, the dropdown menu will display all of the compatible PagerDuty fields. #### Field Mapping Mapping PagerDuty fields to Jira issue fields: - PagerDuty text → Jira short text, paragraph (but no rich editor support), label - PagerDuty integer → Jira integer - PagerDuty URL → Jira URL - PagerDuty multi-select → Jira checkbox - PagerDuty single-select → Jira radio button, select list (single choice) - PagerDuty datetime → Jira date time picker - PagerDuty assignee → Jira assignee (user picker) ### Separate the Workflow Action From Existing Jira Cloud Configurations As part of the integration walkthrough, users define the [configuration rules](/integrations/jira-cloud#in-pagerduty) between their Jira projects and PagerDuty services. This section highlights the separation between configuration rules and workflow actions, which are two separate and distinct processes. #### Execute the Jira Workflow Without Configuration Rules When executing the workflow manually or automatically, if there are no configuration rules defined between the PagerDuty service and Jira project: - **In PagerDuty**: The workflow will create a Jira issue and add the link to the **Linked Records** field. - **In Jira**: The PagerDuty sidebar includes the incident link, as well as a snapshot of the incident state at the time of issue creation. - **No Synchronization**: Updates to the PagerDuty incident will not cause a corresponding change to the linked Jira issue. Updates to the linked Jira issue will not cause a corresponding change to the PagerDuty incident. #### Execute the Jira Workflow with Configuration Rules Defined When executing the workflow manually or automatically, if there are existing configuration rules defined between the PagerDuty service and Jira project: **Jira Issue Created by Configuration Rules** - **In PagerDuty**: The configuration rule will create a separate issue, and link the issue in the **Jira Issue** field. - **In Jira**: The PagerDuty sidebar will include the Incident link and incident details. - **Synchronization**: Updates to the Jira issue will result in a corresponding change to the PagerDuty incident. Updates to the PagerDuty incident will result in a corresponding change to the Jira issue. - **Workflow actions do not affect the issue**: This is a separate issue, so workflow actions will not apply. **Jira Issue Created by the Workflow** - **In PagerDuty**: The workflow will create a separate Jira issue, and link the issue in the **Linked Records** field. - **In Jira**: The PagerDuty sidebar will include the incident link, as well as a snapshot of the incident state at the time of issue creation. - **No Synchronization**: Updates to the PagerDuty incident will not cause a corresponding change to the linked Jira issue. Updates to the linked Jira issue will not cause a corresponding change to the PagerDuty incident. - **Configuration rules do not affect the issue**: This is a separate issue, so configuration rules will not apply.  ## Add Multiple Jira Accounts to one PagerDuty Account You can add multiple Jira accounts by following these steps: 1. Go to **Integrations** → **Jira Cloud** and click **Add Account**. 2. On the next page, paste the **Jira connection code** and then click **Connect Jira Account**. 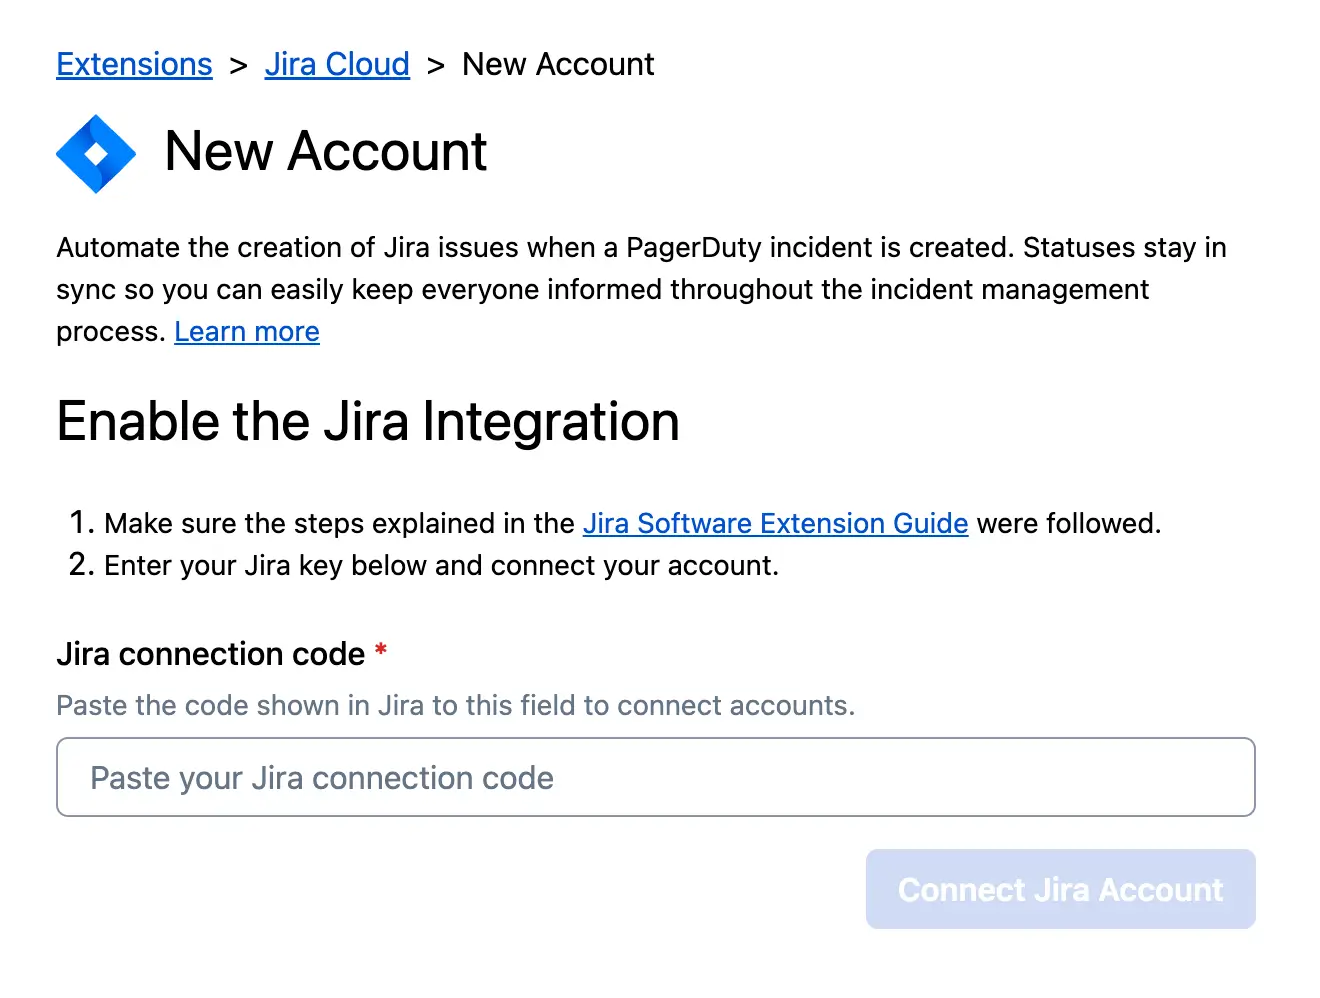 3. You should then see the newly added account in the accounts list. 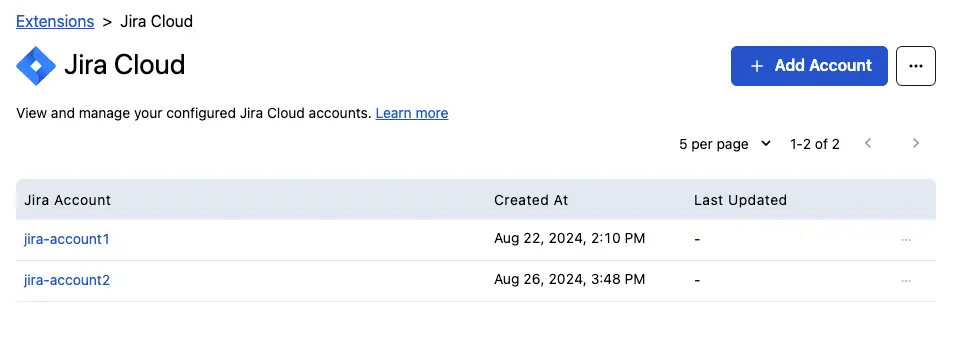 ### Disconnect a Jira Account > **Warning:** Disconnecting an account will remove all of its configurations and it cannot be restored. > **Required User Permissions:** You must have an Account Owner, Global Admin, or Manager base role to remove a configuration. Disconnecting a Jira account removes the connection between the PagerDuty service and the associated Jira project and issue type. Disconnecting a single account will not cause all of the other accounts to be deleted. To disconnect a Jira account: 1. In the PagerDuty web app, navigate to **Integrations** → **Jira Cloud**. 2. Locate the account you would like to remove, and click the menu to the right. 3. Select **Disconnect Account**. 4. A confirmation dialog will appear. Click **Disconnect** to disconnect the account. 1. If you need to re-connect the account, please follow the steps to [Add an Account](#add-multiple-jira-accounts-to-one-pagerduty-account) above. 5. - **If you want to disconnect the account permanently**: Follow the prompt to uninstall the PagerDuty app in Jira. - **If you want to change the PagerDuty account linked to Jira**: You do not need to uninstall the app; you can simply re-configure the app by getting a new token and paste it in the PagerDuty Jira account configuration. ## Uninstall the Jira Cloud Integration > **Warning:** By uninstalling the Jira Cloud Integration you will remove all of the configurations. Please be aware that this action cannot be undone, and PagerDuty Support is unable to restore these configurations after the integration has been deleted. ### Uninstall the Jira Cloud Integration in PagerDuty > **Required User Permissions:** You must have an Account Owner or Global Admin base role to uninstall the Jira Cloud integration. 1. In the PagerDuty web app, navigate to **Integrations** → **Jira Cloud**. 2. Before uninstalling, you will first need to [disconnect all Jira accounts](#disconnect-a-jira-account). 3. Once your Jira accounts have been disconnected, click the menu in the top right corner, and select **Disconnect Jira Cloud Integration**. **Note**: This option will be greyed out if you have not disconnected your Jira accounts in the previous step. 4. A confirmation dialog will appear. Select **Disconnect**. ### Uninstall the PagerDuty Application in Jira Cloud > **Required User Permissions:** You must have Jira Admin permissions to uninstall the PagerDuty application in Jira Cloud. 1. In Jira Cloud, navigate to **Manage Apps**. 2. Locate the **PagerDuty** app and click **Uninstall**. ## FAQ Please read [Jira Cloud Integration FAQ](/integrations/jira-cloud/jira-cloud-integration-faq) for answers to common questions. --- URL: https://docs.pagerduty.com/integrations/jira-server # Jira Server Integration Guide | PagerDuty Configure bidirectional sync between Jira Server or Data Center issues and PagerDuty incidents, including field and state mapping. ## Jira Server + PagerDuty Benefits - Tackle critical service requests and accelerate incident resolution with bidirectional sync between Jira Server issues and PagerDuty incidents. - Populate out-of-the-box or custom issue fields, sync incident priority and notes, and configure state mapping between Jira and PagerDuty. - Jira Server users can leverage PagerDuty's integrations and [PagerDuty AIOps](/ai-automation/aiops/overview) functionality. - This integration also supports Jira Service Management. > **Jira Cloud Integration:** If you use Jira Cloud, see the [Jira Cloud integration guide](/integrations/jira-cloud). ## Requirements ### To Configure the Integration **In PagerDuty**: - This integration only works with Jira Server for PagerDuty customers on the following pricing plans: PD Reliability Platform plans, as well as Professional, Business, Digital Operations (legacy), and Enterprise for Incident Management plans. - The Jira administrator configuring this integration must also be a user within the PagerDuty account with valid login credentials. **In Jira Server**: - To configure the integration, you must have Jira administrator permissions. - This integration is for Jira **Server** (self-hosted). You can find the current version compatibility and download the integration from the [Atlassian Marketplace](https://marketplace.atlassian.com/apps/1218226/pagerduty-for-jira-server/version-history#b306010). ### To Use the Integration **In PagerDuty**: - You must have a PagerDuty user license to use the integration. ## How It Works - Based on predefined rules set in Jira, when a PagerDuty incident performs a condition's action, a webhook is sent to Jira where it can create or update an issue. - When a Jira issue performs a predefined condition's action, a webhook is sent to PagerDuty where it can create or update an incident. ## Version This guide details configuration of the **[Jira Server V4.3.3](https://marketplace.atlassian.com/apps/1218226/pagerduty-for-jira-server-data-center/version-history)** integration. > **Looking for a Different Version?:** The [Jira Server v3](/integrations/jira-server/jira-server-v3) integration is also available. ## Integration Walkthrough ### In Jira Server 1. From the **Jira Administration** menu in the top right corner, click **Manage Apps**. 2. In the [Atlassian Marketplace](https://marketplace.atlassian.com/), search for **PagerDuty** and select the appropriate Jira Server download for your [service region](/get-started/service-regions): 3. **US Service Region**: [PagerDuty for Jira Server & Data Center](https://marketplace.atlassian.com/apps/1218226/pagerduty-jira-server-extension). 4. **EU Service Region**: [PagerDuty for Jira Server & Data Center (EU only version)](https://marketplace.atlassian.com/apps/1224902/pagerduty-for-jira-server-data-center-eu-only-version). 5. After installing, select **Manage Apps** from the left menu, select **PagerDuty**, and click **Configure**. 6. Click **Login with PagerDuty** and log in to connect your PagerDuty account. 7. Click **Connect Jira to PagerDuty** to open the next screen where you will configure your account. 8. Add the required fields for the Jira instance you are working in. Click **Save** when finished. - When entering URLs, always specify the protocol (`http` or `https`) in the field. If the protocol is not specified, the integration will use `http`. - **Authentication Requirements**: You must configure an integration user account in Jira with read/write access to all connected projects. This integration user can authenticate using one of two supported methods: - **Basic Authentication (Username/Password)**: Enter the integration user's Jira username and password directly into the configuration fields. - **Personal Access Token (PAT)**: Generate a Personal Access Token for the integration user in Jira, then paste the token into the designated field. > **SSO Not Supported:** SSO authentication is not supported. You must use either basic authentication credentials or a Personal Access Token for the integration user. #### Configure Automation Rules To configure automation rules via the PagerDuty web app, continue following the instructions below. To configure automation rules via API, see the [Jira Server Integration API documentation](https://developer.pagerduty.com/api-reference/YXBpOjI3NDgyNjk-pager-duty-jira-server-integration-api). 9. Configure automation rules to automatically trigger incidents, create issues, and keep status updates synchronized between PagerDuty and Jira. If you are already on the PagerDuty settings page, select the **Rules** tab and click **Create Rule**. If you are returning to configuration, navigate to **Manage Apps** → **PagerDuty** → **Configure** → **Rules** tab and click **Create Rule**. 10. Enter a **Rule name**, **Select PagerDuty service(s)**, **Select JIRA Project(s)**, **Select JIRA Issue Type(s)**, and optionally check the **Sync comments & notes** checkbox. 11. Check the following rule options based on your preferences: **Automatically create PagerDuty incidents from JIRA issues**: - **When issue matches JQL**: Enter your preferred JQL. Select whether you would like this rule to run **On issue create** and/or **On issue update**. - **Additional actions after incident is created** _(optional)_: Select your preferred actions. - Another form will auto-populate below, and you may choose to add multiple conditions based on your preferences. **Create JIRA issues from PagerDuty incidents**: - **Create issue when incident**: Select your preferred **incident action** that will generate a Jira issue. Optionally, specify the priority and/or urgency by selecting an option from the **AND priority is one of** and/or **AND urgency is** dropdowns. - **Create issue into project**: Select the **Jira project** where you would like PagerDuty incidents to generate Jira issues. Select the **Issue type** you would like generated, and if your Jira issue type has any required fields, set those required fields to populate by choosing **Additional actions on issue create (optional)**. - Another form will auto-populate below, and you may choose to add multiple conditions based on your preferences. **Automatically update Jira issue**: - **When PagerDuty incident has linked issue AND**: Select your preferred **incident action** that will update a Jira issue. Optionally, specify the priority and/or urgency by selecting an option from the **AND priority is one of** and/or **AND urgency is** dropdowns. - **Actions**: Select your preferred Jira issue action that will occur based on the condition specified above. - Another form will auto-populate below, and you may choose to add multiple conditions based on your preferences. **Automatically update PagerDuty incident**: - **When Issue status changes to**: Select your preferred **Jira status** that will update the PagerDuty incident. - **Actions**: Select your preferred **PagerDuty incident action** that will occur based on the condition specified above. - Another form will auto-populate below, and you may add multiple conditions based on your preferences. Click **Save** to save your rule(s). You should see the following webhook check dialog if the connection was successful:  *Webhook update summary* If you receive an unsuccessful webhook error, navigate back to the **Rules** tab and click **Check webhooks…** to troubleshoot the error. Once the webhook check has been successfully completed, proceed to the next section to link your PagerDuty and Jira accounts. #### Link PagerDuty and Jira User Accounts Linking PagerDuty and Jira user accounts allows the integration to identify which user changed an incident or issue. It also allows you to define who an incident or issue should be assigned to. If a user account is not linked and a Jira fallback user has not been configured (see step 17), the integration will not pick up those user-made changes. A Jira administrator can link user accounts, or individuals can link their own PagerDuty accounts between systems. - **To have a Jira administrator link the accounts**: Follow steps 14–17 below. - **To have individual users link their accounts**: Skip to step 18. 14. If you are still on the PagerDuty settings page, select the **User mapping** tab and skip to step 16. If you are returning to configuration, from the top right **Jira Administration** menu, select **Manage Apps**. 15. Select **Manage Apps** again from the left menu, click the **PagerDuty** add-on, then click **Configure**. 16. Under **PagerDuty settings**, click the **User mapping** tab and click **Link Users** to start mapping user accounts between systems. 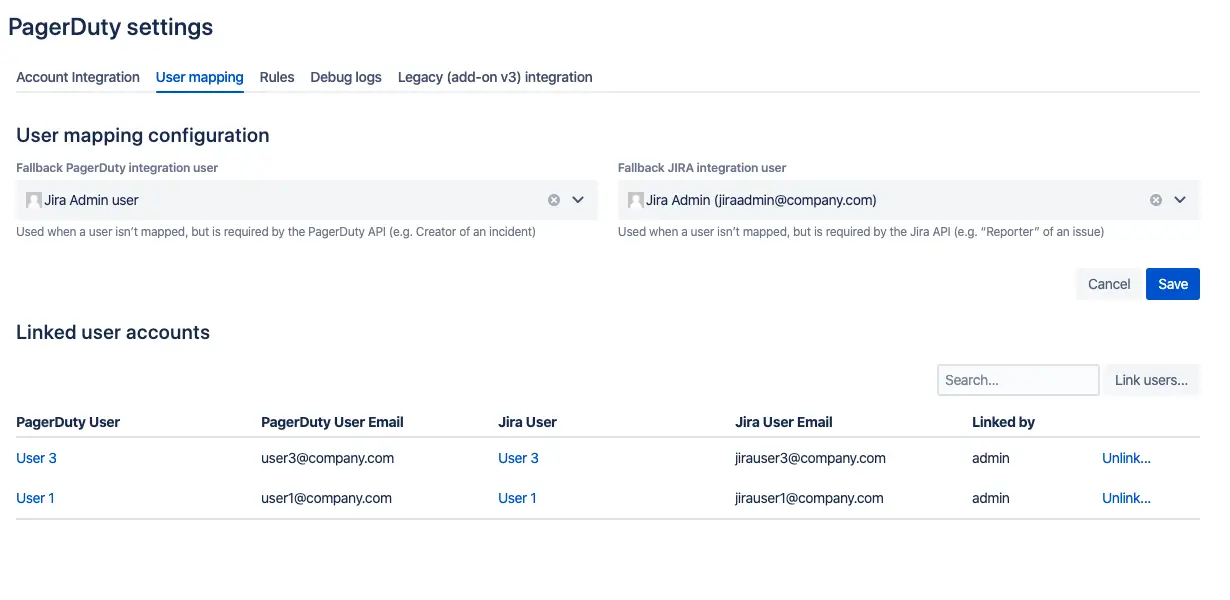 *User mapping configuration* 17. On this page you can also optionally map users based on email, and set a fallback user in the event that a user wants to take action on an incident but their account is not mapped. 18. **To have individual users link their accounts**, they will need to go to an issue in your Jira project and click the **Users** icon to link their user accounts. If the icon is orange, their user account is not linked. Once linked, the icon will appear grey. 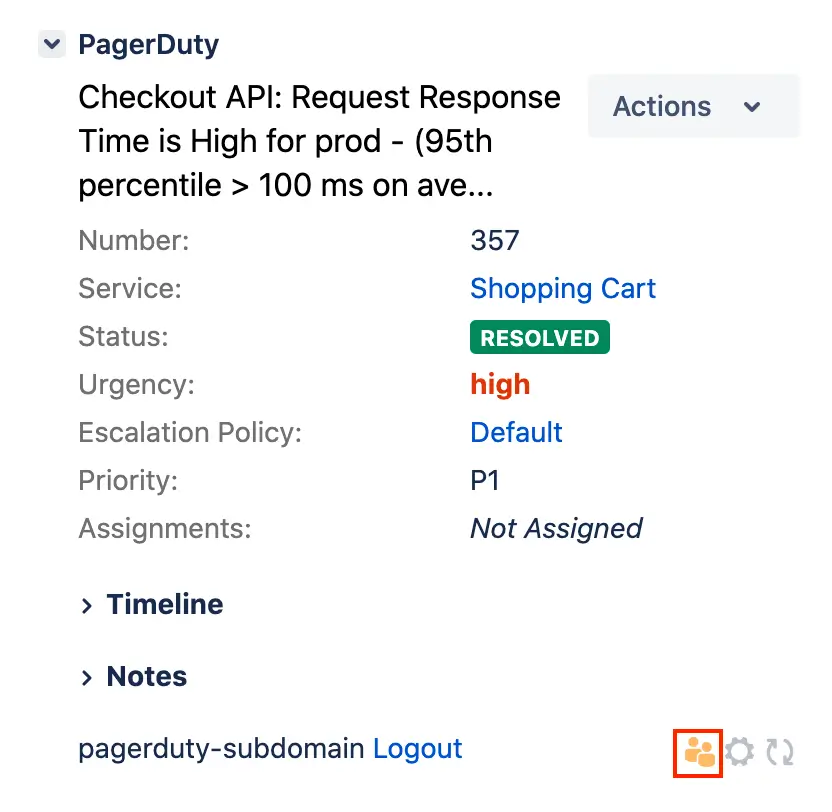 *Incident details* Once your Jira and PagerDuty accounts have been linked, the integration is complete. #### Connect Multiple PagerDuty Accounts To connect multiple PagerDuty accounts, navigate to the **Account Integrations** page and click **Logout** at the bottom of the page. Click **Login with PagerDuty** and log in on the screen that appears to connect your PagerDuty account. You will need to complete the [Integration Walkthrough](#integration-walkthrough) steps 1–3 and complete the [Link PagerDuty and Jira User Accounts](#link-pagerduty-and-jira-user-accounts) section again based on your secondary account information. #### Connect Multiple Jira Accounts To add another Jira account, log in to the secondary Jira instance and complete the [Integration Walkthrough](#integration-walkthrough) steps 1–13. ### Jira Service Management Required Steps 1. If you are integrating PagerDuty with Jira Service Management, ensure that the PagerDuty user account in Jira has the necessary permissions. 2. For each of your Service Desk projects, ensure that the PagerDuty user account has **Service Desk Team** access: - From the **Jira Administration** menu in the top right corner, click **Projects**. - Select your Jira Service Management **project**. - Click the **Users and roles** tab under the Project settings navigation bar. - Select the **Add users to a role** button. - Add the `jira-servicedesk-users` group or **PagerDuty** user to the **Service Desk Team** role. You can learn more about managing users and roles in [Atlassian's documentation](https://confluence.atlassian.com/adminjiracloud/managing-project-roles-776636382.html). ## Migrate from Jira Server to Jira Cloud No automatic migration path is available at this time. To migrate from Server to Cloud: 1. Follow the instructions to configure the [Jira Cloud integration](/integrations/jira-cloud) with the necessary service mappings. Test the flow by following the [Jira Cloud User Guide](/integrations/jira-cloud/jira-cloud-user-guide). 2. [Uninstall your Jira Server integration](#uninstall-jira-server) once you have configured the Jira Cloud integration. ## Uninstall Jira Server 1. Navigate to **Integrations** → **Extensions** and click **Jira Server Extension** to the right of your extension. 2. Click **How to Uninstall**, follow the instructions listed, and click **Delete Configuration**. ## FAQ **Is this integration bidirectional?** Yes, you can create Jira issues from PagerDuty incidents and PagerDuty incidents from Jira issues. **What if my Jira Server is behind a firewall?** To allow bidirectional integration between PagerDuty and your Jira Server, you may need to configure your firewall to allow incoming traffic from PagerDuty. See [Safelist IPs](/account-admin/safelist-ips) for more information. You specifically need to safelist IPs for PagerDuty [webhooks](/account-admin/safelist-ips#webhooks), the [REST API](/account-admin/safelist-ips#rest-api), and specific IPs for [Jira Server](/account-admin/safelist-ips#jira-server-integration). **Does the Jira Server integration support mandatory custom fields?** Yes, you can have PagerDuty populate mandatory Jira fields. You can define them while [configuring](#configure-automation-rules) the **Create Jira Issues from PagerDuty incidents** settings.  *Mandatory custom field configuration* **When testing, I don't see an incident or issue being created?** To troubleshoot, the Jira administrator can navigate to global settings , select **Manage Apps**, click the **PagerDuty** app, and click **Configure**. Select the **Debug logs** tab. With this window still open, open another tab or window in your browser and try to test the integration's workflow. Any errors or successes will appear in the debug logs as long as you keep the window open while testing. **When I update the PagerDuty incident's status, the Jira ticket isn't getting updated. What's happening?** This can happen for the following reasons: - The Jira project's workflow requires certain fields to be populated when setting it to that given state, and those fields are not populated. - The Jira project's workflow does not permit the transition between the issue states corresponding to the previous and current PagerDuty incident states. For instance, if your Jira workflow does not permit setting a **To-Do** status Jira ticket directly to **Done**, and the **Triggered** status in PagerDuty maps to **To-Do** while the **Resolved** status maps to **Done**, then if a triggered incident is resolved without acknowledging it first, the ticket will not move to the **Done** state because this modification is not permitted per your Jira project's configured workflow. One way to ensure the workflow configuration does not interfere is to edit the statuses corresponding to acknowledged and/or resolved, and enable transitions from all other statuses to it.  *Configure transition status* **I just updated the priority of a PagerDuty incident, why didn't the priority update in the Jira issue?** The Jira issue is only updated when the PagerDuty incident triggers an action that would trigger a v2 webhook. A full list of actions can be viewed in [the webhook documentation](/developer/webhooks-v2-overview#webhook-types). To request that PagerDuty trigger an action for PagerDuty incident priority changes, submit a feature request [with the Support Team](https://www.pagerduty.com/contact-us/#contact-support). **Can we turn off the PagerDuty sidebar app for projects that don't use PagerDuty?** You can disable the sidebar for a specific project by navigating to that project in Jira, clicking into **Project Settings** → **PagerDuty integration**, and toggling **off** next to **Show PagerDuty issue sidebar for this project**. **What happens to my workflow rules when I upgrade from another version to this version (4.x.x)?** If you upgrade from another version, all existing workflow rules are maintained in the PagerDuty web app. They will continue to use the PagerDuty integration user and can be edited in the PagerDuty web app. New rules can be created in Jira, and previously created rules will appear in a read-only format. To upgrade these rules to the v4 version, recreate them by [following steps 11–13](#configure-automation-rules). **What happens when the Jira user who set up the integration is removed from the Jira account?** You will need to reauthorize the integration by following steps 1–3 and steps 6–10 in the guide above. **In the Rules settings page, what happens if I use the toggle "Show PagerDuty sidebar on projects by default"?** When the toggle is switched to **OFF** for the first time: - The PagerDuty sidebar will continue to be displayed for connected projects. - The PagerDuty sidebar will be hidden for non-connected projects. - The PagerDuty sidebar will not be displayed for newly created projects until connected to a PagerDuty service or manually enabled in the project-level settings page. - A dialog box will appear to guide you through this bulk operation. When the toggle is switched to **ON**: - The PagerDuty sidebar will continue to be displayed for connected projects. - The PagerDuty sidebar will be displayed for non-connected projects. - New projects created after this operation will display the PagerDuty sidebar. When the toggle is switched to **OFF** for subsequent times: - The PagerDuty sidebar will continue to be displayed for connected projects. - The PagerDuty sidebar will be hidden for non-connected projects. - The PagerDuty sidebar will not be displayed for newly created projects until connected to a PagerDuty service or manually enabled in the project-level settings page. - A dialog box will not appear during this operation. **I have renamed a Jira Base URL in my Jira Server instance. How can I update the Jira Base URL on the PagerDuty side?** If you have renamed a Jira Base URL, or plan to do so, reach out to the [Support team](https://www.pagerduty.com/contact-us/#contact-support) to assist with the rename process. --- URL: https://docs.pagerduty.com/integrations/jira-server/jira-server-incident-workflow-action-user-guide # Jira Server Incident Workflow Action User Guide Automate Jira Server issue creation from PagerDuty incidents using Workflow Actions Learn how to use the [Jira Server: Create an Issue](/workflow-actions/jira-server/jira-server-create-an-issue-for-an-incident) Incident Workflow action. For more information on how to configure this workflow action, please see our [Incident Workflows](/ai-automation/automation/incident-workflows) article. > **Requirements:** - PagerDuty Account Owners and Global Admins can create and edit all Incident Workflows. > - Other users can edit workflows and triggers for services where they have Manager access. ## Create a Jira Issue With an Incident Workflow When a workflow’s conditions are met, this action creates a Jira Server issue using information provided during workflow configuration. The process begins with the integration validating the connection between Jira Server and PagerDuty, in addition to the following Jira Server information: - Jira Server project - Jira Server issue type - Jira Server issue fields It then sends an API request to create a Jira issue using the data provided in the workflow configuration form. Following a successful request, the integration will create a new **Open** issue in the associated project. ## Data Synchronization of Data The created Jira issue will sync with the linked PagerDuty incident if there are configuration rules in the Jira Service integration ruleset that match the same: - Jira project - Jira issue type - PagerDuty service ### Issue Creation and Field Population - When the workflow creates a Jira Server issue, the workflow’s configuration manages the initial issue creation and field population, rather than your existing Jira Server rules. - However, once it creates the issue, subsequent PagerDuty incident and Jira issue field synchronization is handled by the ruleset configured for that PagerDuty service, Jira project and Jira issue type. - In sum, the workflow handles the initial issue creation and field population, while synchronization depends on the Jira Server rules you have configured. Thus: - If no Jira Server rule exists for that PagerDuty Service, Jira Project, and Jira issue type, the workflow will still create the Jira issue and populate fields according to workflow configuration. - However, without a corresponding ruleset, there will be no synchronization between the newly created Jira issue and the corresponding PagerDuty incident. ### Avoid Overwriting Issue Fields and Duplicate Jira Issues When both the workflow and a Jira Server rule target the same issue field, the workflow will initially populate the field during issue creation. However, if you also have a PagerDuty service, Jira project and Jira issue type rule that populates the same field, it will overwrite it. To avoid unintended field overwrites, review your rule issue field targets to ensure they don’t conflict with the issue fields in your workflow. To avoid duplicate Jira issues, we recommend checking the **Сreate Jira issues from PagerDuty incidents** section in the rule. This confirms that there are no create issue actions configured on the same PagerDuty service and Jira project as your workflow. ## After the Workflow Executes > **Limit:** There is a maximum of 50 linked issues across all integrated applications. Additionally: > > - The Jira issue link will display on the incident details page in PagerDuty as an external reference (Linked Records) field. > - A workflow log entry will appear on the incident timeline, indicating the workflow and issue creation status. > - The linked Jira issue will include linked PagerDuty incident details, along with the incident link. Users can reference this information in the PagerDuty sidebar. ## Populate Jira Issue Fields The workflow action supports both standard and custom Jira fields. You can send any value accessible from the configuration form to Jira. Once you select a Jira field, the dropdown menu will display all of the compatible PagerDuty fields. In your workflow, click **Add Jira Fields** to select the Jira issue field that you want to populate upon Jira issue creation. You will then receive a prompt to select the PagerDuty incident field that should be used to populate the issue field. ## Field Mapping | PagerDuty Fields | Jira Issue Fields | | :---------------------- | :------------------------------------------------------------- | | PagerDuty text | Jira short text, paragraph (but no rich editor support), label | | PagerDuty integer | Jira integer | | PagerDuty URL | Jira URL | | PagerDuty multi-select | Jira checkbox | | PagerDuty single-select | Jira radio button, select list (single choice) | | PagerDuty datetime | Jira date time picker | | PagerDuty assignee | Jira assignee (user picker) | --- URL: https://docs.pagerduty.com/integrations/jira-server/jira-server-troubleshooting-guide # Jira Server Troubleshooting Guide Troubleshoot IP safelisting, connection credentials, and user mapping issues specific to the Jira Server and Data Center integration setup. ## Pre Checks ### 1. IP Safelisting Requirements Before starting the troubleshooting process, please ensure that the required PagerDuty IP addresses have been safelisted. - [REST API IPs](/developer/rest-api-ips) - [Webhook IPs](/developer/webhook-ips) - [Jira Server Integration](/account-admin/safelist-ips#jira-server-integration) ### 2. Jira Server Compatibility Requirements Your Jira Data Center/Jira Server version should be compatible with the integration version you have installed. For more information, please reference the compatibility table linked below. - [PagerDuty for Jira Server & Data Center](https://marketplace.atlassian.com/apps/1218226/pagerduty-for-jira-server-data-center/version-history) ### 3. Connection Credentials In Jira, navigate to the PagerDuty application under **Administration** → **PagerDuty settings** → **Account Integration** tab. The credentials must be valid for the PagerDuty and Jira connection. - For URLs, be sure to specify http or https in the field. If the protocol is not specified, the integration will use HTTP. - The user credentials should have read/write access to the connected projects and they should be basic authorization credentials (i.e., username and password), not SSO. - The REST API Key should be a full access key (i.e., not a read-only API key). 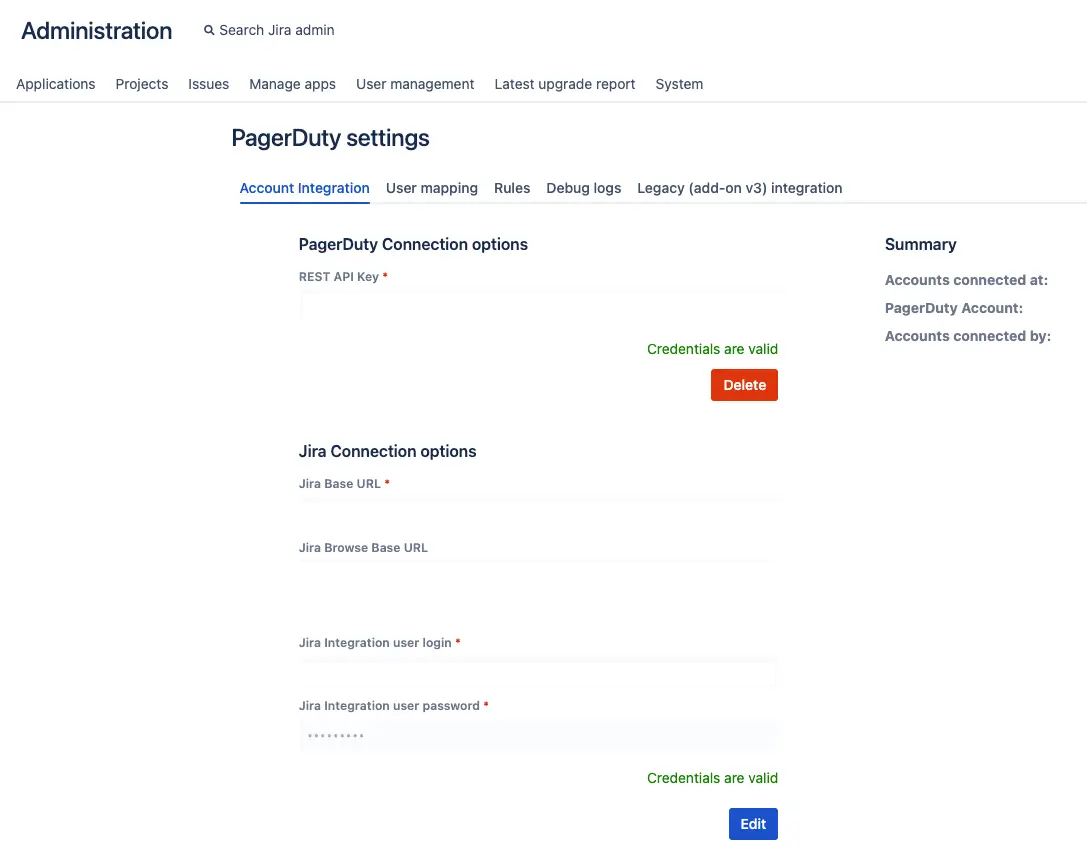 ## General Troubleshooting 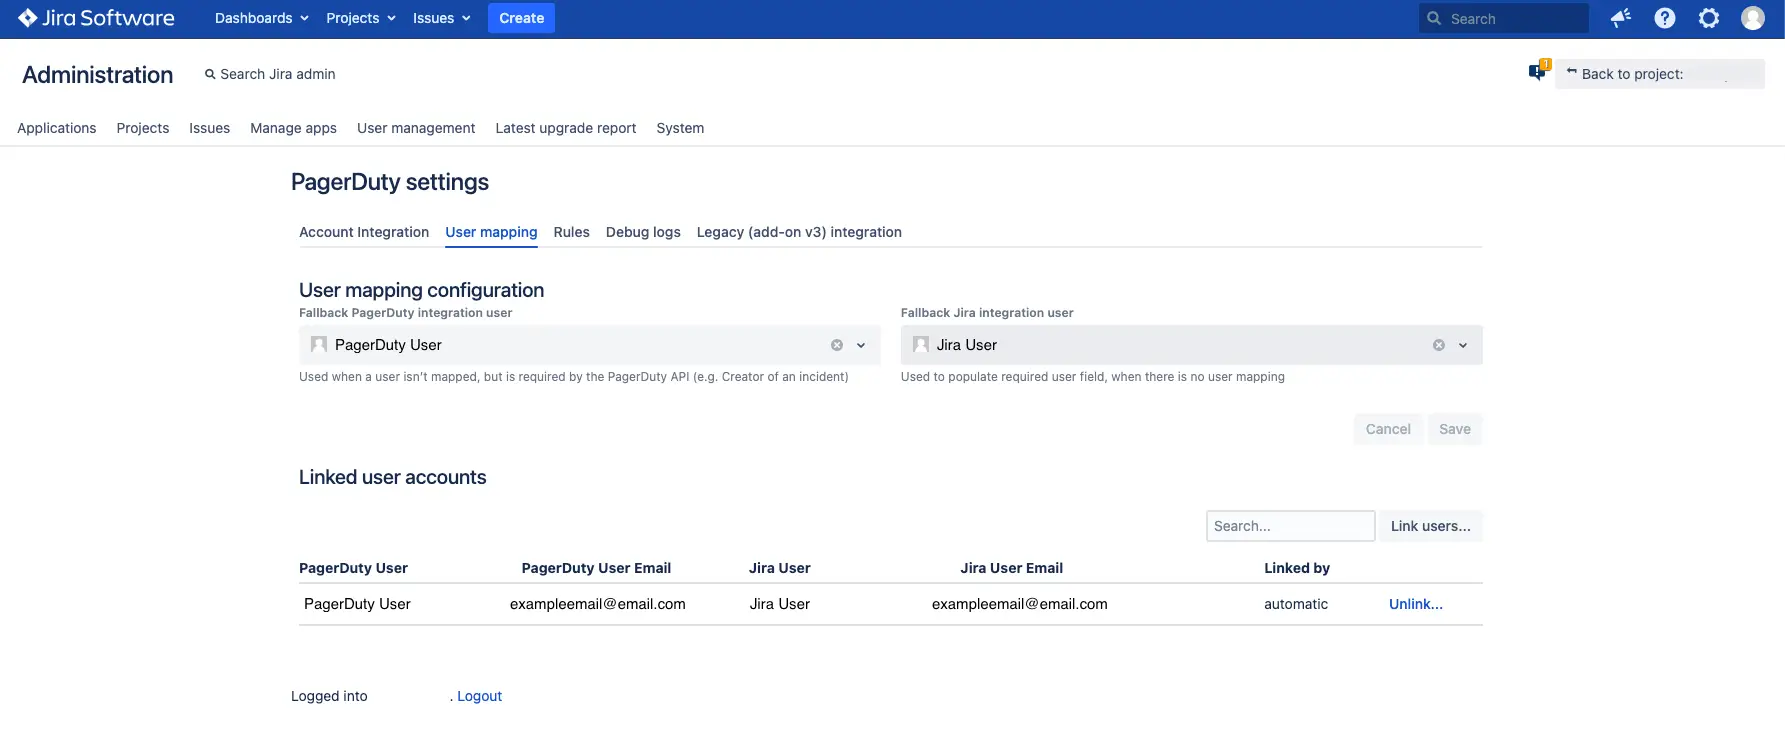 In Jira, under the **User mapping** tab: - There should be a fallback user mapping in the **User mapping configuration** section, in case the Jira action/PagerDuty action cannot be attributed to a linked user account. If the issue persists after completing the pre-checks and general troubleshooting steps, please refer to the following section for more specific troubleshooting steps. ## Troubleshoot Common Jira Server Issues ### PagerDuty Incident did not Create a Jira Issue **1. Project Permissions**   In your Jira project settings, navigate to **Permissions**. In the permission scheme verify which users, groups, and roles can create issues within the project. - Has your Jira admin assigned the **create issues** permission to the Jira integration user or their group? Alternatively, do they have a project role that has permissions to create issues? **2. Issue Types**  In your Jira project settings, navigate to **Issue types**. In the issue types scheme, confirm which issue types are available for your project. **3. Required Fields**  In your project settings, navigate to **Fields**. - In the fields scheme, check which fields are available for the affected issue type. - In the fields scheme, check which fields are required/mandatory for the affected issue type. **4. Check Webhooks**  On Jira's mapping **Rules** page, confirm that there is a mapping connecting the Jira project to a PagerDuty service. Next, check that the connection is enabled.  Click **Check webhooks** to the right of the mapping **Rules** page. Select the options above, **Fix missing or useless webhooks** and **Both Jira and PagerDuty webhooks**, to fix broken/invalid webhooks, then run the check. **5. Mapping Rules**  Locate the rule connecting the PagerDuty service to your Jira project. Scroll down to the **Create Jira issues from PagerDuty incidents** section. - Confirm the rule is configured to create a Jira issue when a PagerDuty incident is triggered. - The PagerDuty incident should match the priority and urgency conditions. If this option is not enabled, responders will have to manually trigger incidents from the incident page by selecting **Create Jira Issue** from the **More** dropdown.  If the project has required/mandatory fields for that issue type: - Your Jira administrator can populate custom fields with a default value: - [Set the default value for a custom field](https://support.atlassian.com/jira-cloud-administration/docs/configure-a-custom-field/#Set-the-default-value-for-a-custom-field) - You can add an action to map Jira fields to a PagerDuty incident attribute.  **6. Additional Checks** - The PagerDuty attribute should match the data type expected for the Jira field. - Your Jira administrator can check if there are any conflicting automations configured to process incoming webhooks, or handle automatic issue creation. ### Jira Issue did not Trigger a PagerDuty Incident **1. Check Webhooks**  On Jira's mapping **Rules** page, confirm if there is a mapping between the Jira project and the PagerDuty service. Next, check that the connection is enabled.  Click **Check webhooks** to the right of the mapping **Rules** page. Select the options above, **Fix missing or useless webhooks** and **Both Jira and PagerDuty webhooks**, to fix broken/invalid webhooks, then run the check. **2. Mapping Rules**  Locate the rule connecting the PagerDuty service to your Jira project. Scroll down to the section **Automatically create PagerDuty incidents from Jira issues**. - Confirm that the Jira issue matches the project and issue type defined in your rule. - Copy the JQL statement, and search for Jira issues matching the condition. Does the Jira issue appear in the search results as expected? - Verify that **On issue create** is selected. If **Automatically create PagerDuty incidents from Jira issues** is not enabled, responders will have to manually trigger a PagerDuty incident from the PagerDuty app in the issue sidebar. - [Issue Context](https://developer.atlassian.com/cloud/jira/platform/modules/issue-context/) ### PagerDuty Incident Status and Jira Issue Status did not Sync **1. Mapping Rules**  Locate the rule connecting the PagerDuty service to your Jira project. Scroll down to the section **Automatically update Jira Issue**. - Confirm there is an action mapping the PagerDuty incident status to the Jira issue status. Scroll down to the section **Automatically update PagerDuty incident**. - Confirm there is an action mapping the Jira issue status to the PagerDuty incident status. The PagerDuty application cannot transition issues/incidents to or from statuses that are not mapped in your rule. **2. Issue Workflow**   In your Jira project settings, navigate to **Workflows**. - There should be a workflow scheme associated to the issue type. - Check if there is a workflow transition for that project and issue type, which would allow the issue to transition directly from the current status to the desired status. **3. Additional Checks** **In PagerDuty:** - On the incident page, confirm if the Jira issue is linked to the PagerDuty incident. The Jira issue must be linked to the incident in order to sync the incident record between the two platforms.  **In Jira:** - Your Jira administrator can check if there are any conflicting automations transitioning the Jira issue to a different status than the one you expected. - Your Jira administrator can check if there are any conflicting automations transitioning the Jira issue to an unmapped status. ### TLS Certificate Errors **1. Troubleshooting TLS Certificate Errors** Most commonly, TLS certificate errors occurs when: - A certificate in the chain has expired. - The certificate being used is self-signed or from an issuer not trusted by PagerDuty. - The certificate chain is out of order. - There is a duplicate certificate in the certificate chain. PagerDuty expects all certificates in the chain to be active, sent in the correct order (with no duplicates) and signed by a trusted root. The below openssl command, or a tool like [SSL Labs](https://www.ssllabs.com/ssltest/), may be helpful in identifying issues with the certificate chain. Please note that the port for your Jira instance may be different from the default `443` used in the example below: ```shell openssl s_client -connect
Must have permission to manage the incident in PagerDuty. | | For responders and the account administrator | Must have their PagerDuty and Microsoft Teams accounts linked. | > **Tip:** For best results, at least one organizer should have their PagerDuty and > Microsoft Teams accounts linked. If no linked accounts are found, PagerDuty > tries to match users by email, as long as the _User.ReadBasic.All_ permission > has been granted. **How are responders added?** PagerDuty uses one of the following methods to add responders: - **Linked accounts** (preferred): If a responder has linked their PagerDuty and Microsoft Teams accounts, PagerDuty adds them directly using their Microsoft Teams identity. - **Email lookup** (fallback): If the responder's accounts are not linked, PagerDuty retrieves their email address from PagerDuty and searches for them in Microsoft Teams using that email address. **How do I change the fallback user?** There are two ways to control who acts as the organizer, depending on the scenario. **Option 1: Set a default organizer in the Incident Workflow action** For meetings and chats created through Incident Workflows, select a default organizer directly in the workflow action configuration. That user is tried first as the organizer instead of the incident assignee. This is the simplest option when the trigger is an Incident Workflow. **Option 2: Re-authorize the integration** For scenarios where a default organizer cannot be set — for example, a user clicking **Create Meeting** in Teams — the last-resort fallback is the PagerDuty administrator who authorized the integration. To change that person: 1. Have the new desired fallback user navigate to the Microsoft Teams public channel where PagerDuty is connected. 2. Type `@PagerDuty authorize` in the channel. 3. A direct message from the PagerDuty bot appears with an **Authorize** button. Click **Authorize**. 4. A browser window opens. Log in with the new fallback user's PagerDuty admin credentials. 5. Repeat these steps for each Microsoft Teams workspace connected to your PagerDuty account. > **Note:** You do not need to disconnect the app. Your existing configuration is > preserved. --- URL: https://docs.pagerduty.com/integrations/nagios-troubleshooting-guide # Nagios Troubleshooting Guide Diagnose common Nagios integration failures across Perl-based, agent-based, and bi-directional configuration types on your host. This guide addresses common issues related to the Nagios integration. Depending on your integration type, you may run into errors specific to your environment: - [General Configuration](#general-configuration) - [Perl-Based Integration](#section-perl-based-integration) - [Agent-Based Integration](#section-agent-based-integration) - [Bi-Directional Integration](#section-bi-directional-integration) ## General Configuration If Nagios notifications are not triggering PagerDuty incidents as expected, the following items apply to all integration types. ### Your Nagios host or service may not be reaching a HARD down state Events are only sent to PagerDuty when your service or host changes state to `HARD`. Typically, a host or service will first enter a `SOFT` state, and only transition to `HARD` after it reaches its `max_check_attempts` limit. For more information, please see Nagios’ [State Types](https://assets.nagios.com/downloads/nagioscore/docs/nagioscore/3/en/statetypes.html) documentation. To verify whether this is happening: 1. Check your logs. - **Debian/Ubuntu**: `/var/log/syslog` - **RHEL/CentOS**: `/var/log/messages` 2. Run `grep pagerduty
| Action | Instructions |
|---|---|
| [Acknowledge](/incident-management/incidents/overview#incident-statuses) | Click **Acknowledge** in the prompt that appears. |
| [Resolve](/incident-management/incidents/overview#incident-statuses) | Enter a **resolution note** and click **Resolve Incident**. |
| [Edit Incident Details](/incident-management/incidents/edit-incidents) | Edit the PagerDuty incident's title or [incident priority](/incident-management/incidents/incident-priority) and click **Update incident**. |
| [Add Responders](/incident-management/incidents/add-responders)\* | Select responders and/or escalation policies: - **Responders to notify**: Search and select **user(s)** to add as responder(s), if applicable. - **Escalation policies to apply**: Search and select **escalation policy(ies)** to add as responder(s), if applicable. - **Message** _(optional)_: Enter an optional **message**. Click **Add Responders**. |
| [Add Subscribers](/incident-management/services/business-services/subscription#subscribe-users-and-teams-to-incidents)\* | Select users and/or Teams to add as subscribers: - **Select users to add as subscribers**: Search and select **user(s)** to add as subscriber(s), if applicable. - **Select teams to add as subscribers**: Search and select **Team(s)** to add as subscriber(s), if applicable. Click **Add Subscribers**. |
| [Send a Status Update](/incident-management/communicate/communicate-with-stakeholders#status-updates)\* | Enter a **status update message** in the **New status update** field and then click **Send Update**. |
| [Run an Incident Workflow](/ai-automation/automation/incident-workflows)\* | Select an **Incident Workflow** from the dropdown and then click **Run**. |
| [Run Automation Actions](/ai-automation/automation/automation-actions) | Select an **Automation Action** from the **Select an Automation Action** dropdown and then click **Run Action**. |
| [Escalate](/incident-management/incidents/reassign-incidents#escalate-an-incident) | Select a **user** from the **Select who to escalate this incident to on** `[ESCALATION-POLICY]` dropdown and click **Escalate**. |
| [Add Note](/incident-management/incidents/edit-incidents#add-a-note-to-an-incident) | Enter a **note** in the **Add a note** field and then click **Add Note**. |
| [Reassign](/incident-management/incidents/reassign-incidents#reassign-an-incident) | Select the radio button for the following based on your preference: - **Users**: Search and select the **user(s)** you would like to reassign the incident to. - **Escalation Policy**: Search and select the **escalation policy** you would like to reassign the incident to. |
| Unlink incident | In the prompt that appears, click **Unlink Incident**. |
- **PagerDuty users to add as responders**: Search and select **user(s)** to add as responder(s), if applicable.
- **PagerDuty Escalation Policies to apply**: Search and select **escalation policy(ies)** to add as responder(s), if applicable.
- **Message (optional)**: Enter an optional **message**. Click **Add Responders**. | | [Add Subscribers](/incident-management/communicate/communicate-with-stakeholders#add-subscribers-to-an-incident)\* | Select users and/or Teams to add as subscribers:
- **Select PagerDuty users to add as subscribers**: Search and select **user(s)** to add as subscriber(s), if applicable.
- **Select PagerDuty teams to add as subscribers**: Search and select **Team(s)** to add as subscriber(s), if applicable. Click **Add Subscribers**. | | [Send a Status Update](/incident-management/communicate/communicate-with-stakeholders#status-updates)\* | Select a **status update template**:
- Enter a **message** that will send to responders and add to the status dashboard and the email template.
- View the **email preview**. Click **Send Update**. | | [Run an Incident Workflow](/ai-automation/automation/incident-workflows)\* | Select an **Incident Workflow** from the dropdown and click **Run**. | | [Escalate](/incident-management/incidents/reassign-incidents#escalate-an-incident) | Select a **user** to notify from the Escalation Policy and then click **Escalate**. | | [Add Note](/incident-management/incidents/edit-incidents#add-a-note-to-an-incident) | Enter a **note** in the field and then click **Add Note**. | | [Reassign](/incident-management/incidents/reassign-incidents#reassign-an-incident) | Select the radio button for the following based on your preference:
- **Users**: Search and select the **user(s)** you would like to reassign the incident to.
- **Escalation Policy**: Search and select the **escalation policy** you would like to reassign the incident to. Click **Reassign**. | | Unlink incident | Select → **Unlink**. In the confirmation modal, click **Unlink**. | ## Status Dashboard Console The Status Dashboard console is where you can: - View the status of incidents impacting [business services](/incident-management/services/business-services). If there are any incidents impacting a business service, you will see a red banner detailing how many business services are disrupted. - Manage subscriptions to incidents. - Link incidents to ServiceNow records.  > **Pricing Plans:** The [Internal Status Page](/incident-management/communicate/internal-status-page) feature is available on the following pricing plans: Customer Service Business and Customer Service Digital Operations (legacy) and Enterprise for Customer Service. Please [contact our Sales Team](https://www.pagerduty.com/contact-sales/) if you would like to upgrade to a plan including the Internal Status Page feature. To view the Status Dashboard console: 1. Navigate to a ServiceNow record and select the **PagerDuty Widget** from the far right icon menu. 2. Select the **Status Dashboard** tab on the PagerDuty console to view the [Internal Status Page](/incident-management/communicate/internal-status-page). ### Status Dashboard Actions To take action upon PagerDuty incidents from the Status Dashboard console: 1. Navigate to a ServiceNow record and select the **PagerDuty Widget** from the far right icon menu. 2. Select the **Status Dashboard** tab on the PagerDuty console and **select a business service** to expand its incidents. 3. Click to the right of your desired incident and use the instructions to perform any of the following actions: | Action | Instructions | | :-------------------------------------------------------------------------------------------------------------------------------------------------------------------- | :--------------------------------------------------------------------------------------------------------------------------------------------------------------------------------------------------------------------------------------------------- | | [Subscribe](/incident-management/services/business-services/subscription#subscribe-to-incidents-in-the-web-app) to the PagerDuty incident | Select → **Subscribe to this incident**. You will see **Subscribed**, indicating that you are subscribed to receive status updates for this incident. | | [Unsubscribe](/incident-management/services/business-services/subscription#unsubscribe-via-incident-details-page-in-the-web-app) from the PagerDuty incident | Select → **Unsubscribe from this incident**. | | Link a PagerDuty incident to a ServiceNow record | Select → **Link this incident to a record**. You will see **Linked**, indicating that the PagerDuty incident and ServiceNow record are linked. You may link an incident to more than one ServiceNow record. | | Unlink a PagerDuty incident from a ServiceNow record | Select → **Unlink this incident from this record**. | | View Status Dashboard | At the bottom of the Status Dashboard console, you will see a **View Status Dashboard** button that links to the corresponding [Internal Status Page](/incident-management/communicate/internal-status-page) in the PagerDuty web app. | ### Switch Status Dashboard If your account has [configured more than one status dashboard](/incident-management/communicate/internal-status-page#create-custom-dashboards), you can easily switch between them. 1. Navigate to a ServiceNow record and select the **PagerDuty Widget** from the far right icon menu. 2. Select the **Status Dashboard** tab on the PagerDuty console and click → **Switch Status Dashboard**.  3. In the modal that appears, select a **status dashboard** from the dropdown. 4. Click **Apply**. --- URL: https://docs.pagerduty.com/integrations/servicenow-integration-details-v7 # ServiceNow v7 Integration Details An overview of the ServiceNow v7 integration with PagerDuty and how it works ServiceNow is a powerful platform-as-a-service, which offers advanced automation and process workflow for the enterprise environment. We offer the following resources to assist with installing, customizing and troubleshooting your ServiceNow integration: - **Installation**: For installation instructions, please refer to the ServiceNow v7 Provisioning guide. - **Advanced Configuration**: For more in-depth information about customizing how the ServiceNow integration behaves, please refer to [Advanced ServiceNow Configuration](/integrations/servicenow-integration-guide/advanced-servicenow-configuration). - **FAQ**: Answers to frequently asked questions are found in [ServiceNow v7 Frequently Asked Questions](/integrations/servicenow-v7-faq). - **Troubleshooting**: For a guide to addressing some common issues, see the [ServiceNow v7 Troubleshooting Guide](/integrations/servicenow-troubleshooting-guide-v7). This article is an overview of the components and concepts that drive the ServiceNow + PagerDuty integration, and will give you a deeper understanding of how the integration works at a fundamental level. > **Unsupported Changes:** If you modify any core components of the integration, application upgrades may not work as expected. Customizations are generally not supported by PagerDuty. ## Introduction With the ServiceNow + PagerDuty integration, you can leverage PagerDuty's robust event management, on-call scheduling, escalation and notification functionality and keep PagerDuty incidents in sync with your ServiceNow tickets. In ServiceNow Enterprise, the source code for many of the integrated PagerDuty app's components is not only visible, but can also be modified. All of the source code that performs the actions underpinning the integration is written in JavaScript, and can be viewed by going to the **Advanced** section or tab of any component's view. The application's components can be accessed by going to **PagerDuty** → **Configuration** → **Configuration files**. There you will find a page with the following tabs: - Business Rules - Script Actions - Script Includes - UI Actions - Processors - UI Pages - Macros - Application Files ## Terminology ### Assignment versus Escalation The term **assignment** has a slightly different meaning in PagerDuty than it does in ServiceNow. When an incident is assigned to a user in PagerDuty, it is escalated to them and they are the agents who will be notified. When an incident is first triggered, it is considered to be assigned to the first targets in the escalation policy until escalated. However, it will not assign the incident to anyone in ServiceNow until someone acknowledges it, in which case the corresponding ServiceNow incident will be assigned to them. When an incident in ServiceNow is assigned to a user, that similarly escalates the incident to that user in PagerDuty. The integration will also assign the ServiceNow incident to the user who acknowledged it in PagerDuty, since it is assumed that the user who acknowledged it is the one who will be working on it. ### Provisioned versus Linked The term **provisioned** refers to when the item in ServiceNow has an analogous record in PagerDuty, identified by one or more metadata fields, referred to as the **integration fields**. An incident is considered **linked** if it is associated with a PagerDuty incident, in which case its status, work notes and other information pertaining to the incident can be [synchronized between systems](#bidirectional-synchronization). ## Core Components Most of the tasks performed to synchronize data between PagerDuty and ServiceNow are executed in the following application files, under *Script Includes*: - **PagerDuty:** Utilities for obtaining PagerDuty metadata, and functions for performing actions on incidents, i.e., assigning to a user, synchronizing work notes, and triggering new incidents. - **PagerDutyInbound:** Functions that handle receipt and processing of webhooks from PagerDuty - **PagerDutyProvisioning:** Handles the creation of objects in PagerDuty from ServiceNow, or in the case of users, finding existing ones that match analogous ones in ServiceNow. - **PagerDuty_REST:** Core functions for making REST API requests, and in version 3.2.1 and earlier, Events API requests. Each of the above defines a class constructor named after the script include. Methods of these classes are called throughout the rest of the application. Another important file, which handles the importing of webhook data into ServiceNow incidents, is the **PagerDuty Webhook Import** Table Transform Map, which can be found under the *Application Files* tab. ### Troubleshooting With Verbose Logging To get the most detailed insight into script behavior, in ServiceNow go **PagerDuty** → **Configuration** → **PagerDuty Settings** and set **Logging verbosity level** to **debug**. With this setting selected, each call to `gs.debug` in the script source will show up in the application-scope logs, which can be viewed under **PagerDuty** → **Support** → **Logs**. ## Bidirectional Synchronization The integration uses a number of features to keep objects between PagerDuty and ServiceNow in sync: - [Provisioning: Linking Objects Between Systems](#provisioning-linking-objects-between-systems) - [Business Rules: ServiceNow to PagerDuty](#business-rules-servicenow-to-pagerduty) - [Webhook Import: PagerDuty to ServiceNow](#webhook-import-pagerduty-to-servicenow) - [Work Note Synchronization](#work-note-synchronization) ### Provisioning: Linking Objects Between Systems For any user or assignment group or Configuration Item (CI) in ServiceNow to be recognized by the integration, it must be provisioned. Objects can be provisioned by clicking **Provision PagerDuty Service** or **Provision PagerDuty User** under **Related Links** in the view of the user, group or Configuration Item, or by selecting several from the list view and choosing the option to provision them under the menu **actions on selected rows**. This process will make the necessary REST API calls in the `PagerDutyProvisioning` object. Note the ID of the created (or existing) records, and save them in one of the following fields, depending on the object's type: - [User](#user) - [Assignment Group](#assignment-group) - [Configuration Item](#configuration-item) #### User | Field | Description | | :------------------------------------------------ | :------------------------------------------------------------------------------------------------------------------------------------------------------------------------------------ | | **PagerDuty ID**, `x_pd_integration_pagerduty_id` | ID of a user in PagerDuty. When provisioning, if a user with identical login email to the user being provisioned is found, that user will be used, rather than creating a new user. | #### Assignment Group | Field | Description | | :----------------------------------------------------------------------------------------- | :--------------------------------------------- | | **PagerDuty escalation**, `x_pd_integration_pagerduty_escalation` | ID of an escalation policy in PagerDuty. | | **PagerDuty service**, `x_pd_integration_pagerduty_service` | ID of a service in PagerDuty. | | **PagerDuty webhook**, `x_pd_integration_pagerduty_webhook` (integration v3.5 and later) | ID of the extension on the PagerDuty service. | #### Configuration Item | Field | Description | | :----------------------------------------------------------------------------------------- | :--------------------------------------------- | | **PagerDuty service**, `x_pd_integration_pagerduty_service` | ID of a service in PagerDuty. | | **PagerDuty webhook**, `x_pd_integration_pagerduty_webhook` (integration v3.5 and later) | ID of the extension on the PagerDuty service. | #### Auto-Provision Users Since version 3.2.1, users in PagerDuty can optionally be provisioned as ServiceNow users, or, in cases where they provision an assignment group, the ServiceNow user's record will be linked to a PagerDuty user if one exists with the same email address. The user performing the provisioning is also auto-provisioned and then automatically added as the initial member of the newly-generated escalation policy in PagerDuty. #### Special Integration Field Usage For the bidirectional integration to function properly, the following is how the fields are used: - **Service**: When a ServiceNow incident triggers a PagerDuty incident, the assignment group's **Service** is used to tell which PagerDuty service to trigger it on. - **Escalation**: When an incident in PagerDuty opens a ServiceNow incident via webhook, the integration uses the assignment group's **Escalation** field. We do not recommend associating multiple ServiceNow groups with the same escalation policy. This is because if the webhook transform map finds more than one assignment group with the same escalation policy ID, it will assign the ServiceNow incident to the first assignment group whose `x_pd_integration_pagerduty_escalation` column value matches the escalation policy ID in the webhook. Conversely, it is possible to manually associate an assignment group with multiple services which all use the same escalation policy and have the integration work smoothly. This is because it identifies the assignment group by escalation policy ID, and there's one escalation policy for all the services, so the service ID has no bearing in this part of the process (see [Webhook Import: PagerDuty to ServiceNow](#webhook-import-pagerduty-to-servicenow)). In the opposite direction, ServiceNow incidents can only trigger incidents in PagerDuty on one service, i.e., the service whose ID is stored in the assignment group's **PagerDuty Service** field. One can find any PagerDuty object's ID by going to its detailed view page in the PagerDuty web app and looking at the URL in your web browser's address bar. The ID should be a string of uppercase alphanumeric characters beginning with `P` (e.g., `PXXXXXX`), and will be near the end of the URL. Using this method, you can manually provision objects by setting the appropriate fields in the corresponding ServiceNow objects' records. ### Business Rules: ServiceNow to PagerDuty All aspects of the integration that concern any flow of data from ServiceNow to PagerDuty are handled by business rules. Business rules begin when an event, such as an insertion, update or deletion, takes place on an incident. If the conditions of a business rule are met, the rule and its associated script are run, which invokes a transaction with the PagerDuty API to perform the necessary actions in PagerDuty. For more information about ServiceNow business rules, we recommend the following resources, provided by ServiceNow: - [Business Rules](https://developer.servicenow.com/dev.do#!/learn/courses/sandiego/app_store_learnv2_scripting_sandiego_scripting_in_servicenow/app_store_learnv2_scripting_sandiego_server_side_scripting/app_store_learnv2_scripting_sandiego_business_rules) (developer documentation) - [Business rules](https://docs.servicenow.com/bundle/paris-application-development/page/script/business-rules/concept/c_BusinessRules.html) (product documentation) #### How PagerDuty Incidents Trigger As an example, the event named `x_pd_integration.trigger_incident`, handled by the **PagerDuty Trigger Incident** script action, is raised by one of the following business rules: - **PD Trigger PagerDuty Incident:** By default, this runs when ServiceNow creates an incident that has no corresponding PagerDuty incident, and it is assigned to a PagerDuty-linked group, has Priority 1 or 2, or an existing incident has its priority updated to 1 or 2. You can adjust this behavior to include a wider range of priorities: [When is an incident sent to PagerDuty?](/integrations/servicenow-v7-faq#when-is-an-incident-sent-to-pagerduty). - **PD Group Assign Trigger New Incident:** An existing incident that was previously tied to a PagerDuty incident, but that was "unlinked" after assigning it to an un-provisioned assignment group (per the business rule **PD Unlink if not PagerDuty group**). The setting **Choose ServiceNow to PagerDuty mapping** dynamically tests whether the assignment group and/or Configuration Item are provisioned. For more information, see the section ["When is an incident sent to PagerDuty?"](/integrations/servicenow-v7-faq#when-is-an-incident-sent-to-pagerduty). To recap, the integration selects the PagerDuty service to trigger an incident on based on the value of the ServiceNow incident assignment group's **PagerDuty Service** field. If the ServiceNow incident is associated with a Configuration Item, the integration uses the value specified in the field **Default PagerDuty Service ID** to determine which PagerDuty service to trigger an incident on. You can test this in the **PagerDuty** Script Include, in the function `PagerDuty.triggerIncident`. #### How PagerDuty Incidents Resolve The following business rules resolve PagerDuty incidents from ServiceNow: - **PD Resolve PagerDuty Incident:** The incident's **State** field must change to 6 or 7 (resolved/closed) and the incident must be linked. This raises the `x_pd_integration.resolve_incident` event, handled by the **PagerDuty Resolve Incident** script action. The call to `PagerDuty.resolveIncident` resolves the incident. - **PD Unlink if not PagerDuty group:** If a linked incident is assigned to a non-provisioned assignment group, it is assumed that it will be handled outside of the PagerDuty incident response process. With that in mind, the PagerDuty incident will be resolved. This process happens as follows: 1. The **PagerDuty Incident** field on the ServiceNow incident record is set to `---unlinked---`. 2. This activates the business rule **PD Resolve Incident on Unlink**. **PD Resolve Incident on Unlink** raises the `x_pd_integration.resolve_on_unreference` event, handled by the **PagerDuty Resolve on Unreference** script action. The **PagerDuty Resolve on Unreference** calls `PagerDuty.resolveOnUnreference` to resolve and post a worknote to the PagerDuty incident, indicating its resolve reason. #### Reassignment Incidents in ServiceNow, when assigned to a user or assignment group, may trigger one of the following business rules: - **PD User Assign:** If a provisioned user is assigned a linked incident, this escalates the PagerDuty incident to the user in PagerDuty, by raising the `x_pd_integration.assign_incident_user` event, which is handled by the **PagerDuty User Assign Incident** script action. This action calls the function `PagerDuty.assignIncidentToUser`. - **PD Group Policy Assign:** If a linked incident's assignment group changes, and the new assignment group is provisioned, the corresponding PagerDuty incident will be assigned to the escalation policy in PagerDuty specified by the assignment group's **PagerDuty Escalation** field. This will restart escalation and notify the new assignees in the target escalation policy. ### Webhook Import: PagerDuty to ServiceNow Real-time incident updates in PagerDuty are communicated to ServiceNow through [extensions](/integrations/extensions) on each PagerDuty service that correspond to a provisioned assignment group in ServiceNow. When a group is initially provisioned, an extension will also be created on the service. In version 3.5 and later, an extension on the service will be provisioned automatically if one does not already exist, whenever a new incident is created. The extensions, also known as webhooks, specify URLs in your ServiceNow instance, to which JSON-encoded data is sent via HTTPS/POST requests. #### Precedence and Order of Operations in Webhook Import Throughout the webhook import process, automation and record creation in ServiceNow happens in the following order: 1. **Run the default import actions** 2. **Run dynamic field mapping rules** 3. **Run the custom script, if any** #### Initial Receiving and Importing of the Webhook The first point of entry into the ServiceNow application is the **Webhook Post** Scripted REST Resource, found in the **Application Files** tab. This component handles the receipt of the payload, validation of the webhook key/endpoint path, and generating the response. The **PagerDutyInbound** Script Include processes the data, via a call to `PagerDutyInbound.processRestWebhook`. **PagerDutyInbound** handles data saving. It is passed an array, `messages`, containing one or more webhook event objects as described in [Webhooks Overview](/developer/webhooks-v2-overview). Finally, in the function `PagerDutyInbound._processData`, an import record is created for each webhook event in the table `x_pd_integration_webhook_import`. You can review this table's data and a record of received webhooks under **PagerDuty** → **Imports** → **Webhook Import Rows**. #### Translating Webhook Imports to ServiceNow Incidents The **PagerDuty Webhook Import Table Transform Map**, and other transform maps that operate on other tables in ServiceNow (v5 and later), takes each new record inserted in the webhook import table and translates it to either an insert or an update on the ServiceNow table. Which of these two operations happens depends on whether the import transform is able to find an existing ServiceNow incident record with the same PagerDuty incident ID as the one corresponding to the PagerDuty webhook message. This behavior is dictated by the **Field Maps** configuration in the Table Transform Map: 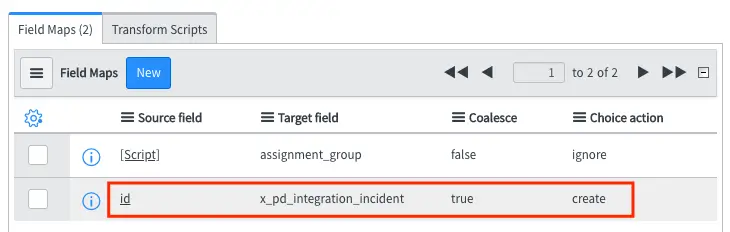 *Coalesce = true here means no new record will be created if an existing record is found in the target table with its x_pd_integration_incident field equal to the id field in the source table (x_pd_integration_webhook_import)* After creating or updating the incident in ServiceNow, the integration will automatically set the assignment group (for `trigger`, `acknowledge`, `escalate` and `delegate` [webhook types](/developer/webhooks-v2-overview#webhook-types)). The PagerDuty escalation policy ID in the webhook payload is used to determine the assignment assignment group. In other words, if the assignment group declared in the **PagerDuty Escalation** field (`x_pd_integration_pagerduty_escalation`) matches the escalation policy ID in the webhook payload, the incident will be assigned to that group. In version 5 and later, the **PdWebhookTransform** script contains the logic for all default operations taken when updating or inserting an incident (e.g., additional fields to populate and workflow logic). Within the local scope, the following variables dictate the actions that will be taken on the target record for each webhook import: | Variable | Description | | :----------------- | :-------------------------------------------------------------------------------------------------------------------------------------------------------------------------------------------------------------------------------------------------------------------------------------------------------------------------------------------------------------------------------------- | | `source` | The import record. The field `source.message_type` is particularly important, since it will be one of the [webhook types](/developer/webhooks-v2-overview#webhook-types). | | `action` | This will be `insert` or `update` depending on whether a new incident record is created, or an existing incident is updated. | | `assignOnAckOnly` | This is a boolean value (i.e., `true` or `false`), determined by the setting **Only assign based on an acknowledgment from PagerDuty user**. Its value determines whether the ServiceNow incident should be assigned based on acknowledgment from PagerDuty, or if the integration should synchronize incident assignment between ServiceNow and PagerDuty with each webhook update. | | `target` | This is a GlideRecord object representing the incident in ServiceNow that will be created or updated. | By the time the script completes, the incident's properties will be stored in the `target` variable. Changes will be saved after the script exits. ### Work Note Synchronization #### ServiceNow Work Notes to PagerDuty Work notes are copied from ServiceNow to PagerDuty through the **PD Copy worknote to PagerDuty incident** business rule, which triggers the `x_pd_integration.post_worknote` event, which then invokes the `PagerDuty.postIncidentNote` function. This runs any time a work note changes on a linked incident. #### PagerDuty Incident Notes to ServiceNow Work Notes Starting in version 5, the integration uses the `annotate` webhook event type to keep incident notes synchronized between PagerDuty and ServiceNow. When a user adds a note to the incident in PagerDuty, the webhook transform will recognize the event, and add the note as a work note with the suffix `(PagerDuty: PAGERDUTY_USER_NAME on TIMESTAMP)`. In earlier versions, the process that ran in the opposite direction was initiated by a business rule (in addition to the user-initiated UI action *Refresh PagerDuty Notes*), which appeared as an action in the context menu for any given linked incident. The business rule **PD Update Worknotes from PagerDuty Notes** polls for updates, and raises the event `x_pd_integration.import_notes` (handled by the *Import Notes from PagerDuty incident* script action). In both cases, the functions `PagerDuty.getIncidentNotes` and `PagerDuty.createNoteImports` are used to import and save notes from PagerDuty. ServiceNow incident work notes will appear in PagerDuty with the prefix `(from ServiceNow:SERVICENOW_USER_NAME)`. --- URL: https://docs.pagerduty.com/integrations/servicenow-integration-guide # ServiceNow Integration Guide | PagerDuty Configure the ServiceNow v8 Integration ## ServiceNow + PagerDuty Integration Benefits - Conduct PagerDuty incident response inside the ServiceNow interface, such as running [Incident Workflows](/ai-automation/automation/incident-workflows), posting [status updates](/incident-management/communicate/communicate-with-stakeholders#status-updates) and setting the impacted [Business Service](/incident-management/services/business-services). - [Sync PagerDuty Custom Fields bi-directionally with ServiceNow Incident record fields](/integrations/servicenow-integration-guide/advanced-servicenow-configuration/servicenow-custom-field-mappings). This allows for a more accurate system of record and provides responders with relevant, updated incident context. - Reduce manual toil by automating [ServiceNow Incident creation](/ai-automation/automation/incident-workflows#add-actions) through Incident Workflows. - Perform [Assignment Group](/integrations/servicenow-integration-guide/servicenow-provisioning#provision-assignment-groups-and-configuration-items) and [priority mapping](#34-priority-synchronization) to PagerDuty escalation policies. - Reduce configuration time by [provisioning](/integrations/servicenow-integration-guide/servicenow-provisioning) Business and technical services from ServiceNow to PagerDuty, along with their dependency relationships. - Send [ServiceNow change requests](/integrations/servicenow-integration-guide/servicenow-change-requests-integration-guide) to PagerDuty as change events. - [MID server support](/integrations/servicenow-integration-guide/advanced-servicenow-configuration#use-a-mid-server). ## How it Works Incident communication between ServiceNow and PagerDuty is bi-directional. This allows you to trigger, reassign, resolve, use Incident Workflows, post status updates and set impacted Business Services in either system. The following behavior is supported: - Third-party monitoring tool integrations detect an issue and trigger an incident in PagerDuty. Responders receive PagerDuty incident notifications and they can acknowledge and resolve incidents in PagerDuty. PagerDuty incidents can automatically create a ServiceNow incident when triggered or manually through the incident details page. After a ServiceNow incident and PagerDuty incident are linked, the above actions are kept in sync for the lifecycle of the incident. - When a ServiceNow ticket is created, it automatically triggers a PagerDuty incident and notifies on-call responders. A responder acknowledges the PagerDuty incident, and above actions from PagerDuty are kept in sync with the ServiceNow ticket. ## Requirements **In ServiceNow**: - A ServiceNow Administrator role is required for configuration. **In PagerDuty**: - The ServiceNow integration is available to accounts on the Business or Enterprise pricing plans. PagerDuty [Custom Field synchronization](/integrations/servicenow-integration-guide/advanced-servicenow-configuration#custom-field-mappings) and the [Create a ServiceNow Incident Workflow Action](/ai-automation/automation/incident-workflows#add-actions) are two premium features only available on the Enterprise plan for Incident Management. Please [contact our Sales Team](https://www.pagerduty.com/contact-us/#contact-sales) if you would like to upgrade to a plan featuring the ServiceNow integration. - A Global Admin or Account Owner base role is required for configuration. ## Quick Links - [ServiceNow Integration Details](/integrations/servicenow-integration-guide/servicenow-integration-details): How the integration works. - [ServiceNow User Guide](/integrations/servicenow-integration-guide/servicenow-user-guide): Using the integration after configuration. - [ServiceNow Provisioning](/integrations/servicenow-integration-guide/servicenow-provisioning): Provision Users, Assignment Groups and Configuration Items to PagerDuty. - [Advanced Configuration](/integrations/servicenow-integration-guide/advanced-servicenow-configuration): Leverage the full power and versatility of the ServiceNow integration. - [ServiceNow Troubleshooting Guide](/integrations/servicenow-integration-guide/servicenow-troubleshooting-guide): Identify and resolve common issues with the ServiceNow integration. ## Version This guide details configuration for the latest [ServiceNow v8 integration](https://store.servicenow.com/sn_appstore_store.do#!/store/application/39a9d9664f834e00dd657bb28110c77b/8.0.0). > **Upgrade to ServiceNow v8:** Please see our [Upgrade to ServiceNow v8](/integrations/servicenow-integration-guide/servicenow-integration-details#upgrade-to-servicenow-v8) article for instructions to upgrade from another version. > **Looking for a Different Version?:** The [ServiceNow v7 integration](/integrations/servicenow-v7-integration-guide) is also available. ## Integration Walkthrough Download the [ServiceNow Integration Checklist](https://drive.google.com/file/d/1CuFVLllxBawkpLN0eTvWRehfxMniTPYt/view?usp=drive_link) before you begin to keep track of your progress. The following video captures the integration walkthrough process, which you can use as a reference while configuring the integration in your environment. [ServiceNow Integration Walkthrough Video](https://fast.wistia.com/embed/channel/1zqq3j3s9p?wchannelid=1zqq3j3s9p) ## Step 1: Complete ServiceNow Pre-Install Requirements ### 1.1 ServiceNow Application Access Controls In order for the integration to function, a ServiceNow Administrator must allow configuration access in the following ServiceNow tables. In the application navigator, search **System Definition** and select the **Tables** module. Search for and open the following records and perform the specified actions: | Tables | Instructions | | --- | --- | | **`sys_user`**
**`sys_user_group`**
**`sys_user_grmember`** | Select the **Application Access** tab and ensure the following are checked:
- **Can read**
- **Can create**
- **Can update**
- **Allow configuration**
Click **Update** in the upper right of each to save. | | **`sysauto_script`** | **Note**: The permissions granted on the Scheduled Script Executions (`sysauto_script`) table are required to provision scheduled scripts to process PagerDuty webhooks.
Select the **Application Access** tab and ensure the following are checked:
- **Can read**
- **Can create**
- **Can update**
Click the **Update** button in the upper right to save. | ### 1.2 Integration Installation [Install the PagerDuty integration from the ServiceNow Store](https://store.servicenow.com/store/app/82fa2be61b246a50a85b16db234bcb5c). #### 1.3 Add PagerDuty Fields to Views (Optional) If you wish to view PagerDuty ID fields within ServiceNow, you will need to manually add them to the Groups, Configuration Items, Users, and Incidents views. This will make it easier to see which ServiceNow objects are mapped to PagerDuty. Instructions are detailed in ServiceNow’s documentation [Show or hide fields on a form](https://www.servicenow.com/docs/bundle/washingtondc-platform-administration/page/administer/form-administration/concept/configure-form-layout.html#title_t_ConfigureAForm). > **Navigate to Configuration Items:** You can quickly navigate to a list of all Configuration Items by entering `cmdb_ci_list.do` in the **All** menu and pressing enter. > >  > *Search Configuration Items* 1. We recommend that you add the PagerDuty fields to the Groups, Configuration Items, Users and Incidents views by clicking in the upper-right to customize the column display. This will make them visible in your list views only.  2. The following are the available PagerDuty fields that you can add to the various list views or forms in ServiceNow: | List Views and Forms | PagerDuty Fields | | :-------------------------------------------- | :------------------------------------------------------------------------------------------------------------------------------------- | | User list view and User form | - PagerDuty ID | | Groups list view and individual Group form | - PagerDuty default escalation - PagerDuty error message - PagerDuty schedule - PagerDuty service - PagerDuty team - PagerDuty webhook | | Applications list view and individual CI form | - PagerDuty Change Event Token - PagerDuty service - PagerDuty webhook | | Incidents list view and Incident form | - PagerDuty incident | 3. Select your preferred PagerDuty field(s) in the left-hand **Available** slush bucket, and then click to move it to the **Selected** slush bucket. Repeat as desired. Reorder select fields using and . Click **OK** when you are finished. 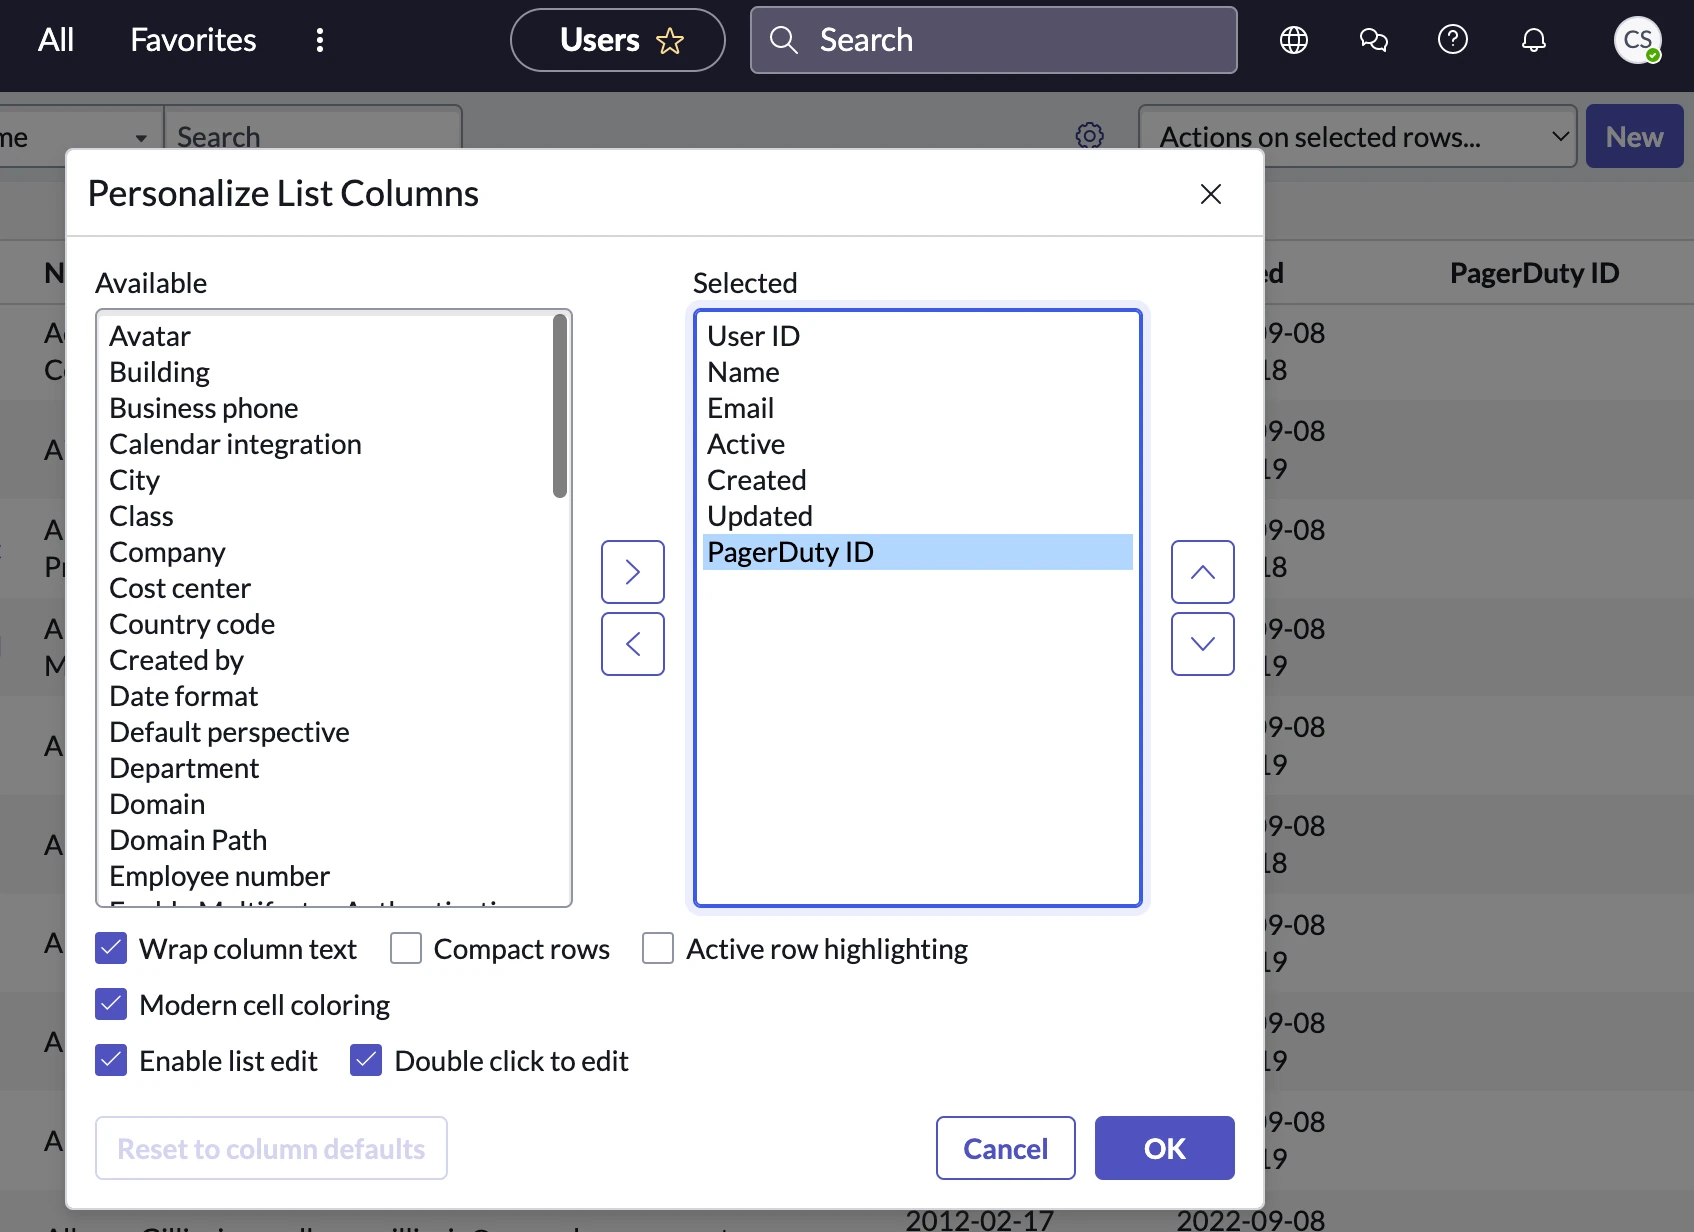 4. Configure Assignment Group/CI records to display the PagerDuty webhook sync option | ServiceNow Object | PagerDuty Fields | | --- | --- | | Assignment Groups | For Assignment Group records, the webhook sync option will be displayed automatically in the PagerDuty Webhook. | | Configuration Items | For Configuration Items:
1. Open the Configuration Item record.
2. Navigate to Configure Related lists.
3. Move **PagerDuty Webhook** to the Selected column and click Save. | ## Step 2: Configuration In PagerDuty ### 2.1 Create a PagerDuty API Access Key 1. Log in to the PagerDuty web app ([https://identity.pagerduty.com/](https://identity.pagerduty.com/)). Navigate to **Integrations** → **API Access Keys**. 2. On the API Access Keys page, click **Create New API Key**. 3. In the dialog that appears, enter a **Description** for your key (e.g., "ServiceNow \<> PagerDuty Integration"). Leave the box to create a read-only API key unchecked, since the integration requires a full-access API key. Click **Create key** to save. 4. Next you will see a dialog displaying your API key. **Copy this key and save it in a secure place**, as you will not have access to the key after this step. If you lose a key that you created previously and need access to it again, you should remove the key and create a new one. Click **Close** once you have successfully copied and saved your key. ### 2.2 Create a Default PagerDuty User Account for ServiceNow This integration requires ServiceNow to have access to your PagerDuty account both by an API token and a PagerDuty user account. The PagerDuty user account is required so that non-PagerDuty users can take action in ServiceNow and the actions will be reflected in PagerDuty. > **Provision a Default User: Behavior:** The integration now has the option to provision a Default User from the ServiceNow UI, however this function has some considerations: > > - When provisioning the Default User, it will create a PagerDuty user based on the user who is logged in to ServiceNow and configuring this setting. If you are okay with being provisioned as the Default ServiceNow user, please follow directions in this section and then move on to [Step 3: Configuration in Your ServiceNow Instance](/integrations/servicenow-integration-guide#step-3-configuration-in-your-servicenow-instance). > - If you do not want to be provisioned as the Default ServiceNow user in PagerDuty, please proceed with the steps below. 1. In your PagerDuty account, navigate to **People** → **Users** and click **Add Users**. 2. Enter `ServiceNow User` in the **Name** field and enter any valid email address in the **Email** field. Copy this email and save it in a safe place for later steps when you will be entering it into ServiceNow. Once you have saved this email, select **Global Admin** as the **Base Role**, click **Add** and then **Send Invitations** to save. 3. You will now see the ServiceNow User in your PagerDuty Users list. Click the **user name** and take note of the 7-character alphanumeric user ID in the URL of this page. For example, if your URL reads `https://your-subdomain.pagerduty.com/users/PXXXXXX` the user ID would be `PXXXXXX`. Copy this user ID and keep it, along with this user's email address, in a safe place. In later steps, you will also enter this user ID in ServiceNow. ## Step 3: Configuration in Your ServiceNow Instance ### 3.1 Create a ServiceNow User Account For Webhook Authentication The PagerDuty integration also requires a ServiceNow user account, which allows PagerDuty to sync actions back to ServiceNow via webhooks. This is a security feature, and allows you to control the integration’s permissions and roles within ServiceNow. 1. Log in to your ServiceNow instance. In the application navigator, search **Organization** → **Users** and click **New** to create a new user account for PagerDuty application use. 2. Perform the following: 1. **User ID**: Enter any desired username for the User ID. This username must be all lower case, e.g., `pagerduty`. 2. **First/Last name**: Enter any desired First and Last name for the user. 3. **Email**: Enter the same email that you entered for the new user in PagerDuty (step 2 of the [Create a Default User Account for ServiceNow](#create-a-default-pagerduty-user-account-for-servicenow) section above). This will ensure that requests are properly formatted with a PagerDuty-From header. > **Checkboxes:** - Ensure that the **Password needs reset** and **Locked out** checkboxes are _**unchecked**_. > - Ensure that **Active** is **checked**. > - If the **Web service access only** and **Internal Integration User** options are available, you can optionally select these checkboxes. 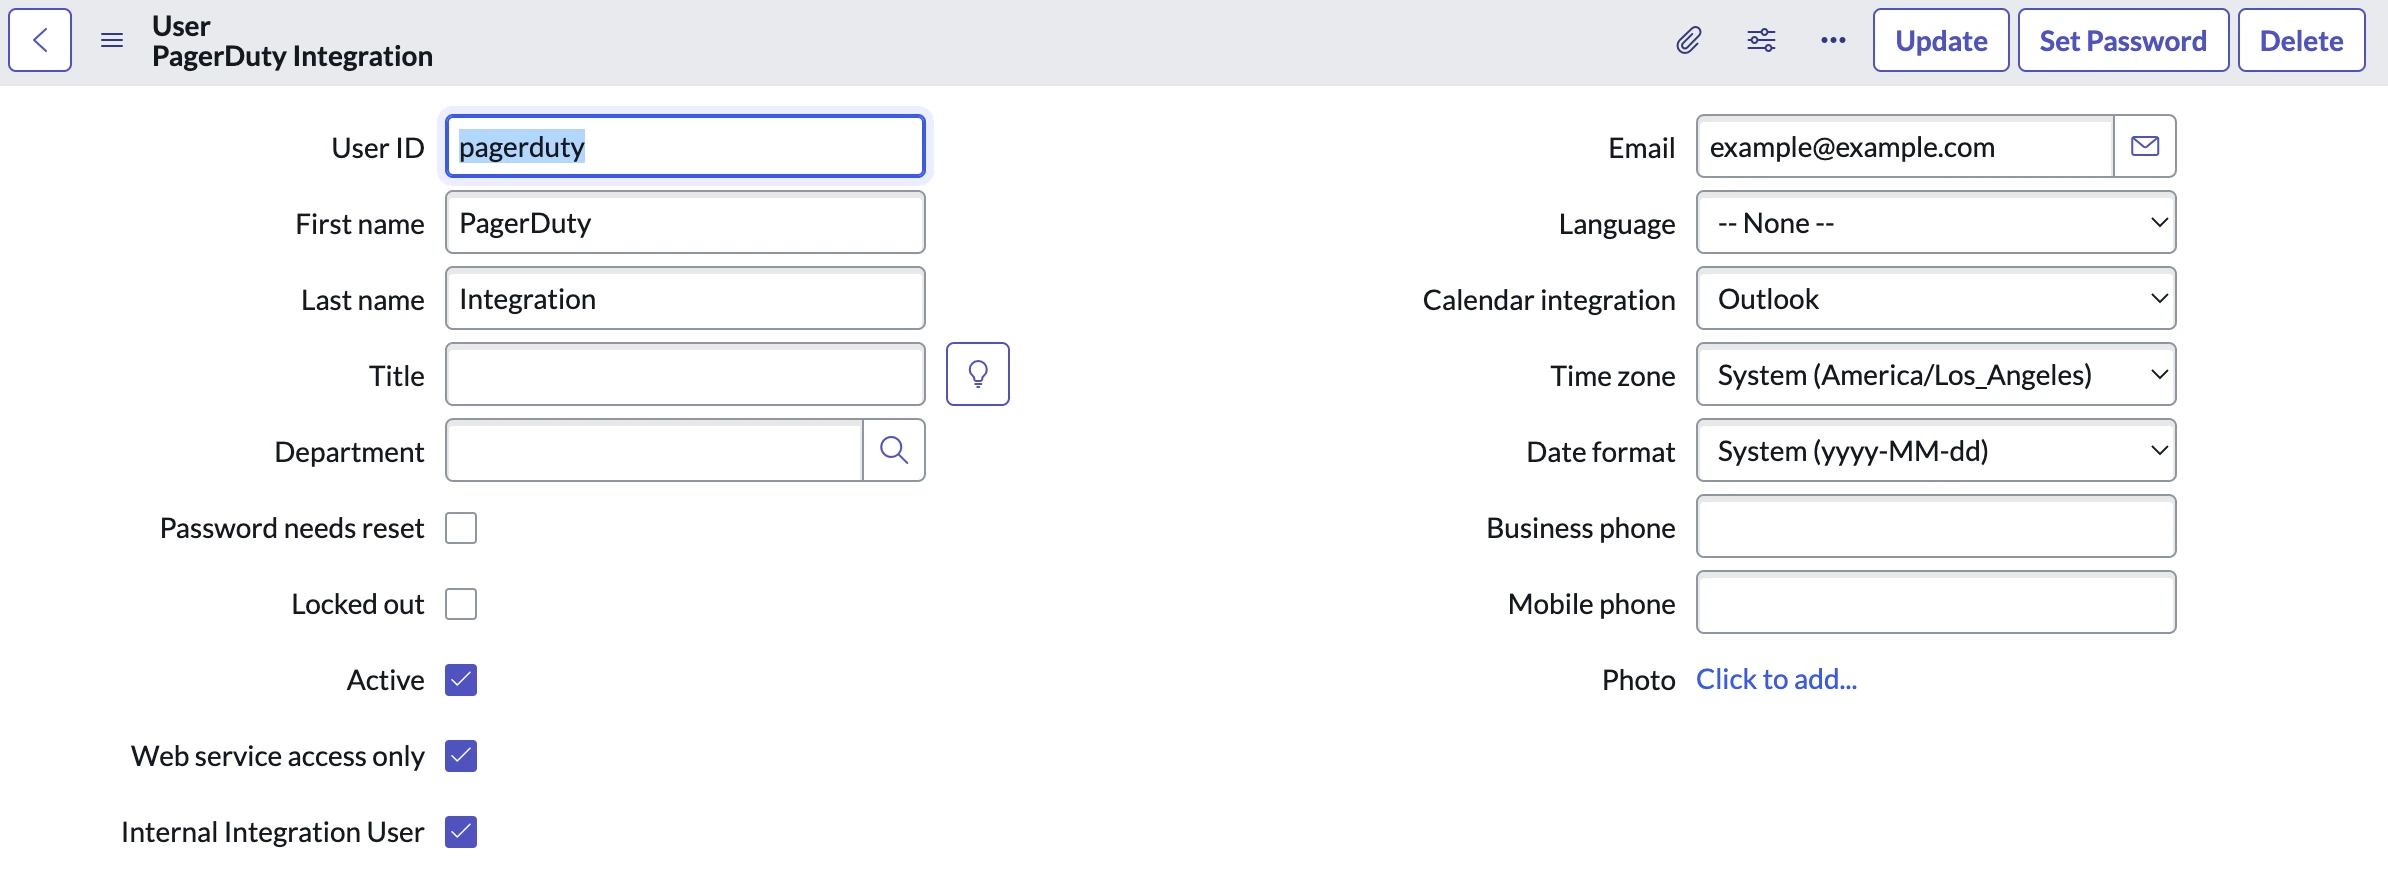 3. Click **Submit** and then search and select the user’s profile. 4. Click **Set Password**. In the modal that appears, click **Generate** and then click **Save Password**. Once the password has been saved, copy the username and password and keep them in a safe place, as you will need to provide them in PagerDuty Settings (within the ServiceNow UI) in a later step. Click **Close** to proceed. 5. In the bottom section of the User form, select the **Roles** tab in the User form and click **Edit**. In the **Collection** column, search and assign the following roles using : 1. `itil` 2. `x_pd_integration.admin`  *Edit Roles* 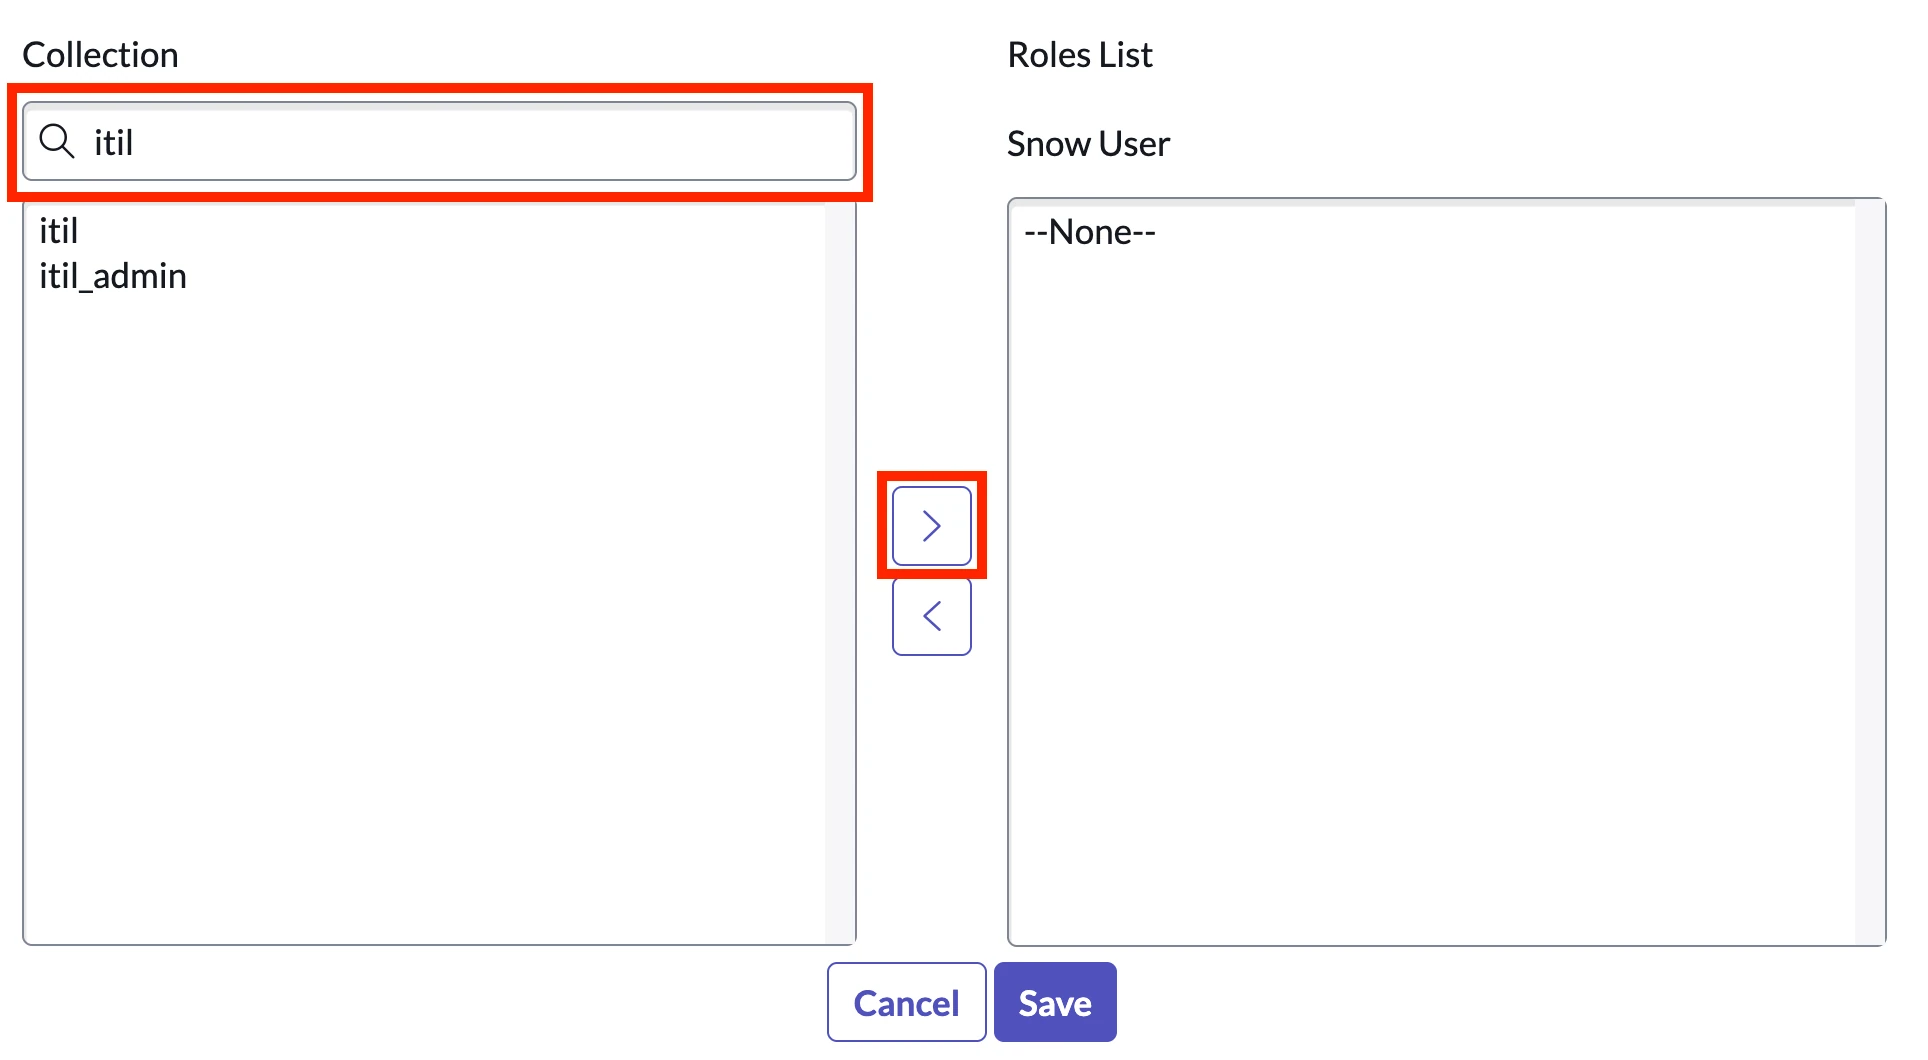 *Assign "itil" role* 6. Click **Save** to return to the User form. The newly created user account requires the ability to make API requests. This allows PagerDuty to create and take action on ServiceNow incidents. If your ServiceNow instance allows all users to perform REST API calls, providing the `itil` and the `x_pd_integration.admin` role are sufficient. 7. In the **PagerDuty ID** field, enter the 7-character **user ID** of the default PagerDuty user account that you generated in step 3 above, [Create a Default PagerDuty User Account for ServiceNow](#22-create-a-default-pagerduty-user-account-for-servicenow), e.g., `PXXXXXX`. Click **Update**. To summarize what you have completed so far: - A default PagerDuty user account has been created for ServiceNow to use. - An API Key has been created in PagerDuty. - A ServiceNow user account has been created for the PagerDuty integration to use. - The user accounts have been mapped to each other via their shared email address and the PagerDuty User ID. If all of these prerequisites have been fulfilled, you may now begin configuring the API and Webhook Connection in ServiceNow. ### 3.2: Configure the API and Webhook Connection in ServiceNow > **Application Scope Warning:** You may see a warning at the top of the page indicating that you need to switch into the PagerDuty application scope. Proceed with this step, if you are prompted, by providing your instance’s login credentials. Once done, the PagerDuty Settings page should become editable. #### 3.2.1: Choose your preferred ServiceNow to PagerDuty mapping Review the diagram below, and choose your preferred ServiceNow to PagerDuty mapping. 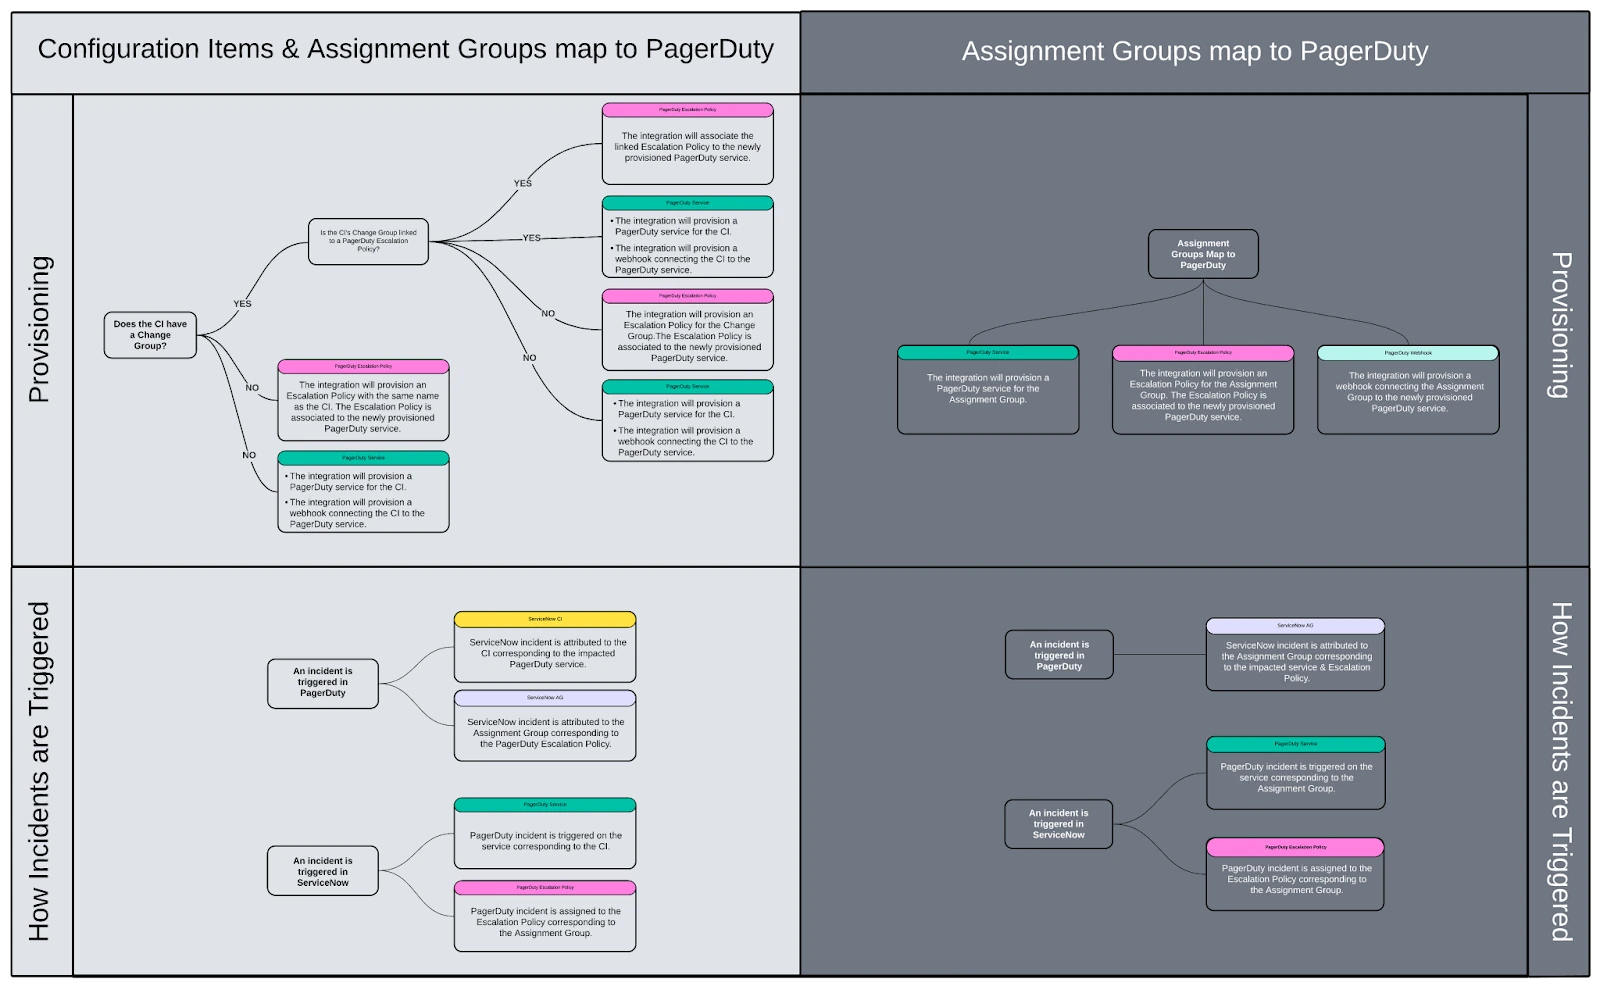 *Choose ServiceNow to PagerDuty Mapping* #### 3.2.2: Manage Integration Settings In your ServiceNow instance, navigate to **PagerDuty** → **Configuration** → **PagerDuty Settings**. Configure the integration settings according to your company’s preferences and workflows, by following steps outlined in our [ServiceNow Integration Details](/integrations/servicenow-integration-guide/servicenow-integration-details#manage-integration-settings) article. #### 3.2.3: Run the Integration Health Check 1. [Run the Integration Health Check](/integrations/servicenow-integration-guide/servicenow-integration-details#how-and-when-to-run-the-integration-health-check) 2. [Migrate your v2 webhooks to webhooks v3](/integrations/servicenow-integration-guide/servicenow-integration-details#webhooks-migration) ### 3.3 Provision a PagerDuty Service In this step you will provision a PagerDuty service, and attach an escalation policy to the newly provisioned service. Please see our [ServiceNow Provisioning](/integrations/servicenow-integration-guide/servicenow-provisioning) article for more information. #### 3.3.1 Run the Webhooks Health Check > **Note:** Ensure you run the Webhooks Health Check after you have provisioned at least one service. 1. [Run the Webhooks Health Check](/integrations/servicenow-integration-guide/servicenow-integration-details#how-and-when-to-run-a-webhooks-health-check) ### 3.4 Priority Synchronization The [Incident Priority](/incident-management/incidents/incident-priority) on a newly triggered PagerDuty incident can automatically set the priority level on a linked ServiceNow incident, and vice versa. Priority is also synced when you edit the priority of an incident in either direction. To enable this functionality, you must import PagerDuty priorities and define priority mapping in ServiceNow. > **Leave a Note When Changing Priority:** If you need to change an incident’s priority, we recommend leaving a text note to keep relevant stakeholders informed. ### 3.4.1 Import PagerDuty Priorities 1. Define incident priorities in your PagerDuty account by going to **User Icon** → **Account Settings** → **Incident Priorities**. For more information, please see our [Incident Priority](/incident-management/incidents/incident-priority) article. 2. In ServiceNow, navigate to **PagerDuty** → **Actions** → **Refresh PagerDuty Priorities** and click **OK** when prompted. After this, priorities will populate in the table `x_pd_integration_pagerduty_priority`, whose contents are displayed under **PagerDuty priority**. ### 3.4.2 Define the Priority Mapping Once you have [imported PagerDuty priorities](#import-pagerduty-priorities), you may define priority mapping in the same table (`x_pd_integration_pagerduty_priority`). To map your PagerDuty incident priorities to your ServiceNow priorities: 1. In the PagerDuty Priority table, select the PagerDuty **priority** that you want to map. 2. Set a value for its corresponding ServiceNow **Impact** and **Urgency**. 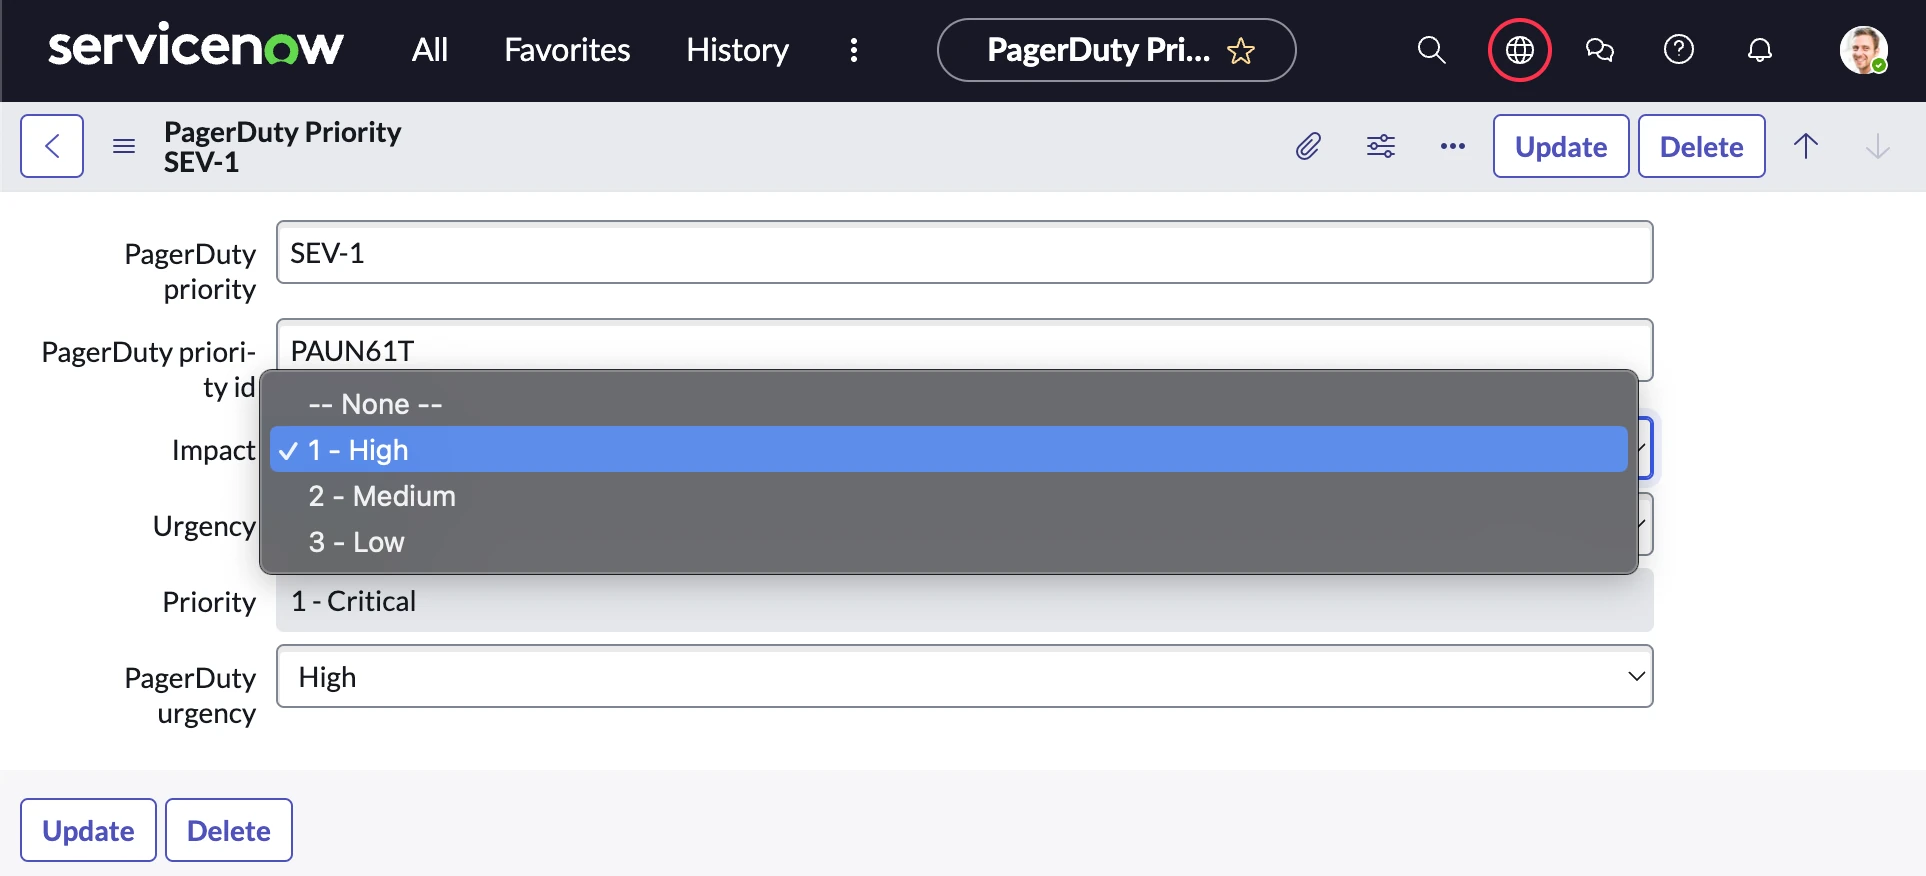 3. _Optional_: You can choose to associate your priority mapping to a specific PagerDuty urgency. 4. Click **Update** to save the mapping. After you create the mapping, the ServiceNow priority is automatically populated according to your [Priority Lookup Rules](https://www.servicenow.com/docs/bundle/xanadu-it-service-management/page/product/incident-management/task/def-prio-lookup-rules.html) (**All** → **System Policy** → **Rules** → **Priority Lookup Rules**).  ## Step 4: Test the Integration To verify that PagerDuty and ServiceNow are communicating, [trigger a PagerDuty incident](/incident-management/incidents/overview#trigger-an-incident-via-web-app) on the provisioned service and check to see that a ServiceNow Incident is also triggered. Once you resolve the PagerDuty incident, the ServiceNow incident will also be resolved, and vice versa. ServiceNow also maintains a log of the incident activities that have taken place within PagerDuty. > **Index Service Columns:** Once you have successfully installed and configured the PagerDuty application in your ServiceNow instance, it is highly recommended that you index the following columns in ServiceNow: > > - `incident.x_pd_integration_incident` > - `sys_user_group.x_pd_integration_pagerduty_escalation` > - `sys_user.x_pd_integration_pagerduty_id` > - `cmdb_ci.x_pd_integration_pagerduty_service` > - `task.x_pd_integration_incident_id` > > This will ensure optimal performance when the PagerDuty application is querying the incidents, group, user and CMDB tables. > **ServiceNow User Guide:** Once initial configuration is complete, please read our [ServiceNow User Guide](/integrations/servicenow-integration-guide/servicenow-user-guide) for instructions on how to use the integration. ## Manage Integration Settings For more information on managing the integration’s settings, please see our [ServiceNow Integration Details](/integrations/servicenow-integration-guide/servicenow-integration-details#manage-integration-settings) article. ## ServiceNow Provisioning For more information on provisioning Configuration Items, Assignment Groups and Users from ServiceNow to PagerDuty, please see our [ServiceNow Provisioning](/integrations/servicenow-integration-guide/servicenow-provisioning) article. ## Upgrade the ServiceNow Integration To upgrade your ServiceNow integration to the latest version, please see our [Upgrade to ServiceNow v8](/integrations/servicenow-integration-guide/servicenow-integration-details#upgrade-to-servicenow-v8) article. --- URL: https://docs.pagerduty.com/integrations/servicenow-integration-guide-v6 # ServiceNow v6 Integration Guide Configuring and installing the core ServiceNow v6 integration > **Version No Longer Supported:** ServiceNow version six is not supported on the latest ServiceNow versions. PagerDuty does not perform new development on this version of the feature, and handles bug fixes on a case-by-case basis. ## ServiceNow and PagerDuty Integration Benefits ServiceNow offers advanced automation and process workflow for the enterprise environment. This integration allows you to leverage ServiceNow's workflow and ticketing capabilities with PagerDuty's robust on-call scheduling, notifications, and escalations. ## How It Works Communication between ServiceNow and PagerDuty is bi-directional, allowing incidents to be acknowledged, delegated (reassigned to another group), and resolved in either system. The integration supports the following workflows: - Third-party monitoring tool integrations detect an issue and trigger an incident in PagerDuty. You receive notifications from PagerDuty and can acknowledge or resolve the incident via PagerDuty. A ServiceNow ticket opens when a PagerDuty incident triggers and stays in sync for the lifecycle of the incident. - A ticket is filed in ServiceNow, which automatically triggers an incident in PagerDuty and notifies you. You take ownership via PagerDuty, and information from PagerDuty stays in sync with ServiceNow. ## Requirements ### ServiceNow Requirements You require a ServiceNow Administrator role to configure the integration. This article details installing version six of the ServiceNow integration, which is certified for ServiceNow Kingston, London, Madrid, New York, and Orlando. ### PagerDuty Requirements - The ServiceNow integration is available only to accounts on the Business, Digital Operations (legacy), and Enterprise for Incident Management pricing plans. Contact the PagerDuty Sales Team to upgrade to a plan featuring the ServiceNow integration. - You require an Admin, Global Admin, or Account Owner base role for configuration. If you are not sure what role you have, or if you need your permissions adjusted, view [Check Your User Role](/account-admin/user-roles) or [Edit User Roles](/account-admin/user-roles). > **Looking for Another Version?:** V5 and [V7](/integrations/servicenow-integration-guide) of the ServiceNow integration are also available. ## Quick Links - More information on [How the Integration Works](/integrations/servicenow-integration-guide/servicenow-integration-details) and [Advanced Configuration](/integrations/servicenow-integration-guide/advanced-servicenow-configuration) - [Troubleshooting the ServiceNow Integration](/integrations/servicenow-integration-guide/servicenow-troubleshooting-guide) - [Frequently Asked Questions](/integrations/servicenow-v7-faq) ## ServiceNow Requirements Prior to Installation ### Application Access Controls To ensure the PagerDuty integration functions correctly, a ServiceNow administrator must make the following changes: 1. In the left-hand application navigator, navigate to **System Definition** → **Tables**. Search for and open the record for the User (`sys_user`) table. 2. Select the **Application Access** tab, select the **Allow configuration** checkbox to allow provisioning PagerDuty users from a user form, and click **Update**. 3. In the left-hand application navigator, navigate to **System Definition** → **Tables** and open the record for the Group (`sys_user_group`) table. 4. Select the **Application Access** tab and complete the following fields to map PagerDuty users to ServiceNow user records: | Field | Value | | :---------------------- | :----------------------------------------------------------------------------------------------------------- | | **Can update** | Check this checkbox to store a PagerDuty user ID on the ServiceNow record when user provisioning completes. | | **Allow configuration** | Check this checkbox to provision groups into PagerDuty from the list view. | Click **Update**.  *Application Access settings* 5. In the left-hand application navigator, navigate to **System Definition** → **Tables**, open the record for the Group Member (`sys_user_grmember`) table, select the **Allow configuration** checkbox to allow PagerDuty to add an item into the bulk action menu when managing group members, and click **Update**. ### Installation From the ServiceNow Store 1. Navigate to the [ServiceNow Store](https://store.servicenow.com/sn_appstore_store.do#!/store/application/39a9d9664f834e00dd657bb28110c77b) to find the application. 2. Select the option to purchase the application. Select the version of the app that matches your version of ServiceNow. 3. Log in to your ServiceNow instance as an administrator. 4. Depending on your ServiceNow version, navigate to one of the following paths: - For Kingston and London: Navigate to **System Applications** → **Applications** and click the **Downloads** tab to view the PagerDuty Incident Resolution Platform application. - For Madrid and New York: Navigate to **System Applications** → **All Available Applications** → **All**. 5. Click **Install** on the PagerDuty application. ### Add PagerDuty Fields to Views To view PagerDuty ID fields within ServiceNow, manually add them to the Group, User, and Incident views. This action displays which ServiceNow objects map to PagerDuty. For detailed instructions, view the ServiceNow documentation on how to show or hide fields on a form. You can add PagerDuty fields to the User and Group list views by clicking the **gear** icon in the upper-left corner of the grid to customize column display. This action makes them visible in list views only.  *Add PagerDuty fields to views* The following PagerDuty fields are available to add to list views or forms in ServiceNow: - User list view and user form - `PagerDuty ID` - Group list view and individual group form - `PagerDuty service` - `PagerDuty escalation` - `PagerDuty webhook` - `PagerDuty team` - `PagerDuty schedule` - CMDB CI Application list view and individual CI form - `PagerDuty service` - `PagerDuty webhook` - Incident list view and incident form - `PagerDuty incident` ## Configuration in the PagerDuty Web App ### Create an API Key 1. Log in to your PagerDuty account, click the **Apps & Add-Ons** menu in the upper right, and select **API Access**. 2. Click **Create New API Key**. 3. Complete the following fields in the configuration dialog: | Field | Value | | :-------------- | :-------------------------------- | | **Description** | Enter a description for your key. | | **Read-only** | Leave this checkbox unchecked. | Click **Create key**. 4. Copy the displayed API key and save it in a secure place. You cannot access the key after this step. If you lose the key, remove it and create a new one. Click **Close**. ### Create a Default PagerDuty User Account for ServiceNow The integration requires ServiceNow to access your PagerDuty account with both an API token and a PagerDuty user account. The PagerDuty user account ensures that non-PagerDuty users can take action in ServiceNow and have those actions reflect in PagerDuty. 1. Navigate to **People** → **Users** and click **Add Users**. 2. Complete the following fields on the user creation screen: | Field | Value | | :------------ | :------------------------------------------------------------------------------------ | | **Name** | `ServiceNow User` | | **Email** | Enter a valid email address (copy and save this email for later configuration steps). | | **Base Role** | Select **Manager**. | Click **Add** and click **Send Invitations**. 3. In your PagerDuty users list, click the **name** of the new user and copy the seven-character user ID from the URL (formatted as `PXXXXX`). Keep this user ID and email address in a safe place. ## Configuration in Your ServiceNow Instance ### Create an Integration User Account for Webhook Authentication The PagerDuty integration operates under a dedicated ServiceNow user account to sync actions back to ServiceNow via webhooks. This design provides a security feature and allows you to control the integration's permissions and roles within ServiceNow. 1. Log in to your ServiceNow instance. In the left-hand application navigator, navigate to **Organization** → **Users** and click **New**.  *Create an integration user account* 2. Complete the following fields on the user form: | Field | Value | | :---------------------------- | :---------------------------------------------------------------- | | **User ID** | Enter your preferred username (copy and save it for later steps). | | **First name** | Enter a first name. | | **Last name** | Enter a last name. | | **Password** | Enter a password (copy and save it for later steps). | | **Web service access only** | Select this checkbox if available (optional). | | **Internal Integration User** | Select this checkbox if available (optional). | 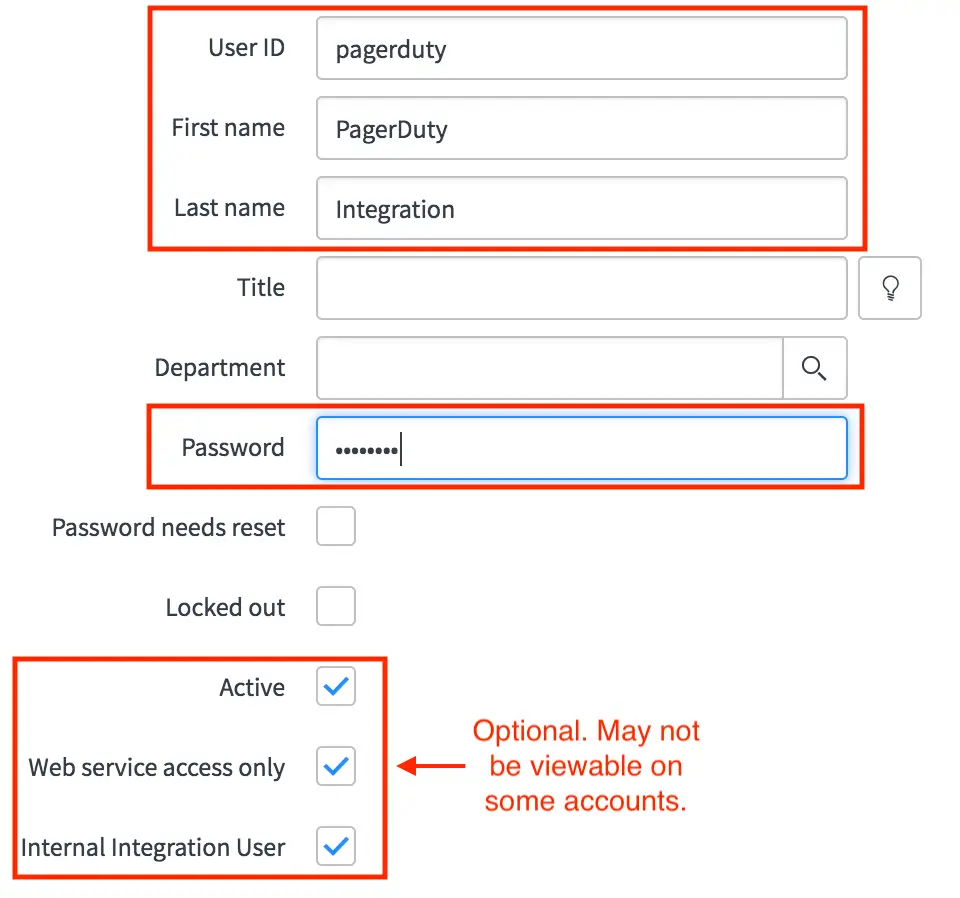 *User configuration* 3. In the **Email** field, enter the email address of the PagerDuty default user created in the previous section. This action ensures requests format with a `PagerDuty-From` header. 4. Select the **Roles** tab, click **Edit**, and assign the following three roles to the user: `itil`, `rest_service`, and `x_pd_integration.admin`. Click **Save**. 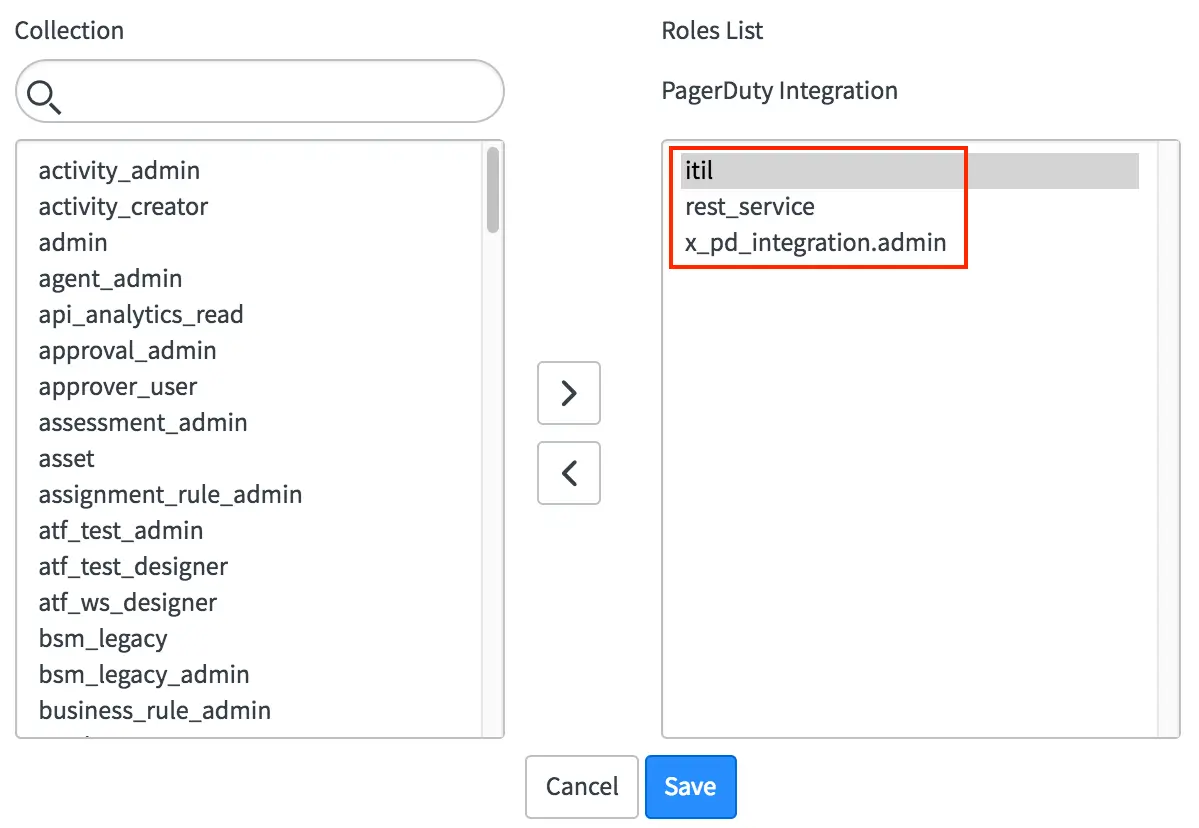 *User roles* The user account requires permissions to make API requests, which allows PagerDuty to create incidents in ServiceNow and update existing incidents (such as changing assignment). If your ServiceNow instance allows all users to perform REST API calls, the `itil` and `x_pd_integration.admin` roles are sufficient. If a role restricts REST API access, provide the required role to the user account (for example, `snc_platform_rest_api_access` or `rest_service`). 5. In the **PagerDuty ID** field, enter the seven-character user ID of the default PagerDuty user account created in the previous section and click **Save**. ### Configure the PagerDuty Settings Page in ServiceNow In the left-hand application navigator, navigate to **PagerDuty** → **Configuration** → **PagerDuty Settings**. If prompted with a warning at the top of the page, switch to the PagerDuty application scope. 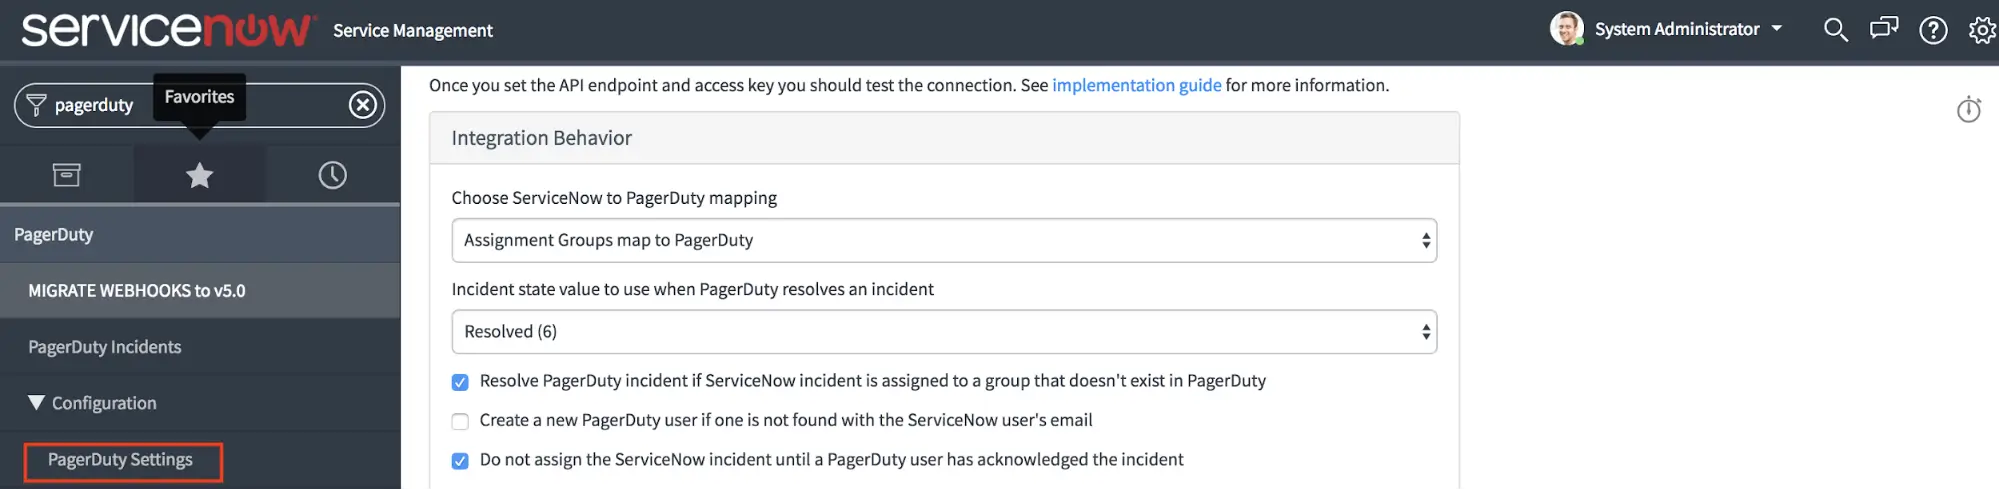 *Configure the PagerDuty settings page in ServiceNow* 1. Complete the following fields on the settings screen: | Field | Value | | :---------------------------------------------- | :---------------------------------------------------------------------------------------------------------------------------------------------------------- | | **ServiceNow user for authentication** | Enter the user ID of the ServiceNow integration user created in the previous section. | | **ServiceNow user password for authentication** | Enter the password of the ServiceNow integration user created in the previous section. | | **Default PagerDuty User ID to use** | Enter the seven-character alphanumeric ID starting with `P` from the default PagerDuty user account. The base role for this user must be Manager or higher. | | **REST API endpoint URL** | Leave as the default value (`https://api.pagerduty.com`). | | **PagerDuty API access key** | Enter the PagerDuty API access key generated in the previous section. | 2. Click **Save**. 3. To validate the integration connection, click **Configuration** → **Test REST API Connection**. A successful connection returns a `200` response. 4. To validate the ServiceNow user account configuration, click **Configuration** → **Test ServiceNow User Authentication**. A successful authentication returns a `200` response. 5. To validate the default user configuration, click **Test Default User Settings** and confirm the success messages. ### Add the ServiceNow Extension to an Existing PagerDuty Service To add the ServiceNow extension to an existing PagerDuty service instead of creating a new one, choose one of the following options. To create a new service, skip this section and navigate to the **Additional Properties to Review** section. #### Option 1: Manually Configure the Extension in PagerDuty 1. In the PagerDuty web app, navigate to **Services** → **Service Directory**, click the **name** of your service, select the **Integrations** tab, and click **Add or manage extensions** → **New Extension**. 2. Complete the following fields on the configuration screen: | Field | Value | | :---------------------- | :----------------------------------------------------------------------------------------------------------------------------------------------------- | | **Extension Type** | Search for and select **ServiceNow (v6.0)**. | | **Name** | Enter a name in the format `servicenow-service-name` (for example, `servicenow-shopping-cart`). | | **ServiceNow URL** | Enter the URL in the format `https://[INSTANCE-NAME].service-now.com/api/x_pd_integration/pagerduty2sn`. | | **ServiceNow User ID** | Enter the User ID created for webhook authentication. | | **ServiceNow Password** | Enter the password created for webhook authentication. | | **Sync Options** | Select **Sync All Incidents** to sync all new incidents, or **Manually Sync Incidents** to choose individual incidents from the incident details page. | | **Incident Type** | Select **Incident** to create standard incidents, or **Security Incident** to generate security incidents. | 3. Click **Save**. #### Option 2: Use the ServiceNow Integration to Provision the PagerDuty Extension 1. Identify how ServiceNow maps to PagerDuty based on your configuration on the **PagerDuty Settings** page: - If you map only Assignment Groups, navigate to the Assignment Group you want to map. - If you map Configuration Items, navigate to the Configuration Item you want to map. 2. Open the record in ServiceNow and locate the blank **PagerDuty Service** field. If the field is already populated, the object is already mapped. 3. In the PagerDuty web app, navigate to **Services** → **Service Directory** and click the service **name**. Copy the seven-character **Service ID** starting with `P` from the URL bar. 4. In ServiceNow, paste the Service ID into the **PagerDuty Service** field. 5. Click **Save**. If you redirect back to the list view, open the record again. 6. In the **Related Links** section, click **Provision Webhook** to create the extension in PagerDuty and complete the mapping. ### Additional Properties to Review Once you install and configure the integration, view the [Advanced Configuration](/integrations/servicenow-integration-guide/advanced-servicenow-configuration) article for more information on configuring Priority Sync, [Inbound Field Rules](/integrations/servicenow-integration-guide/advanced-servicenow-configuration#inbound-field-rules), and other optional configurations. Other global settings are available on the **PagerDuty** → **Configuration** → **PagerDuty Settings** page: #### Integration Behavior - **Choose ServiceNow to PagerDuty mapping**: Select whether Assignment Groups map to PagerDuty, or if Configuration Items and Assignment Groups map to PagerDuty. More details are available in the following section. - **Incident state value to use when PagerDuty resolves an incident**: Select the integer value associated with the "Resolved" state in your ServiceNow instance. - **Resolve PagerDuty incident if ServiceNow incident is assigned to a Group that doesn't exist in PagerDuty**: Choose whether to resolve an incident in PagerDuty if it is assigned to a group that is not mapped to PagerDuty. - **Create a new PagerDuty user if one is not found with the ServiceNow user's email**: Optionally auto-provision users into PagerDuty when they are assigned or manage an incident in ServiceNow. This action can impact billing. - **Do not assign the ServiceNow incident until a PagerDuty user has acknowledged the incident**. - **Provision current Assignment Group members into PagerDuty when provisioning Assignment Groups**: Optionally auto-provision all users who are part of an Assignment Group when the group provisions into PagerDuty. - **Create PagerDuty Schedule when provisioning Assignment Groups**: Automatically create a new schedule for Assignment Groups provisioned into PagerDuty. - **Use PagerDuty teams**: Use PagerDuty teams functionality with Assignment Groups in ServiceNow. - **Create PagerDuty Team when provisioning Assignment Groups**: Automatically create a PagerDuty team when you provision an Assignment Group. - **Enable Response Mobilizer**: Allows you to add responders to an existing incident from the ServiceNow interface. - **Enable Conference Bridges**: Allows you to add conference bridge information to an incident from the ServiceNow interface. #### PagerDuty Settings - **PagerDuty instance URL**: The URL to your PagerDuty instance. - **PagerDuty API access key**: The API key used to authenticate with the PagerDuty REST API. - **Default User ID**: The PagerDuty account used to make API requests if the user performing the action in ServiceNow does not exist in PagerDuty. - **REST API Endpoint**: The endpoint field (default value is `https://api.pagerduty.com`). #### ServiceNow Settings - **ServiceNow user for authentication**: The username PagerDuty uses to authenticate with ServiceNow for webhook delivery. - **ServiceNow user password for authentication**: The password for the authentication user. - **ServiceNow REST endpoint for webhook callback**: The path PagerDuty uses to send webhooks to. #### Legacy Settings - **Logging verbosity level**: Modifies the amount of information in the logs. Default is `info`; change to `debug` to troubleshoot. ### Choose How ServiceNow Objects Map to PagerDuty Objects The **Choose ServiceNow to PagerDuty mapping** option on the **PagerDuty** → **Configuration** → **PagerDuty Settings** page provides two options: - **ServiceNow Configuration Items and Assignment Groups map to PagerDuty**: - Configuration Items map to PagerDuty services. - Assignment Groups map to PagerDuty escalation policies. - **ServiceNow Assignment Groups map to PagerDuty**: - Assignment Groups map to both a PagerDuty service and a PagerDuty escalation policy. The following diagram represents the mapping between objects in both systems when Configuration Items and Assignment Groups map to PagerDuty: 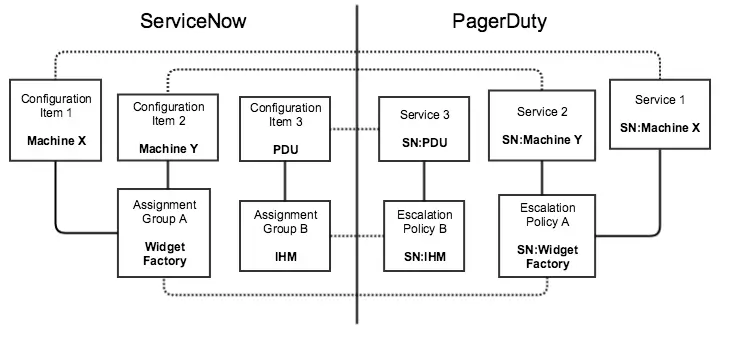 *Object mapping diagram* ### Provision Configuration Items to PagerDuty > **Note:** If you select **Assignment Groups map to PagerDuty** on the **PagerDuty** → **Configuration** → **PagerDuty Settings** page, skip this step. You do not need to provision Configuration Items into PagerDuty. Before provisioning Configuration Items into PagerDuty, set the corresponding Assignment Group for each Configuration Item. When you provision a single Configuration Item, the integration verifies that the Assignment Group exists in PagerDuty as an escalation policy. If it does not exist, the integration also provisions the corresponding Assignment Group as a PagerDuty escalation policy. Each ServiceNow Configuration Item can have a corresponding PagerDuty service. This integration generates a new PagerDuty service and webhook to send information back to ServiceNow and populates the associated fields within ServiceNow. Any Configuration Item that extends the base `cmdb_ci` table can map to PagerDuty because it inherits the field containing the PagerDuty service ID. This allows you to map any type of Configuration Item to services in PagerDuty. For each Configuration Item type, modify the form view to show the PagerDuty object ID. 1. In the list of Applications within your ServiceNow instance, the **PagerDuty service** and **PagerDuty webhook** fields are empty unless the Configuration Item (CI) maps to PagerDuty.  *PagerDuty service and webhook fields* 2. Select an application or CI that you want to provision to PagerDuty. In the **Related Links** section, click **Provision CI Into PagerDuty**. 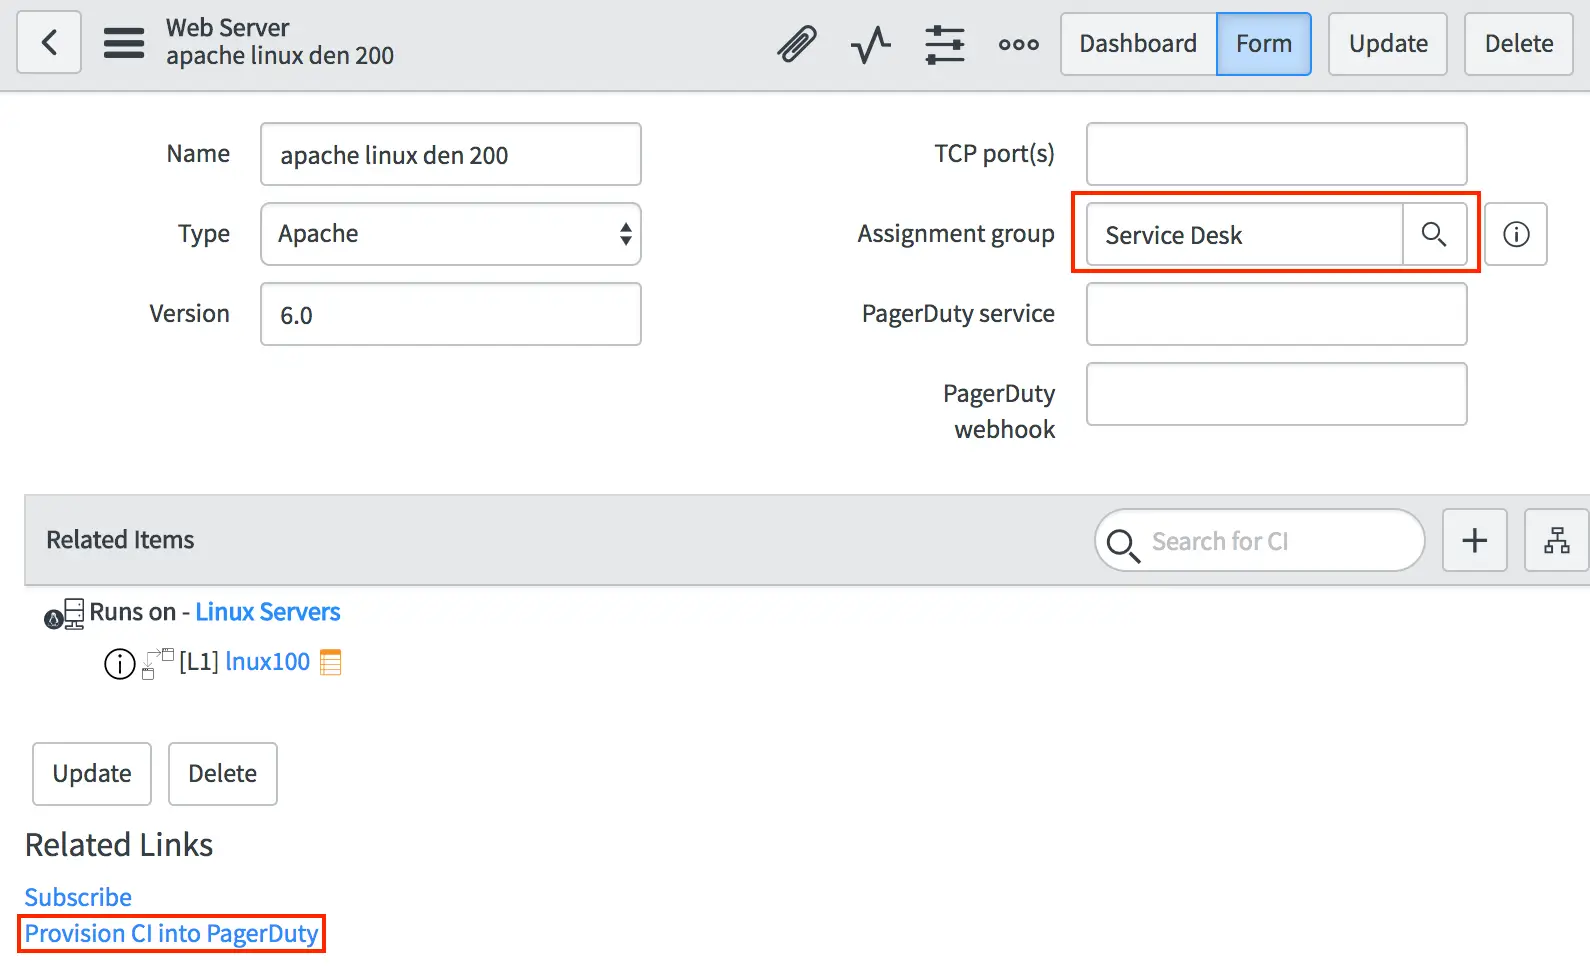 *Provision CI into PagerDuty* 3. A notification indicates that the Configuration Item is being created. When complete, the integration populates the **PagerDuty service** and **PagerDuty webhook** fields with the PagerDuty IDs. 4. The corresponding service and escalation policy are created in PagerDuty. The service automatically includes a webhook to power the bi-directional sync between PagerDuty and ServiceNow. ### Provision Assignment Groups to PagerDuty In ServiceNow, each Assignment Group corresponds to a PagerDuty escalation policy. You can optionally enable settings to automatically create a PagerDuty schedule and team when you provision a group from ServiceNow. Depending on the mapping selected on the **PagerDuty** → **Configuration** → **PagerDuty Settings** page, certain PagerDuty attributes are not set on Assignment Groups: - If you select **Assignment Groups map to PagerDuty**, each Assignment Group receives a corresponding PagerDuty escalation policy, service, and webhook ID (and optionally, a PagerDuty schedule and team ID). - If you select **Configuration Items and Assignment Groups map to PagerDuty**, each Assignment Group receives only a PagerDuty escalation policy ID (and optionally, a PagerDuty schedule and team ID). The PagerDuty service and webhook ID map to your Configuration Items in ServiceNow instead. > **Note:** The user who provisions Assignment Groups from ServiceNow to PagerDuty must have a PagerDuty user ID attached to their account in ServiceNow. 1. Select the Assignment Group you want to provision to PagerDuty, and click **Provision Group into PagerDuty**. 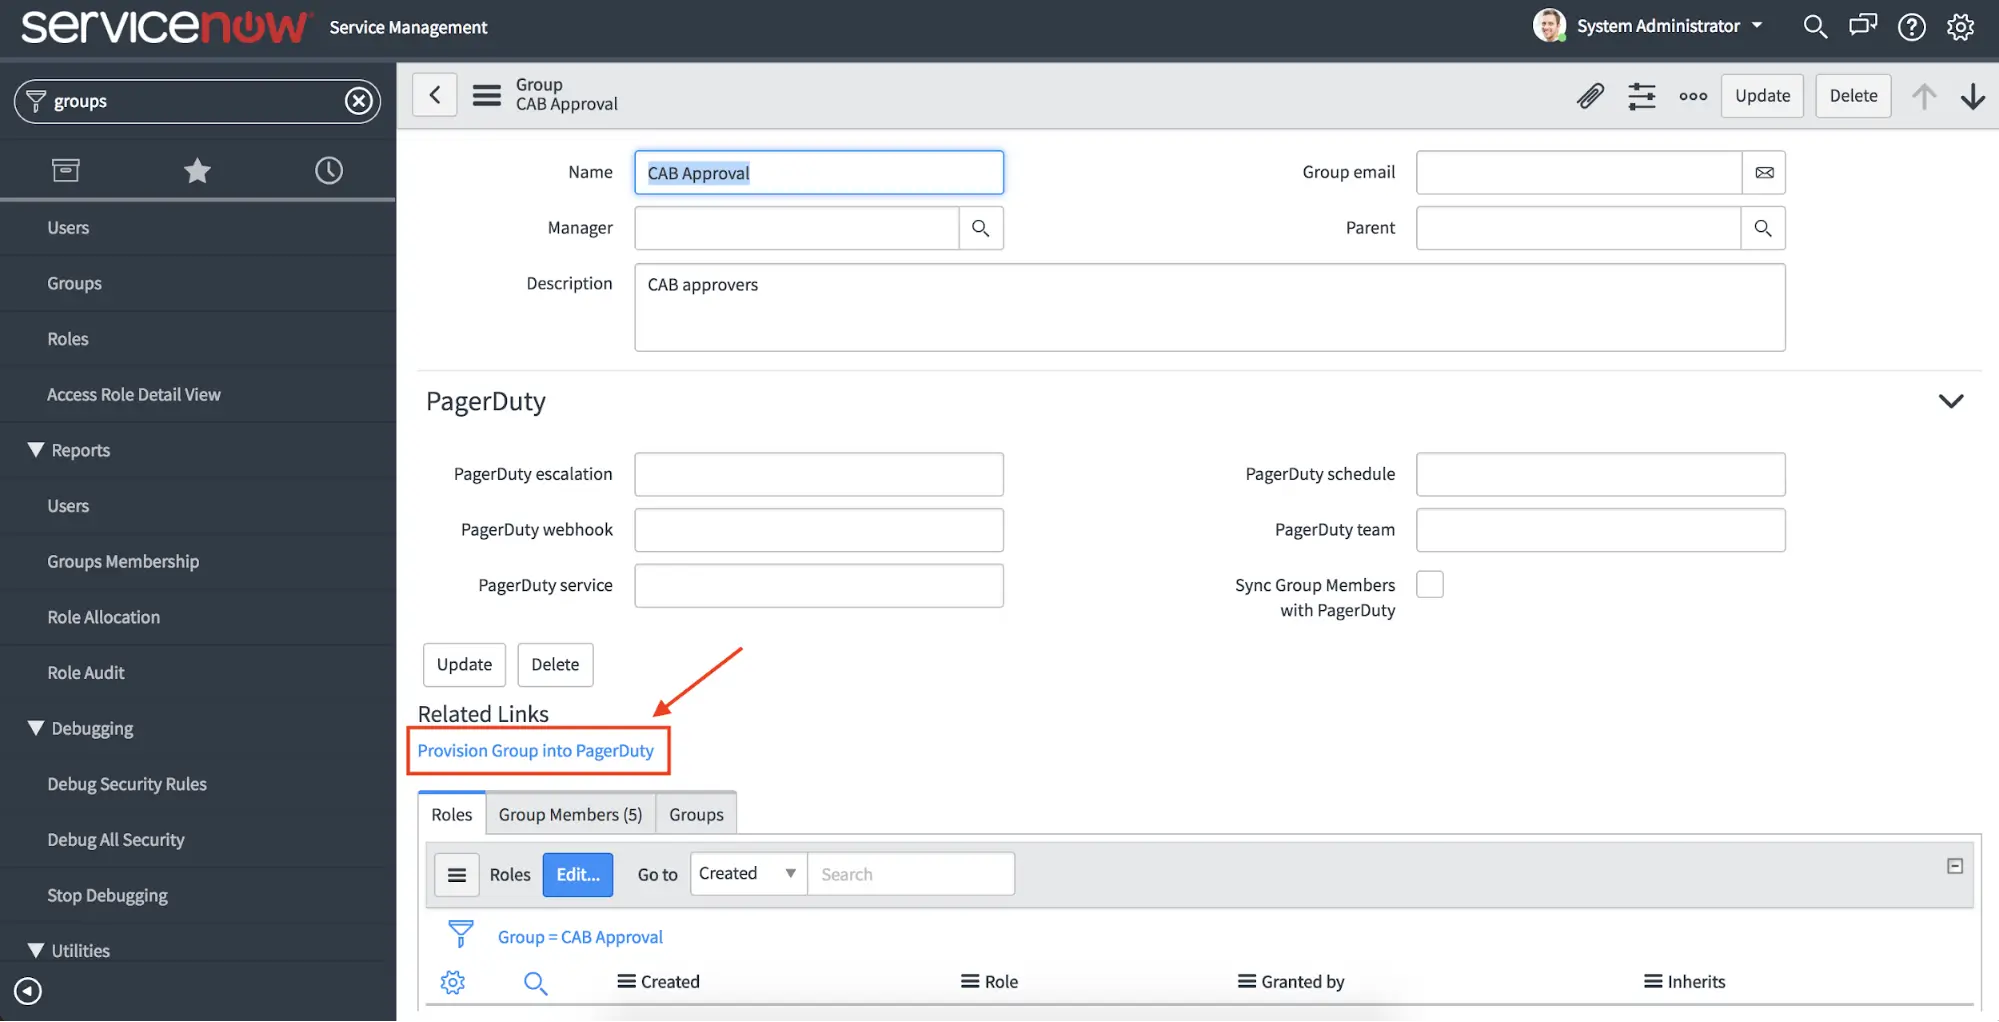 *Provision group into PagerDuty* 2. A notification indicates that the Assignment Group is being created. When complete, the integration populates the **PagerDuty service**, **PagerDuty escalation**, and **PagerDuty webhook** fields. The Assignment Group also receives a corresponding schedule ID and team ID if you enable those settings in the PagerDuty Settings UI. 3. The corresponding service and escalation policy are created in PagerDuty. The service automatically includes a webhook containing a shared secret in its URL to power secure, bi-directional sync. 4. To provision multiple groups simultaneously, select them and choose **Provision Group into PagerDuty** from the bulk actions dropdown menu on the Groups list view.  *Select Provision Group into PagerDuty* ### Provision Users to PagerDuty 1. In the ServiceNow users list, the **PagerDuty ID** field is populated for users who already exist in PagerDuty. 2. Select a user who is not provisioned to PagerDuty and click **Provision PagerDuty User**. 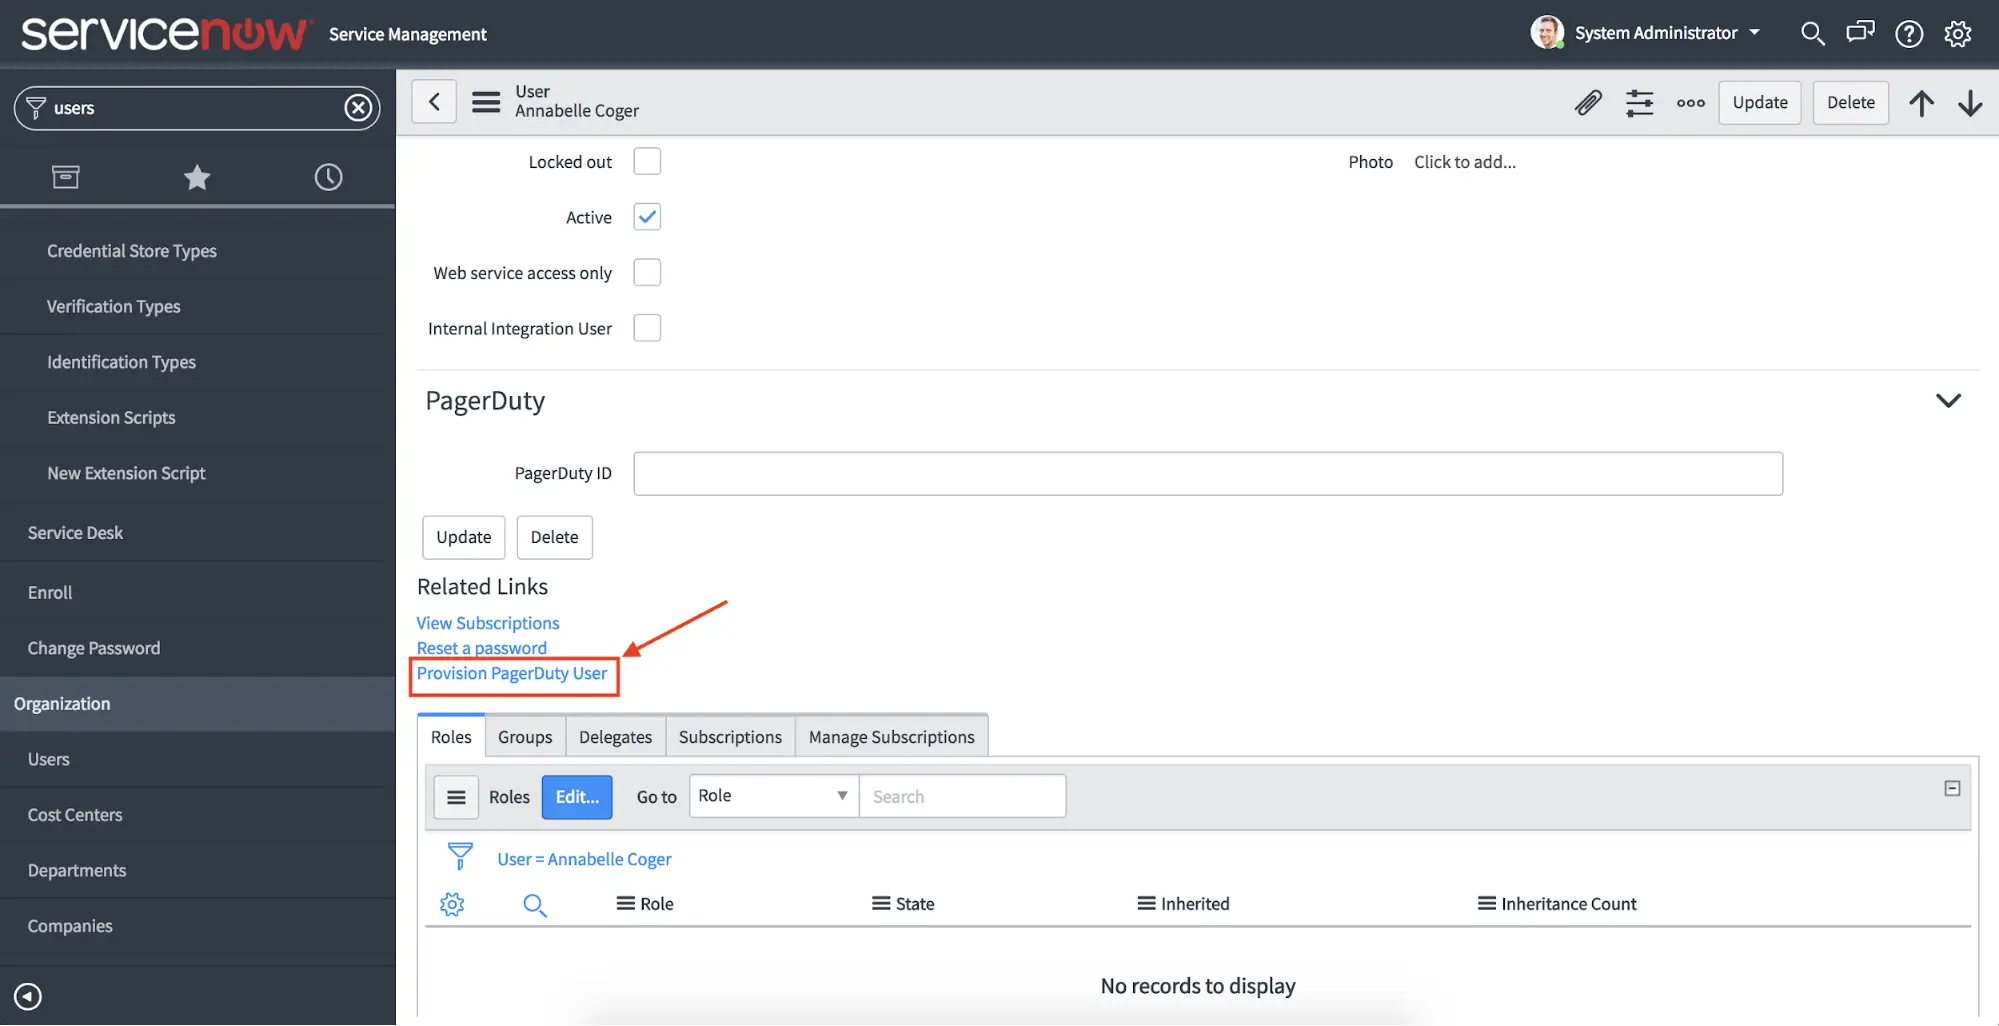 *Provision PagerDuty user* 3. A notification indicates that the user is being provisioned. Upon completion, the integration automatically populates the **PagerDuty ID** field and creates the user in PagerDuty with the matching name and email address. 4. If the user has a **Business phone** or **Mobile phone** populated in ServiceNow, the integration automatically provisions them as contact methods and notification rules in PagerDuty. 5. To provision multiple users simultaneously, select them and choose **Provision PagerDuty User** from the bulk actions dropdown menu on the Users list view. 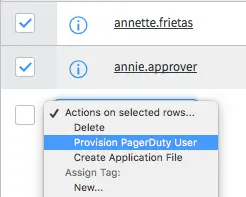 *Select Provision PagerDuty User* ## Verify ServiceNow and PagerDuty Communication To verify that PagerDuty and ServiceNow are communicating, create a new incident in ServiceNow and set the **Assignment Group** field to a group mapped to PagerDuty. The following example shows an incident assigned to the Database group and subsequently reassigned to the CAB Approval group, as documented in the Activity log. 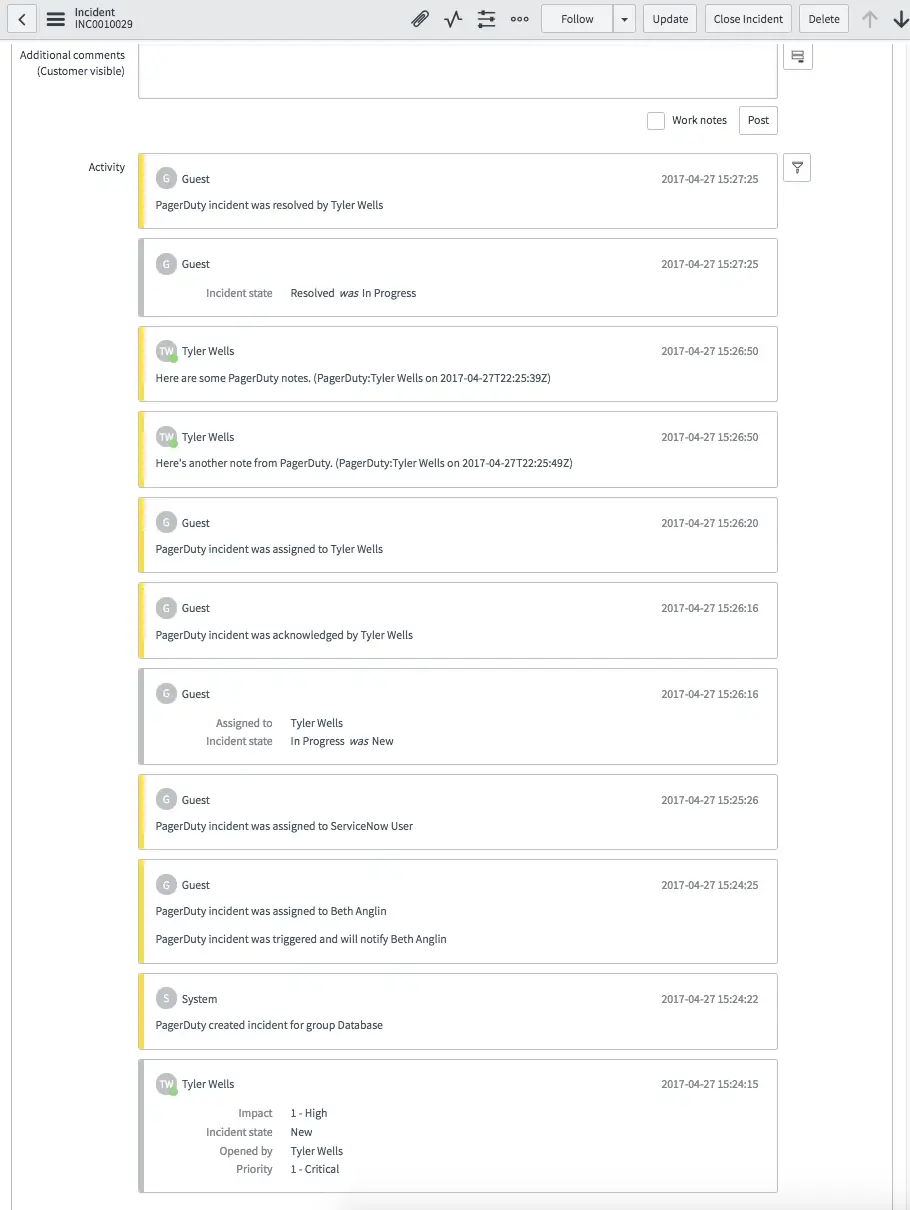 *Example incident* When you resolve the incident in PagerDuty, it resolves in ServiceNow, and vice versa. ServiceNow maintains a log of activities that occur within PagerDuty. > **Note:** After you successfully install and configure the PagerDuty application in your ServiceNow instance, index the following columns in ServiceNow based on your chosen mapping type. > > For Assignment Group only mapping: > > - `sys_user_group.x_pd_integration_pagerduty_escalation` > - `sys_user_group.x_pd_integration_pagerduty_service` > - `sys_user_group.x_pd_integration_pagerduty_webhook` > > For Assignment Group and Configuration Item mapping: > > - `sys_user_group.x_pd_integration_pagerduty_escalation` > - `cmdb_ci.x_pd_integration_pagerduty_service` > - `cmdb_ci.x_pd_integration_pagerduty_webhook` > > Regardless of mapping, index these four columns: > > - `sys_user.x_pd_integration_pagerduty_id` > - `sys_user.email` > - `incident.x_pd_integration_incident` > - `task.x_pd_integration_incident_id` > > Indexing helps decrease response times when the PagerDuty application queries the incidents, group, user, and CMDB tables. PagerDuty initiates [webhook retry logic](/developer/webhook-behavior#error-handling-and-retries) if response times exceed a specific threshold. If thresholds are exceeded repeatedly, the webhook extension disables temporarily. ## Use PagerDuty Add Responders and Conference Bridge Features in ServiceNow The ServiceNow integration allows you to use PagerDuty's [Add Responders](/incident-management/incidents/add-responders) and [Conference Bridge](/incident-management/incidents/conference-bridge) features from the ServiceNow interface. To use these features within ServiceNow, you must add the `x_pd_integration.incident_response` role to your ServiceNow user record. ## Upgrade Your PagerDuty Integration Before starting the upgrade process for your PagerDuty integration, complete the following items detailed in the [PagerDuty Community Post](https://community.pagerduty.com/t/whats-new-with-pagerdutys-servicenow-v6-integration/4739): - Revert customizations prior to upgrading from the store, as the upgrade path does not patch modified files. - Prior to running the `MIGRATE WEBHOOKS TO v6.0` script, update the **PagerDuty Settings** page, and run both the **Test REST API Connection** and **Test ServiceNow User Authentication** scripts to ensure a successful `200` status code. - After you successfully upgrade, determine which customizations you must reapply. Capture these in an update set and store a copy for future reference. ## Connect Multiple PagerDuty Services to a Single Assignment Group To connect multiple PagerDuty services to one specific Assignment Group in ServiceNow, perform the following actions: 1. For each PagerDuty service, [add a ServiceNow v6 extension](#add-the-servicenow-extension-to-an-existing-pagerduty-service) and enter your ServiceNow instance details. 2. Append a parameter to the ServiceNow URL to target the specific Assignment Group. For example, if your Assignment Group name is `IT HelpDesk` and your standard URL is `https://dev70781.service-now.com/api/x_pd_integration/pagerduty2sn`, append `?group=IT%20HelpDesk` to the end of the URL. Ensure that you use `%20` to encode spaces. The Assignment Group must be provisioned to a PagerDuty service for this functionality to work. ## Connect Multiple PagerDuty Services to Configuration Items You can map multiple PagerDuty services to a single Configuration Item in ServiceNow. For each PagerDuty service, [add a ServiceNow v6 extension](#add-the-servicenow-extension-to-an-existing-pagerduty-service) and enter your ServiceNow instance details. Append a parameter to the ServiceNow URL to target the specific Configuration Item: 1. Right-click the Configuration Item in ServiceNow and copy the `sys_id`. 2. Append `?ci=insert_long_sys_id_here` to the ServiceNow destination URL (for example, `https://dev70781.service-now.com/api/x_pd_integration/pagerduty2sn?ci=insert_long_sys_id_here`). 3. Save the extension configuration with the username, password, and required flags. 4. *Optional*: You can combine the Assignment Group and Configuration Item parameters (for example, `pagerduty2sn?group=IT%20HelpDesk&ci=insert_long_sys_id_here`). **Note**: This configuration applies to PagerDuty app version 6.2.05 from the ServiceNow Store. --- URL: https://docs.pagerduty.com/integrations/servicenow-integration-guide/advanced-servicenow-configuration # Advanced ServiceNow Configuration How to leverage the full power and versatility of the ServiceNow integration [ServiceNow v8](/integrations/servicenow-integration-guide) is a robust, highly-customizable enterprise integration that you can configure to meet your business’s needs. Below are some guidelines to configure advanced features, or create customizations. Please note: - [Advanced Configurations](#advanced-configurations): This section covers concepts and instructions to configure advanced, _PagerDuty-supported_ features that are available out of the box. - [Advanced Customizations](#advanced-customizations): This section covers concepts and instructions for _unsupported_ customizations that may alter the integration’s out-of-the-box behavior. > **Looking for a Different Version?:** [Advanced ServiceNow Configuration](/integrations/advanced-servicenow-configuration-v7) for the v7 integration is also available. ## Advanced Configurations > **Support Notes:** - The Advanced Configurations section covers PagerDuty-supported features that are available out of the box. > - For assistance with advanced ServiceNow configurations, please contact your account manager/sales representative, or reach out to [PagerDuty Services](https://www.pagerduty.com/services/). ### Configure Escalation Policy Priority Mapping The ServiceNow v8 integration allows Assignment Groups to assign more than one escalation policy to incidents based on incident priority in ServiceNow. For example, if you would like one escalation policy assigned to incidents with a priority of **Moderate** or below and another for priorities above **Moderate**, you can map escalation policies to this scheme. #### To configure escalation policy priority mapping via the PagerDuty menu 1. Navigate to **PagerDuty** in the application navigator and select **Map Priority to Escalation Policy**. 2. Click **New** and select the **Assignment Group**, **Escalation Policy** and **Priority** you wish to map and check the **Active** checkbox. 3. Click **Submit** to save. If you would like to deactivate this mapping, return to the **Map Priority to Escalation Policy** screen, click the **status** in the Active column, uncheck the **Active** checkbox and click **Update**. You may repeat this process to map multiple escalation policies to different priorities. #### To configure escalation policy priority mapping on an individual Assignment Group 1. Search and click into your preferred **Assignment Group**. Select the **PagerDuty Escalation Policies** tab and click **New**. 2. In the **Escalation Policy** field, search and select your preferred **escalation policy**. In the Priority field, search and select which **priority** should be mapped to that escalation policy. Check the **Active** checkbox to activate this setting and click **Submit**. You may repeat this process to map multiple escalation policies to different priorities. Once configured, when an incident is assigned to that assignment group and the mapped priority, the mapped escalation policy will be assigned to that incident. ### Incident Types and Custom Field Mappings Please see our [Sync Incident Types with ServiceNow](/integrations/servicenow-integration-guide/advanced-servicenow-configuration/sync-incident-types-with-servicenow) and [ServiceNow Custom Field Mappings](/integrations/servicenow-integration-guide/advanced-servicenow-configuration/servicenow-custom-field-mappings) articles for more information. ### Service Reassignment Sync Please see our [Sync Service Reassignment with ServiceNow](/integrations/servicenow-integration-guide/advanced-servicenow-configuration/sync-service-reassignment-with-servicenow) article for more information. ### v3 Webhooks #### Supported Event Types **Supported Event Types** - `incident.triggered` - `incident.acknowledged` - `incident.unacknowledged` - `incident.annotated` - `incident.delegated` - `incident.escalated` - `incident.reassigned` - `incident.resolved` The introduction of v3 webhooks adds support for the following event types: - `incident.priority_updated` - `incident.responder.added` - `incident.responder.replied` - `incident.conference_bridge.updated` - `incident.workflow.completed` - `incident.workflow.started` #### Event Types in v8 **Event Types in v8** ##### Responder Events - `incident.responder.added` - `incident.responder.replied` The above PagerDuty responder updates sync to the ServiceNow Incident Work Notes and in the **PagerDuty Response** table in ServiceNow. ##### Priority Events - `incident.priority_updated` Responders no longer need to publish PagerDuty notes to force-sync priority changes to ServiceNow. When you update the PagerDuty incident’s priority, the ServiceNow incident record is also updated to reflect the corresponding priority (as defined in the priority mappings). ##### Conference Bridge Events - `incident.conference_bridge.updated` New PagerDuty incidents triggered with conference bridges will have that reflected in the **Conference Bridge** field of the ServiceNow incident. Changing the conference bridge on an existing PagerDuty incident will update the field in ServiceNow. #### Asynchronous Webhook Processing Prior to the ServiceNow v8 release, webhooks were processed synchronously in ServiceNow with some known implications. One of these implications was the temporary disablement of webhooks when the processing time exceeded the 15 seconds timeout of v2 webhooks. Generic Webhooks (v3) expect a successful 2xx response within five seconds. To mitigate timeout issues, ServiceNow v8 changes the default webhook processing mode from synchronous to asynchronous for both v2 and v3 webhooks. In asynchronous mode, the ServiceNow webhook processor will immediately send a 200 response to PagerDuty and queue the message for background processing. Multiple Scheduled Script Execution jobs will be provisioned to de-queue and process the webhook events asynchronously. The logs for these jobs can be found in **System Logs** → **Events** (`x_pd_integration.process_webhook`), which shows a record of the jobs and their state. The process for checking webhook failures remains the same: look for error messages in the webhook import logs, and then verify if a new record was created in the **Webhook Import Rows** table. ### Clone Data Preserver During the [cloning process](https://www.servicenow.com/docs/bundle/yokohama-platform-administration/page/administer/managing-data/concept/c_SystemClone.html), the system clone job will read from the **clone\_data\_preserver** table to determine which tables and table objects should be preserved within the target instance. - Records that have a matching Sys ID in the target table will remain unchanged (i.e., preserved) and will not be overwritten when cloning from the source table. - If the clone data preserver record includes filter conditions, preservation will only apply to records in the target table that match the conditions. - If no record in the target table matches the Sys ID, then the record clones from the source table to the target table (i.e., adding new records to the target). The ServiceNow integration package includes a Clone Data Preserver fix script. This uses ServiceNow’s native fix script functionality to automatically create records in the Clone Data Preserver table after you install or upgrade the PagerDuty application. The fix script creates Clone Data Preserver records to ensure that objects with PagerDuty mappings in the target table are preserved, and it prevents these mappings from being overwritten when cloning from the source table. If you are using an older version of the integration that does not include the Clone Data Preserver fix script, follow the steps below to configure the Clone Data Preserver feature in ServiceNow. **Manually Configure Clone Data Preserver** > **Required User Permissions:** In order to use the Clone Data Preserver feature, your ServiceNow role must include `clone_admin` or `admin`. In some cases, you may want to clone your ServiceNow production data to a developer instance. The Clone Data Preserver is a ServiceNow feature that defines what data should **not** be replaced when cloning one environment into another. - [Clone results based on Exclusion and Preserver configuration](https://support.servicenow.com/kb?id=kb_article_view\&sysparm_article=KB0717012) To clone the PagerDuty integration in a way that it remains functional, you can use the Clone Data Preserver to preserve specified PagerDuty fields. Following the process below, you will make Clone Data Preservers for the four following tables: ### System Property Table To begin, we'll address PagerDuty fields in the System Property table (`sys_properties`): 1. Navigate to **System Clone Preserve Data**, and select **New**. 2. Create a new record for the Clone Data Preserver and select the table **System Property \[sys\_properties]**. 3. Create `OR` conditions for the following **Names**. - **Name Is** `x_pd_integration.default_user` `OR` - **Name Is** `x_pd_integration.instance_url` `OR` - **Name Is** `x_pd_integration.sn2pd_mapping` `OR` - **Name Is** `x_pd_integration.default_service` `OR` - **Name Is** `x_pd_integration.api_key` \`OR - **Name Is** `x_pd_integration.webhook_restapi` `OR` - **Name Is** `x_pd_integration.sn_auth_user` `OR` - **Name Is** `x_pd_integration.sn_auth_userpwd` - **Name Is** `x_pd_integration.connection_id` 4. Click **Submit**. 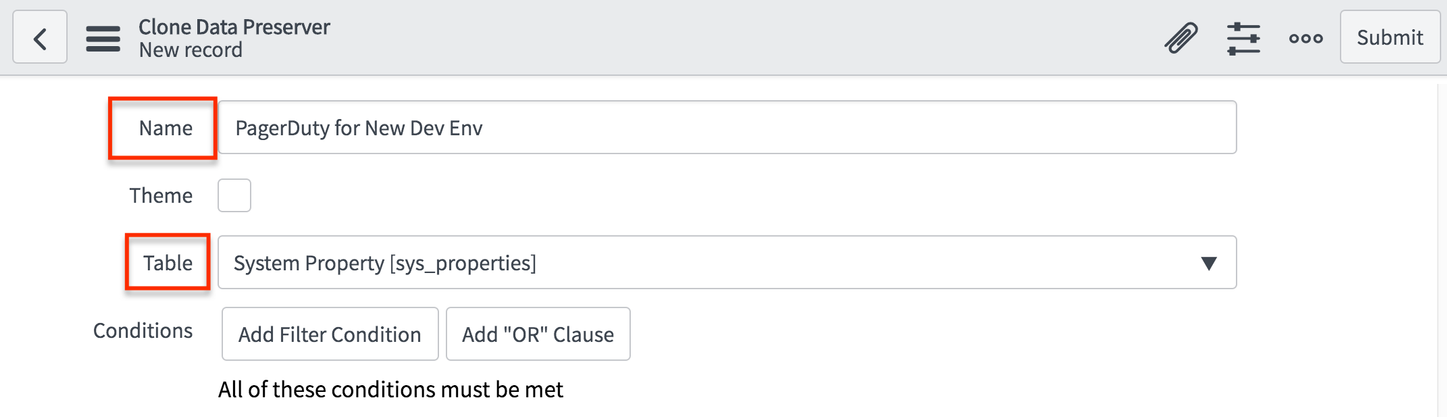 ### User Table Next, create a Clone Data Preserver for the `sys_user` table: 1. Navigate to **System Clone Preserve Data**, and select **New**. 2. Create a new record for the Clone Data Preserver and select the table **User \[sys\_user]**. 3. Create a filter with the following condition: 1. **PagerDuty ID** is not `empty`. 4. Click **Submit**. 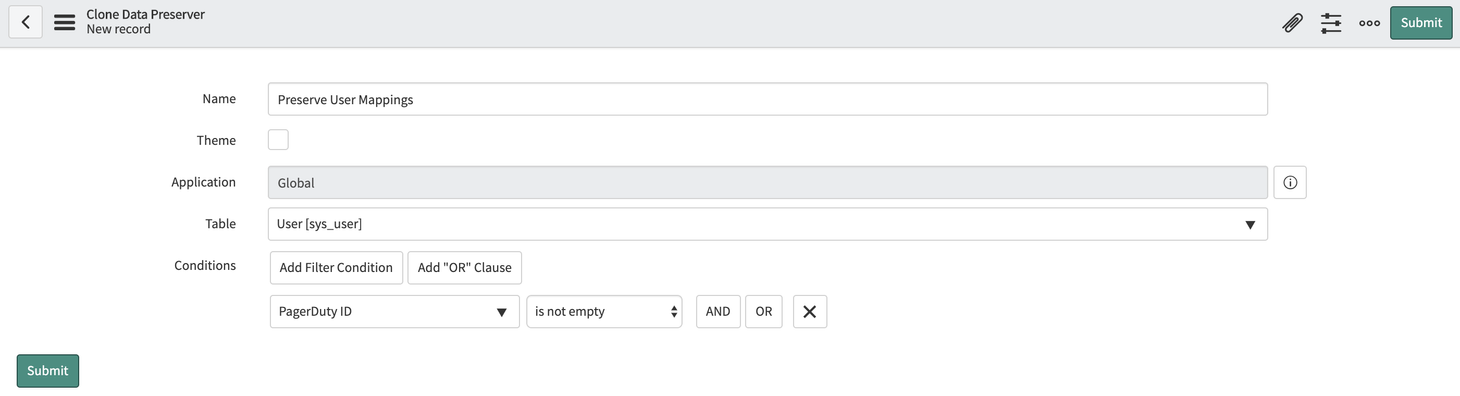 ### Group Table Thirdly, create a Clone Data Preserver for the `sys_user_group` table: 1. Navigate to **System Clone Preserve Data**, and select **New**. 2. Create a new record for the Clone Data Preserver and select the **Group \[sys\_user\_group]** table. 3. Create filters with the following conditions: - **PagerDuty escalation** `is not empty` `OR` - **PagerDuty schedule** `is not empty` `OR` - **PagerDuty service** `is not empty` `OR` - **PagerDuty team** `is not empty` `OR` - **PagerDuty webhook** `is not empty` 4. Click **Submit**. 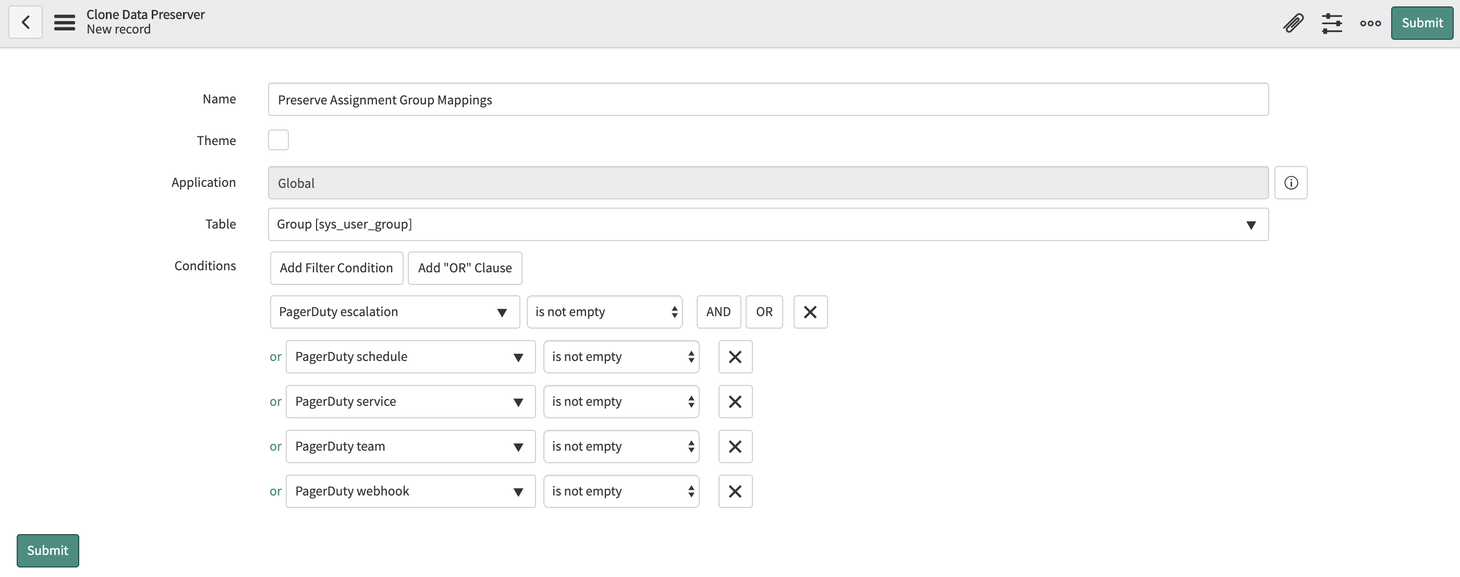 ### Configuration Item Table Lastly, create a Clone Data Preserver for the `cmdb_ci` table. 1. Navigate to **System Clone Preserve Data**, and select **New**. 2. Create a new record for the Clone Data Preserver and select the **Configuration Item \[cmdb\_ci]** table. 3. Create filters with the following conditions: - **PagerDuty service** `is not empty` `OR` - **PagerDuty webhook** `is not empty` 4. Click **Submit**. 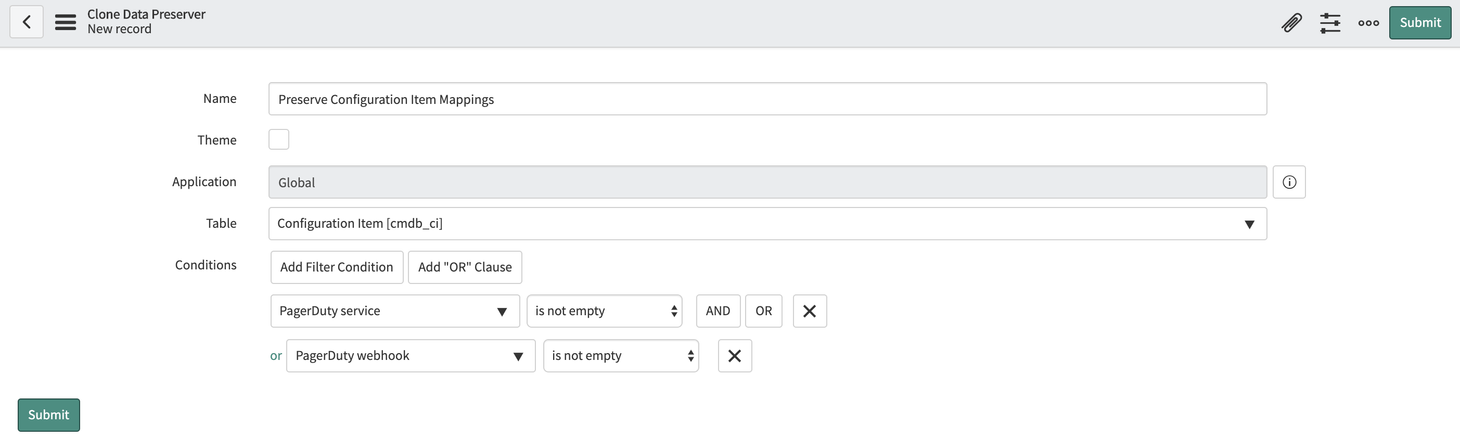 #### Clone Data Preserver Fix Script Change Log ### v8.3 **Clone Data Preserver Fix Script Change Log** With the release of [ServiceNow OAuth Authentication](https://pagerduty-enterprise-transifex.readme.io/main/docs/servicenow-oauth-authentication), the following tables and fields have been added to the Clone Data Preserver Fix Script: - x\_pd\_integration.auth\_method - x\_pd\_integration.oauth\_app - x\_pd\_integration.oauth\_client\_id - x\_pd\_integration.oauth\_app\_user ### Use a MID Server ServiceNow allows you to configure a [Management, Instrumentation, and Discovery (MID) Server](https://www.servicenow.com/docs/bundle/yokohama-servicenow-platform/page/product/mid-server/concept/mid-server-landing.html) that runs Windows services or UNIX daemons on a server in your local network. 1. To enable, navigate to **PagerDuty Settings** in the application navigator and scroll to the **Activity Stream Customization** section. 2. Check the **Use MID Server** checkbox. 3. The **Set MID Server field** will have the default MID server auto-populated. Enter your parameters in the **ECC parameters** field. 4. Click **Save**. ## Advanced Customizations > **Support Note:** The Advanced Customizations section illustrates ways you may choose to customize workflows in the ServiceNow integration. Please note, however, that any customizations which alter the integration’s out-of-the-box behavior are not supported by the PagerDuty Support team. ### Best Practices for Automation Please ensure the following: - **Do not** auto-populate or modify any fields that have dependencies, i.e., fields that use data from the field elsewhere within the integration. - **Do not** auto-populate or modify any fields that the integration uses to map objects between ServiceNow and PagerDuty. For example, if you map Configuration Items to PagerDuty services in the integration, do not set the CI field in the inbound field rules. If you have enabled priority synchronization, do not define any rules that set the Urgency, Impact or Priority fields in ServiceNow incidents. Keeping automation simple and non-overlapping will help you avoid unpredictable or unstable behavior. > **Availability:** Premium features such as PagerDuty Custom Field synchronization and “Create a ServiceNow Incident” as an Incident Workflow Action are only available on the Enterprise Incident Management plan. Please [contact our Sales Team](https://www.pagerduty.com/contact-sales/) for more information. ### Business Rules: ServiceNow to PagerDuty A business rule is a server-side script that runs when a record is displayed, inserted, deleted, or when a table is queried. Business rules are used to automatically change values in form fields when the specified conditions are met. PagerDuty Integration Business Rules can be found in ServiceNow under **PagerDuty** → **Configuration** → **Configuration Files** → select the **Business Rules** tab. All aspects of the integration that concern any flow of data from ServiceNow to PagerDuty are handled by business rules. If the conditions of a business rule are met, the rule and its associated script runs, which invokes a transaction with the PagerDuty API to perform the necessary actions in PagerDuty. Most processes that send updates from ServiceNow to PagerDuty will follow this flow: Business Rule → Event Queue → Script Action → Script Includes. #### Notable Fields - **Table**: The table to be updated. - **Active**: Whether the rule is active or inactive. - **When to run** (tab): Shows the conditions that must be met for the Business Rule to run. - **Order**: Stacks priority of rule execution. - **When**: After, before, async (in relation to the action that is taking place on the table, e.g., after an insert happens on table x, do y). - **Insert/Update/Delete/Query**: The action that takes place on the table, e.g., a record is created, updated, deleted, queries. - **Actions** (tab): Specifies fields in ServiceNow to update when the business rule executes. - **Advanced** (tab): Will often contain a script that initiates additional logic. This is typically where an event for the business rule is created and added to the event queue. This code can reference other scripts and script actions within ServiceNow. ### Inbound Field Rules You can define rules to automatically set fields in a ServiceNow incident based on the field values in PagerDuty webhooks. The integration can automatically set required fields when incidents are created or modified. Additionally, you can run custom JavaScript code when incident lifecycle data is imported into ServiceNow. 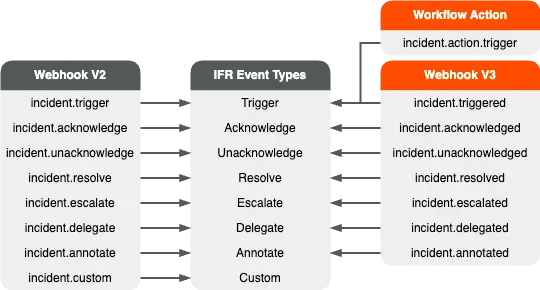 *Automatically set fields in a ServiceNow incident* With the introduction of v3 webhooks, some changes have been made to the payload data compared to v2 webhooks. As a result, the existing Inbound Field Rules that are configured to process v2-webhook-specific data will not function properly with v3 webhooks. You will have to manually update their existing v2-based Inbound Field Rules to point to the appropriate v3 webhook payload fields post-upgrade. #### Configure Inbound Field Rules 1. In ServiceNow, go to **PagerDuty Configuration** → **Inbound Field Rules** → **New** to open the form to create a new field rule. 1. If you wish to make the rule active immediately, check **Active**. 2. Select the **PagerDuty Webhook Type** to specify which event the rule should be applied to. 1. For a list of webhook types, see [Webhooks Overview: Event Types](/developer/webhooks-overview#event-types). 2. The **Trigger** event type applies to manually-triggered incidents created through the new [Create a ServiceNow Incident Workflow action](/ai-automation/automation/incident-workflows#add-actions). 3. Select the **ServiceNow incident field** to be populated, and define how the field should be set: 1. **Set Default Value**: Use a fixed value to populate the field. 2. **Set From PagerDuty Webhook Payload**: Using [dot notation](https://developer.mozilla.org/en-US/docs/Web/JavaScript/Reference/Operators/Property_accessors#dot_notation), specify the namespace path to the property of the PagerDuty webhook to be used. 4. A free form text field will appear, in which you can specify the default value for the field. #### Set Values Based on the Webhook Payload 1. Confirm the properties that are available from the webhook payload. 1. When setting values based on the webhook payload, a field named **PagerDuty webhook payload field** will appear, in which you can enter the property of the webhook to reference. 2. To see available properties, you can look in **Webhook Import Rows**; sample JSON-encoded objects should be saved in the **Payload** column. 2. Navigate to the **inbound field rule** to test setting this field. 1. If you are setting a field from PagerDuty webhooks, you can test the inbound rule by selecting **Test Set From PagerDuty Webhook Payload**. This will allow you to specify the **Webhook Payload Field** name, provide a sample payload (copied from one of your **Webhook Import Rows** table), then verify the returned value. #### Run a Lookup Script 1. **Enable** this option to run custom JavaScript that performs additional actions and defines the final value applied to a ServiceNow incident field. This can be used instead of defining field rules to obtain the additional data. 2. A text box will appear when you check **Run lookup script**. Within the script’s body there is a variable named `value`, whose value will be retrieved from the webhook payload specified in the **PagerDuty webhook payload field**. 3. By the end of the script, define a value for the variable `result`, whose value will be used to populate the field. It is not necessary to commit or save the record at the end of the script. #### Update Inbound Field Rules to Reference the v3 Webhook Payload ##### Check Inbound Field Rules 1. Check your **Inbound Field Rules** to confirm which rules set ServiceNow incident fields based on PagerDuty webhook payloads. 2. The `log_entries` parameter in v2 webhooks has been modified to `first_trigger_log_entry` for v3 webhooks. To make an additional API call to retrieve the `first_trigger_log_entry` information, a new flag `fetch_first_trigger_log_entry` (System Property) has been introduced in ServiceNow v8. If you have any Inbound Field Rules referencing the `log_entries` parameter in v2 webhooks, this additional API call will be required in order to retrieve information from the new `first_trigger_log_entry` field. Please follow these steps to enable the flag: 1. Navigate to your ServiceNow instance and log in. 2. Open the **System Properties** module, which you can find in the menu type `sys_properties.list`. 3. Search for the new property `fetch_first_trigger_log_entry` that controls the additional API call for `first_trigger_log_entry` data. 4. Set the property value to **true** if you want the system to include `first_trigger_log_entry` information in the payload of v3 webhooks. Set it to **false** if you do not want the additional call to be made. 5. After the flag is enabled, you can update the inbound field rule to reference the `first_trigger_log_entry field`: `data.first_trigger_log_entry`. ##### Update the Inbound Field Rule 3. Repeat the following steps for each Inbound Field Rule identified in Step 1 of [Check Inbound Field Rules](#check-inbound-field-rules) above. 1. Find an example v3 webhook payload: 1. Navigate to **Pagerduty** → **Import Rows** → **Webhook Import Rows**. 2. Find an example v3 webhook, matching the PagerDuty webhook type of your inbound find rule. 3. Copy the example v3 webhook payload. 4. Navigate back to the inbound field rule and check the **PagerDuty webhook payload** field. 1. Reference the example v3 webhook payload to confirm if the field needs to be updated to align with the v3 payload structure. 2. Update the **PagerDuty webhook payload field** as necessary. 5. Test the inbound rule by selecting **Test Set From PagerDuty Webhook Payload**. This will allow you to specify the **Webhook Payload Field** name, provide a sample payload (e.g., the example webhook payload copied from the Webhook Import Rows), then verify the returned value. ### Create a ServiceNow Incident as a Workflow Action Please read our [Incident Workflows](/ai-automation/automation/incident-workflows) article for more information about creating a ServiceNow Incident Workflow action. 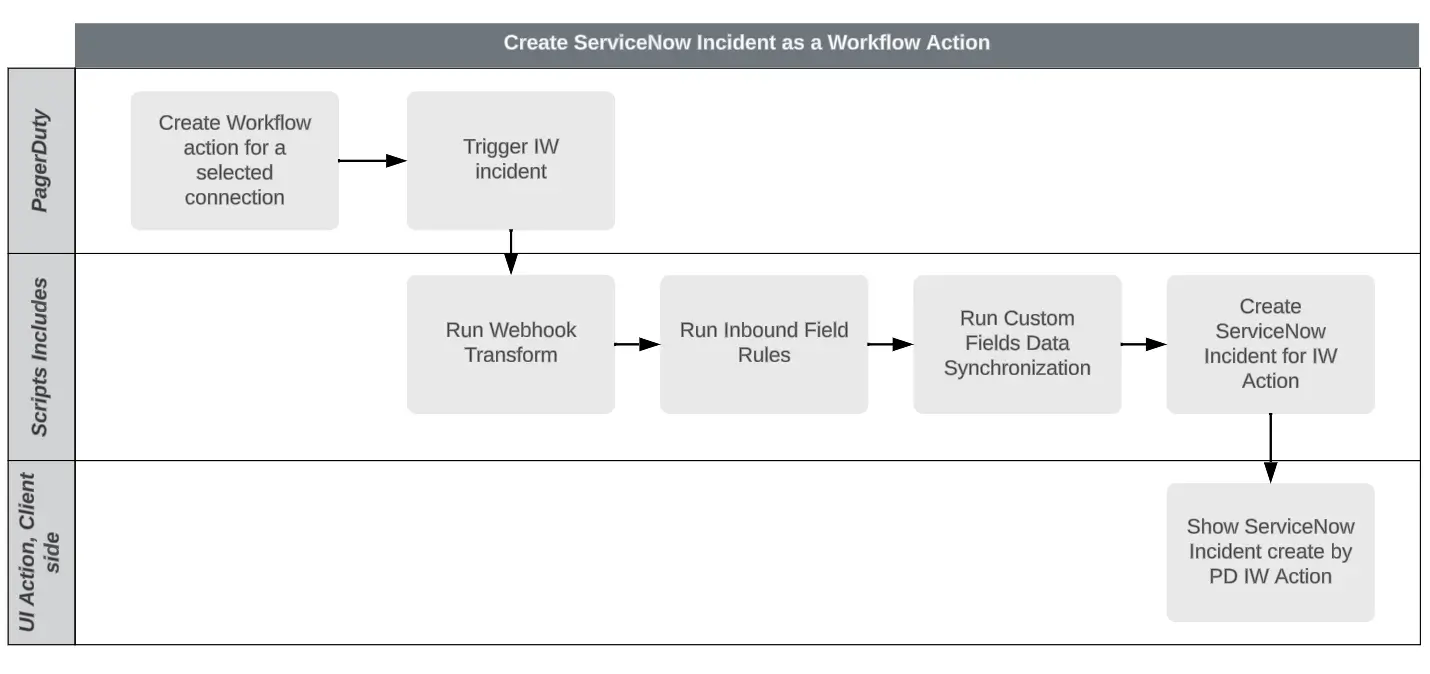 *Create a ServiceNow Incident as a Workflow Action* --- URL: https://docs.pagerduty.com/integrations/servicenow-integration-guide/advanced-servicenow-configuration/servicenow-custom-field-mappings # ServiceNow Custom Field Mappings Map ServiceNow incident fields with PagerDuty Custom Fields You can map ServiceNow incident fields and PagerDuty [custom fields](/incident-management/incidents/custom-fields-on-incidents) that share the same data type. Once these fields are mapped, field values sync bidirectionally. The PagerDuty incident and ServiceNow incident must be linked for those fields to sync. Custom fields created within ServiceNow count towards your account custom field limits. For more information, see [custom fields on incidents](/incident-management/incidents/custom-fields-on-incidents). > **Prerequisite:** You must configure the [ServiceNow Integration](/integrations/servicenow-integration-guide) to use this feature. > > Custom field mappings and syncing are available on the Enterprise Incident Management plan. Contact our [Sales Team](https://www.pagerduty.com/contact-us/#contact-sales) to upgrade to a plan with this feature. > **Required User Permissions:** - **In ServiceNow**: Only users with the `x_pd_integration.admin` role can view, create, and delete custom field mappings in ServiceNow. > - **In PagerDuty**: Only Global Admins and the Account Owner can create, edit, and delete custom fields. ## View Custom Field Mappings You can only view custom field mappings in ServiceNow. To view your custom field mappings, navigate to **PagerDuty** → **Custom Field Mappings**.  *Custom Field Mappings in ServiceNow* When viewing [incident types](/incident-management/incidents/incident-types) in PagerDuty, custom fields mapped to a ServiceNow field display **ServiceNow ITSM** in the **Managed By** column. ## Create Custom Field Mappings > **Restrictions:** - Field mappings are one-to-one. A ServiceNow field can only map to one custom field, and a custom field can only map to one ServiceNow field. Once you map a field, it does not appear as an option when creating a new mapping. > - The PagerDuty custom field data type must match the data type expected by the ServiceNow field. > - You cannot map a read-only ServiceNow incident record field to a PagerDuty custom field. > - A unique name is required for each incident type and custom field object. > - The default synchronization direction for new mappings is **bidirectional**, but you can optionally change it to unidirectional. See the instructions in the following section. 1. In ServiceNow, navigate to **PagerDuty** → **Field Mapping** → **Custom Field Mappings**. 2. Click **New** in the upper right to create a new mapping. 3. Configure the mapping using the following fields on the screen: | Field | Value | | :------------------------- | :----------------------------------------------------------------------------------------------------------------------------------------------------------------------------------------------------------------------------------------------------------------------------------------------------------------------------------------------------------------------------------------------------------------------------------------------------------------------------------------------------------------------------------------------------------------------------------------------------------------------------------------------------------------------------------------------------------------------------------------------------------------------------------------------------------------------------------------------------------------------------------------------------------------------------------------------------------------------------------------------------------------------------------------------------------------------------------------------------------------------------- | | **ServiceNow field** | Select your desired ServiceNow field from the dropdown menu. The integration only fetches ServiceNow fields that match the [approved field types](/integrations/servicenow-integration-guide/advanced-servicenow-configuration#servicenow-fields-eligible-for-mapping). If you choose to map a **Choice** field, you must create a new PagerDuty custom field to ensure consistent choice options across platforms. | | **Define Sync Direction** | Select one of the following synchronization options:
- **Bidirectional**: Custom field values sync bidirectionally between PagerDuty and ServiceNow.
- **Sync from ServiceNow to PagerDuty**: Custom field values sync in one direction, from ServiceNow to PagerDuty.
- **Sync from PagerDuty to ServiceNow**: Custom field values sync in one direction, from PagerDuty to ServiceNow. | | **PagerDuty Custom Field** | Choose one of the following options:
- **Use an existing Custom Field**: Select an existing field from the dropdown menu. Only custom fields with the same data type as the ServiceNow field appear. This option is not available when mapping a ServiceNow **Choice** field.
- **Create a new Custom Field**: Configure the new PagerDuty custom field by entering the following details:
- **Display Name**: Enter the name for the field when displayed in the PagerDuty incident UI.
- **Incident Type**: Select the incident type that uses this custom field. The default selection is Base Incident.
- **Field Name**: This field automatically populates with the display name. Refer to this field in the API by the field name. The field name can only contain letters, numbers, and underscores.
- **Description** (_optional_): Enter a short description of the information this field displays in incidents.
- **Field Type**: This field automatically populates with the type that matches the chosen ServiceNow field and you cannot change it. | 4. Review the mapping and click **Save**. A modal appears indicating the field mapping was created successfully. ### Edit Custom Field Mappings At this time, you cannot edit field mappings. Once created, you must delete and then recreate custom field mappings to remap a field. ### Delete Custom Field Mappings You can delete the mapping between a ServiceNow field and a PagerDuty custom field. This action does not affect any field values already set on existing incidents and does not delete the fields. To delete a custom field in PagerDuty after removing a mapping, see [custom fields on incidents](/incident-management/incidents/custom-fields-on-incidents#delete-a-custom-field). > **Warning:** This action cannot be undone. You can only delete mappings from ServiceNow. 1. In ServiceNow, navigate to **PagerDuty** → **Field Mapping** → **Custom Field Mappings**. 2. Select the **record** you want to delete. 3. Click **Delete**. 4. In the confirmation modal, click **Delete** again to confirm. ## ServiceNow Fields Eligible for Mapping ### Eligible Data Types 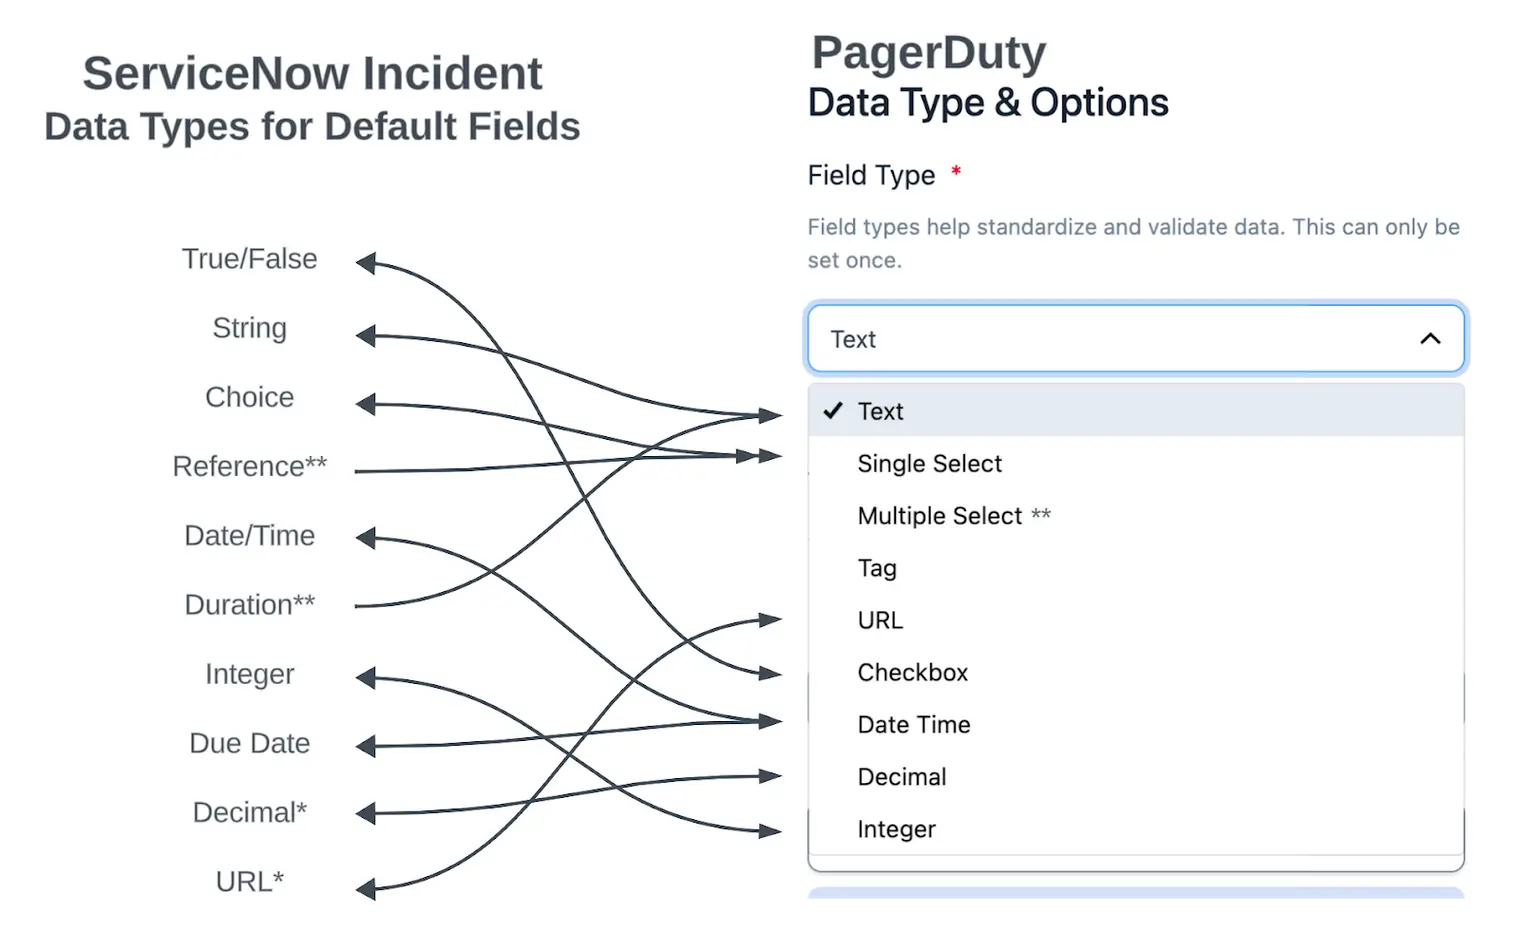 - Choice (Choice, String with Choice Set, Integer with Choice Set) without dependent values. - **Note**: Fields associated with choice sets of type “Suggestion” are treated as their underlying data type (String, Integer, and other base types), meaning they are not treated as choice fields. - Date Time (`glide_date_time` and `due_date`) - URL - String - Integer - Decimal - Boolean (True/False) ### Eligible ServiceNow Incident Record Fields The following bidirectional fields are available with version 8.0 or higher of our ServiceNow integration: | ServiceNow Field | Field Name | ServiceNow Type | PagerDuty Type | | :------------------ | :------------------------------- | :--------------- | :------------- | | Active | active | True/False | Checkbox | | Activity due | activity\_due | Due Date | Date/Time | | Actual end | work\_end | Date/Time | Date/Time | | Actual Start | work\_start | Date/Time | Date/Time | | Approval | approval | Choice (String) | Single Select | | Approval set | approval\_set | Date/Time | Date/Time | | Business impact | business\_impact | String | Text | | Category | category | Choice (String) | Single Select | | Child Incidents | child\_incidents | Integer | Integer | | Close code | close\_code | Choice (String) | Single Select | | Close notes | close\_notes | String | Text | | Closed | closed\_at | Date/Time | Date/Time | | Conference Bridge | x\_pd\_integration\_conf\_bridge | String | Text | | Contact type | contact\_type | Choice (String) | Single Select | | Correlation display | correlation\_display | String | Text | | Correlation ID | correlation\_id | String | Text | | Description | description | String | Text | | Due date | due\_date | Date/Time | Date/Time | | Expected start | expected\_start | Date/Time | Date/Time | | Follow up | follow\_up | Date/Time | Date/Time | | Impact | impact | Choice (Integer) | Single Select | | Incident state | incident\_state | Choice (Integer) | Single Select | | Knowledge | knowledge | True/False | Checkbox | | Notify | notify | Choice (Integer) | Single Select | | Number | number | String | Text | | On hold reason | hold\_reason | Choice (Integer) | Single Select | | Opened | opened\_at | Date/Time | Date/Time | | Order | order | Integer | Integer | | Probably cause | cause | String | Text | | Reassignment count | reassignment\_count | Integer | Integer | | Reopen count | reopen\_count | Integer | Integer | | Resolved | resolved\_at | Date/Time | Date/Time | | Severity | severity | Choice (Integer) | Single Select | | Short description | short\_description | String | Text | | State | state | Choice (Integer) | Single Select | | Upon approval | upon\_approval | Choice (String) | Single Select | | Upon reject | upon\_reject | Choice (String) | Single Select | | Urgency | urgency | Choice (Integer) | Single Select | The following fields are available with version 8.2 or higher of our ServiceNow integration. These fields are not bidirectional and only sync from ServiceNow to PagerDuty: | ServiceNow Field | Field Name | ServiceNow Type | PagerDuty Type | | :-------------------- | :---------------------- | :--------------------------- | :------------- | | Assigned to | assigned\_to | Reference | Text | | Assignment group | assignment\_group | Reference | Text | | Business resolve time | business\_stc | Integer (Read-only) | Integer | | Caller | caller\_id | Reference | Text | | Caused by Change | caused\_by | Reference | Text | | Change Request | rfc | Reference | Text | | Closed by | closed\_by | Reference | Text | | Company | company | Reference | Text | | Configuration Item | cmdb\_ci | Reference | Text | | Contract | contract | Reference | Text | | Delivery Plan | delivery\_plan | Reference | Text | | Delivery task | delivery\_task | Reference | Text | | Effective number | task\_effective\_number | String (Read-only) | Text | | Last reopened by | reopened\_by | Reference | Text | | Last reopened at | reopened\_time | Date/Time (Read-only) | Date/Time | | Location | location | Reference | Text | | Opened by | opened\_by | Reference | Text | | Parent | parent | Reference | Text | | Parent Incident | parent\_incident | Reference | Text | | Problem | problem\_id | Reference | Text | | Resolve time | calendar\_stc | Integer (Read-only) | Integer | | Resolved by | resolved\_by | Reference | Text | | Service | business\_service | Reference | Text | | Service offering | service\_offering | Reference | Text | | Subcategory | subcategory | Choice (String) (Dependent) | Text | | Transfer reason | route\_reason | Choice (Integer) (Read-only) | Single Select | | Universal Request | universal\_request | Reference | Text | ## Custom Fields Unidirectional Sync Custom field synchronization allows administrators to control the flow of data between ServiceNow and PagerDuty. When configuring custom field mappings, administrators can select from multiple synchronization options: bidirectional custom field data flow across both platforms, or unidirectional synchronization that restricts custom field data movement to a single direction. This flexibility allows organizations to implement synchronization strategies that align with their specific workflow requirements and data governance policies. ### Select the Synchronization Direction > **Warning:** The default synchronization direction for new mappings is **bidirectional**. ServiceNow administrators can define the synchronization direction when creating a new custom field mapping in the ServiceNow integration. This allows them to control the flow of data between PagerDuty and ServiceNow: - **Bidirectional**: Custom field values sync bidirectionally between PagerDuty and ServiceNow. - **Sync from ServiceNow to PagerDuty**: Custom field values sync in one direction, from ServiceNow to PagerDuty. - **Sync from PagerDuty to ServiceNow**: Custom field values sync in one direction, from PagerDuty to ServiceNow. ### Update the Custom Field Sync Direction Currently, the integration does not support modifying the sync direction once you save a custom field mapping. However, you can delete the custom field mapping and recreate the mapping with your preferred sync direction. ### View the Custom Field Mapping Sync Direction When configuring a custom field mapping, you can refer to the directional arrow in the **Review Mapping** section, which indicates how data flows between the systems. Alternatively, you can navigate to the **PagerDuty Custom Fields** table and reference the **Sync Direction** column, which shows the sync direction for all custom field mappings in your ServiceNow environment. **Examples**: 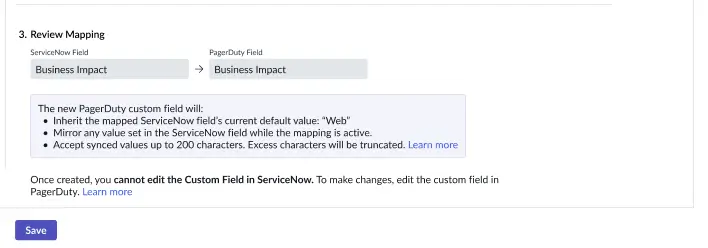 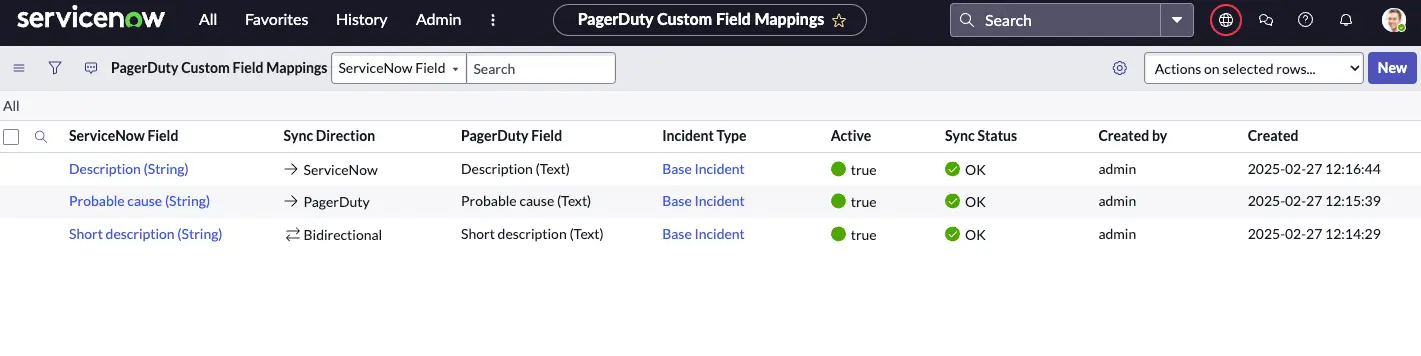 ### Supported ServiceNow Field Types and Mapping Restrictions Three ServiceNow field types can sync unidirectionally to PagerDuty custom fields: - Reference field type - Read-only fields - Choice fields with a dependent field More information regarding the ServiceNow field types and their mapping restrictions includes: | ServiceNow Field | PagerDuty Custom Field Type | Restrictions | Notes | | :----------------------------------------------------------------------------------------------------------------------------------------------------- | :--------------------------------------------------------------------------------------------------------------------------------------------------------------------- | :--------------------------------------------------------------------------------------- | :--------------------------------------------------------------------------------------------------------------------------------------------------------------------------------------------------------------------------------------------------- | | **Reference Fields** | Text
The integration uses `getDisplayValue()` to retrieve the value, which allows value transmission to the PagerDuty custom field in string (text) format. | Can only be synchronized in the **ServiceNow** → **PagerDuty** direction. | | | **Choices with a Dependent Field**:
Choice fields where the dependent field available values vary based on the parent field selected value. | Text
The integration uses `getDisplayValue()` to retrieve the value, which allows value transmission to the PagerDuty custom field in string (text) format. | Can only be synchronized in the **ServiceNow** → **PagerDuty** direction. | The value sent to PagerDuty is the label of the selected option. Options do not synchronize. | | **Read-Only Fields** | Corresponds to the ServiceNow field type. | Can only be synchronized in the **ServiceNow** → **PagerDuty** direction. | Notable exceptions:
- **ServiceNow Field Type**: Choices with a Dependent field → **PagerDuty Custom Field Type**: Text
- **ServiceNow Field Type**: Reference → **PagerDuty Custom Field Type**: Text | ### Identify Read-Only Fields When configuring a custom field mapping, the **Select a ServiceNow field** section identifies read-only fields with the label **Field type: <Field Type> (Read Only)**. After selecting a read-only field, the **Define the Sync Direction** section displays an information message indicating that read-only fields can only sync one-way, from ServiceNow to PagerDuty. **Example**: 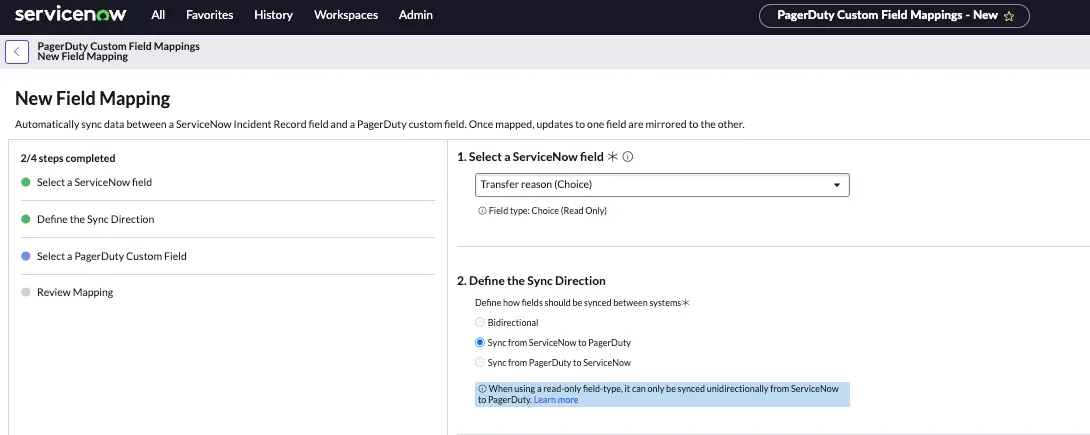 ### Identify Choice Fields With a Dependent Field When configuring a custom field mapping, choice fields with a dependent field are identified as follows: **Field type: Choice (Dependent on <parent field>)**. In the **Define the Sync Direction** section, you see an information message indicating that the dependent field type can only sync unidirectionally, from ServiceNow to PagerDuty. 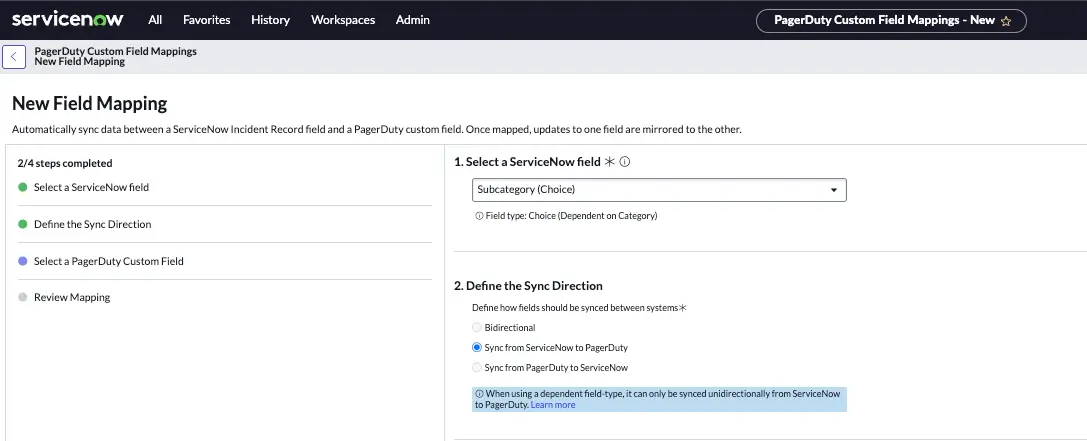 ## Post-Mapping Behavior The integration automatically posts custom field updates to the PagerDuty incident timeline. If you have custom field updates enabled in your incident activity stream, the integration also adds these updates to the ServiceNow incident work notes. You can [edit](/incident-management/incidents/custom-fields-on-incidents#edit-a-custom-field) the custom field display name or the description within PagerDuty, but these changes do not immediately sync. Instead, the synchronization of custom field metadata—including the display name, description, and default value—is managed by the **PagerDuty Custom Fields Support Script Include**. This script runs automatically every hour. After the script executes, the custom field mapping list reflects the new display name or description. Specific actions available in ServiceNow and explanations of how they function within the integration are outlined in the following sections. ### Choice Field Updates > **Restriction:** You can only update choice field options within the ServiceNow **Custom Field Mappings** page; you cannot make these changes within PagerDuty. When a ServiceNow choice field options change, the integration immediately updates the mapped PagerDuty custom field options. If you add, delete, or rename an option for the mapped ServiceNow field, the integration reflects this change in the custom field options in PagerDuty. ### Data Type Updates Editing the ServiceNow field data type can cause syncing issues, since the data type sent from the PagerDuty custom field no longer matches the data type expected by the ServiceNow field. To avoid syncing issues, follow the process below: 1. Edit the ServiceNow field data type. 2. Disable the custom field in PagerDuty. 3. Create a new custom field in PagerDuty that matches the new data type. 4. Navigate to the PagerDuty custom field mappings table in ServiceNow. 5. Delete the mapping associated with the previous data type. 6. Create a new mapping from the new PagerDuty custom field to the ServiceNow field with the updated data type. ### ServiceNow Field Label Updates The integration does not sync field label updates to the **Custom Fields Mapping** table in ServiceNow. However, this does not impact the integration behavior - the integration continues to sync custom field values to that ServiceNow field despite using the original display name. To resolve this, you can delete and recreate the field mapping. ### Deleted ServiceNow Field Deleting a ServiceNow field removes the field from all your ServiceNow incident records, along with its existing field values. The deleted field is no longer available to new ServiceNow incidents, and the PagerDuty integration does not sync custom field values to a deleted ServiceNow field. Deleting the ServiceNow field does not automatically remove the custom field mapping. You must manually delete the mapping from the **Custom Field Mapping** table within ServiceNow. ## How Custom Fields Sync ### Custom Fields Sync From PagerDuty to ServiceNow 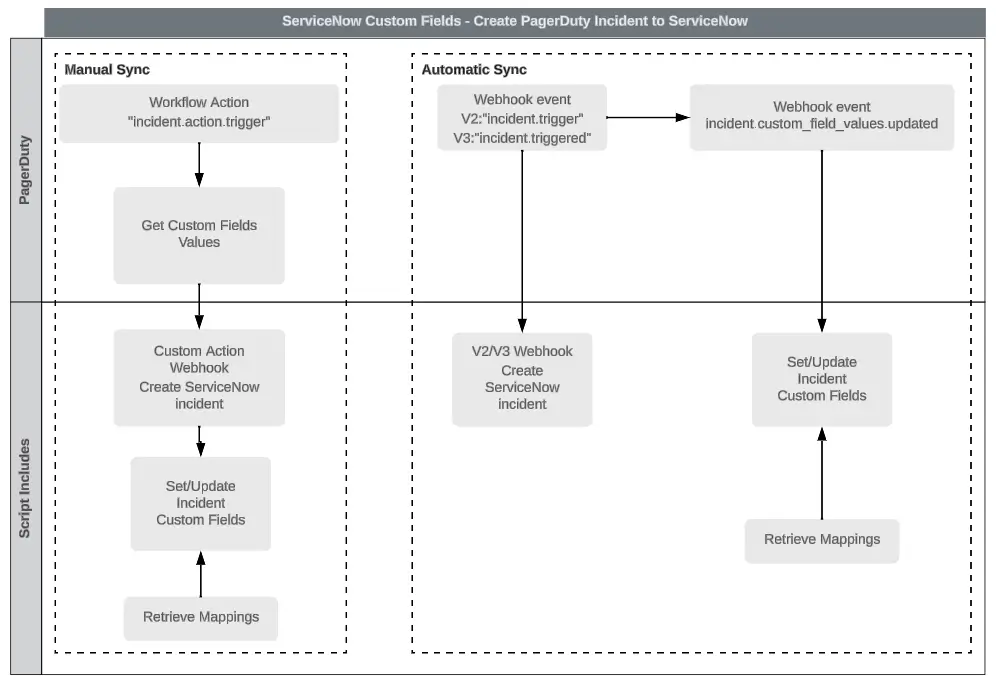 ### Custom Fields Sync From ServiceNow to PagerDuty 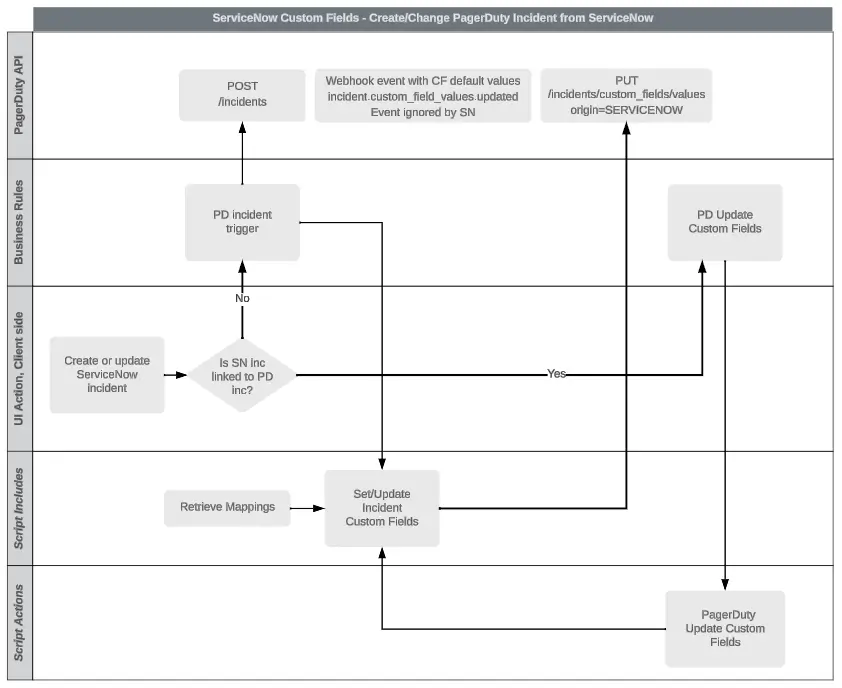 ### Sync a Custom Field Mapping With a Default Value ServiceNow fields can be configured with a default value within the dictionary entry. However, these default values do not automatically sync to PagerDuty. To ensure consistency, you must manually set the same [default value](/incident-management/incidents/custom-fields-on-incidents#edit-a-custom-field) in the corresponding PagerDuty custom field. When you create a ServiceNow incident, the ServiceNow incident record field populates with the default value of the mapped PagerDuty custom field. This is a fast-follow action after the record is created, because custom field default values pass through via a v3 webhook event: `incident.custom_field_values.updated`. ### Sync Fields Populated by Event Orchestration 1. **Configuration**: You can [create the custom field mapping](/integrations/servicenow-integration-guide/advanced-servicenow-configuration#custom-field-mappings) within ServiceNow. At this time, PagerDuty does not have features that allow you to map a new ServiceNow incident record field to an existing PagerDuty custom field. 2. **Usage**: When Event Orchestration populates the PagerDuty custom field, that value immediately syncs to the mapped ServiceNow incident record field. When you change the value of the ServiceNow incident record field, the value syncs back to the PagerDuty custom field. If the PagerDuty custom field populates with an invalid value that the integration does not recognize, that value does not sync to the ServiceNow incident record field. ### Precedence The latest value updated in either platform always takes precedence. You can change these fields even after an incident is resolved, in case you want to update information only discovered during your post-incident review process. ## Troubleshooting Custom Fields | Error | Error Message | Cause | Action | | :---------------------- | :--------------------------------------------------------------------------------------------------------- | :--------------------------------------------------------------------------------------------------------------------------------------------------------------------------------------------------------------------------------------------------------------------------------------------------------------------------------------------------------------------------------------------------------------------------------------------------------------- | :--------------------------------------------------------------------------------------------------------------------------------------------------------------------------------------------------------------- | | `FIELD_DELETED` | The ServiceNow field used for this mapping was deleted in ServiceNow, or is no longer eligible for mapping | The ServiceNow field used for this mapping was deleted in ServiceNow, or is no longer eligible for mapping | - Delete this mapping
- Create a new ServiceNow field
- Create a custom field mapping for the newly-created ServiceNow field | | `FIELD_TYPE_CHANGED` | The ServiceNow field type has changed and is no longer compatible with the current mapping | The ServiceNow field type has changed and is no longer compatible with the PagerDuty custom field type | - Delete this mapping
- Create a new ServiceNow field with a field type that is compatible with the PagerDuty custom field type
- Create a custom field mapping for the newly-created ServiceNow field | | `REFERENCE_FIELD_ERROR` | You cannot update reference fields from PagerDuty | - The ServiceNow field was updated to a reference field, but its current sync direction is bidirectional. This results in an error because reference fields can only sync unidirectionally from ServiceNow to PagerDuty.
- The ServiceNow field was updated to a reference field, but its current sync direction is PagerDuty to ServiceNow. This results in an error because reference fields can only sync unidirectionally from ServiceNow to PagerDuty. | - Delete this mapping
- Create a new custom field mapping with a valid sync direction from ServiceNow to PagerDuty | | `DEPENDENT_FIELD_ERROR` | You cannot update choices with a dependent field from PagerDuty | - The ServiceNow field was updated to a dependent field, but its current sync direction is bidirectional. This results in an error because dependent fields can only sync unidirectionally from ServiceNow to PagerDuty.
- The ServiceNow field was updated to a dependent field, but its current sync direction is PagerDuty to ServiceNow. This results in an error because dependent fields can only sync unidirectionally from ServiceNow to PagerDuty. | - Delete this mapping
- Create a new custom field mapping with a valid sync direction from ServiceNow to PagerDuty | | `READONLY_FIELD_ERROR` | You cannot update read-only fields from PagerDuty | - The ServiceNow field was updated to a read-only field, but its current sync direction is bidirectional. This results in an error because read-only fields can only sync unidirectionally from ServiceNow to PagerDuty.
- The ServiceNow field was updated to a read-only field, but its current sync direction is PagerDuty to ServiceNow. This results in an error because read-only fields can only sync unidirectionally from ServiceNow to PagerDuty. | - Delete this mapping
- Create a new custom field mapping with a valid sync direction from ServiceNow to PagerDuty | | `PD_FIELD_DISABLED` | The PagerDuty field used for this mapping is disabled in PagerDuty | The PagerDuty field used for this mapping is disabled in PagerDuty | - Re-enable the custom field in PagerDuty
- Re-enable the custom field mapping in ServiceNow | | `PD_FIELD_DELETED` | The PagerDuty field used for this mapping was deleted in PagerDuty | The PagerDuty field used for this mapping was deleted in PagerDuty | - Delete this mapping
- Create a new custom field in PagerDuty
- Create a custom field mapping for the newly-created PagerDuty field | If the error results from an `incident.custom_field_values.updated` webhook sent to ServiceNow, it appears in the incident work notes, provided that the **Custom Fields errors** option is enabled in your incident activity stream. This error also reflects in the custom field mapping record within ServiceNow. If the error stems from the **PagerDuty Custom Fields Support** Script Include metadata synchronization job, it only appears in the custom field mapping record within ServiceNow and not in the incident work notes. **Examples**: 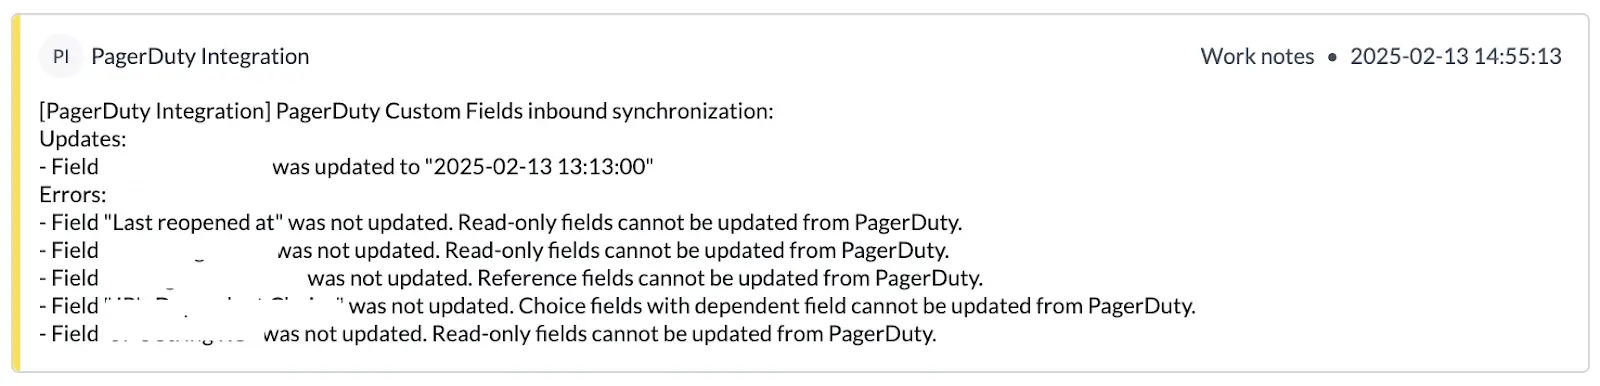 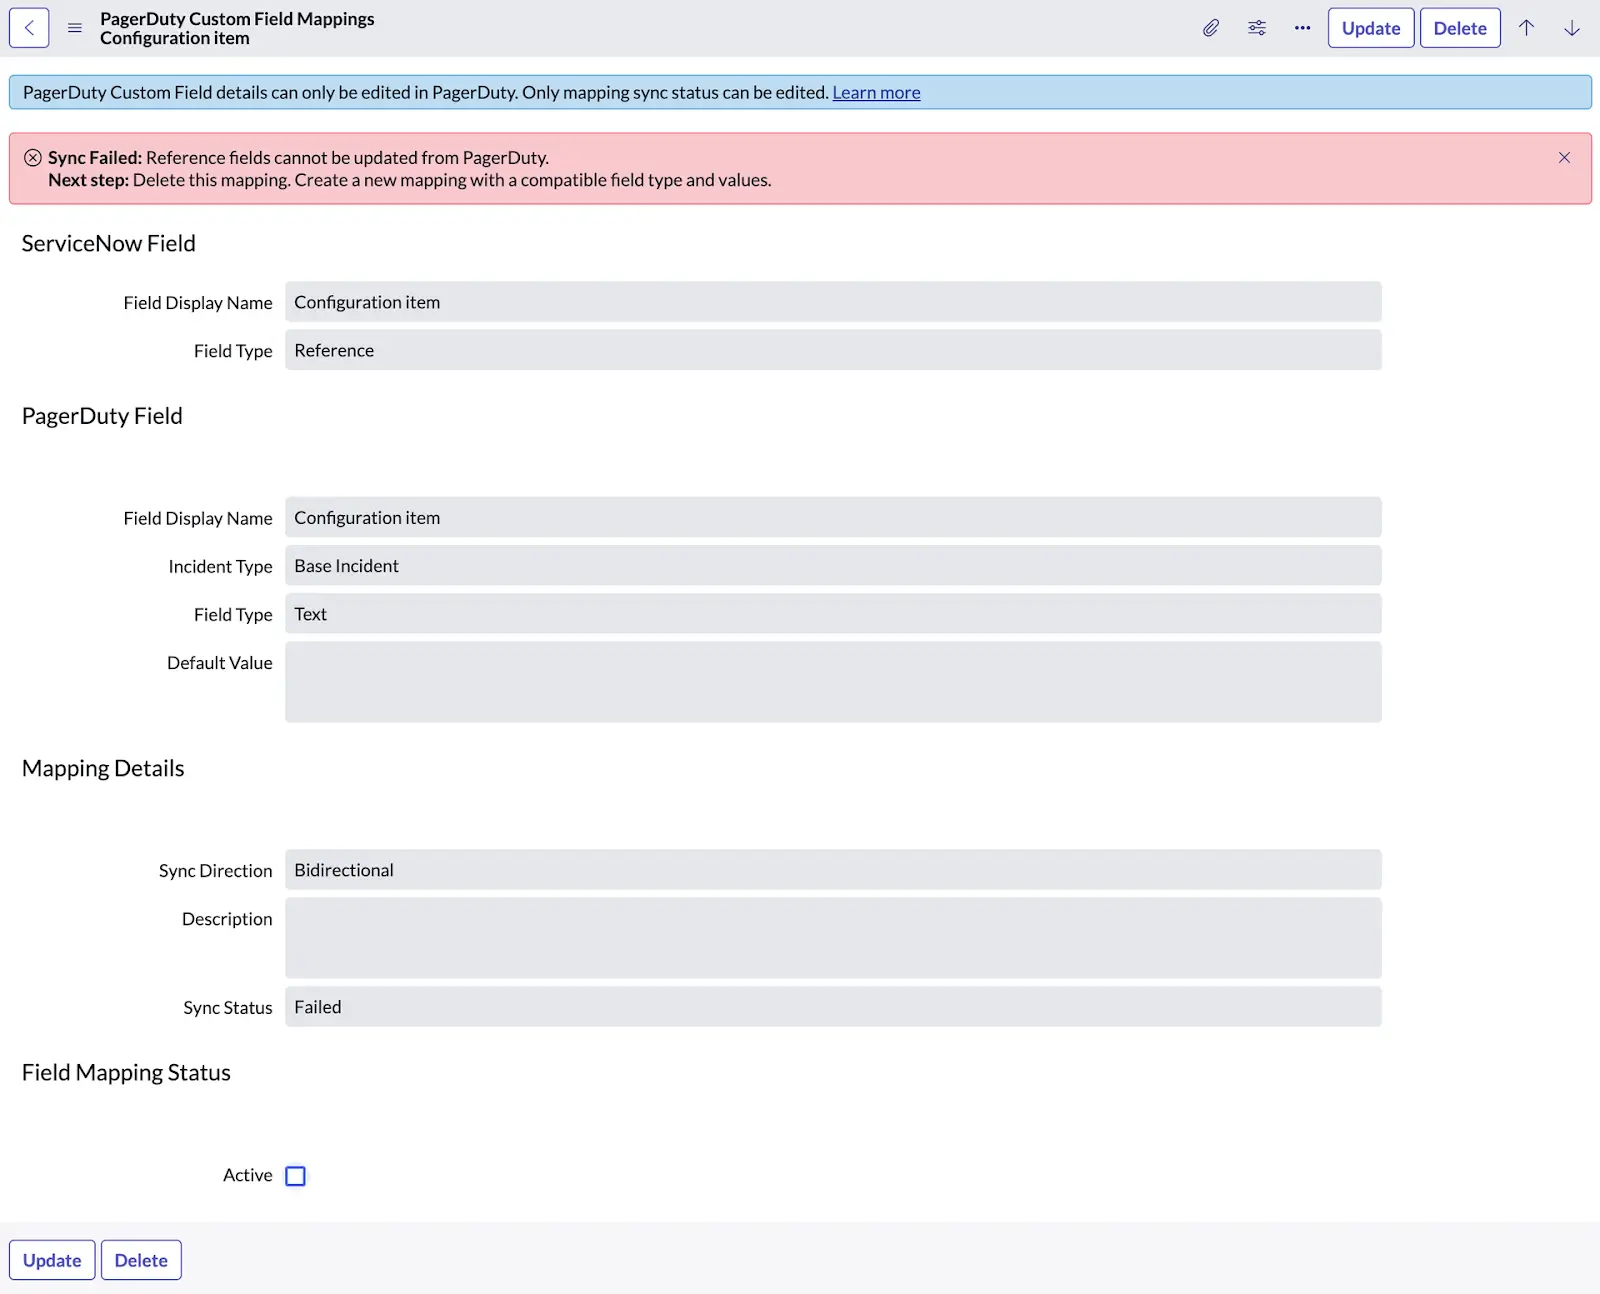 ## FAQ **How do I create a new mapping if the “Custom Field limit in PagerDuty has been reached”?** Since you have reached the amount of custom fields available in your PagerDuty pricing plan, you must delete an existing PagerDuty custom field to free up a new creation. The mapping experience provisions a new PagerDuty custom field based on the ServiceNow incident record field chosen. **Can I edit/modify the PagerDuty Custom Field in ServiceNow?** To ensure configuration consistency, PagerDuty enforces that PagerDuty custom fields are only editable in PagerDuty. See our [custom fields](/incident-management/incidents/custom-fields-on-incidents#edit-a-custom-field) article for more information on how to edit an existing PagerDuty custom field. **Why can’t I edit the PagerDuty Custom Fields options for the Single Select or Multiple Select data type when it’s mapped to ServiceNow?** For the Single Select and Multiple Select data types, PagerDuty enforces that the ServiceNow incident record field is the source of truth for the options. Option edits and deletions in ServiceNow immediately reflect in the PagerDuty UI. Newly-added options in ServiceNow also sync back to PagerDuty until the maximum number of options for the PagerDuty custom field is reached. However, if a ServiceNow field has more options available than PagerDuty, options beyond that PagerDuty limit do not sync to the PagerDuty UI and the last selected option displays instead. **Can an admin disable or temporarily pause custom field syncing?** At this time, the integration does not provide features that allow administrators to temporarily pause custom field syncing. **Are duplicate custom field mappings allowed?** Field mappings are one-to-one. A ServiceNow field can only map to one custom field, and a custom field can only map to one ServiceNow field. Once you map a field, it does not appear as an option when creating a new mapping. **What is the expected behavior if multiple ServiceNow tickets are linked to the incident, or vice versa?** If multiple ServiceNow tickets link to one PagerDuty incident, or multiple PagerDuty incidents link to one ServiceNow ticket, the custom field value remains synced with the value of the more recent record. --- URL: https://docs.pagerduty.com/integrations/servicenow-integration-guide/advanced-servicenow-configuration/servicenow-oauth-authentication # ServiceNow OAuth Authentication Configure ServiceNow OAuth to securely authenticate PagerDuty webhooks and Incident Workflows ServiceNow OAuth Authentication allows you to use OAuth (Client Credentials) for authenticating PagerDuty webhooks and Incident Workflows in the [ServiceNow ITSM integration](/integrations/servicenow-integration-guide). With OAuth enabled, PagerDuty and ServiceNow can securely communicate without relying on static credentials. This ensures compliance with industry standards and a streamlined integration experience, particularly for organizations with more stringent security and regulatory requirements. > **Availability:** - ServiceNow OAuth Authentication is available on Business or Enterprise pricing plans. > - This feature is available for [ServiceNow Integration](/integrations/servicenow-integration-guide) version 8.3.0. Please see our [upgrade instructions](/integrations/servicenow-integration-guide/servicenow-integration-details#upgrade-to-servicenow-v8) if you are not currently on this version. ## Authentication Flow Your ServiceNow Admin will register an OAuth application in ServiceNow, which PagerDuty then uses to authenticate Incident Workflows and webhook communications using secure, time-bound tokens. ### Workflow Actions Authentication 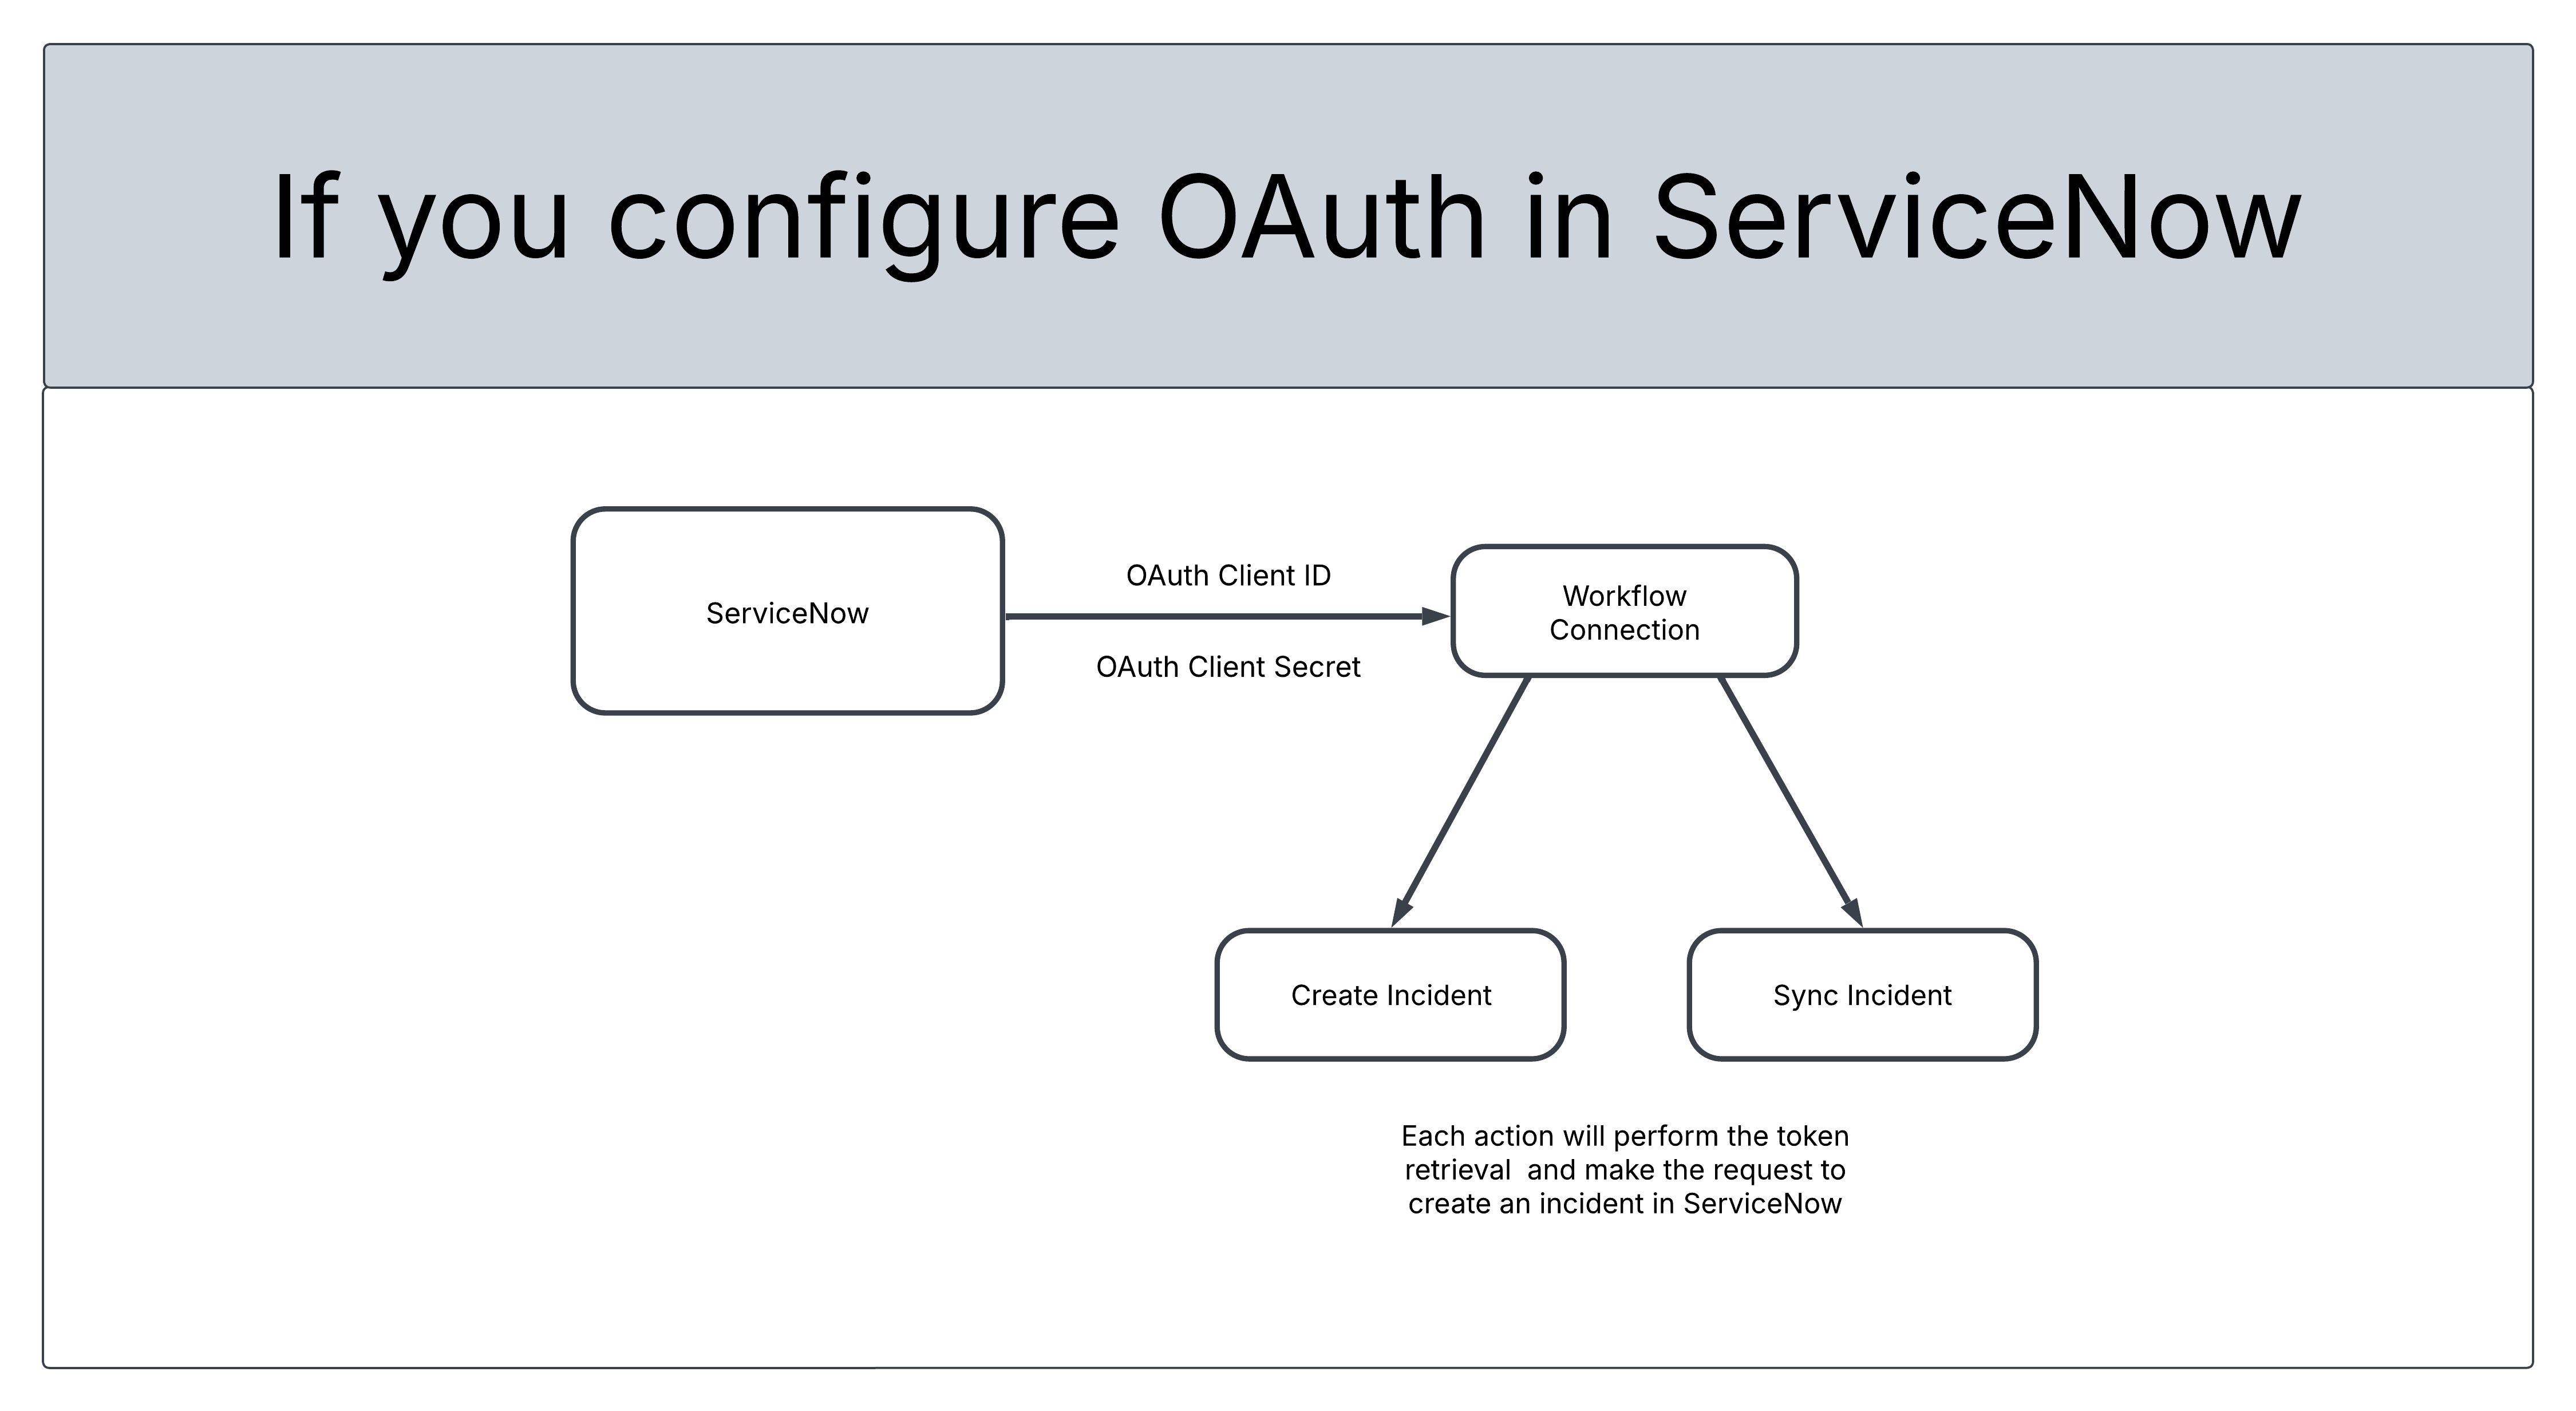 ### Webhook Authentication 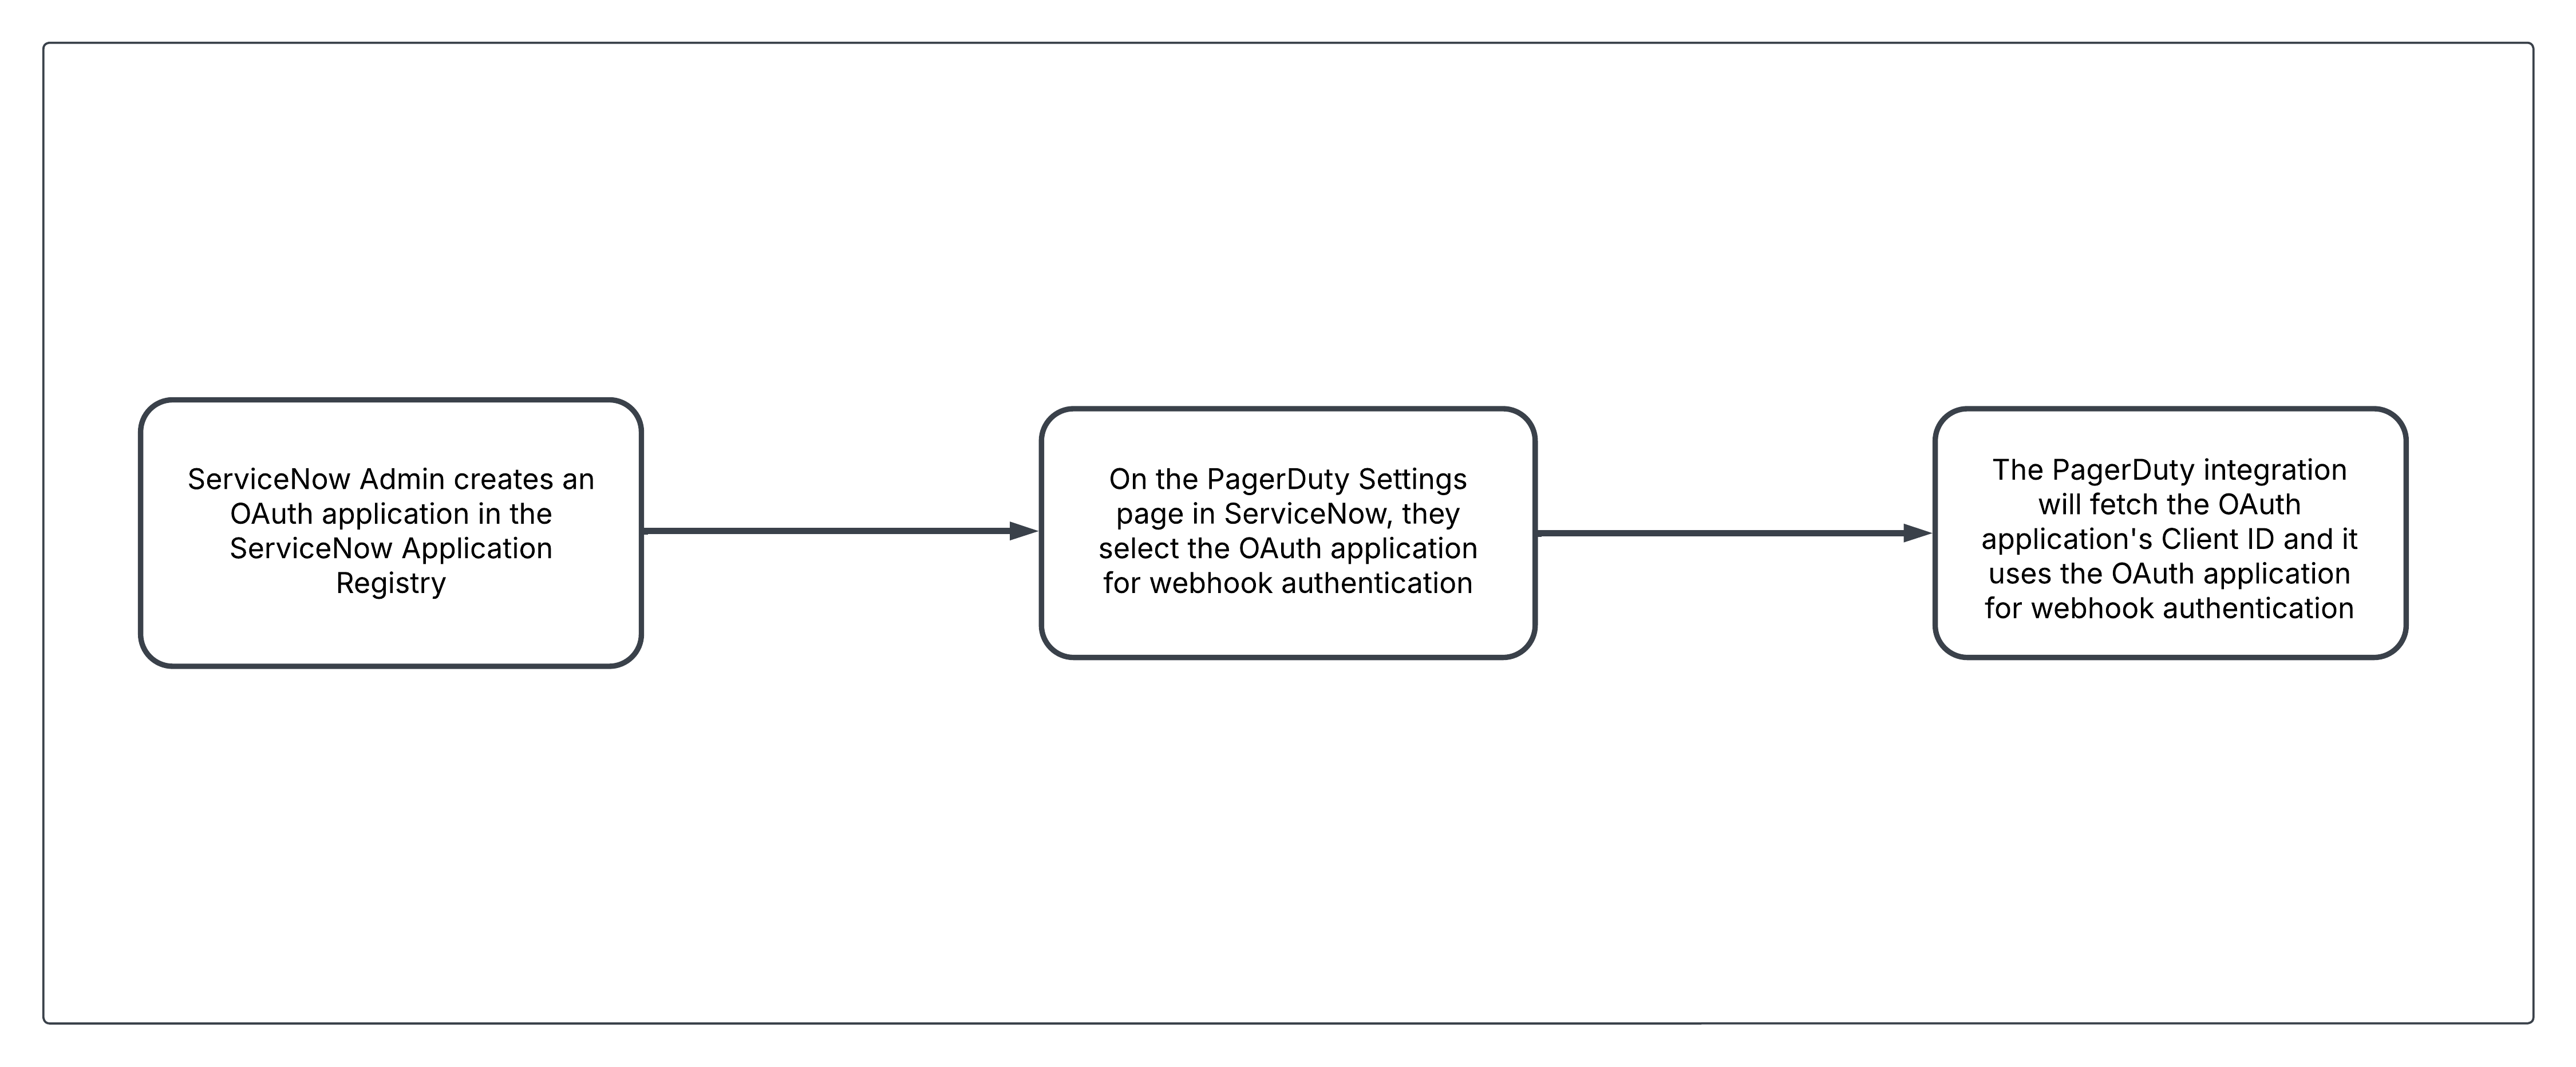 ## Configure the OAuth Application Set up an OAuth application (Client Credentials) for authenticating communications between PagerDuty and ServiceNow. > **Requirements:** - **In ServiceNow**: A ServiceNow Administrator role is required for configuration. > - **In PagerDuty**: A Global Admin or Account Owner base role is required for configuration. ### Step 1: Enable the System Property > **Application Scope Requirement:** To enable the system property, [set your application scope](https://developer.servicenow.com/dev.do#!/learn/learning-plans/xanadu/new_to_servicenow/app_store_learnv2_buildneedit_xanadu_application_scope) to **Global**. 1. Navigate to the System Properties table (`sys_properties_list.do`), and click **New** in the top right. 2. In the system property form, create the property below with the values listed: 1. **Name**: `glide.oauth.inbound.client.credential.grant_type.enabled` 2. **Application Scope**: Global 3. **Value**: true 1. **Note**: This flag is the primary mechanism for enabling and disabling this functionality. 4. **Type**: true | false 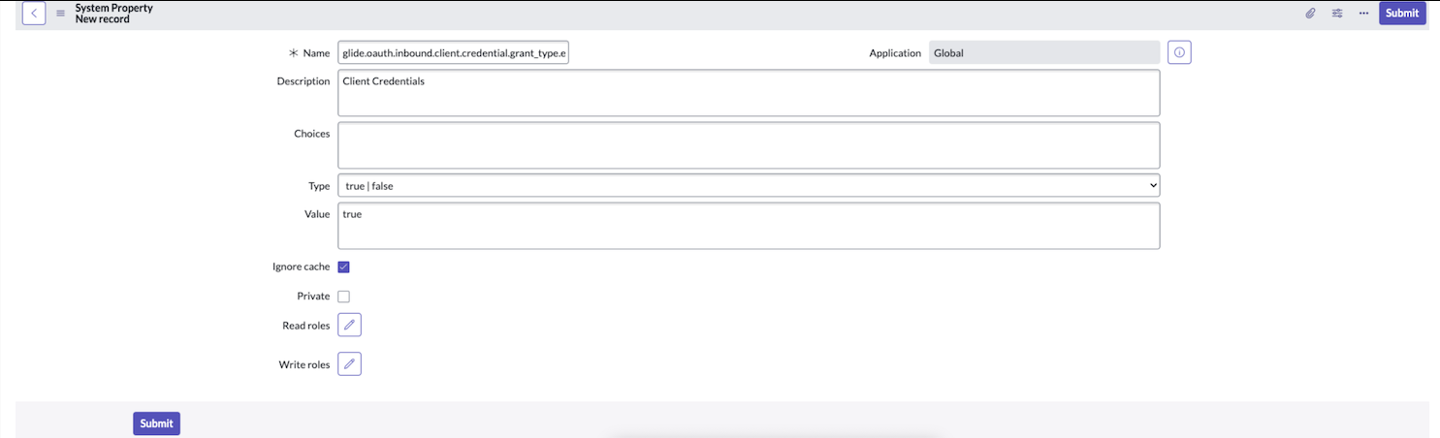 3. Once complete, you can change to the **PagerDuty Incident Resolution Platform** [application scope](https://developer.servicenow.com/dev.do#!/learn/learning-plans/xanadu/new_to_servicenow/app_store_learnv2_buildneedit_xanadu_application_scope).  ### Step 2: Add an OAuth Entity to Your Application Registry Create a client and make an update to the OAuth Entity default view. 1. Confirm that you are in the **PagerDuty Incident Resolution Platform** [application scope](https://developer.servicenow.com/dev.do#!/learn/learning-plans/xanadu/new_to_servicenow/app_store_learnv2_buildneedit_xanadu_application_scope). 2. Navigate to **System OAuth** → **Application Registry**. 3. Create a new record by clicking **New** in the top right, then select **Create an OAuth API endpoint for external clients** from the interceptor list. 4. Configure the following fields in the application registries form: 1. **Application scope**: PagerDuty Incident Resolution Platform 2. **Accessible from**: All application scopes 3. _Optional_: You can modify the refresh token lifespan and access token lifespan if the default values differ from your company’s token policies. 5. Change to the **Global** [application scope](https://developer.servicenow.com/dev.do#!/learn/learning-plans/xanadu/new_to_servicenow/app_store_learnv2_buildneedit_xanadu_application_scope). 6. In the newly-created record, click the context menu and select **Configure** → **Form Layout**. 7. Add the **OAuth Application User** field to the **Selected** column, then click **Save**. 8. In the **OAuth Application User** field, select the ServiceNow user account that you configured for webhook authentication, then click **Save**. 9. Change back to the **PagerDuty** application scope. 10. In the **OAuth Entity Scopes** related list, click **New** to add a row, then select `useraccount` as the value in the Auth Scope field. - If left blank, the Client Secret automatically generates after you save the record. ### Step 3: Enable OAuth Authentication > **Prerequisite:** Before enabling OAuth Authentication, [migrate your v2 webhooks](/integrations/servicenow-integration-guide/servicenow-integration-details#webhooks-migration) (if any) to v3. #### Enable OAuth Authentication in PagerDuty Settings 1. To enable OAuth Authentication for the PagerDuty Application, navigate to the **PagerDuty Settings** page in your ServiceNow instance. 2. Scroll down to the **Webhook Configuration** section. 3. Select **OAuth Client Credentials**. 4. Choose the new **OAuth application** you created in the previous section. 5. Click **Save**. 6. Run the [webhooks health check](/integrations/servicenow-integration-guide/servicenow-integration-details#how-and-when-to-run-a-webhooks-health-check). #### Run the Integration Health Check to Validate OAuth Credentials 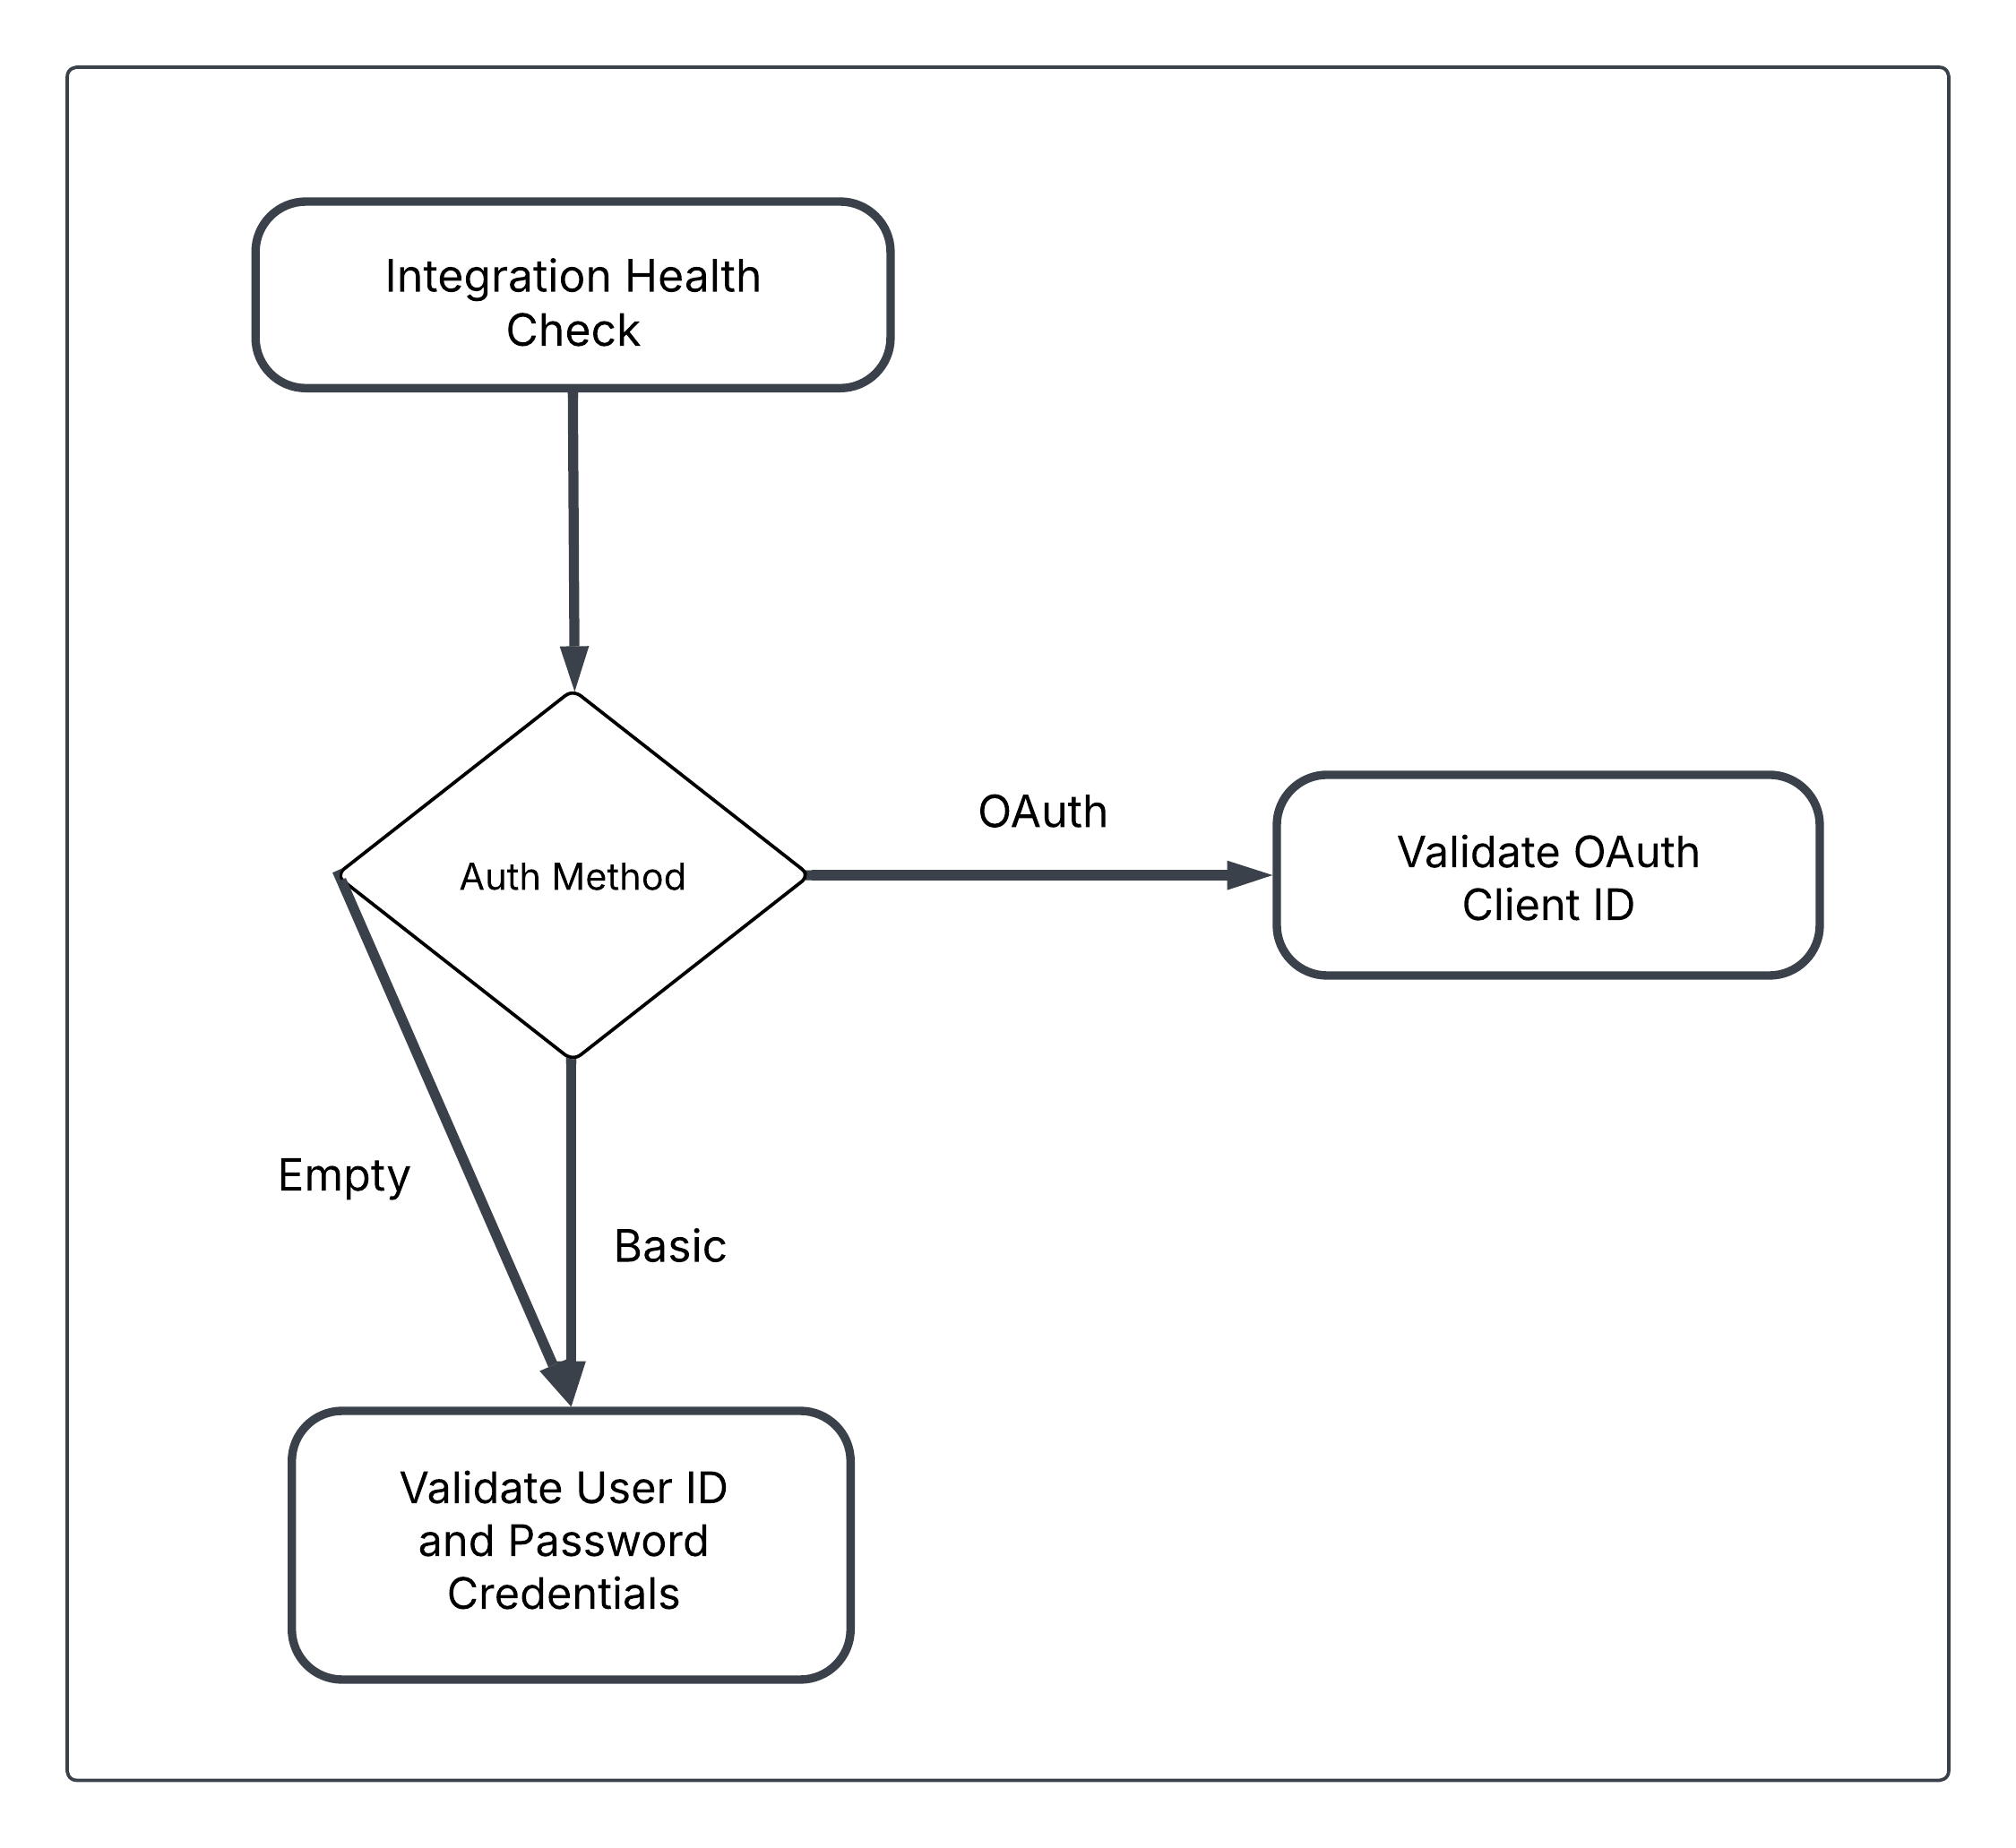 *Diagram of how Integration Health Check validates either the OAuth Client ID or user credentials based on the selected authentication method* 1. Run the [Integration Health Check](/integrations/servicenow-integration-guide/servicenow-integration-details#integration-health-check). 2. If you configured OAuth as the authentication method, the Integration Health Check will automatically switch to validating the OAuth credentials (OAuth Client ID). ## Troubleshoot Errors with ServiceNow Key Management Admin When using OAuth credentials, an error may occur due to Module Access Policies configured via the Key Management Admin. These policies reject the use of our application scripts’ decryptor. - The first Module Access Policy will generate when you save the OAuth Client Credentials on the PagerDuty Settings page, and saving this page fails with a `400 Bad Request` error. - The second generates when the Integration Health Check fails after you create the OAuth client, and you will see a **Rejected** Module Access Policy record. ### Resolve Module Access Policy Errors #### Step 1: Gain Access to the Module Access Policies Table 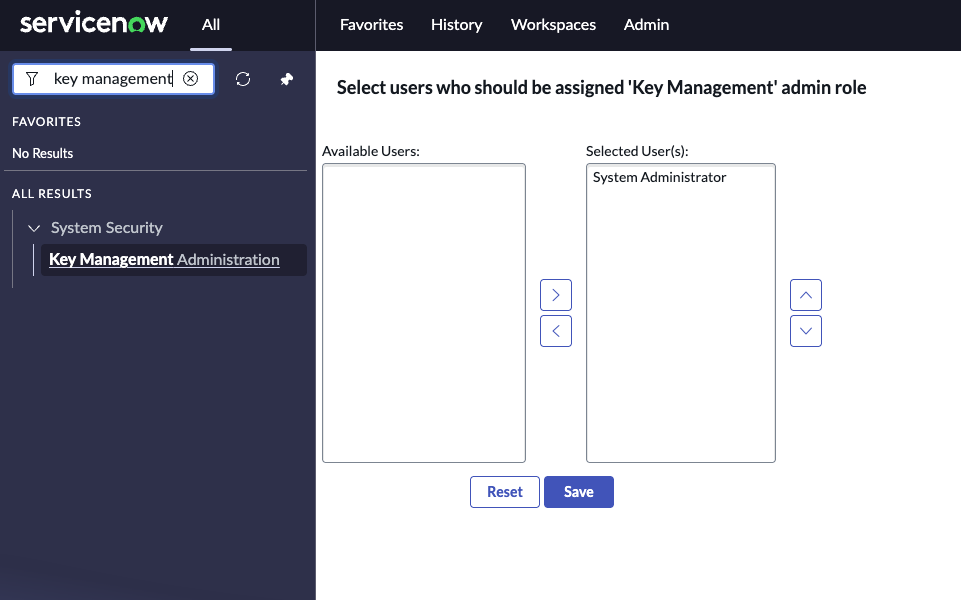 1. Navigate to the **Key Management Administration** screen. 2. Move your admin user to the **Selected User(s)** section and click **Save**. This will allow you to access the **Module Access Policies** table. #### Step 2: Change the Module Access Policy Result  1. In the **Module Access Policies** table, you can use the following filters to locate the rejected module access policies: 1. **Name** contains `AutoGen` 2. **Script Table** is `Script Include` 2. Open each policy record, and change the **Result** field from **Reject** to **Track**. --- URL: https://docs.pagerduty.com/integrations/servicenow-integration-guide/advanced-servicenow-configuration/sync-incident-types-with-servicenow # Sync Incident Types with ServiceNow Sync PagerDuty Incident Types with ServiceNow incidents Each PagerDuty incident has an [Incident Type](/incident-management/incidents/incident-types) which determines the set of [Custom Fields](#custom-field-mappings) that are available on the incident. You can sync Incident Types between PagerDuty and ServiceNow, allowing responders to view and update the Incident Type from the ServiceNow incident. > **Prerequisite:** You must configure the [ServiceNow Integration](/integrations/servicenow-integration-guide) in order to use this feature. > **Inheritance:** Incident Types exist within a hierarchy and will inherit Custom Fields from their **Parent** Incident Type. Please refer to [Incident Types](/incident-management/incidents/incident-types#configure-incident-types) to learn more. ## Enable Incident Types in ServiceNow > **Required User Permissions:** A ServiceNow Administrator role is required for configuration. 1. In ServiceNow, navigate to **PagerDuty** → **Configuration** → **PagerDuty Settings**. 2. Select the **Incident Types** option to enable this feature. 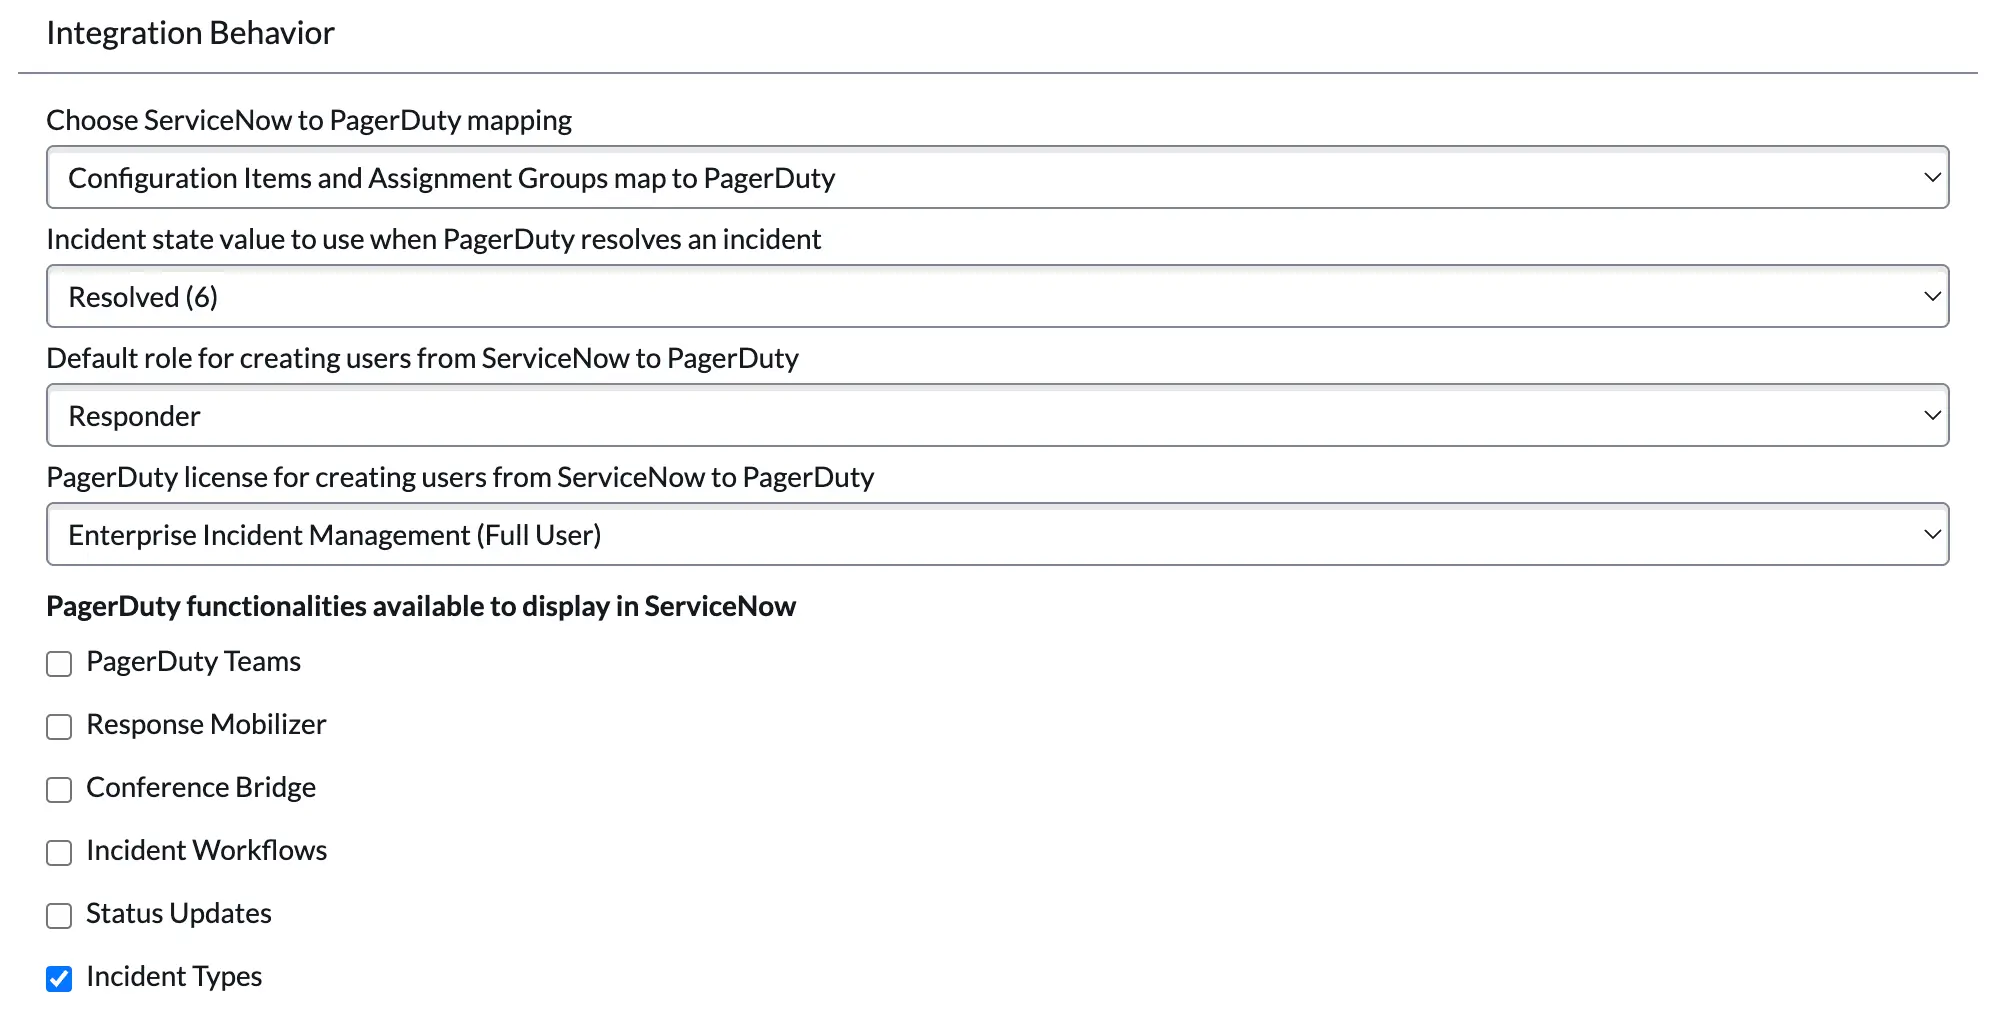 3. _Optional_: Under **Activity stream customization**, enable **Incident Types updates** if you would like to see these updates in your ServiceNow incident activity stream. 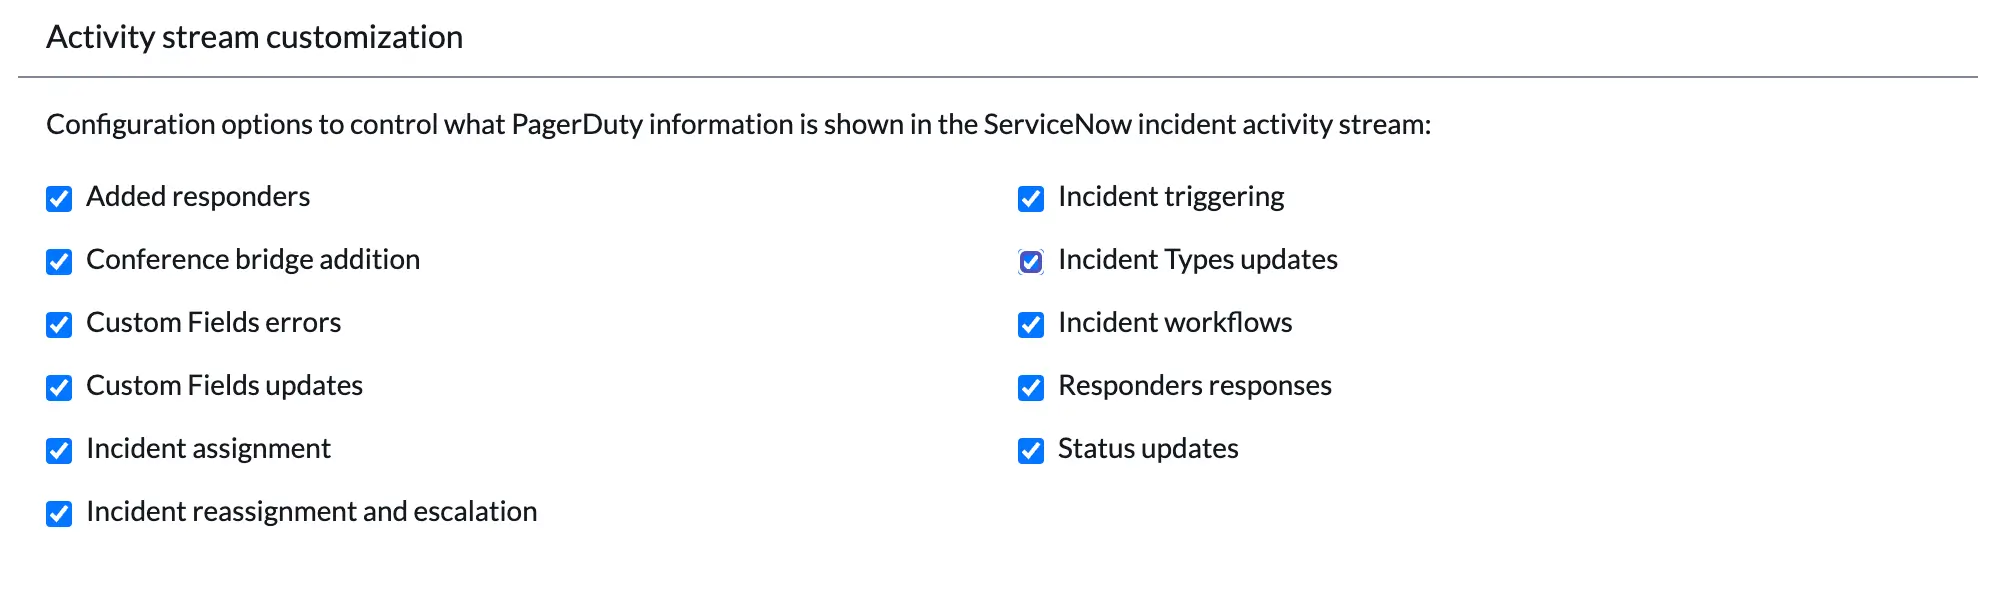 4. Scroll to the bottom of the **PagerDuty Settings** page and click **Save**. 5. After enabling incident types, you'll need to populate the **PagerDuty Incident Types** table. Navigate to **PagerDuty** → **Actions** → **Refresh PagerDuty Incident Types**. In the confirmation modal, click **OK**. This will populate the PagerDuty Incident Types table with the Incident Types you have [configured](/incident-management/incidents/incident-types#create-an-incident-type) in PagerDuty. ### Add Incident Type to the Incident Form In order to display the **Incident Type** on the ServiceNow incident form, you'll need to create a new column for the **Incident** table and then add the new field to the incident form. #### Create Incident Type Column 1. While in the **Global** scope, navigate to **System Definition** → **Tables**. 2. Locate and select the **Incident** table. 3. In the **Columns** tab, click **New** to create a new entry. 4. Perform the following for the required fields: 1. **Type**: Select **Reference**. 2. **Column label**: Enter **Incident Type**. 3. **Column name**: This should automatically populate with `u_incident_type`. If it populates with a different value, ensure you are in the **Global** application scope and try again. 4. **Read only**: Enabled 5. In the **Reference Specification** tab, search for and select **PagerDuty Incident Reference** for the **Reference** field. 5. Click **Submit** to save the column.  6. Navigate back to the **Incident Type** column you created. 7. Under **Related Links**, select **Advanced view**. 8. In the **Calculated Value** tab, check the **Calculated** box. In the **Calculation** field, paste the following script: ``` (function calculatedFieldValue(current) { var gr = new GlideRecord("x_pd_integration_pagerduty_incident_reference"); gr.get("servicenow_incident", current.sys_id); return gr.sys_id; })(current); ``` 9. Click **Update** to save the script. #### Add Incident Type Field to Form Layout 1. In ServiceNow, navigate to **PagerDuty** → **PagerDuty Incidents** and view any incident. 2. Select → **Configure** → **Form Layout**. 3. Locate **Incident Type** in the slushbucket and add it to the **Selected** section. Use the arrows on the right side to adjust the field placement as desired. 4. Click **Save**. #### Add Incident Type to List Views (Optional) To display the Incident Type when viewing a list in ServiceNow, follow the steps below: 1. Navigate to your desired list (e.g., **PagerDuty** → **PagerDuty Incidents**). 2. Next to any column, select → **Configure** → **List Layout**. 3. Add **Incident Type** to the Selected section. 4. Click **Save**. After enabling Incident Types, you can move on to configuring your [Custom Field Mappings](#custom-field-mappings). ## View Incident Types in ServiceNow You can view synced Incident Types by navigating to **PagerDuty** → **Storage** → **PagerDuty Incident Types**. If an Incident Type is missing from your list, navigate to **PagerDuty** → **Actions** → **Refresh PagerDuty Incident Types**. This action will synchronize your PagerDuty Incident Types to ServiceNow so that they are available in the list view. ## Update an Incident's Type > **ServiceNow Default Incident Type:** Incidents originating from ServiceNow are assigned the Base Incident type by default. ### In PagerDuty Please view [Incident Types](/incident-management/incidents/incident-types#change-an-existing-incidents-type) for steps on updating an existing incident's type. When an incident's type is updated in PagerDuty, it will automatically update the **Incident Type** field in ServiceNow. ### In ServiceNow You can change the incident’s type from the incident actions menu in ServiceNow: 1. Navigate to **PagerDuty** → **PagerDuty Incidents**. Select the incident you would like to update. 2. In the top right, select **Change Incident Type**. If you do not see this option, ensure you have **Incident Types** enabled in the [PagerDuty Settings](#enable-incident-types-in-servicenow). 3. In the modal that appears, select the desired **Incident Type** from the dropdown. 4. Click **Change Incident Type**. You should see a message in ServiceNow indicating the type updated successfully. ## Incident Type Sync Behavior - When an incident’s type is updated, the [Custom Fields](/incident-management/incidents/custom-fields-on-incidents) displayed in PagerDuty are updated automatically to align with the new Incident Type. - Updating the incident’s type will not remove ServiceNow fields from the ServiceNow incident record. - Updating the incident’s type will not remove or delete any existing values from the ServiceNow incident record (no retroactively back-deleting values). - When the incident’s type is updated, mapped Custom Fields associated to the previous Incident Type will no longer synchronize. When a PagerDuty incident is triggered, the integration automatically synchronizes the Incident Type to the corresponding Incident Type field in ServiceNow. Changes to an incident's type are automatically synced between PagerDuty and ServiceNow. The latest value updated in either platform will always take precedence. These fields can be changed even after an incident is resolved, in case you want to update information only discovered during your incident review process. The integration will automatically add Incident Type updates to the PagerDuty incident timeline so that responders can monitor and audit the changes that were made. If you have **Incident Types updates** enabled for your incident activity stream, these updates will appear in the ServiceNow incident's work notes as well as a note on the PagerDuty incident. ### Promote to Major incident Based on Field > **Business Rule:** The Promote to Major Incident Based on Field business rule is disabled by default. The **Promote to Major Incident Based on Field** business rule checks whether the short description in the ServiceNow incident record begins with `[Major]`. If it does, the business rule automatically updates the **Incident Type** field in ServiceNow to **Major Incident**. When this occurs, the PagerDuty incident's type is also updated to Major Incident. Please note that the PagerDuty support team cannot support or implement customizations to this business rule. The rule is intended to function as an out-of-the-box solution to sync the Major Incident label across your incident workflow. ### Manually Update Incident Types After an Incident Type is created, you can [edit](/incident-management/incidents/incident-types#edit-incident-types) the display name and description in PagerDuty. Incident Types cannot be changed within ServiceNow. If you update an Incident Type, you'll need to navigate to **PagerDuty** → **Actions** → **Refresh PagerDuty Incident Type** to sync the update(s) to ServiceNow. The Incident Type list is updated to reflect the new display name and/or description. Existing ServiceNow incidents matching that Incident Type will also be updated to reflect the new display name in the “Incident Type” field. ### Disabled Incident Type Incidents cannot be associated to an Incident Type while the Incident Type is [disabled](/incident-management/incidents/incident-types#disable-or-enable-incident-types). The Incident Type’s associated Custom Fields are also unavailable for new incidents. Disabling an Incident Type will not affect any existing incidents of that type and existing values and fields are not modified. After disabling or re-enabling an Incident Type in PagerDuty, navigate to your ServiceNow instance and **Refresh PagerDuty Incident Type**. This action will synchronize the updated Incident Type status to ServiceNow. --- URL: https://docs.pagerduty.com/integrations/servicenow-integration-guide/advanced-servicenow-configuration/sync-service-reassignment-with-servicenow # Sync Service Reassignment with ServiceNow Bidirectionally sync incident reassignments between ServiceNow and PagerDuty The Service Reassignment feature enables bidirectional sync between ServiceNow and PagerDuty when incidents are [reassigned to different Configuration Items (CIs) in ServiceNow](https://www.servicenow.com/docs/bundle/yokohama-it-service-management/page/product/incident-management/task/associate-cis-with-incident.html), and when incidents are [reassigned to different services in PagerDuty](/incident-management/incidents/edit-incidents#reassign-an-incidents-service). This ensures data consistency and accuracy across both platforms. The feature allows you to reassign an incident to a different service if it becomes clear that incident ownership belongs to another team, or if it was attributed to a service in error. It also ensures that updates to the service assignment are synced between PagerDuty and ServiceNow. > **Prerequisites:** - You must configure the [ServiceNow Integration](/integrations/servicenow-integration-guide) in order to use this feature. > - The [Service Reassignment](/integrations/servicenow-integration-guide/advanced-servicenow-configuration/sync-service-reassignment-with-servicenow) feature is available with [ServiceNow 8.2](/integrations/servicenow-integration-guide). If you have already configured the integration, please ensure that you've [upgraded to the latest version](/integrations/servicenow-integration-guide/servicenow-integration-details#upgrade-to-servicenow-v8) to realize the full feature value. ## Configure Service Reassignment 1. In ServiceNow, navigate to the **PagerDuty Settings** page. 2. Under the **Activity stream customization** section, you can check the **Service Reassignment** option to enable incident work notes related to service reassignment updates. This will allow you to view these updates in the ServiceNow incident activity stream. ## Webhook Support When a PagerDuty incident is assigned to a different service, the integration sends an `incident.service_updated` webhook to update the corresponding incident record in ServiceNow. You can mass-enable this event subscription for your existing v3 webhooks in ServiceNow by [running a webhook health check](/integrations/servicenow-integration-guide/servicenow-integration-details#how-and-when-to-run-a-webhooks-health-check). After the health check completes, click **Auto resolve inconsistencies** to auto-remediate your existing v3 webhooks to support the new `incident.service_updated` event type. ## Key Concepts ### Mapped vs. Unmapped Services/CIs - **Mapped**: A Configuration Item in ServiceNow is mapped if the CI is linked to a PagerDuty service. For a CI to be considered mapped, its Assignment Group must also be linked to a PagerDuty escalation policy. - **Unmapped**: An unmapped Configuration Item does not have a linked service in PagerDuty, or an Assignment Group linked to a PagerDuty escalation policy. ### Synchronizing CI and Service Reassignments > **Overview:** - There are no limits to the number of times a CI or PagerDuty service can be reassigned. > - You can reassign an incident to a different CI from the ServiceNow incident record, and then later reassign again from the PagerDuty incident. #### Mapped to Mapped **ServiceNow to PagerDuty**  When you reassign an incident from one mapped CI in ServiceNow to another mapped CI, the integration automatically updates the incident’s service in PagerDuty. The **PD Update Service** Business Rule detects when the `cmdb_ci` incident field is updated in ServiceNow, and then relays the incident details to the **PagerDuty** Script Include for processing. The `updateService()` function within the **PagerDuty** Script Include will construct the request payload, and then make the PUT request to update the PagerDuty incident’s service assignment. ``` { "incident": { "type": "incident_reference", "service": { "id": "XXXXX", "type": "service_reference" } } } ``` **PagerDuty to ServiceNow**  When you reassign an incident from one mapped PagerDuty service to another mapped PagerDuty service, the integration will send an `incident.service_updated` webhook event to update the Configuration Item field (e.g., `cmdb_ci` field) in the corresponding ServiceNow incident. #### Mapped to Unmapped **ServiceNow to PagerDuty**  When you reassign an incident from a mapped CI in ServiceNow to an unmapped CI, no changes are made to the PagerDuty incident’s service. The PagerDuty incident retains its original service assignment. The incidents do not become “unlinked”, so data will continue to synchronize to the corresponding PagerDuty incident. **PagerDuty to ServiceNow**  When you reassign an incident from a mapped PagerDuty service to an unmapped service, no changes are made to the ServiceNow incident's Configuration Item. The ServiceNow incident retains its original CI reference. If the updated service is missing a webhook connection to ServiceNow, then the integration will create a `data_only` webhook so that the data from PagerDuty can continue to synchronize to the ServiceNow incident. `data_only` webhooks are only used to sync data from PagerDuty to ServiceNow when a PagerDuty incident is reassigned from a mapped service to an unmapped service — they are not used to create or trigger incidents. #### Unmapped to Mapped **ServiceNow to PagerDuty**  When you reassign an incident from an unmapped CI in ServiceNow to a mapped CI, a new incident will trigger in PagerDuty, and it will assign to the PagerDuty service linked to the updated ServiceNow CI. **PagerDuty to ServiceNow**  When you reassign an incident from an unmapped service in PagerDuty to a mapped service, a new incident will be created in ServiceNow, and it will assign to the ServiceNow CI linked to the updated PagerDuty service. ### Synchronize Assignment Group and Escalation Policy Reassignments #### ServiceNow to PagerDuty **Assignment Group Reassignment**: a. **Assignment Group is linked to a PagerDuty Escalation Policy**: The PagerDuty incident delegates to the escalation policy associated with the updated Assignment Group. b. **Assignment Group is not linked to a PagerDuty Escalation Policy**: 1. **Enabled**: Resolves the PagerDuty incident if the ServiceNow incident is assigned to a group that doesn't exist in PagerDuty. The ServiceNow incident becomes “unlinked” and the PagerDuty incident status changes to **Resolved**. No changes are made to the PagerDuty incident’s escalation policy. 2. **Disabled**: Resolves the PagerDuty incident if the ServiceNow incident is assigned to a group that doesn't exist in PagerDuty. No changes are made to the PagerDuty incident’s escalation policy. #### PagerDuty to ServiceNow **Escalation Policy Reassignment**: a. **Escalation Policy is linked to a ServiceNow Assignment Group**: The ServiceNow incident is reassigned to the Assignment Group linked to the updated escalation policy. b. **Escalation Policy is not linked to a ServiceNow Assignment Group**: No changes are made to the ServiceNow incident’s Assignment Group. --- URL: https://docs.pagerduty.com/integrations/servicenow-integration-guide/servicenow-change-requests-integration-guide # ServiceNow Change Requests Integration Guide Set up and configure the ServiceNow Change Requests integration PagerDuty enhances ServiceNow’s effectiveness by allowing customers to quickly add real-time response capabilities to their change management process. PagerDuty’s Change Request integration creates [Change Events](/ai-automation/aiops/recent-changes) on PagerDuty services whenever a change request is opened, and include important details like priority and risk. > **Requirements:** - This integration is available with our [PagerDuty AIOps](/ai-automation/aiops/overview) add-on. If you would like to sign up for a trial of PagerDuty AIOps features, please read [PagerDuty AIOps Trials](/ai-automation/aiops/overview#pagerduty-aiops-trials). > - **Note**: If you do not have the AIOps add-on or if you have [disabled AIOps](/incident-management/services/configurable-service-settings#manage-aiops) on your service, your ServiceNow change events will still create maintenance windows on PagerDuty services, but you wont be able to see ServiceNow change events in PagerDuty. > - The ServiceNow Change Request integration is available on versions 7.5 and higher of our [ServiceNow integration](https://store.servicenow.com/sn_appstore_store.do#!/store/application/39a9d9664f834e00dd657bb28110c77b). > - In order to send change events from ServiceNow to PagerDuty, you must first [provision a ServiceNow CI as a service in PagerDuty](/integrations/servicenow-integration-guide/servicenow-provisioning#provision-configuration-items-to-pagerduty-with-services-provisioning). ## Configure the PagerDuty ServiceNow Integration 1. Configure the [PagerDuty ServiceNow integration](/integrations/servicenow-integration-guide). 2. Once the integration has been configured, [provision the desired CI as a service](/integrations/servicenow-integration-guide/servicenow-provisioning) in PagerDuty. 3. In your ServiceNow instance, navigate to the Change Requests CI and click **Provision PD Change Event Integration** under Related links. ### Send ServiceNow Change Events 4. In your ServiceNow instance, search for `Change`, click **Create New** and then select a change type: **Normal**, **Standard** or **Emergency**. 5. Once the change request has been created, search and select the **Service** and **Configuration Item** that have been [provisioned from ServiceNow to PagerDuty](/integrations/servicenow-integration-guide/servicenow-provisioning). Then select the **Assignment Group** and enter a **Short description**. 6. In the **Planning** tab, enter a **Justification**, **Implementation plan**, **Risk and impact analysis**, **Backout plan** and **Test plan**, if applicable. This information will appear in the change event’s details in PagerDuty. 7. In the **Schedule** tab, select and **save** the **Planned start date**, **Planned end date**, **Actual start date** and **Actual end date**. This information will schedule the [Maintenance Window](/incident-management/services/maintenance-windows) on the selected service in PagerDuty. Click **Submit**. 8. Click the change request **Number** that was just requested and then click **Request Approval** at the top-right of the request. Once approved, navigate to the change request and click **Implement** at the top-right. You should now be able to see the change event in PagerDuty in the following locations: - **Incidents** → **Recent Changes**: Click the change event’s **Summary** to see all of the details entered in the change request. Click the link **View CHG[NUMBER-HERE]** at the right of the change event to link back to the change request in ServiceNow. - **Services** → **Service Directory** → **Maintenance Windows**: **Please Note**: Maintenance windows will not automatically end if the change request is completed in ServiceNow. Users can either [manually end the maintenance window](/incident-management/services/maintenance-windows#end-a-maintenance-window) in PagerDuty or they can wait until the window ends at its end time. - The connected service in PagerDuty will also have a **Status** of being in maintenance mode.  *Recent changes* ### Edit ServiceNow Change Event Custom Details Format 1. In your ServiceNow account, navigate to **PagerDuty** → **Configuration files** → **Script Includes** tab and search for `change events`. 2. Click **PagerDuty Change Events** and scroll down in the **Script** body to find the `payload` of the `var chgEventBody`. You may customize the details in this script directly. 3. Click **Update** to save your customization. ### Disable Maintenance Windows via Change Requests To disable ServiceNow change requests from creating PagerDuty maintenance windows: 1. In your ServiceNow account, navigate to **PagerDuty** → **Configuration files** → **Application Files** tab and search for `*maint`. 2. Click the **change event maintenance window** system property and change the **Value** field to `false`. 3. Click **Update** to save your customization. ## Disable the ServiceNow Change Events Integration 1. In your ServiceNow account, navigate to **PagerDuty** → **Configuration files** → **Business Rules** tab and search for `change events`. 2. Click the **PD Change Request to Change Event** Name and deselect the **Active** checkbox. 3. Click **Update** to disable change events. --- URL: https://docs.pagerduty.com/integrations/servicenow-integration-guide/servicenow-cmdb-integration-setup-guide # ServiceNow CMDB Integration Setup Guide Sync Configuration Item data from ServiceNow's CMDB into PagerDuty's Enrichment Service The ServiceNow CMDB integration automatically syncs Configuration Item (CI) data from your ServiceNow instance to PagerDuty's Enrichment Service. This creates enrichment **data tables** that enable you to enrich incoming PagerDuty events with contextual information from your ServiceNow CMDB. Read more about event enrichment in the [Event Enrichment documentation](/integrations/event-enrichment). ## How It Works 1. **Configure CMDB Tables** — Define which ServiceNow CMDB tables to sync (for example, `cmdb_ci_server`, `cmdb_ci_ip_switch`). 2. **Map Fields** — Specify which ServiceNow fields to use for matching events and which fields provide enrichment data. 3. **Sync Data** — Enable synchronization to automatically keep enrichment data up-to-date. 4. **Enrich Events** — Use the synced data in Event Enrichment rules to add context to alerts. Each CMDB table configuration creates a corresponding enrichment schema that acts as a queryable **data table** for event enrichment. > **Prerequisites:** - ServiceNow instance with API access enabled > - ServiceNow user account with read permissions for CMDB tables > - PagerDuty account with Event Enrichment enabled > - API authentication token ## Step 1: Create ServiceNow Integration Create your integration with at least one CMDB table configuration. Credentials are added separately in Step 2. ### Request ```text curl -X POST "https://api.pagerduty.com/enrichment/integrations/servicenow" \ -H "Authorization: Token token=YOUR_API_TOKEN" \ -H "Content-Type: application/json" \ -d '{ "name": "Production CMDB Integration", "description": "Enrichment data from production ServiceNow instance", "cmdb_tables": [ { "display_name": "Network Switches", "ci_table_name": "cmdb_ci_ip_switch", "query_filter": "operational_status=1", "field_mappings": [ { "servicenow_field": "name", "event_field": "source" }, { "servicenow_field": "operational_status", "event_field": "Operational Status" }, { "servicenow_field": "support_group", "event_field": "Support Group" }, { "servicenow_field": "u_platform", "event_field": "Platform" }, { "servicenow_field": "sys_class_name", "event_field": "CI Class" } ] } ] }' ``` ### Response: `201 Created` ```json { "integration": { "id": "AGOACUG45VYBRJ6ZCGTBQFN5S4", "name": "Production CMDB Integration", "description": "Enrichment data from production ServiceNow instance", "cmdb_tables": [ { "id": "AGOACUG5DR2ETBH5HBXUPP7KVI", "display_name": "Network Switches", "ci_table_name": "cmdb_ci_ip_switch", "query_filter": "operational_status=1", "field_mappings": [ { "servicenow_field": "name", "event_field": "source" }, { "servicenow_field": "operational_status", "event_field": "Operational Status" }, { "servicenow_field": "support_group", "event_field": "Support Group" }, { "servicenow_field": "u_platform", "event_field": "Platform" }, { "servicenow_field": "sys_class_name", "event_field": "CI Class" } ], "status": "disabled", "created_at": "2026-01-27T21:16:43Z", "updated_at": "2026-01-27T21:16:43Z", "deleted_at": null } ], "credentials": null, "created_at": "2026-01-27T21:16:43Z", "updated_at": "2026-01-27T21:16:43Z" } } ``` ### Understanding Table Status Each CMDB table has a `status` field indicating the current state of data synchronization: - **disabled**: Data sync is not enabled (default for newly created tables). - **syncing**: Initial sync in progress, data is being loaded from ServiceNow. - **active**: Sync is healthy and incremental updates are running. - **error**: Sync failed with an error (check credentials or table configuration). Tables are created with `status: "disabled"` by default. You must explicitly enable sync (see Step 6) to begin data synchronization. ### Understanding Field Mappings Field mappings define how ServiceNow CMDB data maps to PagerDuty event fields: - `servicenow_field`: The column name in your ServiceNow CMDB table. - `event_field`: The field name that appears in enriched PagerDuty events. At least one field mapping is required. Typically, you map one ServiceNow field (like `name` or `sys_id`) to a query field in your events (like `source` or `host`), and additional ServiceNow fields to provide enrichment context. ### Query Filters The optional `query_filter` parameter allows you to limit which CIs are synced from ServiceNow using ServiceNow's query syntax: #### Examples Syncs only CIs with operational status = 1 (operational): ```text operational_status=1 ``` Syncs only CIs where the custom field `u_deployment_status` is not null: ```text u_deployment_status!=NULL ``` Syncs CIs belonging to "Database Team" and with category "Production" (use ^ for AND conditions): ```text support_group=Database Team^category=Production ``` > **Note:** Query filters use ServiceNow's encoded query syntax. Test your filters in ServiceNow first to ensure they return the expected CIs. ### Dot-Walked Fields ServiceNow allows you to traverse relationships using dot-walking syntax. This is useful when the enrichment data you need is in a related table. #### Examples This dot-walks from the CI to its support group, then to the group's manager, and finally retrieves the manager's email address. ```json { "servicenow_field": "support_group.manager.email", "event_field": "Support Manager Email" } ``` #### Common Dot-Walk Patterns - `support_group.name` — Get the support group's display name. - `location.city` — Get the CI's location city. - `assigned_to.email` — Get the assigned user's email address. ## Step 2: Add ServiceNow Credentials Add authentication credentials for your ServiceNow instance. ```text curl -X POST "https://api.pagerduty.com/enrichment/integrations/servicenow/credentials" \ -H "Authorization: Token token=YOUR_API_TOKEN" \ -H "Content-Type: application/json" \ -d '{ "credentials": { "instance_endpoint": "https://your-instance.service-now.com", "user": "integration_user", "password": "YOUR_SERVICENOW_PASSWORD" } }' ``` ### Response: `201 Created` ```json { "credentials": { "id": "AGOCLRSKSB5OPMBBNIQC5X5R6E", "instance_endpoint": "https://your-instance.service-now.com", "user": "integration_user", "created_at": "2026-02-03T23:11:18Z", "updated_at": "2026-02-03T23:11:18Z", "deleted_at": null } } ``` > **Important Notes:** - Passwords are never returned in API responses for security. > - Only **one credential set per account** is allowed. > - Credentials are shared across all ServiceNow integrations in your account. > - The ServiceNow user must have read access to the CMDB tables you configured. ## Step 3: Add Additional Tables (Optional) You can add more CMDB tables to your integration (up to eight total per integration). ```text curl -X POST "https://api.pagerduty.com/enrichment/integrations/servicenow/{integration_id}/tables" \ -H "Authorization: Token token=YOUR_API_TOKEN" \ -H "Content-Type: application/json" \ -d '{ "cmdb_table": { "display_name": "Windows Servers", "ci_table_name": "cmdb_ci_win_server", "query_filter": null, "field_mappings": [ { "servicenow_field": "name", "event_field": "source" }, { "servicenow_field": "category", "event_field": "category" }, { "servicenow_field": "fault_count", "event_field": "fault count" }, { "servicenow_field": "cost_cc", "event_field": "cost cc" } ] } }' ``` ### Response: `201 Created` ```json { "cmdb_table": { "id": "AGOCLVITO53U7HIANUORTDCGRQ", "display_name": "Windows Servers", "ci_table_name": "cmdb_ci_win_server", "query_filter": null, "field_mappings": [ { "servicenow_field": "name", "event_field": "source" }, { "servicenow_field": "category", "event_field": "category" }, { "servicenow_field": "fault_count", "event_field": "fault count" }, { "servicenow_field": "cost_cc", "event_field": "cost cc" } ], "status": "disabled", "created_at": "2026-02-03T23:27:27Z", "updated_at": "2026-02-03T23:27:27Z", "deleted_at": null } } ``` Each table you add creates a new enrichment schema that can be used independently in your Event Enrichment rules. ## Step 4: Update Table Configuration (Optional) Modify field mappings, display names, or query filters for an existing table. ```text curl -X PUT "https://api.pagerduty.com/enrichment/integrations/servicenow/{integration_id}/tables/{table_id}" \ -H "Authorization: Token token=YOUR_API_TOKEN" \ -H "Content-Type: application/json" \ -d '{ "display_name": "Production Network Switches", "query_filter": "operational_status=1^u_environment=production", "field_mappings": [ { "servicenow_field": "name", "event_field": "source" }, { "servicenow_field": "operational_status", "event_field": "Operational Status" }, { "servicenow_field": "sys_class_name", "event_field": "CI Class" }, { "servicenow_field": "support_group.name", "event_field": "Support Team" } ] }' ``` ### Response: `200 OK` (Returns updated table configuration.) > **Note:** Table configurations cannot be modified once data sync has been enabled and the initial backfill has started. Before enabling sync, you can update any aspect of the table configuration including the `ci_table_name`. However, changing the `ci_table_name` fundamentally changes which ServiceNow CMDB table is being synced, so if you need to sync a different table after enabling sync, you must create a new table configuration instead. ## Step 5: Test Table Configuration Before enabling data sync, validate your configuration by testing it against live ServiceNow data. This endpoint queries ServiceNow and returns up to 10 sample records. ```text curl -X GET "https://api.pagerduty.com/enrichment/integrations/servicenow/{integration_id}/tables/{table_id}/test" \ -H "Authorization: Token token=YOUR_API_TOKEN" ``` ### Response: `200 OK` ```json { "enrichment_data": [ { "sys_id": "27e3a47cc0a8000b001d28ab291fa65b", "sys_created_on": "2007-11-09 20:49:13", "name": "OWA-SD-01", "sys_updated_on": "2025-08-04 12:11:27", "category": "Do not migrate to asset", "fault_count": "0", "sys_class_name": "Windows Server", "cost_cc": "USD" }, { "sys_id": "3a172e820a0a0bb40034228e9f65f1be", "sys_created_on": "2008-10-26 09:57:57", "name": "PS LoadBal01", "sys_updated_on": "2025-08-04 12:11:30", "category": "Do not migrate to asset", "fault_count": "0", "sys_class_name": "Windows Server", "cost_cc": "USD" }, { "sys_id": "eb6e54539831f6500ebf0f2f73f452a4", "sys_created_on": "2025-12-18 13:24:13", "name": "prod-db-server-01", "sys_updated_on": "2025-12-18 13:30:01", "category": "Hardware", "fault_count": "0", "sys_class_name": "Windows Server", "cost_cc": "USD" } ] } ``` ### What This Validates The test endpoint verifies: - Credentials are valid and authentication succeeds. - CMDB table exists and is accessible. - Query filter syntax is correct (if specified). - Mapped fields exist in the ServiceNow table. - Data is returned in the expected format. > **Important:** The test response returns data using ServiceNow field names (not the `event_field` names you mapped). This helps you verify that you are mapping the correct ServiceNow fields. ### If the Test Fails, Check: - ServiceNow credentials are correct. - ServiceNow user has read permissions for the table. - CMDB table name is spelled correctly. - Query filter syntax is valid. - All mapped ServiceNow fields exist in the table. ## Step 6: Enable Data Sync Once you have tested your configuration, enable data synchronization to begin syncing CMDB data to PagerDuty. ```text curl -X POST "https://api.pagerduty.com/enrichment/integrations/servicenow/{integration_id}/tables/{table_id}/enable" \ -H "Authorization: Token token=YOUR_API_TOKEN" ``` ### Response: `200 OK` ```json { "table_id": "AGOACUG5DR2ETBH5HBXUPP7KVI", "sync_enabled": true, "message": "Data sync enabled successfully" } ``` ### After Enabling - Data synchronization begins automatically. - The enrichment schema is populated with CI data from ServiceNow. - Data becomes available for use in Event Enrichment rules. - Syncs occur periodically to keep data up-to-date. ## View Integration Status Retrieve your complete integration configuration including all tables, credentials, and current sync status for each table. ```text curl -X GET "https://api.pagerduty.com/enrichment/integrations/servicenow/{integration_id}" \ -H "Authorization: Token token=YOUR_API_TOKEN" ``` ### Response: `200 OK` ```json { "integration": { "id": "AGOACUG45VYBRJ6ZCGTBQFN5S4", "name": "Production CMDB Integration", "description": "Enrichment data from production ServiceNow instance", "cmdb_tables": [ { "id": "AGOACUG5DR2ETBH5HBXUPP7KVI", "display_name": "Network Switches", "ci_table_name": "cmdb_ci_ip_switch", "query_filter": "operational_status=1", "field_mappings": [ { "servicenow_field": "name", "event_field": "source" }, { "servicenow_field": "operational_status", "event_field": "Operational Status" }, { "servicenow_field": "support_group", "event_field": "Support Group" } ], "status": "active", "created_at": "2026-01-27T21:16:43Z", "updated_at": "2026-01-27T21:16:43Z", "deleted_at": null }, { "id": "AGOCLVITO53U7HIANUORTDCGRQ", "display_name": "Windows Servers", "ci_table_name": "cmdb_ci_win_server", "query_filter": null, "field_mappings": [ { "servicenow_field": "name", "event_field": "source" }, { "servicenow_field": "category", "event_field": "category" } ], "status": "disabled", "created_at": "2026-02-03T23:27:27Z", "updated_at": "2026-02-03T23:27:27Z", "deleted_at": null } ], "credentials": { "id": "AGOCLRSKSB5OPMBBNIQC5X5R6E", "instance_endpoint": "https://your-instance.service-now.com", "user": "integration_user", "created_at": "2026-02-03T23:11:18Z", "updated_at": "2026-02-03T23:11:18Z", "deleted_at": null }, "created_at": "2026-01-27T21:16:43Z", "updated_at": "2026-01-27T21:16:43Z" } } ``` ## Use ServiceNow Data In Event Enrichment Once your tables are synced, you can use them in [Event Enrichment rules](/integrations/event-enrichment). The ServiceNow integration automatically creates enrichment schemas for each table configuration. ### Find Your Schemas In the Event Enrichment rule editor: 1. Create or edit an Event Enrichment. 2. Add a new rule and select **Enrich events**. 3. In the **Join data from** dropdown, look for schemas with your configured display names: - "Network Switches" - "Windows Servers" ### Example Enrichment Rule **Scenario**: Enrich events with support group information from your "Windows Servers" table. #### Event Enrichment Rule Configuration 1. **Condition**: `event.custom_details.hostname` exists. 2. **Action**: Enrich events. 1. **Join data from**: Windows Servers 2. **Match on**: `event.custom_details.hostname` = source (the query field you mapped) 3. **Write enrichment data to**: `event.custom_details.cmdb_info` When an event comes in with a matching hostname, it will be enriched with category, fault count, and cost center data from ServiceNow. ## Advanced Configuration ### Specify Query Fields By default, the integration automatically uses the `name` field as the query field — the field used to match incoming PagerDuty events to CI records in ServiceNow. This works well for most setups where events carry the CI name. If your events use a different identifier (like `sys_id`, `ip_address`, or a custom field), or if you want to match on multiple fields simultaneously, you can explicitly designate which fields to use as query fields by adding `"type": "query"` to those field mappings. #### Default Behavior (Auto-Detect) When no `type` is specified on any field mapping, `name` is automatically used as the query field. All other fields provide enrichment context. This is the recommended approach for most integrations. ```json { "field_mappings": [ { "servicenow_field": "name", "event_field": "host" }, { "servicenow_field": "support_group", "event_field": "Support Group" }, { "servicenow_field": "operational_status","event_field": "Operational Status" } ] } ``` #### Explicit Query Field Set `"type": "query"` on any field to use it as the query field instead of `name`. In this mode, `name` is not required and is treated as a regular enrichment field if included. ```json { "field_mappings": [ { "servicenow_field": "sys_id", "event_field": "ci_id", "type": "query" }, { "servicenow_field": "name", "event_field": "host" }, { "servicenow_field": "support_group", "event_field": "Support Group" }, { "servicenow_field": "operational_status","event_field": "Operational Status" } ] } ``` Here, CI records are looked up by `sys_id` rather than `name`. Events must carry the `ci_id` field with a matching value. #### Multiple Query Fields You can designate up to three fields as query fields. When multiple query fields are configured, all of them must be present in the event for a match to occur. This is useful when a single field is not unique enough to identify a CI. ```json { "field_mappings": [ { "servicenow_field": "name", "event_field": "host", "type": "query" }, { "servicenow_field": "sys_class_name", "event_field": "ci_class", "type": "query" }, { "servicenow_field": "support_group", "event_field": "Support Group" }, { "servicenow_field": "location", "event_field": "Location" } ] } ``` In this example, a CI is only matched if the event contains both a matching `host` and a matching `ci_class`. #### View Field Types in Responses The integration API always returns a `type` field on each field mapping in responses, showing how each field is configured (`query` or `enriched`). #### Constraints - At most three fields may have `"type": "query"`. - At least one field must be an enrichment field (no `type` specified). - Only `query` is a valid value for `type` on requests — any other value is rejected. ## Product Limits - **1 ServiceNow integration** per account. - **Up to 5 CMDB tables** per integration. - **2-20 field mappings** per table. - **1 credential set** per account (shared across integrations). ## Troubleshooting ### Integration Creation Fails **Error**: `Account already has a ServiceNow integration` - Only one ServiceNow integration is allowed per account. - Delete the existing integration or add tables to it instead. **Error**: `Invalid CMDB table name` - Verify the table exists in your ServiceNow instance. - Check spelling and capitalization (table names are case-sensitive). - Ensure the ServiceNow user has access to the table. ### Credential Issues **Error**: `Authentication failed` - Verify the ServiceNow instance URL is correct (include `https://`). - Check that username and password are correct. - Ensure the ServiceNow user account is active and not locked. **Error**: `Insufficient permissions` - ServiceNow user must have read access to configured CMDB tables. - Check role assignments in ServiceNow (typically requires itil or admin role). ### Test Endpoint Failures **Returns empty array**: - Query filter may be too restrictive (no records match). - Test the query filter in ServiceNow first to verify results. - Try testing without a query filter to confirm table access. **Error on specific fields**: - Field name may be misspelled or not exist in the table. - Check the ServiceNow table dictionary for correct field names. - For dot-walked fields, verify the relationship exists. ### Sync Issues **Data not appearing in enrichment**: - Verify sync is enabled for the table (check the integration status endpoint). - Allow time for initial sync to complete (may take several hours for large tables). - Check that credentials are still valid. **Data is stale**: - Syncs occur periodically (approximately once per hour). - Consider updating query filters if specific records are not syncing. - Verify ServiceNow data has actually changed. ## Next Steps After setting up your ServiceNow integration: 1. **[Create Event Enrichment rules](/integrations/event-enrichment)** using your synced CMDB data. 2. **Test enrichment** by sending sample events with matching query field values. 3. **Monitor sync status** to ensure data stays current. 4. **Add more tables** as needed for different CI types or teams. --- URL: https://docs.pagerduty.com/integrations/servicenow-integration-guide/servicenow-integration-details # ServiceNow Integration Details An overview of how the ServiceNow v8 integration works ServiceNow is a powerful platform-as-a-service, which offers advanced automation and process workflows for the enterprise environment. This article is an overview of the components and concepts that drive the [ServiceNow v8](/integrations/servicenow-integration-guide) integration, and will give you a deeper understanding of how it works at a fundamental level. > **Looking for a Different Version?:** [ServiceNow Integration Details](/integrations/servicenow-integration-details-v7) for the v7 integration are also available. ## Integration Capabilities  ## Installation and Configuration - **Installation**: For installation instructions, please refer to the [ServiceNow Integration Guide](/integrations/servicenow-integration-guide). - **Advanced Configuration**: For more in-depth information about customizing ServiceNow integration, please refer to [Advanced ServiceNow Configuration](/integrations/servicenow-integration-guide/advanced-servicenow-configuration). ### Upgrade to ServiceNow v8 > **Required User Permissions:** You must have a ServiceNow Admin role to upgrade the integration. 1. [Revert customizations](https://docs.servicenow.com/bundle/vancouver-platform-administration/page/customer-support/task/revert-customization.html) prior to upgrading from the store, as the upgrade path will not patch customized/modified files. Be sure to capture these customizations in an update set and store a copy for future reference before reverting to the out-of-the-box versions. 2. After reverting all app files, upgrade the PagerDuty app to the [newest version in the ServiceNow Store](https://store.servicenow.com/store/app/82fa2be61b246a50a85b16db234bcb5c). 3. Then, navigate to **System Diagnostics** → **Upgrade History** and select the **upgrade** of the PagerDuty app that you just ran. In the **Skipped Changes to Review** tab, you may see a list of records that did not upgrade successfully for some reason or another. Important misses will be marked **Priority 1** or **Priority 2**; if there are any high-priority skipped files in that list (Priority 1 or 2), go through each in turn by clicking their **File name**. On the following details page, click **Revert to Base System** – this will override the customizations that prevented upgrade and will force-upgrade the file to the version of the PagerDuty app you’ve just installed. Lower priority skipped files should be left as is. 4. Navigate to the **PagerDuty Settings** page to update the new fields in this form. A new workflow connection will be automatically provisioned upon clicking **Save** at the bottom of the screen. This will enable ServiceNow as a Workflow Action. Once this is complete, manual sync is immediately restored. 1. If there is a **ServiceNow user ID** or **ServiceNow user password** change, the integration will force a connection update. 2. A valid PagerDuty configuration (**PagerDuty account URL**, **PagerDuty API access key**, **REST API Endpoint**) is required in order to provision a connection. 3. Select a **Sync option**in the new **Webhook Configuration** management section. 4. In the **Activity Stream** section, confirm that there are check marks next to the event types that you want to sync to your ServiceNow activity stream. 5. Ensure that application access is granted for the `sysauto_script` table for _read_, _create_, and _update_ operations, as indicated in [this step of our integration guide](/integrations/servicenow-integration-guide#11-servicenow-application-access-controls). 6. Navigate to **Integration Health Check**. The integration health check will run automatically, to ensure initial connection is intact and verify that the workflow connection has been enabled. 7. Navigate to **Webhooks Health Check** → **Run health check**, and resolve any inconsistencies prior to migration. 8. Navigate to **Webhooks Migration** to migrate webhooks to v3, and convert all ServiceNow extensions to the latest version. 9. Navigate to **PagerDuty Inbound Field Rules** to update existing [Inbound Field Rules](/integrations/servicenow-integration-guide/advanced-servicenow-configuration#check-inbound-field-rules) to extract data from the new v3 webhook payload. 10. **If you had customizations** (_Optional_): 1. Determine whether historical customizations are still necessary (new integration versions introduce new functionality and fixes, such that the cause for a previous customization may no longer exist). 2. Manually implement each required customization on the new version of the file (i.e., do **not** revert any files to their pre-upgrade versions _or_ import old versions of files). Test after each addition to ensure that the customization does not incur breakage in the new version of the integration. ## Manage Integration Settings Once the ServiceNow v8 integration has been [initially configured](/integrations/servicenow-integration-guide) or [upgraded](#upgrade-to-servicenow-v8) to, global integration settings can be found by navigating to **PagerDuty Settings**.  *PagerDuty Settings page in ServiceNow* ### Integration Behavior | Setting | Values | | --- | --- | | Choose ServiceNow to PagerDuty mapping | Select one of the following from the dropdown: **Configuration Items and Assignment Groups map to PagerDuty** _(Recommended)_ or **Assignment Groups map to PagerDuty**. To learn more, see [How ServiceNow Objects Map to PagerDuty Objects](/integrations/servicenow-integration-guide/servicenow-provisioning#how-servicenow-objects-map-to-pagerduty-objects). | | Incident state value to use when PagerDuty resolves an incident | Select the integer value associated with the **Resolved** state in your ServiceNow instance. | | Default role that should be used when provisioning users from ServiceNow into PagerDuty | Select your preferred default role for provisioned users from the dropdown: **Observer**, **Responder**, **Manager**, or **Global Admin**. | | PagerDuty functionalities available to display in ServiceNow | Check the features you want enabled in your ServiceNow instance: **PagerDuty Teams** — make use of [PagerDuty Teams](/account-admin/teams) functionality along with assignment groups in ServiceNow (available on Business, Digital Operations (legacy), and Enterprise for Incident Management plans); **Response Mobilizer** — add one or more users as responders to an existing incident from the ServiceNow interface ([Add Responders](/incident-management/incidents/add-responders), available on Business, Digital Operations (legacy), and Enterprise for Incident Management plans); **Conference Bridge** — add conference bridge information to an incident from the ServiceNow interface ([Conference Bridge](/incident-management/incidents/conference-bridge), available on Business, Digital Operations (legacy), and Enterprise for Incident Management plans); **Incident Workflows** — run Incident Workflows from the ServiceNow interface ([Incident Workflows](/ai-automation/automation/incident-workflows), available on Business, Digital Operations (legacy), and Enterprise for Incident Management plans); **Status Update** — send incident status updates from the ServiceNow interface ([Status Updates](/incident-management/communicate/communicate-with-stakeholders#status-updates), available on Business, Digital Operations (legacy), and Enterprise for Incident Management plans); **Incident Types** — associate incidents with a specific incident type and its custom fields so that responders only see the custom fields relevant to the incident context. | | PagerDuty action configurations | **Resolve PagerDuty incident if ServiceNow incident is assigned to a group that doesn't exist in PagerDuty**: Choose whether a PagerDuty incident should resolve if it is assigned to a group that has not been mapped to PagerDuty. This is useful if not all ServiceNow groups are mapped to PagerDuty escalation policies. **Create a new PagerDuty user if the Assigned To user on the incident is not in PagerDuty**: Optionally auto-provision ServiceNow users to PagerDuty when they are assigned to or manage a ServiceNow incident. This may impact billing on your account. **Do not assign the ServiceNow incident until a PagerDuty user has acknowledged the incident**. **Provision current Assignment Group members into PagerDuty when provisioning Assignment Groups**: Optionally auto-provision all users who are part of an Assignment Group when you provision the group to PagerDuty. **Create PagerDuty Schedule when provisioning Assignment Groups**: Automatically create a new schedule when you provision an Assignment Group to PagerDuty. When you create a schedule, it will automatically add the Manager for the Assignment Group to the schedule. You will then need to populate the schedule with other users in PagerDuty. | | Customize PagerDuty Incident Body | Customize the PagerDuty incident body when you create an incident from ServiceNow. Use braces to input variables from columns in the incident table and `{workNote}` to include a work note. | ### PagerDuty Settings You can gather some of these values by following the initial steps in the [Integration Walkthrough](#integration-walkthrough). However, you may choose to edit them at a later date by following [steps 2-5](/integrations/servicenow-integration-guide#step-2-configuration-in-pagerduty) again. | Setting | Values | | :-------------------------------------------------------- | :--------------------------------------------------------------------------------------------------------------------------------------------------------------------------------------------------------------------------------------------------------------------------------------------------------------------------------------------------------- | | PagerDuty account URL (`https://subdomain.pagerduty.com`) | Your PagerDuty subdomain URL, e.g., `https://subdomain.pagerduty.com` | | PagerDuty API access key | Paste the [REST API key](/integrations/servicenow-integration-guide#21-create-a-pagerduty-api-access-key) that you generated in PagerDuty. | | Default service ID _(Optional)_ | - You can provision a default PagerDuty service by clicking **Provision default service**. - If you have an existing PagerDuty service that you want to use as the default service, copy the 7-character ID starting with `P` at the end of the service's URL and paste it into this field. | | Default user ID | - This is the integration user (sometimes also referred to as the service user or application user) that you created in PagerDuty. - Paste the user ID associated to the [Default PagerDuty User Account for ServiceNow](/integrations/servicenow-integration-guide#22-create-a-default-pagerduty-user-account-for-servicenow) . | | REST API Endpoint | - **If your account is hosted in the US [service region](/get-started/service-regions)**: This should be left as the default, `https://api.pagerduty.com` - **If your account is hosted in the EU [service region](/get-started/service-regions)**: Enter `https://api.eu.pagerduty.com` | ### Webhook Configuration | Setting | Values | | --- | --- | | ServiceNow user ID | The ServiceNow user ID that PagerDuty should use to authenticate with ServiceNow for webhook delivery. | | ServiceNow user password | The corresponding password for the ServiceNow user above. | | Sync option | This setting only applies to how PagerDuty creates ServiceNow incidents. Select the incident sync method from the dropdown: **Auto** — when a PagerDuty incident triggers, it automatically creates a ServiceNow incident; **Manual** — when a PagerDuty incident triggers, it will not automatically create a ServiceNow incident. Instead, a **Sync with ServiceNow** button will appear on the PagerDuty incident's details page. | | Task type | At this time, only Incident task types are available. | | ServiceNow REST endpoint for webhook | It is recommended that you leave this value as-is. | | Workflow Connection | The connection used to create ServiceNow incidents based on PagerDuty Incident Workflows. After saving the PagerDuty Settings page, navigate back to this field to verify that a workflow connection has generated successfully. | ### Activity Stream Customization Configuration options to control what PagerDuty information is shown in the ServiceNow incident activity stream (e.g. ServiceNow incident work notes stream). Check the options that you want to display in the incident activity stream: 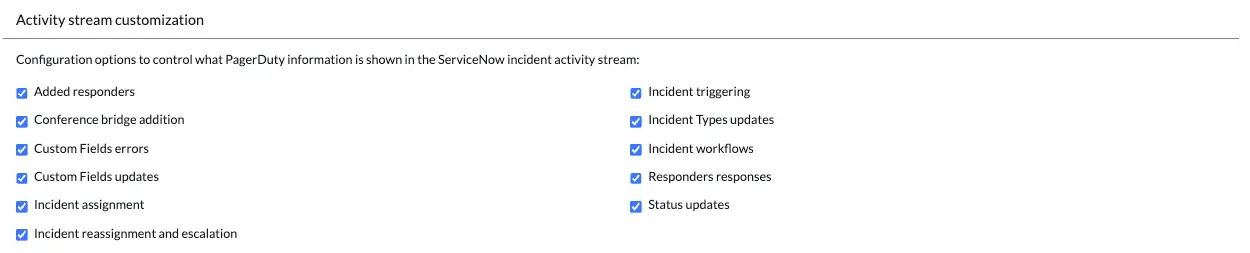 *ServiceNow activity stream customization* ### PagerDuty API requests customization #### HTTP headers Add custom headers for PagerDuty API requests. In the field, add one on each line without quotes (e.g., `name:value`). #### Use MID Server The ServiceNow integration comes with optional [MID server](https://docs.servicenow.com/bundle/vancouver-servicenow-platform/page/product/mid-server/concept/mid-server-landing.html) support. Please see our [Advanced ServiceNow Configuration](/integrations/servicenow-integration-guide/advanced-servicenow-configuration#use-a-mid-server) article for more information. ### Legacy Settings #### Logging verbosity level Modify the amount of information contained in the logs for the PagerDuty integration. Default value is **info**; consider changing to **debug** for troubleshooting. ## Core Components All of the source code that performs the actions underpinning the integration can be accessed by going to **PagerDuty** → **Configuration** → **Configuration files**. Most of the tasks performed to synchronize data between PagerDuty and ServiceNow are executed in the following application files, under **Script Includes**: | Component | Description | | --- | --- | | **PagerDuty** | Functions for performing actions on incidents, including incident assignment, syncing work notes, and triggering incidents. | | **PagerDutyInbound, PagerDutyInboundV3** | Functions that handle receipt and processing of webhooks from PagerDuty. | | **PagerDutyProvisioning** | Handles the creation of objects in PagerDuty from ServiceNow. | | **PagerDuty\_REST** | Core functions for making REST API requests. | | **PagerDutyInboundWorkflowActions** | For Workflow actions, and manual sync of PagerDuty incidents to create a ticket in ServiceNow. | It is possible to modify these components. However, please note that any customizations to these core components, which alter the integration’s out-of-the-box behavior, are not supported by the PagerDuty Support Team. ## Integration Health Check 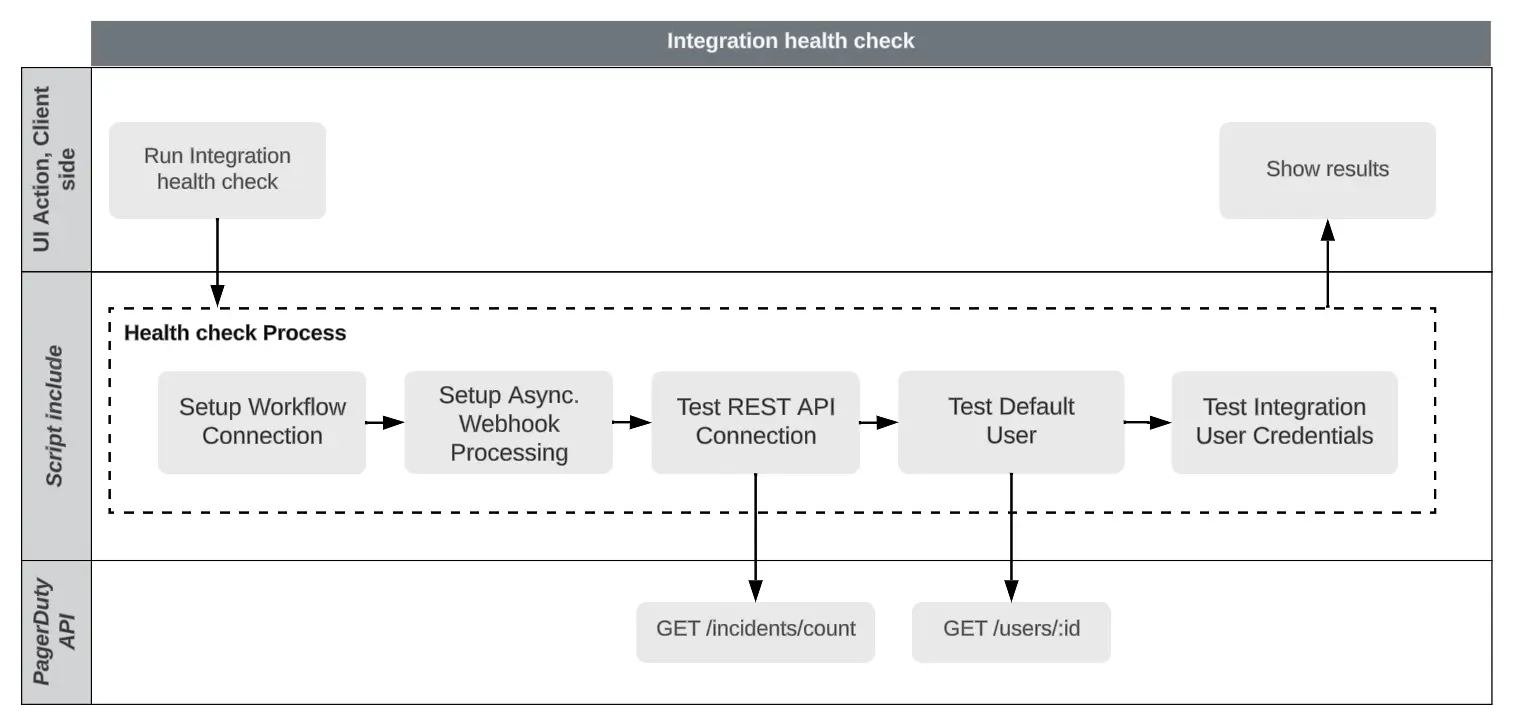 *Integration health check* ### What Happens During an Integration Health Check - **Test REST API Connection**: The Health Check validates if the integration is able to successfully make requests to the PagerDuty REST API. You should get a Connection test successful (200) response if the request was successful. - **Test ServiceNow User Authentication**: The Health Check validates the username and password for the integration user in ServiceNow. Specifically, the ServiceNow integration user on the PagerDuty Settings page. You should get a ServiceNow user authentication test successful (200) response if the validation was successful. - **Test Default User Settings**: The Health Check validates the UserID and email for the PagerDuty integration user. Specifically, for the PagerDuty user corresponding to the Default user ID on the PagerDuty Settings page. You should see a series of success messages. If you do not receive a success message, you will be informed if there are any changes required. - **Test Workflow Connection**: The Health Check validates if a Workflow Connection has been established. 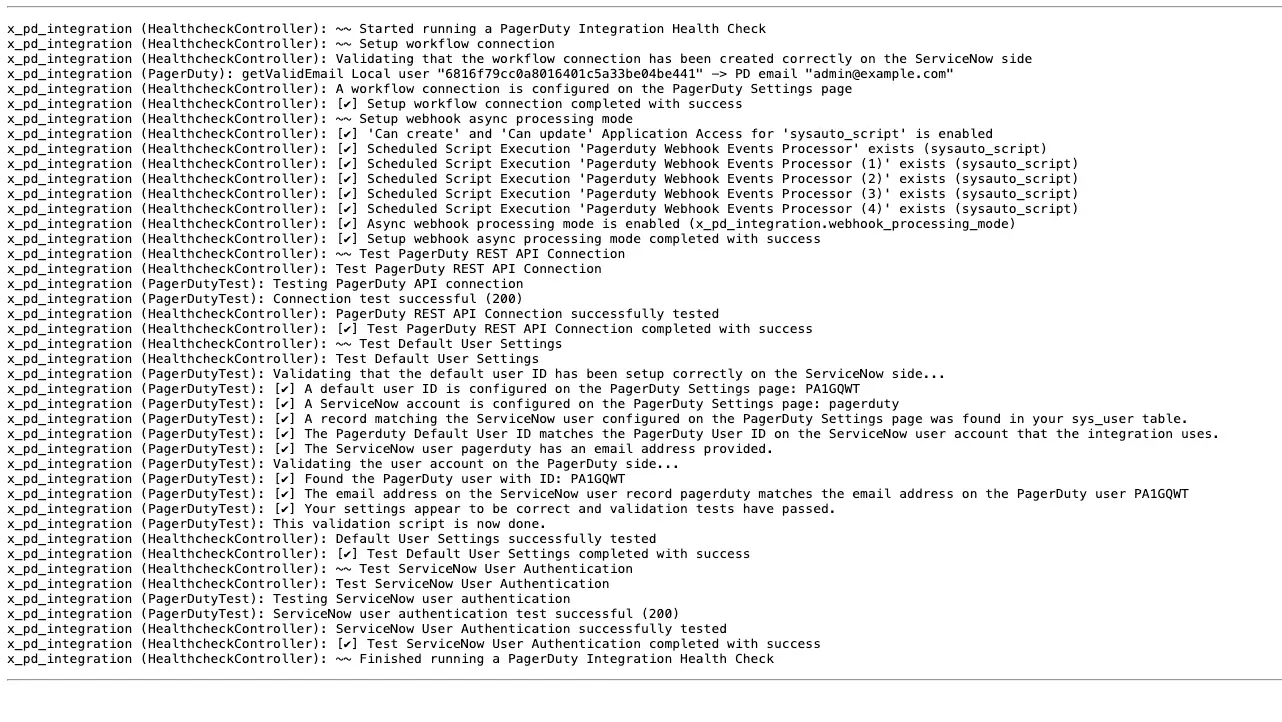 *Integration Health Check example* ### How and When to Run the Integration Health Check > **Required User Permissions:** You must have the `x_pd_integration.admin` role in ServiceNow to run the Integration Health Check. - **How to run the Integration Health Check**: In ServiceNow, navigate to **Integration Health Check**. The health check will run automatically. Once the health check is complete, the results will be displayed on this page. - **When to run the Integration Health Check**: We recommend running Integration Health Checks during the [initial configuration](/integrations/servicenow-integration-guide) of the PagerDuty app in ServiceNow, and also when [upgrading the app to v8](#upgrade-to-servicenow-v8). ## Webhooks Health Check 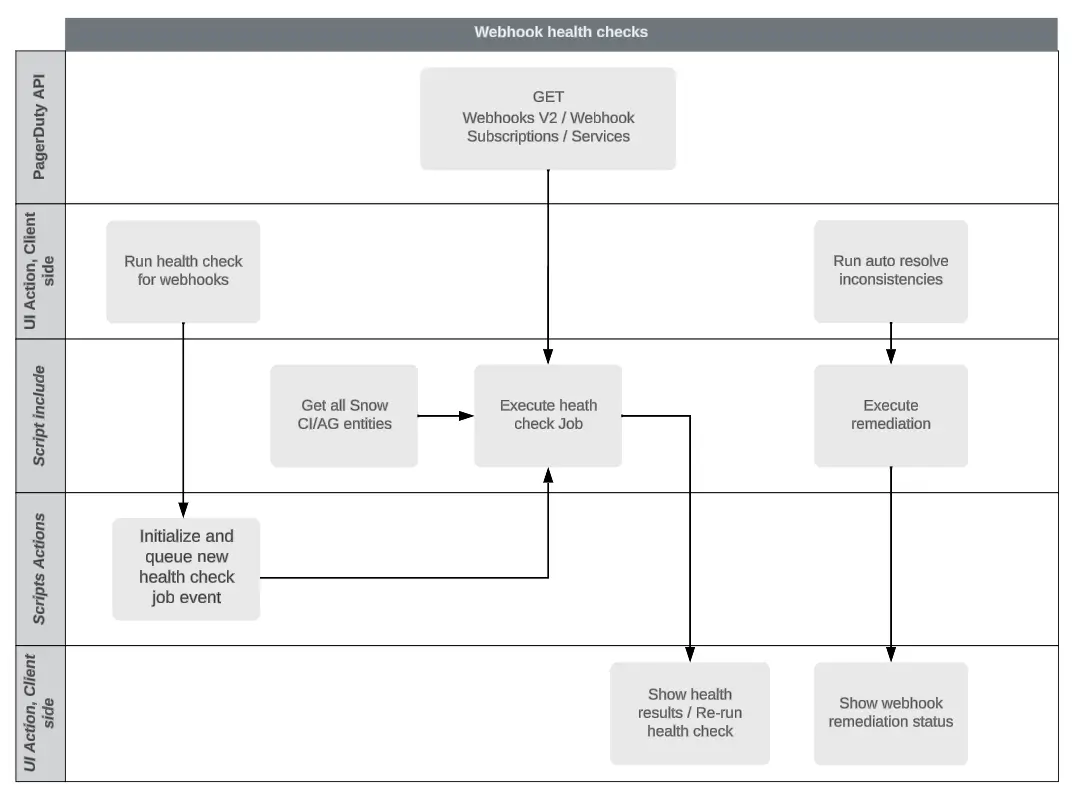 *Webhook health checks* ### What Happens During a Webhooks Health Check The Webhooks Health Check scans the existing system-wide webhook configurations connecting PagerDuty and ServiceNow, highlighting any errors or inconsistencies. The Webhooks Health Check also provides remediation guidance, such as bulk re-enabling disabled webhooks. This feature uses the concept of asynchronous job execution to fetch all required data from PagerDuty and ServiceNow, and then it builds a snapshot of the status and configuration of your webhooks. 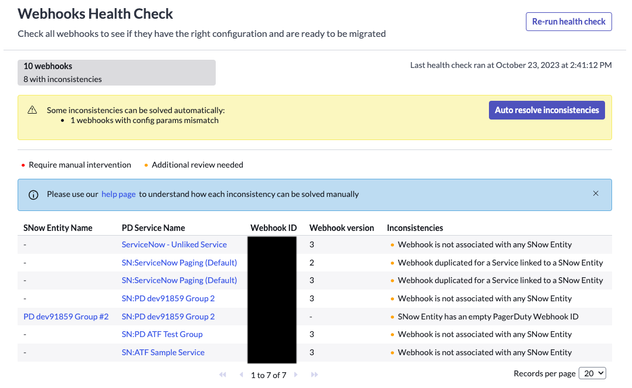 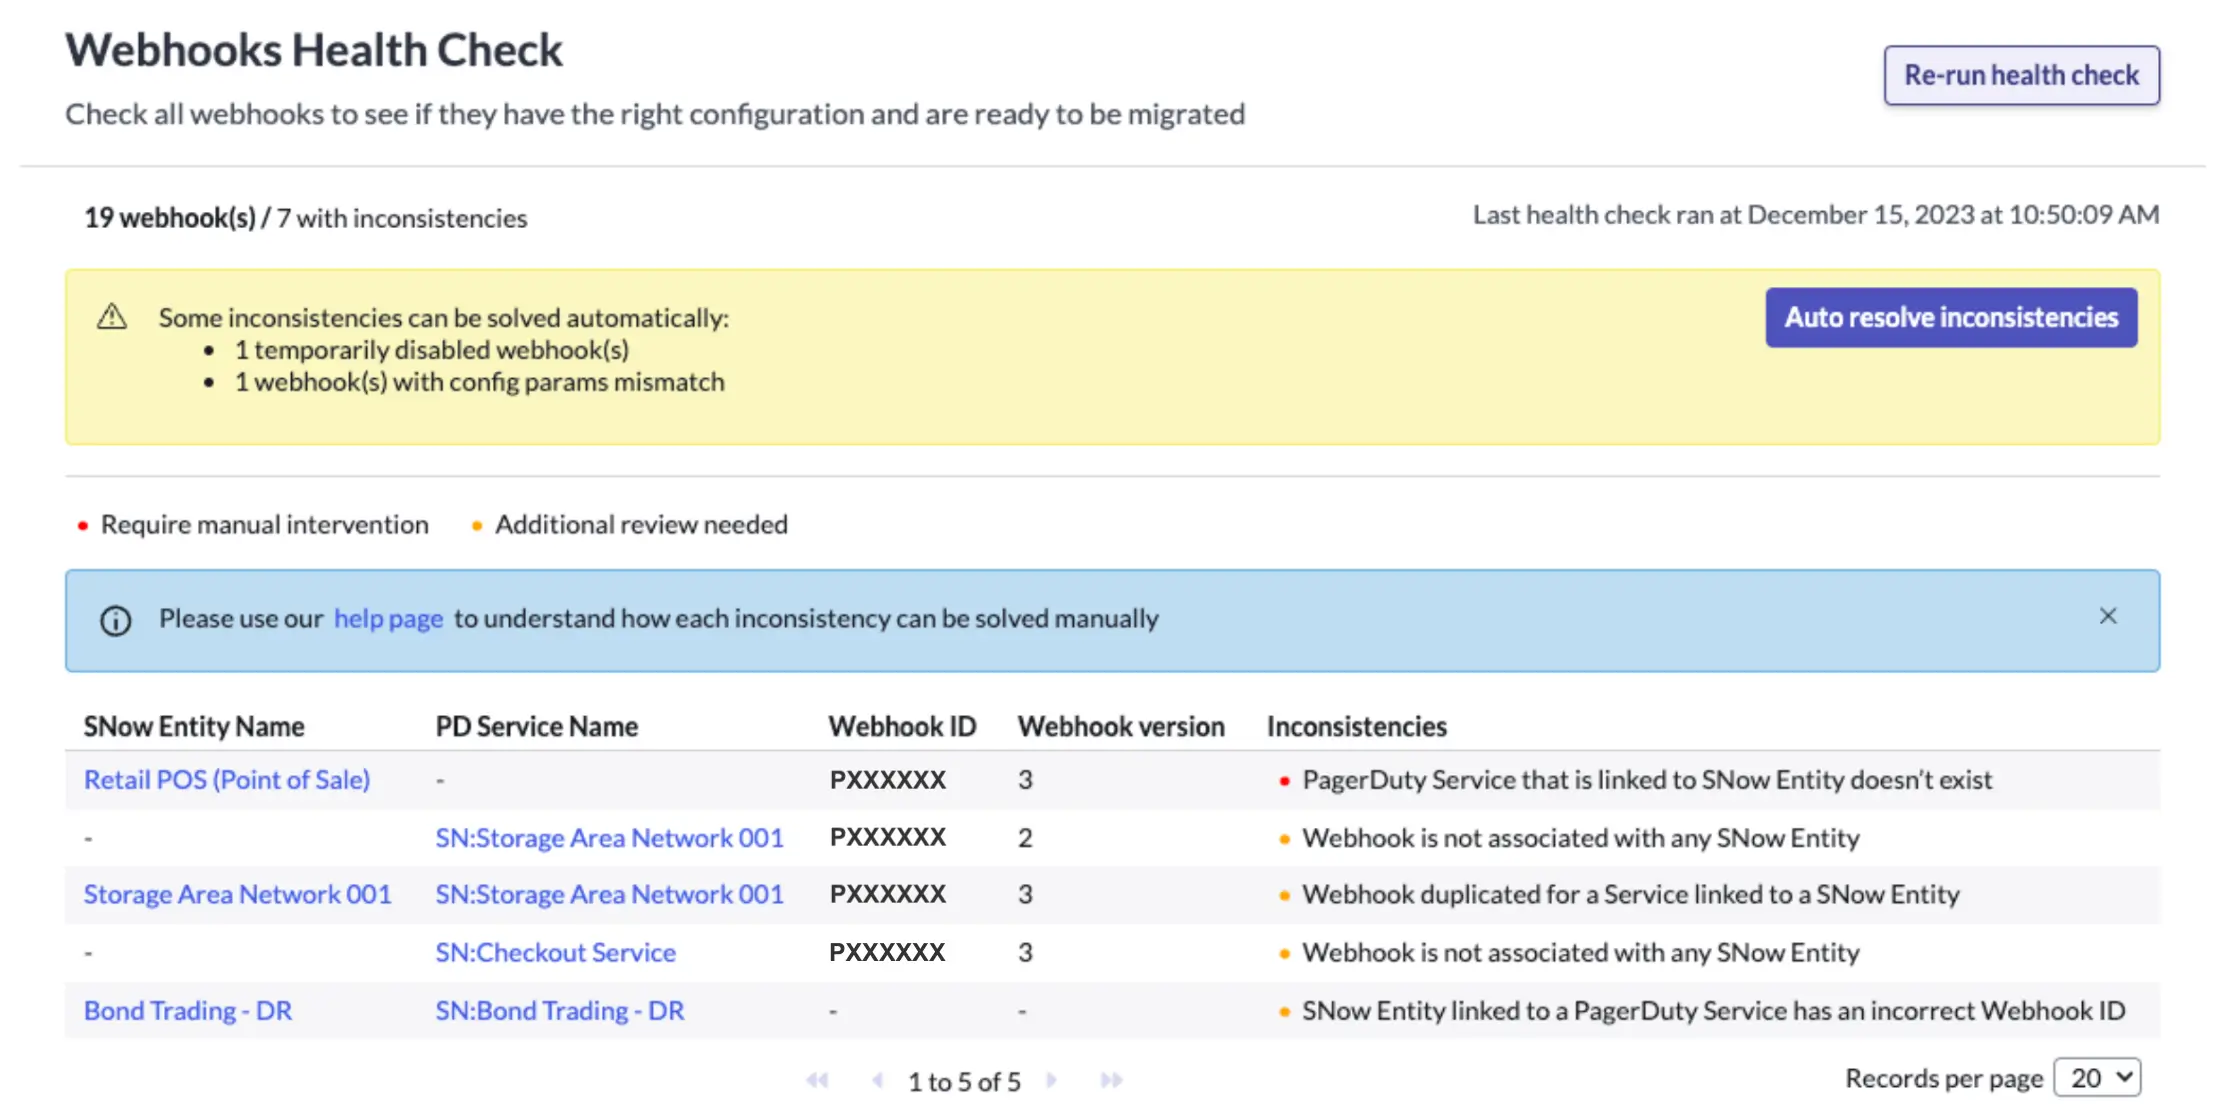 *Webhook status* ### How and When to Run a Webhooks Health Check > **Required User Permissions:** You must have the `x_pd_integration.admin` role in ServiceNow to run the Webhooks Health Check. - **How to Run a Webhooks Health Check**: Navigate to **Webhooks Health Check**. Then click **Run health check** to initiate the process. Review the results, and resolve any inconsistencies detected by the health check. Then re-run the health check again to confirm that the inconsistencies have been resolved. - **When to Run a Webhook Health Check**: Run the Webhooks Health Check during [initial configuration](/integrations/servicenow-integration-guide) of the PagerDuty app in ServiceNow, and also when [upgrading the app to v8](#upgrade-to-servicenow-v8). You can execute additional Webhooks Health Checks after installation/upgrade at the Admin’s discretion. ## Webhooks Migration 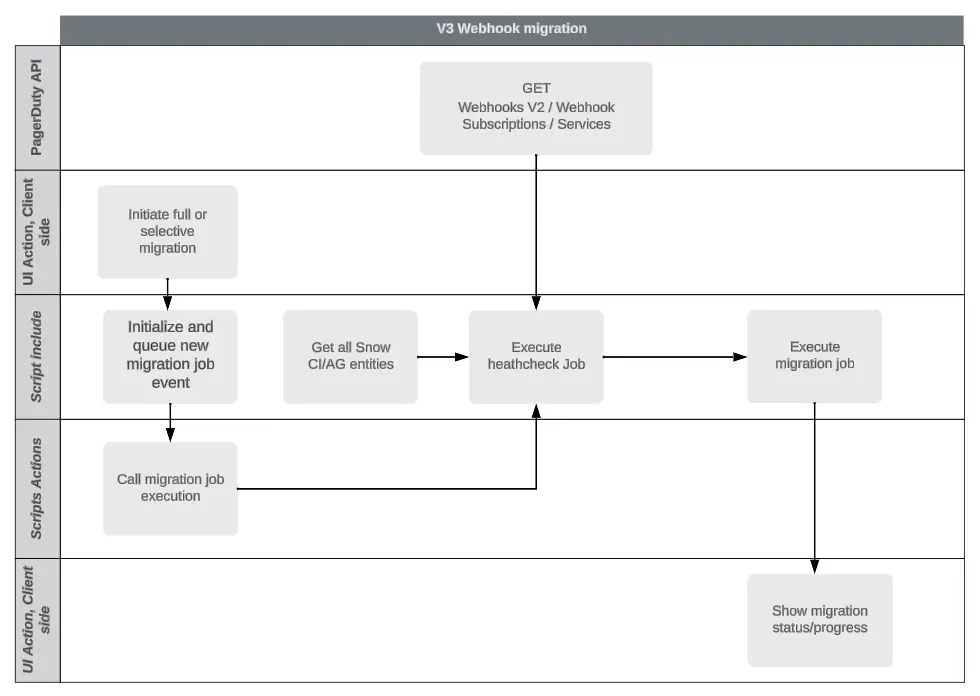 ### Introduction to the Webhooks Migration Module The Webhooks Migration module converts existing v2 ServiceNow extensions into generic v3 webhooks. We highly recommend running the [Webhooks Health Check](#webhooks-health-check) prior to migration, since this is the process that identifies v2 webhooks. To access the Webhooks Migration module in ServiceNow, navigate to **Webhooks Migration**. ### Migrate Webhooks to v3 1. Before migrating your webhooks to v3, please confirm that the workflow connection has been enabled. This can be verified by navigating to **Integration Health Check**, which will run automatically. - Do not migrate webhooks, or continue using the integration, until you have completed this check. 2. Next, navigate to **Webhooks Health Check**. 3. Click **Run health check**. 4. If there are any inconsistencies, we recommend resolving them prior to migrating webhooks to v3. 5. Next, select **All** and search and select **Webhooks Migration** and **Migrate** your webhooks. 6. You should see a confirmation modal indicating that migration was successful. ### Additional Notes Regarding Webhook Migration - When managing v3 webhooks, refrain from re-configuring webhooks via the PagerDuty web UI. Instead, navigate to the Assignment Group/CI record in ServiceNow, to make changes to webhook configuration. - Installations upgraded to v8 will keep their existing v2 webhooks until the webhook migration is performed. However, any new webhooks created after the upgrade will be v3. ## Data from PagerDuty to ServiceNow ### How PagerDuty Communicates to ServiceNow Real-time incident updates in PagerDuty are communicated to ServiceNow through [extensions](/integrations/extensions) on each PagerDuty service that correspond to a provisioned Assignment Group in ServiceNow. When you initially provision a Group, it creates an extension on the service. In version 3.5 and later, a service extension will be provisioned automatically (if one does not already exist) whenever a new incident is created. The extensions, also known as webhooks, specify URLs in your ServiceNow instance to which JSON-encoded data is sent via HTTPS/POST requests. 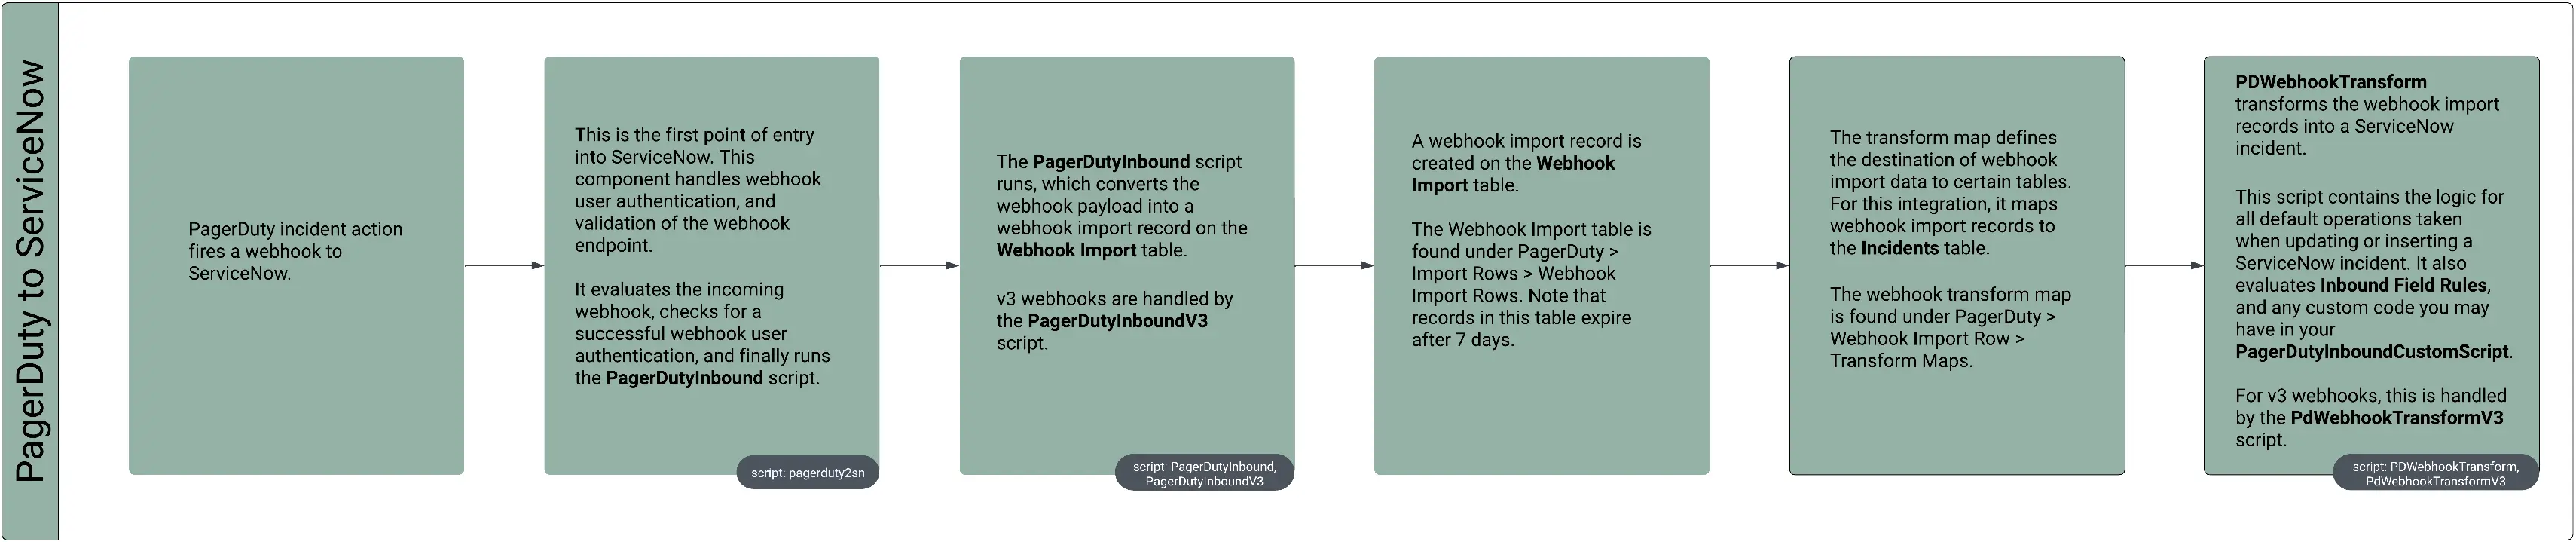 *PagerDuty to ServiceNow communication flow* **The following variables dictate the actions that will be taken on the target record for each webhook import**: The `PdWebhookTransform` script – `PdWebhookTransformV3` script for v3 webhooks – contains the logic for all default operations taken when updating or inserting an incident (e.g., additional fields to populate and workflow logic). Within the local scope, the following variables dictate the actions that will be taken on the target record for each webhook import. By the time the script completes, the incident’s properties will be stored in the `target` variable. Changes will be saved after the script exits. | Variable | Description | | --- | --- | | `source` | The import record. The field `source.message_type` is particularly important, as it will be one of the [webhook types](/developer/webhooks-overview). | | `action` | This will be `insert` or `update` depending on whether a new incident record is created or an existing incident is updated. | | `assignOnAckOnly` | A boolean value (`true` or `false`), determined by the setting **Only assign based on an acknowledgment from PagerDuty user**. Its value determines whether the ServiceNow incident should be assigned based on acknowledgment from PagerDuty, or if the integration should synchronize incident assignment between ServiceNow and PagerDuty with each webhook update. | | `target` | A GlideRecord object representing the incident in ServiceNow that will be created or updated. | ### Syncing PagerDuty Incident Notes to ServiceNow Starting in version 5, the integration uses the `annotate` webhook event type to keep incident notes synchronized between PagerDuty and ServiceNow. When you add a PagerDuty incident note, the webhook transform will recognize the event, and add the note as a work note with the suffix `(PagerDuty: PAGERDUTY_USER_NAME on TIMESTAMP)`. In earlier versions (v7.6 and below), the process that ran in the opposite direction was initiated by a business rule (in addition to the user-initiated UI action **Refresh PagerDuty Notes**), which appeared as an action in the context menu for any given linked incident. The business rule **PD Update Worknotes from PagerDuty Notes** polls for updates, and raises the event `x_pd_integration.import_notes` (handled by the **Import Notes from PagerDuty incident** script action). In both cases, the functions `PagerDuty.getIncidentNotes` and `PagerDuty.createNoteImports` are used to import and save notes from PagerDuty. ServiceNow incident work notes will appear in PagerDuty with the prefix `(from ServiceNow:SERVICENOW_USER_NAME)`. ## Data from ServiceNow to PagerDuty ### How ServiceNow Communicates to PagerDuty  *ServiceNow to PagerDuty communication flow* #### Syncing ServiceNow work notes to PagerDuty Work notes are copied from ServiceNow to PagerDuty through the **PD Copy worknote to PagerDuty incident** business rule, which triggers the `x_pd_integration.post_worknote` event, which then invokes the `PagerDuty.postIncidentNote` function. This runs any time a work note changes on a linked incident. #### How ServiceNow Interacts with PagerDuty Incidents 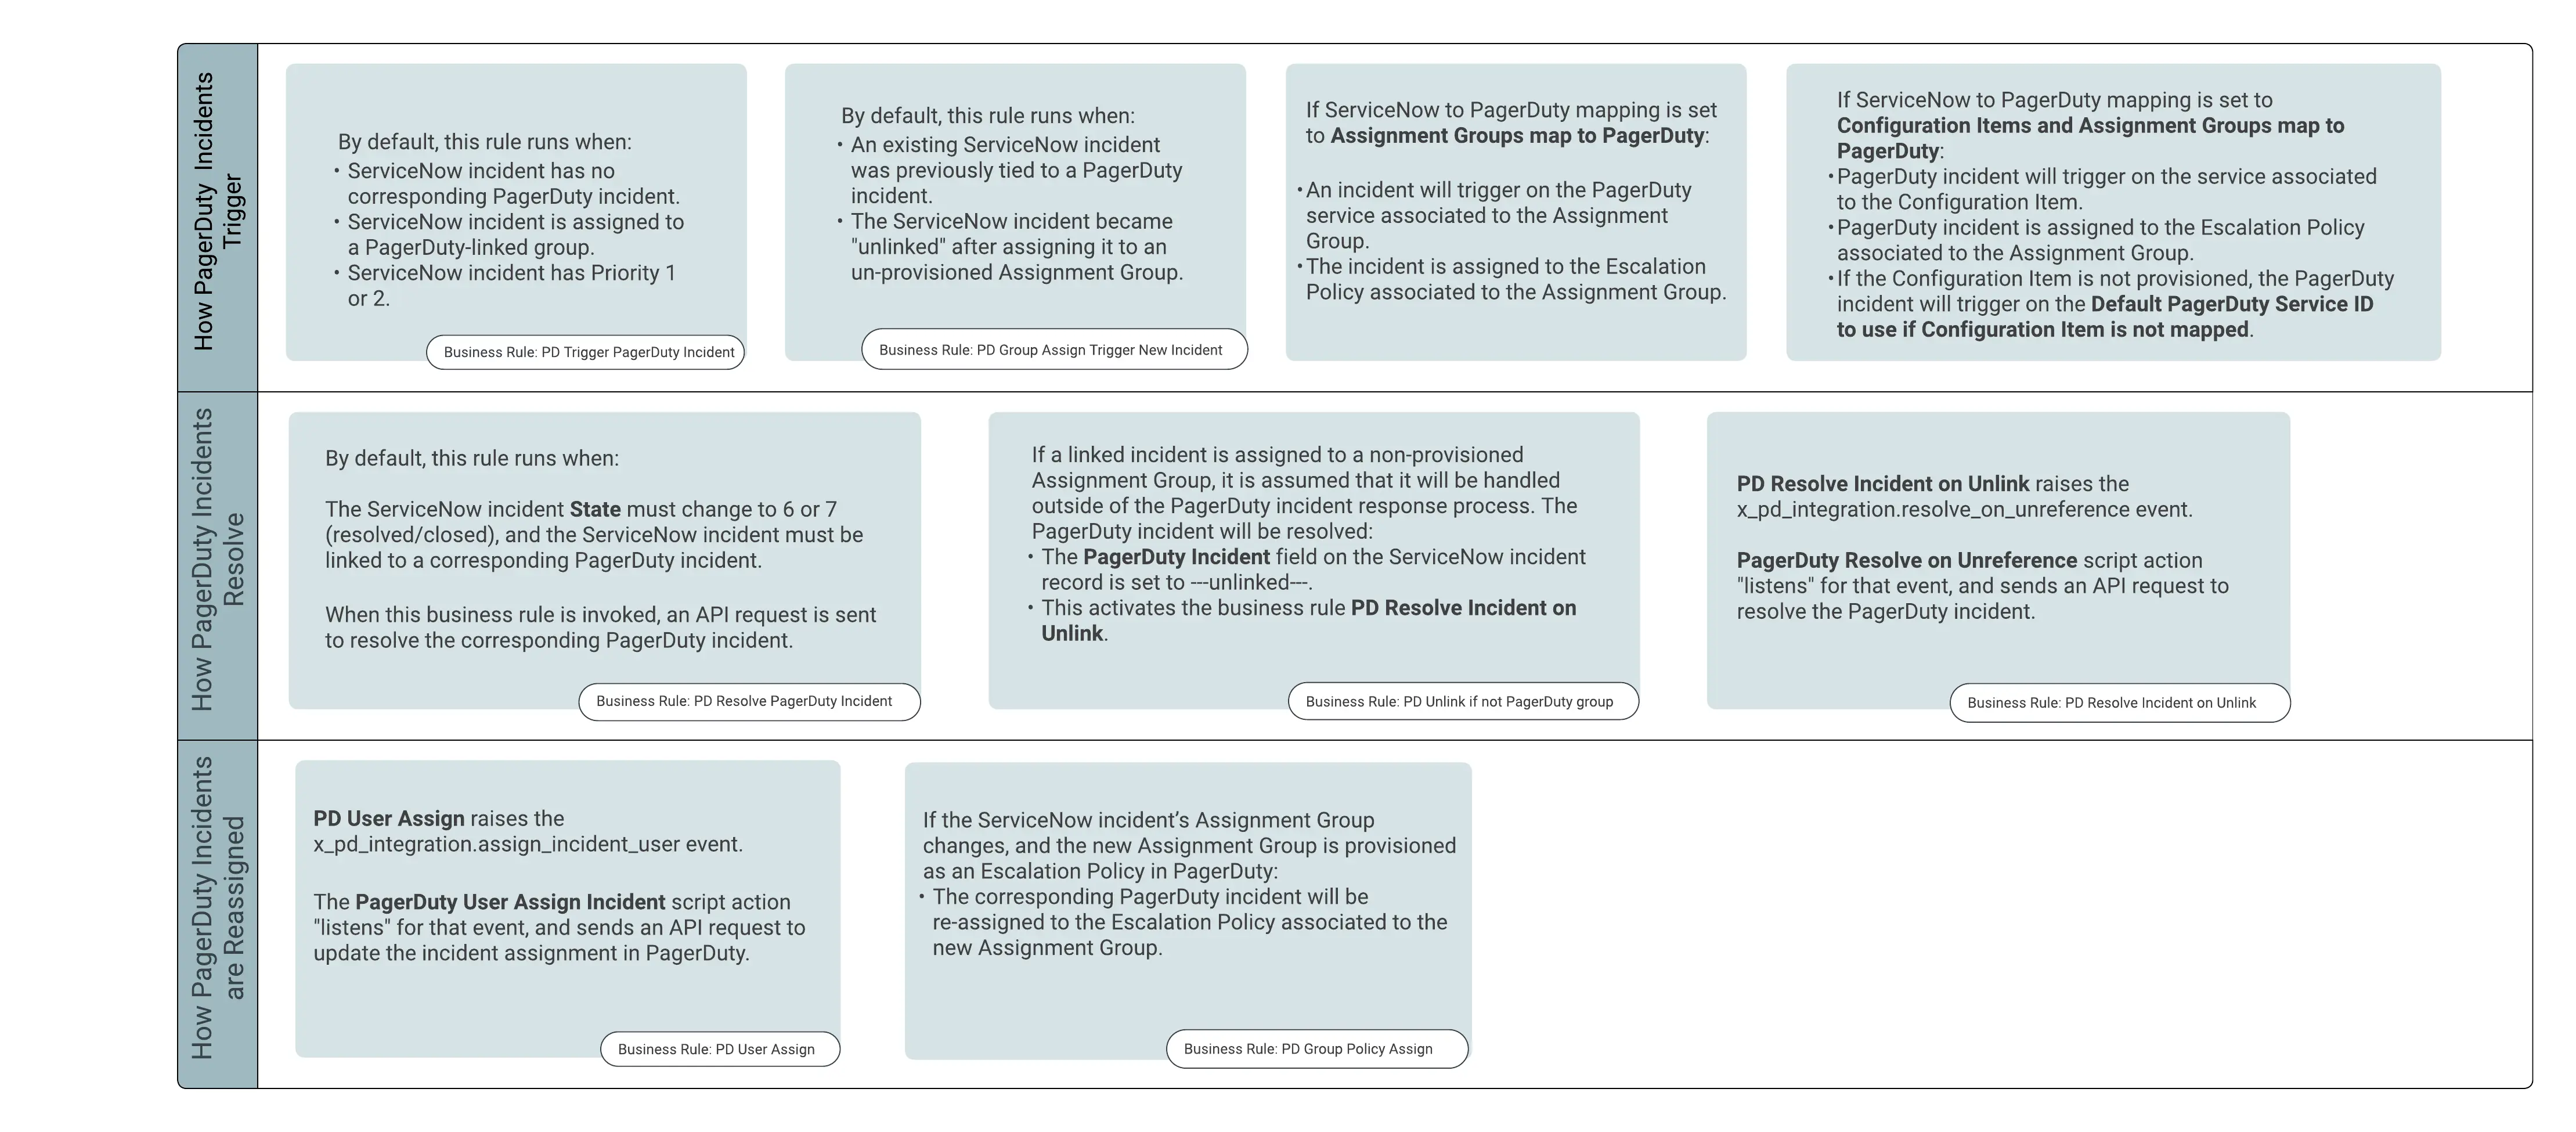 --- URL: https://docs.pagerduty.com/integrations/servicenow-integration-guide/servicenow-provisioning # ServiceNow Provisioning Provision ServiceNow objects to PagerDuty ## Provisioned versus Linked ### Provisioned The term provisioned describes the process by which the integration generates a new object (or objects) in PagerDuty, corresponding to an object in ServiceNow. Following this, the integration will update the integration fields within the ServiceNow record to display the ID(s) of the newly created objects in PagerDuty. ### Linked The term linked describes the process by which the integration associates and connects existing PagerDuty resources to existing ServiceNow resources. #### Link PagerDuty Escalation Policies to ServiceNow Assignment Groups You can link existing PagerDuty Escalation Policies to ServiceNow Assignment Groups: 1. In PagerDuty, navigate to the Escalation Policy you want to link. 2. Copy the escalation policy's ID from the URL, e.g., `PXXXXXX`. 3. In ServiceNow, navigate to the Assignment Group record. 4. Paste the copied Escalation Policy ID into the `PagerDuty default escalation` field, then save the record. #### Link PagerDuty Services and Webhooks to ServiceNow You can link existing PagerDuty services to ServiceNow Assignment Groups and Configuration Items: 1. In PagerDuty, navigate to the service you want to link 2. Copy the ID of the PagerDuty service from the URL 3. In ServiceNow, navigate to the Assignment Group or Configuration Item record 4. Paste the copied service ID into the `PagerDuty service` field, then save the record After saving, a **Provision Webhook into PagerDuty** link will appear in the **Related Links** section of the record. Clicking this link creates a new v3 webhook subscription in PagerDuty. The integration will then update the `PagerDuty webhook` field in the record to display the ID of the newly created webhook subscription. ## How ServiceNow Objects are Provisioned into PagerDuty > **Required User Permissions:** The ServiceNow `x_pd_integration.admin` role is required to provision services and users to PagerDuty. For any ServiceNow User, Assignment Group, or Configuration Item (CI) to be recognized by the integration, it must be provisioned. Objects can be provisioned by navigating to the **Related Links** section in the User, Assignment Group, or Configuration Item form and clicking **Provision PagerDuty User**, **Provision Group into PagerDuty** or **Provision CI into PagerDuty**. This process will make the necessary REST API calls in the `PagerDutyProvisioning` script. 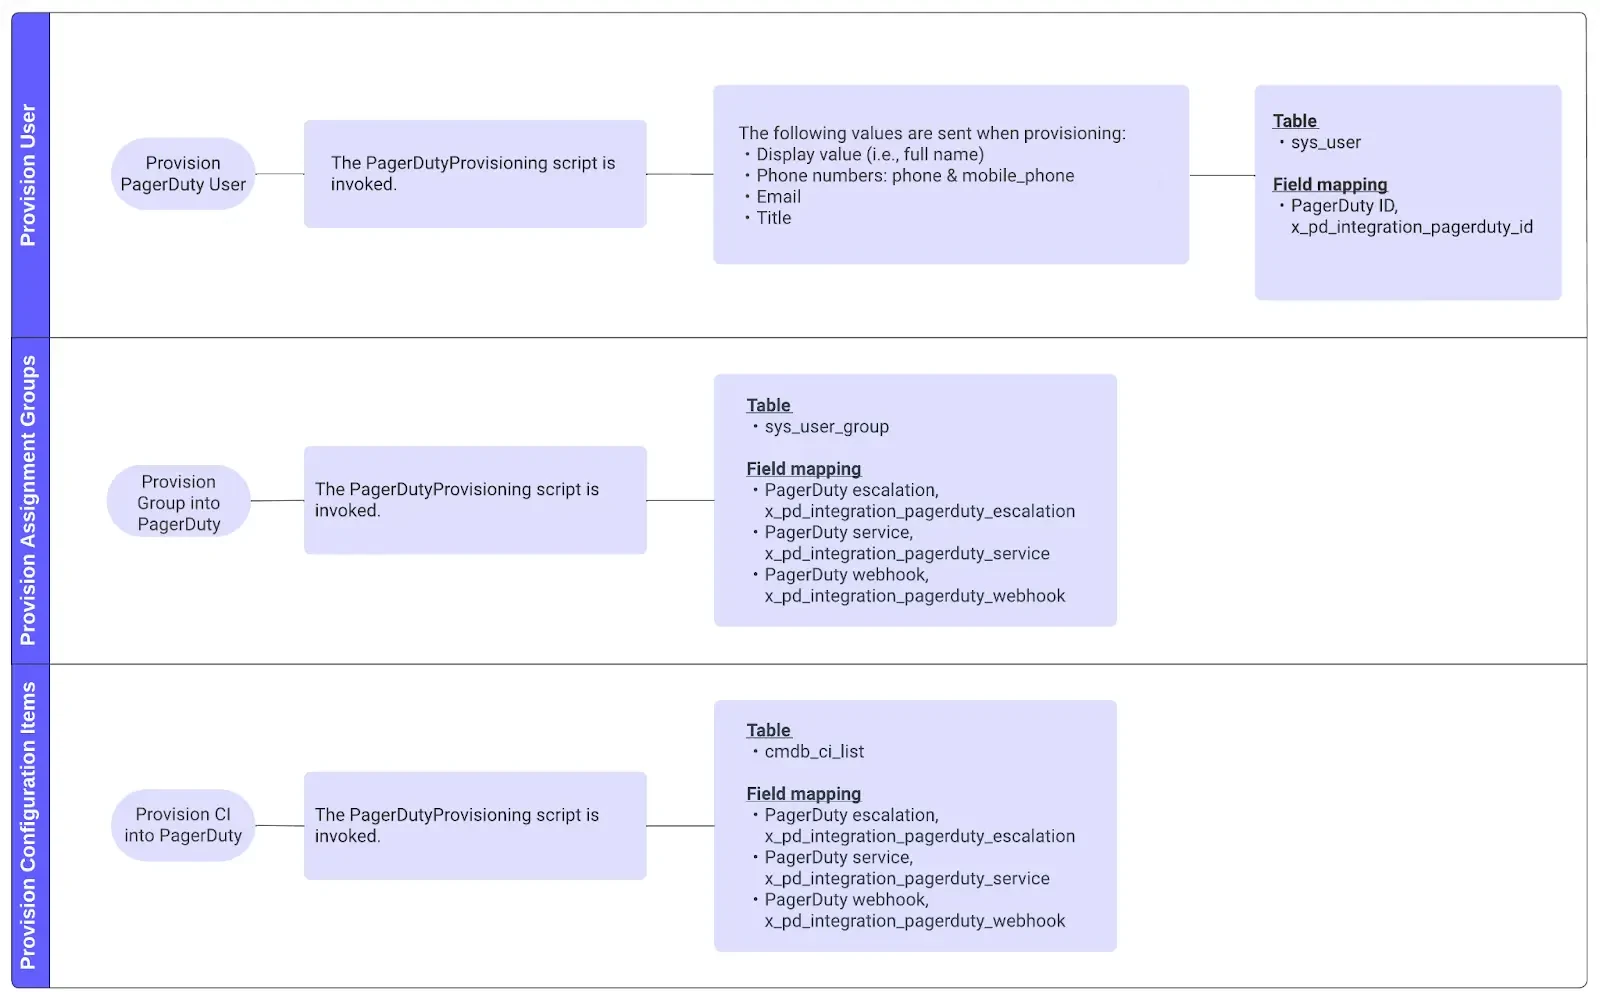 ### How ServiceNow Objects Map to PagerDuty Objects The **Choose ServiceNow to PagerDuty mapping** [setting](/integrations/servicenow-integration-guide/servicenow-integration-details#manage-integration-settings) allows the following two mapping options: - **ServiceNow Configuration Items and Assignment Groups map to PagerDuty** (Recommended) - **Assignment Groups map to PagerDuty** The diagram below represents the correspondence between ServiceNow and PagerDuty. 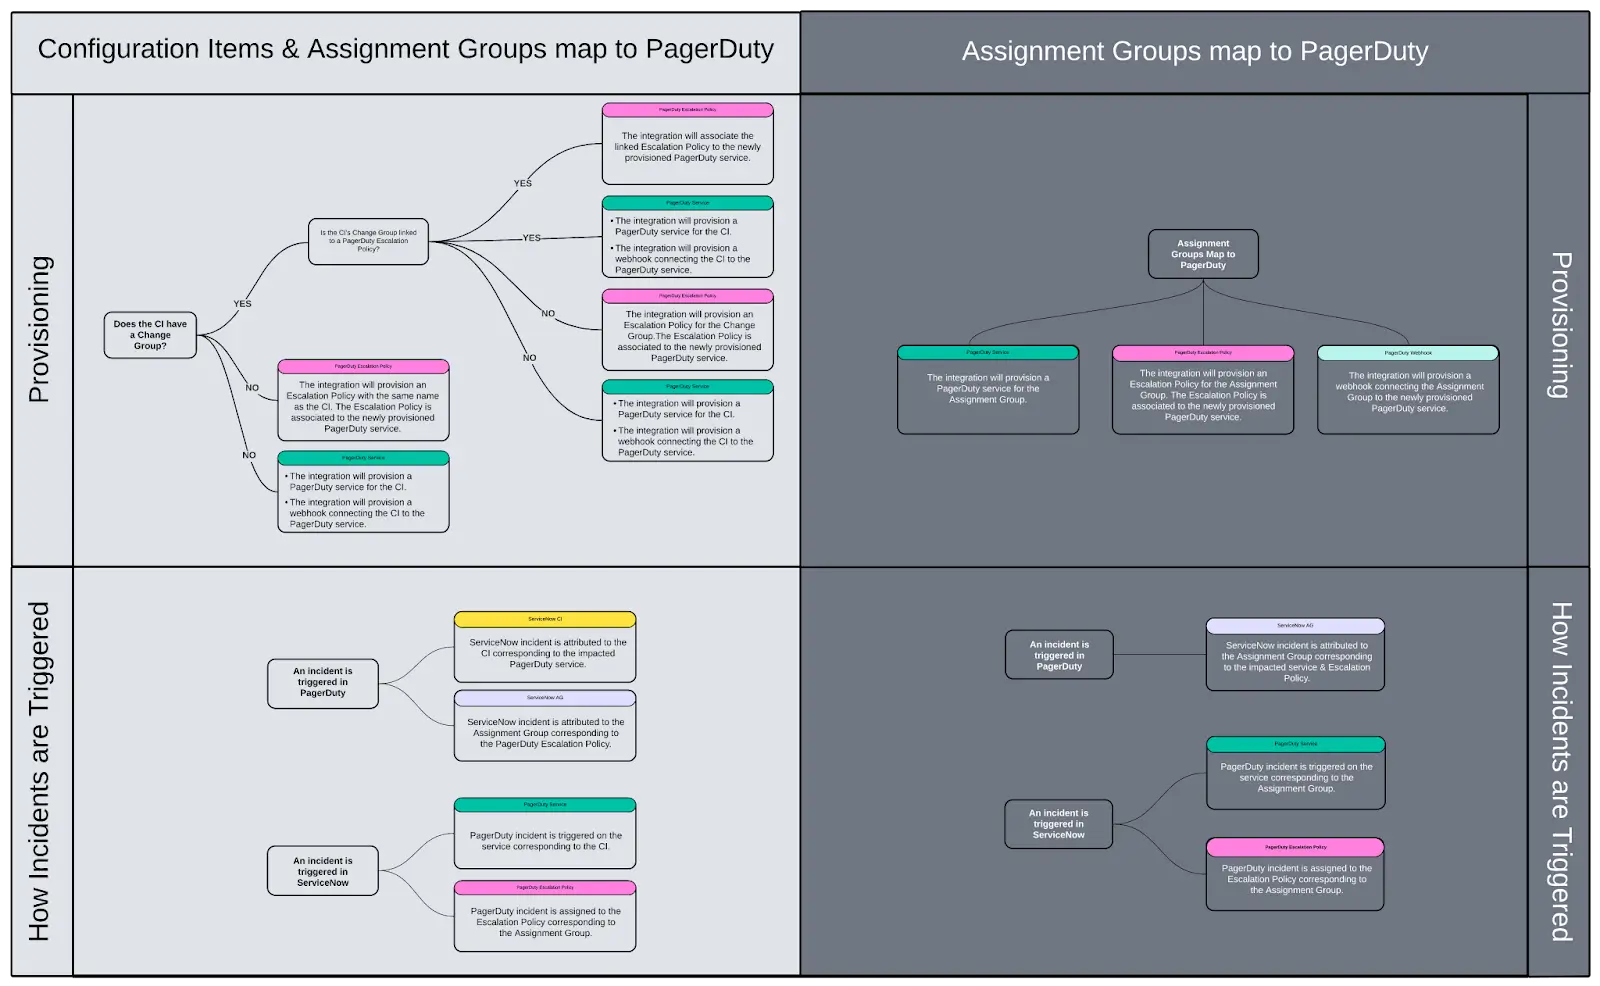 ## Provision Users to PagerDuty 1. In your ServiceNow **Users** list, select a **user** who has not already been provisioned to PagerDuty. 2. Click **Provision PagerDuty User** to add them to your PagerDuty account. 3. You will then see a message that the user is being provisioned. 4. Upon completion, the **PagerDuty ID** field is automatically populated. The user also shows up in PagerDuty, with the same name and email address. 1. If the user has their **Phone** or **Mobile phone** fields populated in ServiceNow, these settings will also be automatically provisioned as [Contact Methods](/account-admin/user-profile#contact-information) and [Notification Rules](/account-admin/user-profile#notification-rules) in PagerDuty. 1. A country code is required for phone numbers. 2. The country code may not parse correctly if the phone number is not in the [E.164](https://en.wikipedia.org/wiki/E.164) format. 2. You can also provision multiple users at once by selecting the **checkboxes** to the left of their names, clicking **Actions on selected rows** and selecting **Provision PagerDuty User** from the dropdown. 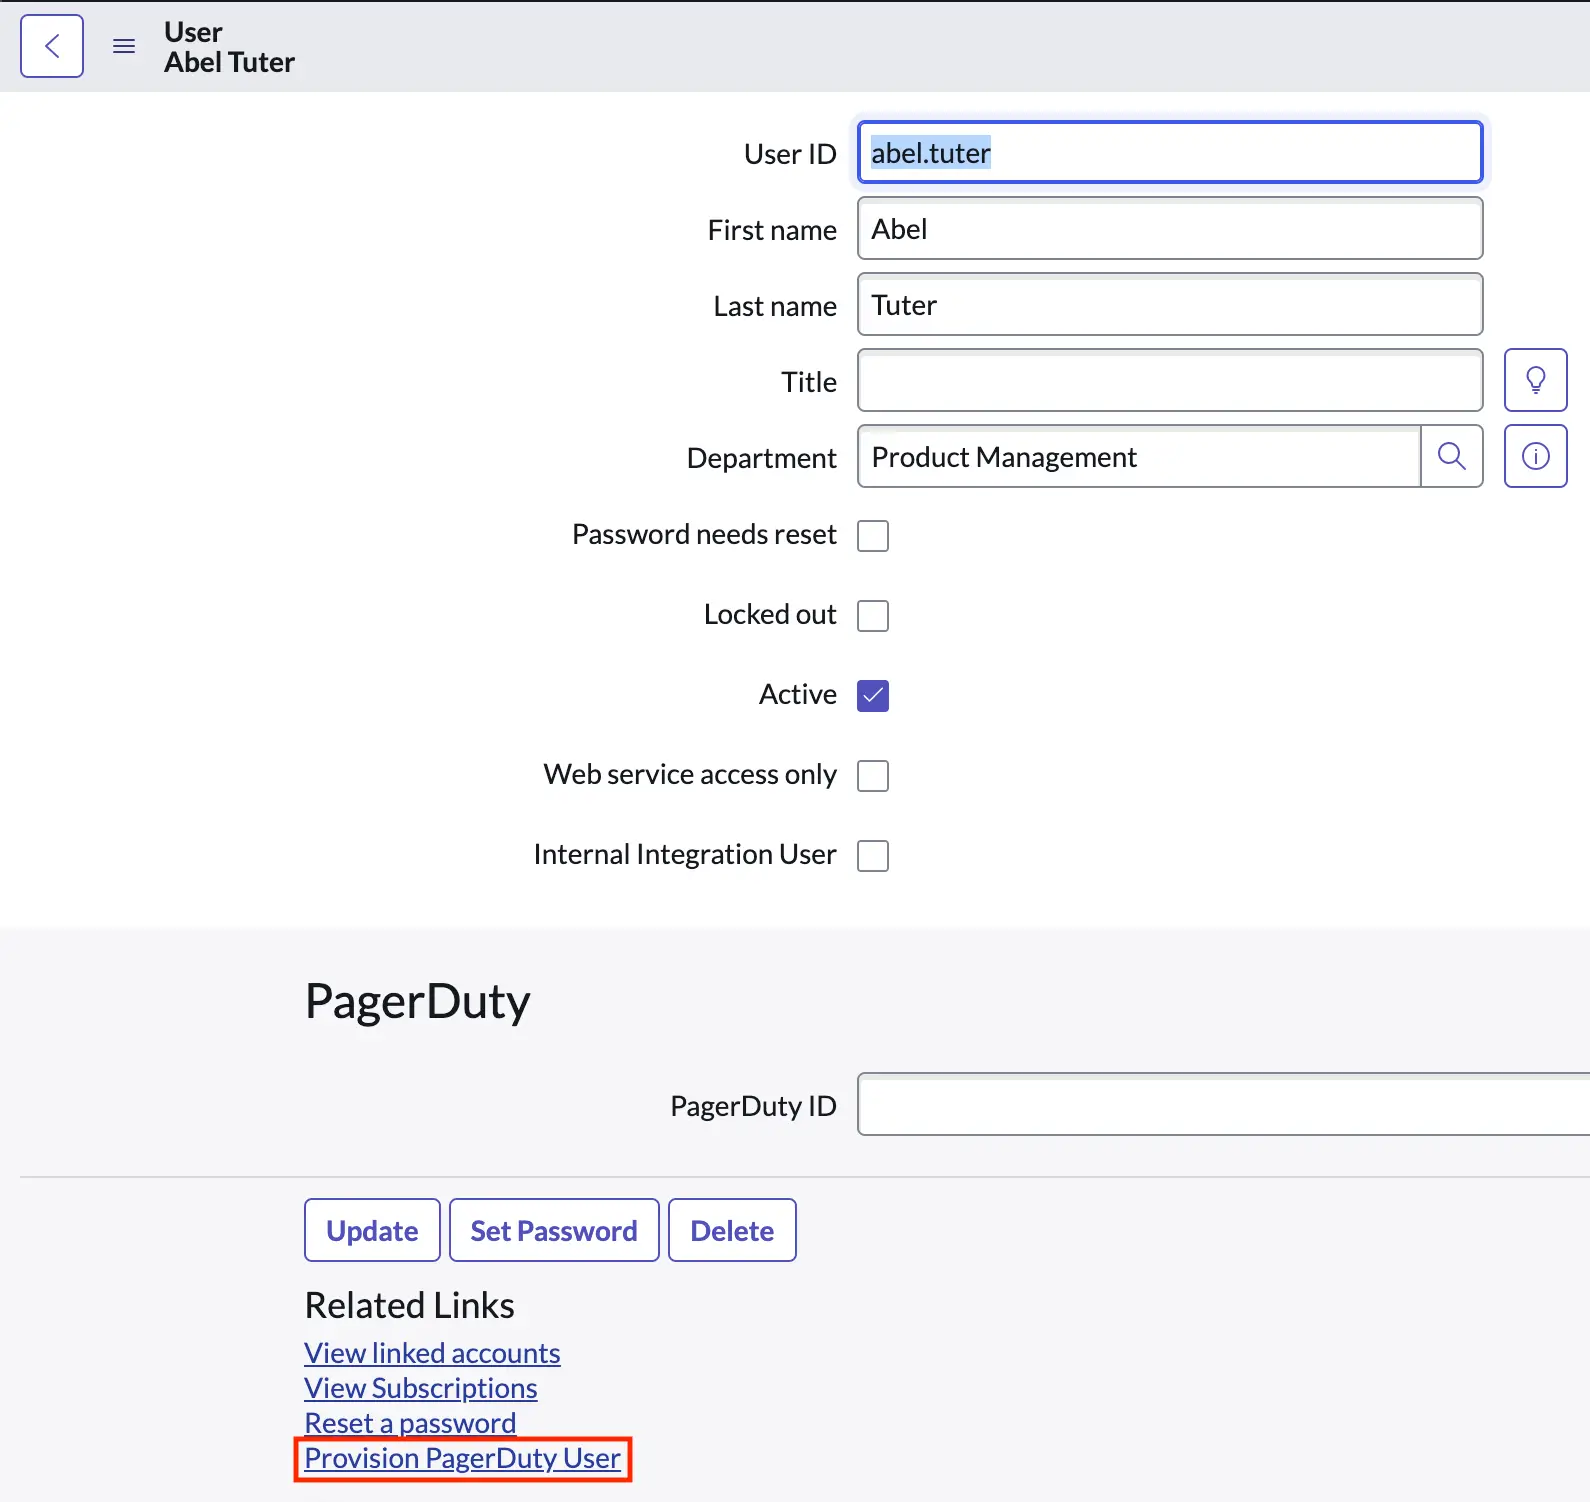 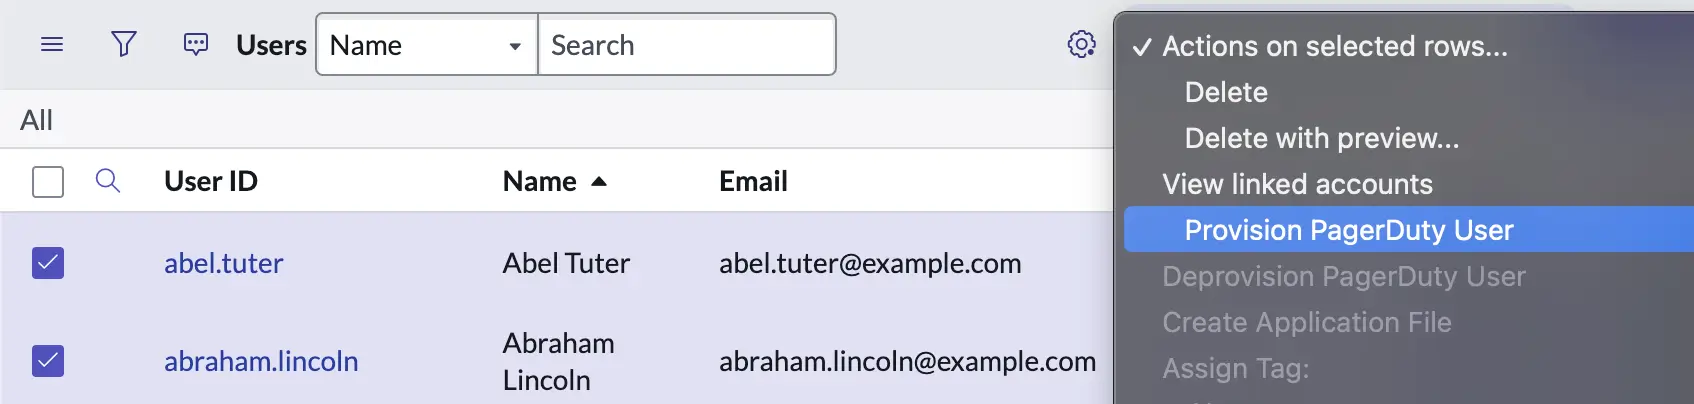 ## Provision Assignment Groups and Configuration Items New Assignment Groups and Configuration Items provisioned to PagerDuty will be connected via v3 webhooks. We strongly recommend that you migrate webhooks to v3 immediately after [upgrading to ServiceNow v8](/integrations/servicenow-integration-guide/servicenow-integration-details#upgrade-to-servicenow-v8), to prevent the application from having a mix of v2 and v3 webhooks. ### Prerequisite: Set Default Incident Sync Option Before provisioning Assignment Groups or Configuration Items to PagerDuty, you can set the default incident sync option in PagerDuty Settings. This setting only applies to how PagerDuty incidents creates ServiceNow incidents. Assignment Groups and Configuration Items that do not have an individual sync option configured will default to the sync option set on the PagerDuty Settings page. 1. Navigate to **PagerDuty Settings** and scroll to the **Webhooks Configuration** section. 2. You may select the incident sync option from the **Sync option** dropdown: - **Auto**: When a PagerDuty incident triggers, it automatically creates a ServiceNow Incident. - **Manual**: When a PagerDuty incident triggers, it will not automatically create a ServiceNow Incident. Instead, you will need to select **More** → **Sync with ServiceNow** on the PagerDuty incident’s details page. ### Provision Individual Configuration Items to PagerDuty 1. In ServiceNow, navigate to `cmdb_ci_list.do` → click on the **Configuration Item** that you want to provision to PagerDuty. 2. Click **Provision CI into PagerDuty**. ### Bulk Provision Configuration Items to PagerDuty 1. In ServiceNow, navigate to `cmdb_ci_list.do` → select the checkboxes to the left of the **Configuration Items** that you want to provision to PagerDuty. 2. Click the **Actions** menu on the top right and select **Provision CI Into PagerDuty**. ### Provision Individual Assignment Groups to PagerDuty 1. In ServiceNow, navigate to `sys_user_group_list.do` → click on the **Assignment Group** that should be provisioned to PagerDuty. 2. Click **Provision Group into PagerDuty**. ### Bulk Provision Assignment Groups to PagerDuty 1. In ServiceNow, navigate to `sys_user_group_list.do` → select the checkboxes to the left of the **Assignment Groups** that you want to provision to PagerDuty. 2. Click the Actions menu on the top right and select **Provision Groups Into PagerDuty**. ### Edit Webhooks Configuration When you provision a webhook, it will inherit the default sync behavior configured on the **PagerDuty Settings** page in ServiceNow (**PagerDuty Settings** → **Webhook Configuration** → **Sync option**). However, you can modify the sync option for your webhooks as necessary: 1. Navigate to **PagerDuty Webhooks**. 2. Select the checkboxes to the left of the **webhooks** that you want to modify. 3. Click the icon to the right of the sync option column, and select **Update Selected**. 1. If you do not see this column, [add **Sync option**](https://www.servicenow.com/docs/bundle/vancouver-platform-user-interface/page/use/using-lists/task/t_PersonalizeAList.html) to the **Selected** fields. 4. Select your preferred **Sync option**, and then click **Update**. ## Provision Configuration Items to PagerDuty with Services Provisioning The Services Provisioning feature allows you to provision Configuration Items as [Business Services](/incident-management/services/business-services) and [technical services](/incident-management/services/services-and-integrations#create-a-service) in PagerDuty, along with their dependencies. You can quickly generate a new PagerDuty service and webhook connection for Configuration Items in ServiceNow. Any Configuration Item that extends the base `cmdb_ci` table can be mapped to PagerDuty. This feature is located in ServiceNow under **PagerDuty** → **Services Provisioning**. > **Tips:** Before provisioning Configuration Items as services in PagerDuty, we recommend the following: > > - Read our [Full Service Ownership Guide](/ops-guides/service-ownership) for best practices in planning your PagerDuty technical and business service relationships. > - Given the [dependency relationships](/incident-management/services/service-profile#service-dependencies-tab) between business and technical services, review how you would like to map Configuration Item relationships, noting the higher-level CMDB classes and lower-level CMDB classes. ### Provisioning Behavior The parent CI(s) will be provisioned as a business service in PagerDuty. Child CIs (downstream dependencies) will be provisioned as [supporting technical services](/incident-management/services/business-services#supporting-services) in PagerDuty. #### CI Contains a Change Group If the CI's Change Group already exists as a PagerDuty escalation policy, the integration will attach the existing escalation policy to the newly created PagerDuty technical service. Otherwise, the integration will provision a new escalation policy for the Change Group, and attach the escalation policy to the newly created PagerDuty technical service. #### CI does not Contain a Change Group The integration will create a PagerDuty escalation policy with the same name as the CI and attach it to the newly created PagerDuty technical service. ### Step 1: Choose Provisioning Method > **Best Practices:** If you have a well-established CMDB, we recommend that you [provision using the CMDB relationship table](#option-1-provision-services-using-a-cmdb-relationship-table). A well-established CMDB has a [defined relationship ](https://www.servicenow.com/docs/bundle/utah-servicenow-platform/page/product/configuration-management/concept/create-dependent-relationship.html)between parent CIs and their associated downstream dependencies. > > If you do not have a defined relationship between the parent CIs and their downstream dependencies (child CIs), you can provision business services and technical services using [custom relationships](#option-2-provision-using-custom-relationships). #### Option 1: Provision Services using a CMDB Relationship Table 1. In ServiceNow, navigate to **PagerDuty** → **Services Provisioning**. 2. In the field **Provision using CMDB relationship table**, select **Yes (default)** from the dropdown. 3. Choose CI classes to be provisioned. If the parent CI(s) have a business service classification (e.g., **CI Class** is **Business Service**), and the downstream CIs have a technical service classification (e.g., **CI Class** is **Technical Service**), select the checkbox **Use service classification where applicable**. > **Tip:** If a CI Class is both a business service and a technical service, then the CI will be provisioned as both a business and technical service, with the business service having a dependency on the technical service. Other CI classes will need to manually classified as a business service or technical service, following the process below: - Click **Select CI Classes which will be provisioned as Business Service**, select your desired **CI Class** from the list, and click to move the CI into the column **Business Services**. - Click **Select CI Classes which will be provisioned as Technical Service**, select your desired **CI Class** from the list, and click to move the CI into the column **Technical Services**. 4. Choose Table with CIs or a single CI to be provisioned along with dependencies. **Option A: Choose Table with CIs** You can use this option if: - You want to provision multiple parent CIs as a business service, and their downstream dependencies as technical services. - There is a single CI table containing those parent CIs. 1. For the field **Select table containing services**, click the search icon. 2. A pop-up window will appear on your screen. In the pop-up window, search and select the CI table containing the parent CIs that you want to provision as PagerDuty business services. This will retrieve all of the CIs from the selected CI table, along with their dependencies. For example, selecting `cmdb_ci_datacenter` will fetch all of the CIs in the data center table along with its dependencies. 3. After the CIs have been fetched, you can create a filter to exclude the CIs that you do not want to provision as business services in PagerDuty. Click **Open selected table to set and save filter**. 4. Filter out the CIs that you do not want to provision as business services in PagerDuty. Save this filter for use in future steps. 5. For the field **Select filter**, click the search icon. 6. A pop-up window will appear. In the pop-up window, find and select the filter you created in step 4 above. 7. **Select Column for Service Name**: select the table column which will define the service name in PagerDuty. The Name column is set by default, but you may change it to a different column if required. 8. Click **Save Configuration**. **Option B: Choose a Single CI** Alternatively, you can use this option if: - There is only one parent CI that you want to provision as a business service in PagerDuty. - The parent CI contains downstream dependencies that you want to provision as technical services in PagerDuty. 1. Select the checkbox next to **Provisioning a single CI along with its dependencies**. 2. Find and select your CI, then click **Save Configuration**. #### Option 2: Provision Using Custom Relationships > **Tip:** If you do not have a [defined relationship](https://www.servicenow.com/docs/bundle/utah-servicenow-platform/page/product/configuration-management/concept/create-dependent-relationship.html) between the parent CIs and their downstream dependencies (child CIs), you can use this method to define the service relationship you want to provision in PagerDuty. 1. In ServiceNow, Navigate to **PagerDuty** → **Services Provisioning**. 2. In the field **Provision using CMDB relationship table**, select **No (Custom Relationships)** from the dropdown. 3. For field **Select CI Table containing services**, click the search button. 4. In the pop-up window that appears, find and select the table containing the parent CIs that you want to provision as a business service. This will retrieve all of the CIs from the selected CI table, along with their dependencies. 5. Click **Open selected table to set and save filter**. In the pop-up window that appears, create a filter to exclude all of the other CIs that you do not want to provision as business services in PagerDuty. Save this filter for use in the next step. 6. For the field **Select filter**, click the search icon. In the pop-up window that appears, find and select the filter you created in the previous step. 7. Configure the following fields: | Field | Instructions | | :--------------------------------------------------------- | :------------------------------------------------------------------------------------------------------------------------------------------------------------------------ | | **Select the type of service to be provisioned** | Select **Business Service**. | | **Select column for service name** | Select the table column which will define the service's name in PagerDuty. The **Name** column is set by default, though you may change it to another column if required. | | **Select relationship between services to be provisioned** | Select **consumes**. | | **Select CI table containing services** | Select the CI table containing the child CIs (downstream dependencies) that you want to provision as technical services in PagerDuty. | 8. Create a filter and apply it to the Child CIs table. 1. Click **Open selected table to set and save filter**. 2. In the pop-up window that appears, create a filter to exclude the Child CIs that you do not want to provision as technical services in PagerDuty. 3. Save the filter for use in the next step. 9. Select the filter you created in the previous step. 10. Below your filter in the field **Select the type of service to be provisioned**, select **Technical Service**. 11. Click **Save Configuration**. ### Step 2: View Services Navigate to the PagerDuty Service Provisionings table (**PagerDuty** → **Services Provisioning Table**) to review the parent CI(s) and downstream dependencies that will be provisioned to PagerDuty. > **Carefully review the table information before provisioning services.:** Review the information in the table: - Check the **Validation warnings** column for errors. - Update the parent type on any records that do not show the correct type for the parent CI. - Change the child type on any records that do not show the correct type for the child CI. - Delete any parent CIs and/or dependencies that you do not want to provision into PagerDuty. - Delete any obsolete or invalid rows that are not provisioned (e.g., Relationship provisioned = `False`). ### Step 3: Provision Services After reviewing the Services Provisioning table, click **Provision Services**. If there are any errors while provisioning, they will be captured in the **Provisioning errors** column of the Services Provisioning table (`x_pd_integration_pagerduty_service_provisioning_list.do`). Fix any errors, then click **Revalidate Services** to confirm that the errors have been resolved. Then click **Provision Services** again. --- URL: https://docs.pagerduty.com/integrations/servicenow-integration-guide/servicenow-troubleshooting-guide # ServiceNow Troubleshooting Guide Identifying and resolving common issues with the ServiceNow integration Troubleshoot common issues and get answers to frequently asked questions about the [ServiceNow v8](/integrations/servicenow-integration-guide) integration. > **Looking for a Different Version?:** The [Troubleshooting Guide](/integrations/servicenow-troubleshooting-guide-v7) and [FAQs](/integrations/servicenow-v7-faq) for the v7 integration are also available. ## Troubleshooting Walkthrough If you are experiencing issues integrating ServiceNow with PagerDuty, the interactive guide below can walk you through some of the most common misconfiguration issues. This guide shows you how to: - Use the [Integration Health Check](#integration-health-check) and [Webhook Health Check](#webhook-health-check). - Set the [correct permissions](/integrations/servicenow-integration-guide#11-servicenow-application-access-controls) for the required tables. - Generate and add your [PagerDuty API Key](/integrations/servicenow-integration-guide#21-create-a-pagerduty-api-access-key) to ServiceNow. - Create a [default user](/integrations/servicenow-integration-guide#22-create-a-default-pagerduty-user-account-for-servicenow) in PagerDuty and in ServiceNow for certain integration actions. - Check your [mapping options](/integrations/servicenow-integration-guide/servicenow-provisioning#how-servicenow-objects-map-to-pagerduty-objects) in ServiceNow. - Check the [PagerDuty Logs](#enable-pagerduty-logs) in ServiceNow. - Configure [Inbound Field Rules](#inbound-field-rules). ## Installation and Configuration ### PagerDuty App Does Not Appear in the System Menu If you cannot find the PagerDuty app in ServiceNow’s system menu, please check the following first: 1. If you recently installed the app, try a hard refresh in your browser, or log out/in again, as the system menu may need to reload after installation. 2. Make sure the PagerDuty app has been added to your current instance from the [ServiceNow store](https://store.servicenow.com/sn_appstore_store.do#!/store/application/39a9d9664f834e00dd657bb28110c77b). 3. Install the app to your current instance by going to **System Applications** → **Applications Downloads** tab. If you’ve completed the steps above and are still unable to see the PagerDuty app, check to see if you have any plugins that could prevent the installation from succeeding. For example, plugins that encrypt attachments in ServiceNow can prevent the installation from completing, even if it appears to have been installed successfully. If you identify such a plugin, please try deactivating it and attempting installation again. ### Installation and Configuration FAQs **How can I tell which version of the app I have installed?** 1. Navigate to **System Applications** → **All Available Applications** → **All**. 2. Search for **PagerDuty** and then click the **Version** dropdown on the right to see the installed version. **How many accounts/instances can be connected?** This integration supports integrating a single PagerDuty instance with multiple ServiceNow instances. However, you cannot integrate multiple PagerDuty instances with a single ServiceNow instance. **Which configuration files are relevant to the integration?** Please see the configuration files below: - Business Rules - Script Actions - Script Includes - UI Actions - Processors - UI Pages - UI Scripts - Macros - Application Files **Who should I reach out to if I have any questions about upgrading/installing/configuring the integration?** Our Support team can assist you with basic troubleshooting of some common issues that may occur during the installation process. However, Support cannot help you plan or implement any upgrades. Our Professional Services team offers the ServiceNow Application Upgrade Accelerator. To see if this service matches your needs, please [contact the PagerDuty Sales team](https://www.pagerduty.com/contact-us/). ## Integration Health Check ### Cross-scope Access Policy Error During Webhook Async Processing Mode Setup If you receive an error during the **Setup webhook async processing mode** step, the workaround is to: 1. Search on the menu for **Scripts - Background**. 2. Select scope **Global**. 3. Run the following script code: `gs.invalidateCache();` 4. Re-run the Integration Health Check (Select **All** and search and select **Integration Health Check**. It will run automatically). ### Integration Health Check FAQs **What issues are detected by the integration health check?** The Integration Health Check now consolidates and runs the following tests: **Test REST API Connection**, **Test ServiceNow User Authentication**, and **Test Default User Settings**. You can learn more about these individual tests in our [ServiceNow Integration Details](/integrations/servicenow-integration-guide/servicenow-integration-details#integration-health-check) article. ## Webhook Health Check ### Common Issues Detected by the Webhook Health Check | Message | Code | Validation | Stops validation? | Action type | | --- | --- | --- | --- | --- | | PagerDuty Service that is linked to ServiceNow Entity doesn’t exist | `service_invalid` | If PagerDuty Service ID is valid (exists on PagerDuty) | Yes | 🔴 Manual intervention | | ServiceNow Entity linked to a PagerDuty Service has an incorrect Webhook ID | `webhook_missing` | Webhook is missing and can be created or updated with existing Service webhook | Yes | 🟡Additional review | | ServiceNow Entity linked to a PagerDuty Service has an incorrect Webhook ID. There are multiple Webhooks already created | `webhook_invalid_multiple` | Invalid webhook (missing or mismatched) and there are more than one webhook candidates at the Service | Yes | 🔴 Manual intervention | | ServiceNow Entity linked to a PagerDuty Service has a mismatched Webhook ID | `webhook_service_mismatch` | Webhook doesn’t match the ServiceNow Entity Service ID | Yes | 🟢 Auto remediation | | ServiceNow Entity linked to a PagerDuty Service has a mismatched Webhook ID. There are multiple Webhooks already created | `webhook_service_mismatch_multiple` | Webhook doesn’t match the ServiceNow Entity Service ID and there are multiple Webhooks created | Yes | 🔴 Manual intervention | | Webhook duplicated for a Service linked to a ServiceNow Entity | `webhook_duplicated` | If more than one Webhook | No | 🟡Additional review | | Webhook configuration (sync_mode & task_type) params do not match with ServiceNow entity configuration | `webhook_config_mismatch` | If Webhook ServiceNow configuration params (sync_mode, task_type) match
OR
If Webhook (V3) is properly configured for sync_mode (triggered event) | No | 🟢 Auto remediation | | Webhook is temporarily disabled | `webhook_disabled` | If Webhook is temporarily disabled (delivery failure) | No | 🟢 Auto remediation | | Webhook is not associated with any ServiceNow Entity | `webhook_not_associated` | If Webhook is associated with ServiceNow entity
Note: At least one is expected for the default service `x_pd_integration.default_service` | No | 🟡Additional review | | Webhook(s) supported events are disabled in PagerDuty | `webhook_events_disabled` | Validation to check disable events in PagerDuty that are supported in ServiceNow and use auto remediation to enable them. | No | 🟢 Auto remediation | ### Webhook Health Check FAQs **Which Webhook Health Check run is being referenced in the results?** The Webhook Health Check results are from the last run. ## Enable PagerDuty Logs To get the most detailed insight into script behavior, in ServiceNow go to **PagerDuty Configuration** → **PagerDuty Settings** and set **Logging verbosity level** to **debug**. With this setting selected, each call to `gs.debug`, `gs.info`, `gs.warn`, or `gs.error` in the script source will show up in the application-scope logs, which can be viewed under **PagerDuty ** → **Support** → **Logs**. ## Provisioning ### When Assignment Group or Configuration Item Provisioning Fails - Confirm that the object’s name does not conflict with an existing service or escalation policy in PagerDuty. - Check that your PagerDuty account has user licenses available if there are new users being provisioned. ### Provisioning FAQs **Are ServiceNow objects and PagerDuty objects mapped 1:1?** The ServiceNow integration provides 1:1 mapping out-of-the-box. **Escalation**: - When a PagerDuty incident opens a ServiceNow Incident via webhook, the integration uses the Assignment Group’s **PagerDuty default escalation** field. - We do not recommend associating multiple ServiceNow groups with the same escalation policy. If there is more than one assignment group with the same escalation policy ID, the ServiceNow incident is assigned to the first assignment group whose `x_pd_integration_pagerduty_escalation` column value matches the escalation policy ID in the webhook **Service**: When a ServiceNow Incident triggers a PagerDuty incident: - With the **Assignment Groups map to PagerDuty** setting enabled: The Assignment Group’s **Service** field is used to tell PagerDuty which service to trigger it on. - With the **Configuration Items and Assignment Groups map to PagerDuty** setting enabled: The service is fetched/mapped from the Configuration Item. ServiceNow Incidents can only trigger PagerDuty incidents on one service, i.e., the service whose ID is stored in the Assignment Group's **PagerDuty Service** field. **What is the difference between provisioned versus linked?** The term **provisioned** refers to when an item in ServiceNow has an analogous record in PagerDuty, identified by one or more metadata fields (referred to as the **integration fields**). A ServiceNow Incident is considered **linked** if it is associated with a PagerDuty incident. In which case its status, work notes, and other information pertaining to the incident can be synchronized between systems. ## Data from PagerDuty to ServiceNow ### PagerDuty Incidents are Not Creating/Updating Tickets in ServiceNow #### Run the Integration Health Check To run the Integration Health Check in ServiceNow, select **All** and search and select **Integration Health Check**. The health check will run automatically, and once it is complete, the results will be displayed on this page. - We recommend running the Integration Health Check during the [initial configuration](/integrations/servicenow-integration-guide) of the PagerDuty app in ServiceNow, and also when [upgrading the app to v8](/integrations/servicenow-integration-guide/servicenow-integration-details#upgrade-to-servicenow-v8). #### Run the Webhooks Health Check Select **All** and search and select **Webhooks Health Check**. Click **Run health check** or **Re-run health check** to identify if there are any inconsistencies which may be causing this behavior. #### Check if the Webhook Created a Webhook Import Row Record In ServiceNow, select **All** and search and select **Webhook Import Rows**. Look for records with a creation time that coincides with when the PagerDuty incident was triggered, acknowledged or resolved. #### Check Requirements and Restrictions in your ServiceNow Instance 1. **Check to see if there are any required fields in the ServiceNow incident form that aren’t auto-populated via Inbound Field Rules**: If you can see that webhooks are getting through from PagerDuty to ServiceNow, but are not creating or updating an incident, try manually closing an incident in ServiceNow. If manually closing an incident requires you to enter values for certain fields, your required fields have likely been customized. [Create inbound field rules](/integrations/servicenow-integration-guide/advanced-servicenow-configuration#inbound-field-rules) so that required fields have a default value. 2. **Check for interfering state values**: Check to see if you have any custom choices set up for the **State** field in the ServiceNow Incidents model: 1. Right-click on the **State** field’s label (e.g., **New** or **Resolved**). 2. Select **Configure Dictionary**. 3. Switch to **Advanced view**. 4. Select the **Choices** tab and look for entries with higher numbers in the **Value** field. The integration follows the same convention as ServiceNow’s out-of-box state values. Higher numbers imply a more advanced state (i.e., 6 or higher represents done, resolved, or some variant). If the state of the incident that did not automatically resolve is a higher numeric value, but the incident did not resolve, it is because it was treated as already resolved. To correct this, you may need to modify custom choice values for the **State** field to be lower than 6, so that they are treated as an unresolved state. 3. **Check for customizations**: - Check for customizations to the configuration files. > **Warning:** Please note that any customizations which alter the integration’s out-of-the-box behavior are not supported by the PagerDuty Support Team. - Are there any modifications or customizations to the fields on the incident form? 4. **Check for interfering data policies**: Data policies allow ServiceNow administrators to create validation rules on tables. These data policies can stop the webhook import process from committing PagerDuty changes to the ServiceNow Incident record, and thus prevent the integration from automatically resolving incidents. This behavior is not captured in the **application-scope logs**. There will, however, be an error-level log entry in the **system logs** created at the time of the webhook import, with a message beginning with `Data Policy Exception`. Inbound field rules give you the ability to automatically fill incident fields, and this can be used to fill fields as needed in order to satisfy data policies. To address this: 1. Navigate to **System Policy Rules** → **Data Policies**. 2. In the list view, create a new filter on the **Table** field: `=incident`. 3. Make note of all the fields and constraints. 4. Go to **PagerDuty Configuration** → **PagerDuty Inbound Field Rules**. 5. For each incident field that was part of the data policy’s conditions: 1. Create a new inbound field rule. 2. Set the webhook type to **Acknowledge** or **Resolve**, based on which action is experiencing an issue. 3. Enter a default value for the field, or one dynamically based on the webhook payload. For more information, please see [Inbound Field Rules](/integrations/servicenow-integration-guide/advanced-servicenow-configuration#inbound-field-rules). #### Check Requirements and Restrictions in Your PagerDuty Instance 1. **Check that Assignment Groups match the Escalation Policy**: - If a ServiceNow Incident isn’t updating after changes happen on the corresponding PagerDuty incident, make sure the relevant PagerDuty escalation policy has a corresponding Assignment Group in ServiceNow. - Ensure that the appropriate assignment group has its **PagerDuty default escalation** field set to the escalation policy’s ID (for example, `PXXXXXX`). - You may need to [add](/integrations/servicenow-integration-guide#13-add-pagerduty-fields-to-views-optional) the PagerDuty fields to the group form or list view to review their values. ### Duplicate Incidents Triggered in ServiceNow - [Coalesce](https://developer.servicenow.com/dev.do#!/learn/learning-plans/xanadu/servicenow_administrator/app_store_learnv2_importingdata_xanadu_coalescing) was not set to `true`, meaning that any webhook originating from the same PagerDuty incident isn’t getting de-duplicated, and as a result, it’s creating new ServiceNow Incidents. - You may see this behavior if the import transform map is not set to coalesce on the incident ID. Verify that coalescing on the incident ID is enabled in the import transform map: - In ServiceNow, go to **PagerDuty Import Rows** → **Webhook Import Service**. b. At the bottom of the page, select **PagerDuty Webhook Import** under **Web Service Transform Maps**. - At the bottom of this page, find the section **Field Maps**. - In the mapping for `id` `x_pd_integration_incident`, ensure that **Coalesce** is set to `true`. - There may be instances where coalescing is true, but duplication is still occurring. Thus, we recommend trying to index the **PagerDuty Incident ID** field in the ServiceNow incident table `incident.x_pd_integration_incident`, so that coalescing on that column is more efficient. ### PagerDuty Webhooks are Generating a `401` Error A `401` server error indicates that the accessing user is unauthorized. If you use IP safelisting, make sure you have safelisted PagerDuty’s IPs in your production environment. You can use a tool such as Postman to test remote access. Please read our developer documentation [Webhook IPs](/developer/webhook-ips) for more information about the IP addresses PagerDuty uses to send webhooks. ## Data From ServiceNow to PagerDuty ### ServiceNow Incidents and Updates do not Appear in PagerDuty 1. In ServiceNow, select **All** and search and select **Integration Health Check** to run the health check. 2. Check the **Default user ID** on the **PagerDuty Settings** page in ServiceNow: 1. The **Default user ID** configuration property in the ServiceNow app needs to be a PagerDuty user ID. 2. The PagerDuty user associated with this ID must be [linked](/integrations/servicenow-integration-guide#31-create-a-servicenow-user-account-for-webhook-authentication) to a ServiceNow user. 3. Their login email address in PagerDuty must match their email address in ServiceNow. ### ServiceNow Sends Too Many Incident Emails or Work Note Updates We’ve seen cases where ServiceNow sends hundreds, or even thousands of emails or work note updates on an incident. This is usually due to a feedback loop caused by ServiceNow custom business rules or automation. Webhooks can also inadvertently create a feedback loop between ServiceNow and PagerDuty. This can happen if there are any business rules or other automated processes that alter the Assignment Group of the ServiceNow incident, and caution is not exercised when manually setting the integration fields. To give a high-level example of how this can possibly happen, let us assume the following configuration: - There is a business rule that automatically changes the Assignment Group to **B** if it is placed into Assignment Group **A**. - Both Assignment Group **A** and **B** are tied to PagerDuty escalation policy **Z**. A feedback loop occurs in the following scenario: 1. Incident changes the Assignment Group to, or is created in, **B**. 2. A PagerDuty incident triggers and is assigned to escalation policy **Z**. 3. A webhook fires and escalation restarts (webhook type `incident.delegate` or `incident.trigger`). 4. Webhook import in ServiceNow assigns incident to assignment group **A**. 5. Automation changes assignment to **B**. 6. The loop repeats. If your configuration matches or is similar to the scenario described above, you’ll need to make adjustments so that the loop is broken. ### ServiceNow Creates Duplicate PagerDuty Incidents Assuming that there have been no customizations to the out-of-box PagerDuty integration, the most likely cause is automation. I.e., a separate business rule that is triggering a second automatic update on the incident record after the initial one. The business rule **PD Trigger PagerDuty Incident** runs with order = 100, meaning that it runs _after_ changes are committed to the database. If two updates happen asynchronously in rapid succession, they risk triggering the business rule that creates a PagerDuty incident twice. To resolve this, first you will need to find out how the secondary updates take place: 1. In ServiceNow, go to **System Logs Events**. 2. Find events named `x_pd_integration.trigger_incident` around the time duplicate incidents triggered. 3. Note the values of: 1. `param1`, the last work notes entry. 2. `param2`, a comma-delimited list of extra parameters: current user `sys_id`, the operation (insert or update), and a boolean for whether the value of the Assignment Group or Configuration Item changed. 3. User ID 4. User name 4. Identify the event that was raised by the automated process based on how the event was submitted, vis-à-vis the available attributes. 5. Find some attributes of the automated update operation that can be used to distinguish it from others, e.g., if it was made by a human. 6. Add conditions to the business rule **PD Trigger PagerDuty Incident** that exclude updates which have the distinguishing characteristics of the automated updates. ### Data from ServiceNow to PagerDuty FAQs **When is an incident sent to PagerDuty?** By default, the **PagerDuty application** triggers a PagerDuty incident when two conditions are met: - [The service and escalation policy used for handling the incident can be determined](/integrations/servicenow-integration-guide/servicenow-integration-details#how-servicenow-interacts-with-pagerduty-incidents). - The incident’s priority is P1 or P2. By default, the priorities **1 - Critical** and **2 - High** will be selected. If you wish to trigger PagerDuty incidents for other priorities as well, you can adjust these conditions in ServiceNow under **Configuration Files** → **Business Rule** → **PD Incident Trigger** business rule. If you edit the priorities that trigger PagerDuty incidents, be sure to make the same adjustment to the priority conditions in _both_ the **PD Incident Set Waiting** and **PD Incident Trigger** business rules, as well as any other business rules you may have that check priority values before triggering a PagerDuty incident. ## Business Rules For more information about ServiceNow business rules, we recommend the following ServiceNow resources: - [Business Rules](https://developer.servicenow.com/dev.do#!/learn/courses/sandiego/app_store_learnv2_scripting_sandiego_scripting_in_servicenow/app_store_learnv2_scripting_sandiego_server_side_scripting/app_store_learnv2_scripting_sandiego_business_rules) (Developer Documentation) - [Business Rules](https://docs.servicenow.com/bundle/paris-application-development/page/script/business-rules/concept/c_BusinessRules.html) (Product Documentation) ## Custom Fields ### Custom Fields FAQs **How do I create a new mapping if the “Custom Field limit in PagerDuty has been reached”?** Since you have reached the amount of custom fields available in your PagerDuty pricing plan, you will need to delete an existing PagerDuty Custom Field in order to free up a new creation. The mapping experience today provisions a new PagerDuty Custom Field based on the ServiceNow Incident record field chosen. **Why can’t I edit the newly created PagerDuty Custom Field in ServiceNow after mapping?** To ensure configuration consistency, we are enforcing that fields involved in a mapping should only be editable inside its original system (i.e., within PagerDuty or ServiceNow). Please see our [Custom Fields](/incident-management/incidents/custom-fields-on-incidents#configure-custom-fields) article for more information on how to edit an existing PagerDuty Custom Field. **Why can’t I edit the PagerDuty Custom Fields options for the Single Select data type when it is mapped to ServiceNow?** For the Single Select and Multiple Select data type, we are enforcing that the ServiceNow Incident field is the source of truth for the options. Option edits and deletions in ServiceNow will be immediately reflected in the PagerDuty UI. Newly added options in ServiceNow will also sync back to PagerDuty until the maximum number of options for the PagerDuty Custom Field is reached. However, if a ServiceNow field has more options available than PagerDuty’s, options beyond that PagerDuty limit will not sync to the PagerDuty UI and the last selected option will be displayed instead. **Can an admin disable or temporarily pause custom field syncing?** At this time, we do not have any features that would allow admins to temporarily pause custom field syncing. **Are duplicate custom field mappings allowed?** Field mappings are one-to-one, i.e., a ServiceNow field can only be mapped to one Custom Field and a Custom Field can only be mapped to one ServiceNow field. Once a field has been mapped, it will not appear as an option when creating a new mapping. **Can the integration be modified to only sync data in one direction?** At this time, we do not have any features which would allow users to modify the bi-directional sync. **What is the expected behavior if multiple ServiceNow tickets are linked to the incident?** If there are multiple ServiceNow tickets linked to one PagerDuty incident, the custom field value should remain synced with the value of the more recent record. ## Inbound Field Rules ### Inbound Field Rules not Filling Target Fields with Desired Values #### Check the Inbound Field Rule Configuration 1. In ServiceNow, go to **PagerDuty Configuration** → **PagerDuty Inbound Field Rules** and verify the following: 1. For the inbound field rule in question, **Active** is `true`. 2. The **PagerDuty webhook type** is the [expected type](/integrations/webhooks#supported-resources-and-event-types). #### A Business Rule or Process is Overwriting Field Changes A business rule or some other process is overwriting the changes to the field after it is initially set by the field rule. You can review the business rules in ServiceNow and look for any rules that modify the field by following the steps below: 1. Navigate to **System Definition** → **Business Rules**. 2. Add the column **Set field values** in the list view. 3. Filter by table: `=incident`. 4. Filter out all rows where **Set field values** is blank. 5. If there is more than one page of results, search for all records where **Set field values** contains the field you are troubleshooting, e.g., `*business_service`. If any results modify this field, it may explain why the field is not getting set according to the inbound field rule; check that the business rule is not overwriting the field. 6. If nothing turns up, look at all business rules that run a script and check whether any scripts set the value of the field in question. #### New v3 Webhook Payload The ServiceNow v8 integration uses our [v3 webhooks](/developer/webhooks-overview), which have a slightly different payload than the v2 webhooks used in older versions of the integration. If your issue began after upgrading to v8, check if your [inbound field rule](/integrations/servicenow-integration-guide/advanced-servicenow-configuration#update-inbound-field-rules-to-reference-the-v3-webhook-payload) is referencing a payload field that should be updated in order to reference the new v3 webhook [payload](/integrations/webhooks#payload). ## Requesting Assistance from PagerDuty Support Because the logic and configuration of the PagerDuty-ServiceNow integration lives almost entirely within ServiceNow, relevant files will need to be provided from your ServiceNow instance when reaching out to PagerDuty Support for assistance with issues encountered within the PagerDuty-ServiceNow integration. ### Download PagerDuty Configuration Files PagerDuty Support will need your PagerDuty integration configuration files in order to assist you with the ServiceNow integration. To download the PagerDuty integration configuration files in version v8.2 or higher: 1. In ServiceNow, navigate to the **PagerDuty** application menu, then select the **Download PagerDuty Configuration Files & Incident History** module from the **Support** section. 2. Click **Download Integration Config Files** to download the .zip folder containing the PagerDuty integration config files. The following files will be included within the .zip folder: - PagerDuty integration Business Rules and Script Include - PagerDuty integration health check results - PagerDuty integration priority mappings - PagerDuty inbound field rules - Assignment Groups & Configuration Items mapped to PagerDuty - Incident state choice values - PagerDuty settings and corresponding values from the **PagerDuty Settings** page in ServiceNow ### Download Incident History List PagerDuty Support will need your incident history list in order to assist you in troubleshooting issues with the ServiceNow integration. To download the incident history list for an incident experiencing issues in version v8.2 or higher: 1. In ServiceNow, navigate to the **PagerDuty** application menu, then select the **Download PagerDuty Configuration Files & Incident History** module from the **Support** section. 2. Input an incident number (example: INC0010006). 3. Click **Download Incident History**. This will download the incident history list as a PDF, with the history records in descending order. ### Export PagerDuty Logs To assist you with an issue, PagerDuty Support will typically need to see logging specific to the PagerDuty application. When possible, [enable _debug_ verbosity logging](/integrations/servicenow-integration-guide/servicenow-troubleshooting-guide#enable-pagerduty-logs) for the app, then reproduce the problematic behavior. PagerDuty app logs can be viewed under **PagerDuty ** → **Support** → **Logs**. Filter the logs to a window of time (5 to 10 minutes) that encompasses the occurrence of the observed issue, then export the logs to CSV by clicking the ⋮ icon next to any one of the column headers. --- URL: https://docs.pagerduty.com/integrations/servicenow-integration-guide/servicenow-user-guide # ServiceNow User Guide How to use the ServiceNow integration after installation ## Use PagerDuty Actions in ServiceNow The latest version of PagerDuty’s ServiceNow integration allows ServiceNow users to utilize PagerDuty’s [Add Responders](/incident-management/incidents/add-responders), [Conference Bridge](/incident-management/incidents/conference-bridge), [Incident Workflows](/ai-automation/automation/incident-workflows), [Incident Types](/integrations/servicenow-integration-guide/advanced-servicenow-configuration#incident-types-and-custom-field-mappings), and [Status Update](/incident-management/communicate/communicate-with-stakeholders#status-updates) capabilities within the ServiceNow interface. This suite of actions is an extension of previous versions which also allow you to trigger, reassign and resolve PagerDuty incidents from ServiceNow. To use these capabilities within ServiceNow, users must have a new role added to their ServiceNow user record: `x_pd_integration.incident_response`. 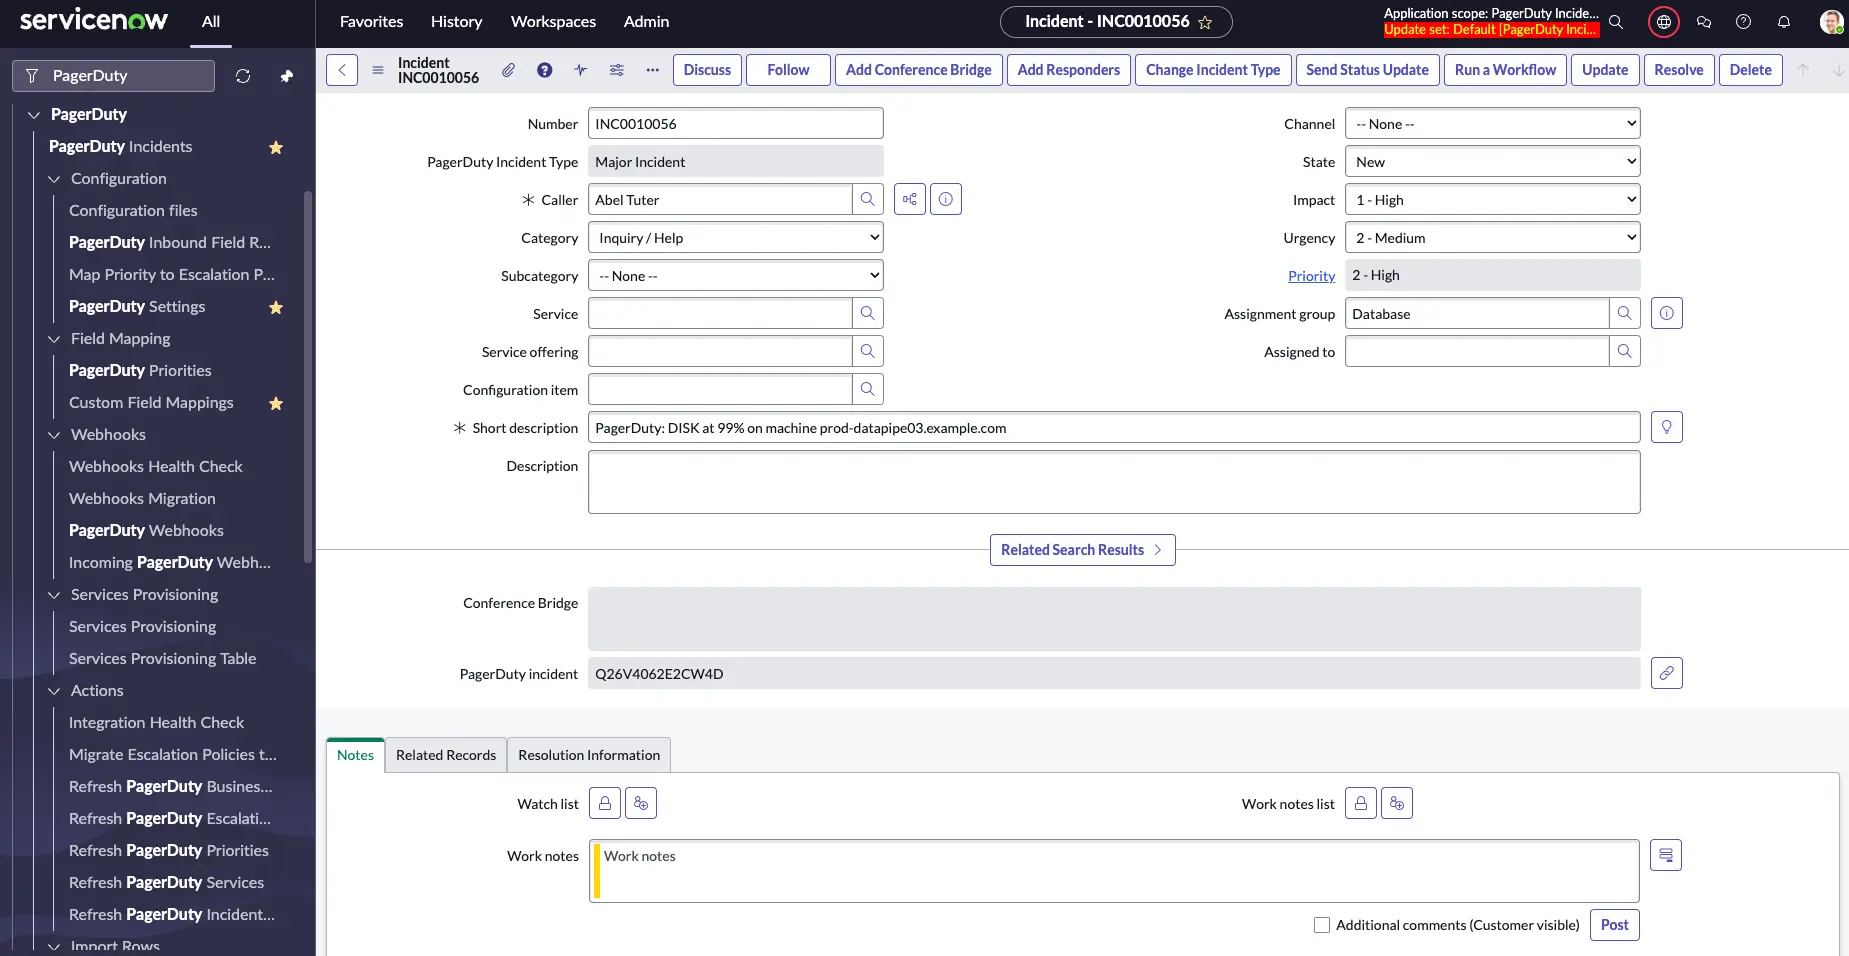 ### Take Action on an Incident from ServiceNow #### Trigger a PagerDuty Incident from ServiceNow 1. Search and select **PagerDuty Incidents** in the application navigator. Click **New** to create a new incident. 2. Perform the following: | Field | Instruction | | :--------------------- | :------------------------------------------------------------------------------------------------------------------------------------------------------------------------------------------------------------------------------------------------------------------------------------------------- | | **Caller** | Enter the ServiceNow user mapped to your PagerDuty account. | | **Short description** | Enter a short description. By default, PagerDuty uses this for the incident title. | | **Assignment Group** | Search and select an Assignment Group that is mapped to PagerDuty. | | **Configuration Item** | If you are [mapping configuration items](/integrations/servicenow-integration-guide/servicenow-provisioning#how-servicenow-objects-map-to-pagerduty-objects) to PagerDuty services, search and select the Configuration Item mapped to PagerDuty. | | **Impact** | Select the appropriate value to generate a **Priority** value of 1 or 2. If you wish to trigger PagerDuty incidents for other priorities as well, you can follow the [Priority Mapping](/integrations/servicenow-integration-guide#342-define-the-priority-mapping) steps. | | **Urgency** | Select the appropriate value to generate a **Priority** value of 1 or 2. If you wish to trigger PagerDuty incidents for other priorities as well, you can follow the [Priority Mapping](/integrations/servicenow-integration-guide#342-define-the-priority-mapping) steps. | Enter any other preferred information on this page and click **Submit** in the upper right. 3. You should now see an incident in your PagerDuty account on the service that is mapped to your Assignment Group or Configuration Item. The integration will use the [default service](/integrations/servicenow-integration-guide/servicenow-integration-details#pagerduty-settings) if a mapped service does not exist. If you would like a link back to the ServiceNow incident, click the PagerDuty **incident title** and click the **Incident Number** to the right of **Linked Records**. > **View Object Mappings:** You can see what PagerDuty service or escalation policy is mapped to a ServiceNow object by viewing the object's record in ServiceNow. > > - Assignment Groups mapped to a PagerDuty escalation policy will have an ID value in the **PagerDuty default escalation** field. > - Configuration Items or Assignment Groups mapped to a PagerDuty service will have an ID value in the **PagerDuty service** and **PagerDuty webhook** fields. #### Acknowledge an Incident from ServiceNow > **Note:** An incident can only be acknowledged through self-assignment in ServiceNow. If your ServiceNow and PagerDuty user accounts are not mapped, the integration uses the default user for the assignment and acknowledgement. 1. Search and select **PagerDuty Incidents** in the application navigator. 2. Click the **Incident Number** of your preferred incident to view its details. Select the **Assigned to** field and then choose yourself. 3. Click **Update**. This will acknowledge the incident in PagerDuty. #### Resolve an Incident from ServiceNow 1. Search and select **PagerDuty Incidents** in the application navigator. 2. Click the **Incident Number** of your preferred incident to view its details. Select the **Resolution Information** tab and then select the **Resolution Code** and enter **Resolution Notes**. 3. Click **Resolve** below. This will also resolve the incident in PagerDuty. ### Add Responders from ServiceNow > **Availability:** - The [Add Responders](/incident-management/incidents/add-responders) feature is available on the following pricing plans: Business, Digital Operations (legacy) and Enterprise for Incident Management. Please [contact our Sales team](https://www.pagerduty.com/contact-us/) to upgrade to a plan with this feature. > - You must enable the **Response Mobilizer** option in the [PagerDuty Settings](/integrations/servicenow-integration-guide/servicenow-integration-details#integration-behavior) to use this feature. 1. Search for and select **PagerDuty Incidents** in the application navigator. 2. Click the **Incident Number** of your preferred incident to view its details. 3. Click **Add Responders** and enter the **Assignment Group** and **User**. You may optionally add a **Message** for the responder and/or **Add Conference Bridge** for the incident on this screen. 4. Click **Add Responders** to send. ### Change Incident Type The Incident Types feature is documented in the [Incident Types](/integrations/servicenow-integration-guide/advanced-servicenow-configuration#incident-types-and-custom-field-mappings) article. To update an incident's type, you can refer to the steps outlined in the [Update an Incident's Type](/incident-management/incidents/incident-types#set-or-change-an-incident-type) section. ### Add a Conference Bridge from ServiceNow > **Availability:** - The [Conference Bridge](/incident-management/incidents/conference-bridge) feature is available on the following pricing plans: Business, Digital Operations (legacy) and Enterprise for Incident Management. Please [contact our Sales team](https://www.pagerduty.com/contact-us/) to upgrade to a plan with this feature. > - You must enable the **Conference Bridge** option in the [PagerDuty Settings](/integrations/servicenow-integration-guide/servicenow-integration-details#integration-behavior) to use this feature. 1. Search and select **PagerDuty Incidents** in the application navigator. 2. Click the **Incident Number** of your preferred incident to view its details. 3. Click **Add Conference Bridge**. If you have already configured a PagerDuty [Conference Bridge](/incident-management/incidents/conference-bridge), you may select it from the **Conference Bridge** dropdown. Otherwise, you may enter the **Dial-In Number** and/or **URL** manually. 4. Click **Add Conference Bridge** → **Note**: You may also optionally add a Conference Bridge while you are adding responders. Please follow instructions above in **Add Responders from ServiceNow**. ### Run a Workflow from ServiceNow > **Availability:** - [Incident Workflows](/ai-automation/automation/incident-workflows) are available on the following pricing plans: Business, Digital Operations (legacy) and Enterprise for Incident Management. Please [contact our Sales team](https://www.pagerduty.com/contact-us/) to upgrade to a plan with this feature. > - You must enable the **Incident Workflows** option in the [PagerDuty Settings](/integrations/servicenow-integration-guide/servicenow-integration-details#integration-behavior) to use this feature. 1. If you have not done so already, create a PagerDuty [Incident Workflow](/ai-automation/automation/incident-workflows). 2. Search and select **PagerDuty Incidents** in the application navigator. 3. Click the **Incident Number** of your preferred incident to view its details. 4. Click **Run a Workflow**. Select your preferred **Workflow** from the **Select Workflow** dropdown and click **Run** to run the Workflow. ### Post a Status Update from ServiceNow > **Availability:** - [Status Updates](/incident-management/communicate/communicate-with-stakeholders#status-updates) are available on the following pricing plans: Business, Digital Operations (legacy) and Enterprise for Incident Management. Please [contact our Sales team](https://www.pagerduty.com/contact-us/) to upgrade to a plan with this feature. > - You must enable the **Status Update** option in the [PagerDuty Settings](/integrations/servicenow-integration-guide/servicenow-integration-details#integration-behavior) to use this feature. 1. Search and select **PagerDuty Incidents** in the application navigator. 2. Click the **Incident Number** of your preferred incident to view its details. 3. Click **Send Status Update**. 1. **If there is a Business Service dependency mapped to this service**: The **Impacted Business Service** field will automatically populate. 2. **If there is _no_ Business Service dependency mapped to this service**: Select the **Impacted Business Service(s)** from the dropdown. 3. You should see a dialog stating `This update will be published to your PagerDuty status dashboard`. If you do not see this dialog, please [check your configuration in PagerDuty](/incident-management/communicate/internal-status-page#view-status-updates). 4. Enter your status update message in the **Status Update** field and click **Send Update**. ### Refresh PagerDuty Business Services, Services, Escalation Policies and Priorities From ServiceNow To refresh PagerDuty business services, services, escalation policies and priorities from ServiceNow, navigate to **PagerDuty** → **Actions** and click the **Refresh [PagerDuty-Object]** option for the appropriate object. ## Manual Incident Sync  When you provision Assignment Groups and Configuration Items to PagerDuty, you can configure the webhook connection [to manually sync incidents from PagerDuty](/integrations/servicenow-integration-guide/servicenow-integration-details#webhook-configuration). In ServiceNow v8, the integration leverages workflow actions to manually sync PagerDuty incidents to ServiceNow, so a workflow connection is required. Manual sync is only available for an open incident if the impacted PagerDuty service has a webhook connection to ServiceNow, and the webhook **Sync option** parameter is set to **Manual**. You cannot manually sync a resolved incident. ### Manually Create a ServiceNow Incident from a PagerDuty incident 1. Navigate to the desired incident in PagerDuty and view the incident details page. 2. The location of the manual sync button will depend on your integration version: - If you are using ServiceNow v8, which utilizes our v3 webhooks, select **More** → **Sync with ServiceNow** - For all other versions which use our v2 webhooks, select **Sync with ServiceNow** from the top actions menu. A modal will appear informing you that ServiceNow is processing the request, followed by a confirmation when the sync completes. A link to the ServiceNow incident will appear in the PagerDuty incident’s **Linked Records** field. --- URL: https://docs.pagerduty.com/integrations/servicenow-integration-guide/upgrading-to-opscloud # Upgrading to PD Reliability Platform: Resolving Provisioning Failures Resolving ServiceNow User Provisioning Failures ## Symptoms After upgrading your PagerDuty subscription to a PD Reliability Platform SKU (e.g., PD Reliability Platform Ultimate), user provisioning requests initiated from ServiceNow fail. Internal logs or error messages will display: > `License error: License is not available` In the ServiceNow UI, the PagerDuty settings page may visually appear to show a valid license selected, masking the underlying issue. ## Background When a PagerDuty subscription is changed to a new SKU, the available license IDs on the account change. The PagerDuty ServiceNow integration stores the license ID for newly provisioned users in a system property called `x_pd_integration.default_user_license`. This value **does not automatically update** during a SKU upgrade. It remains pinned to the old, now-invalid license ID. Because the old ID is invalid, provisioning fails even if your new SKU has unlimited or sufficient license capacity. Furthermore, because the old license is removed from the dropdown options, the ServiceNow UI defaults to displaying a different available option, making the settings page look correct when it actually contains a stale underlying value. > ****Recommended Timing**:** Perform these steps as part of your PD Reliability Platform upgrade runbook, ideally **before** attempting to provision new users post-upgrade. *** ## Resolution Procedure ### Step 1: Confirm New License IDs You must retrieve the correct, active license IDs from your PagerDuty account. You can find these using one of the following methods: - **PagerDuty Web App:** Navigate to your account settings to view active licenses. For more details, see [User Charges documentation](/account-admin/billing#user-charges). - **PagerDuty API:** Query the [List licenses API endpoint](/developer/api/reference/rest/licenses/list-licenses) to return an array of valid license IDs (e.g., `PXXM0P8`). ### Step 2: Update Default User License in ServiceNow 1. Log into ServiceNow as an Administrator. 2. Open the **PagerDuty Integration Settings** page. 3. Explicitly select the desired default user license for newly provisioned users. - _Note: You must perform this action and save even if the dropdown already appears to show the correct license._ 4. Save your changes. ### Step 3: Verify the System Property (_optional_) 1. In ServiceNow, navigate to the System Properties (`sys_properties`) table. 2. Locate the property: `x_pd_integration.default_user_license` 3. Verify that the value has successfully updated from the legacy ID to the new alphanumeric license ID. > ****Important Note**:** This change only applies to **newly provisioned users**. Existing users provisioned under the previous legacy license will not be retroactively modified. *** ## Check Additional Provisioning Paths A stale license ID can also linger in other automated workflows. Please review and update the license IDs in the following areas if applicable: - **SSO / SCIM Provider Configurations:** Check identity providers like Okta, Microsoft Entra ID (Azure AD), or Ping, where a specific PagerDuty license attribute mapping may be hardcoded. - **Custom Scripts & API Integrations:** Review any internal provisioning scripts, tools, or custom API wrappers that explicitly pass a license ID when creating users. --- URL: https://docs.pagerduty.com/integrations/servicenow-provisioning-v7 # ServiceNow v7 Provisioning Provision Configuration Items, services, and users from ServiceNow v7 to PagerDuty ## Services Provisioning The Services Provisioning feature allows users to provision Configuration Items from ServiceNow as business and technical services in PagerDuty. Users may optionally configure preferences for bulk provisioning on this screen as well. Access this feature in ServiceNow under **PagerDuty** → **Services Provisioning**. 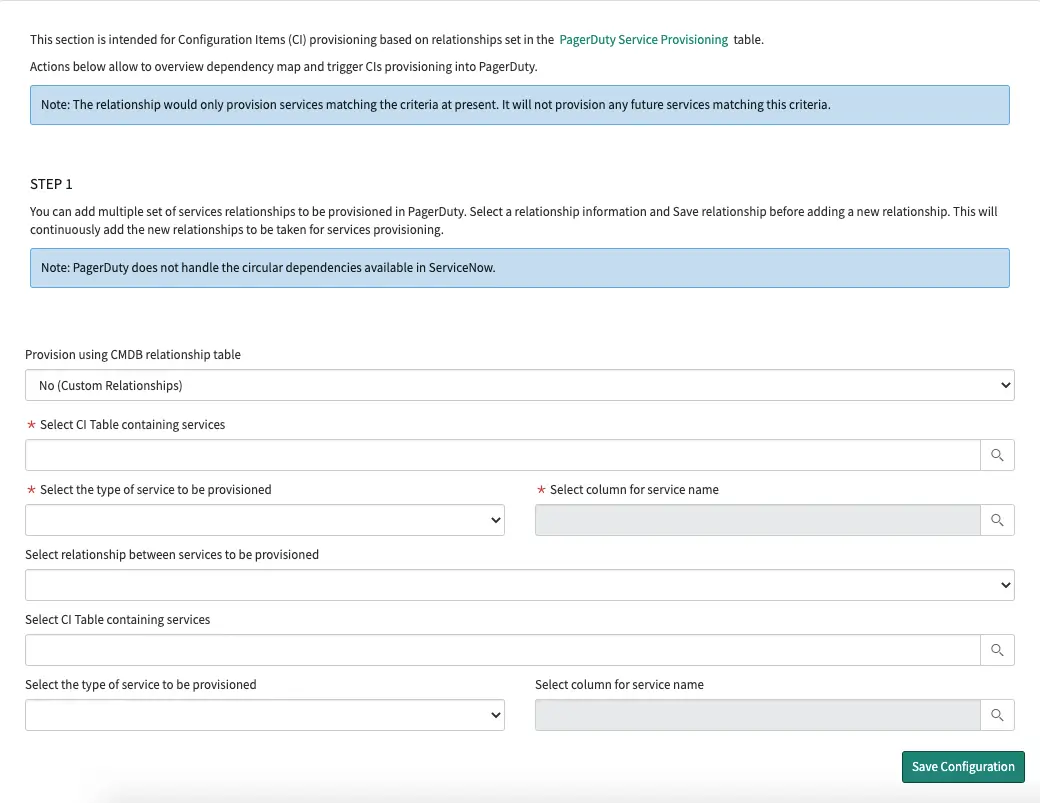 *Services Provisioning* > **Required User Permissions:** An `x_pd_integration.admin` role is required in ServiceNow to provision services and users in PagerDuty. > **Tips:** Before provisioning Configuration Items as services in PagerDuty, we recommend the following: > > - Read our [Full Service Ownership Guide](https://ownership.pagerduty.com/) for best practices in planning your PagerDuty technical and business service relationships. > - Given the [dependency relationships](/incident-management/services/service-profile#service-dependencies-tab) between business and technical services, review how you would like to map Configuration Item relationships, noting the higher-level CMDB classes and lower-level CMDB classes. > - Set the corresponding Assignment Group for each of the Configuration Items you will be provisioning. This simplifies the provisioning process; when you provision a single Configuration Item, it will verify that the Assignment Group exists in PagerDuty (as an escalation policy). If not, it will also provision the corresponding Assignment Group as a PagerDuty escalation policy. With the PagerDuty integration, each ServiceNow Configuration Item can be associated with a corresponding PagerDuty service. This integration offers an easy way to quickly generate a new PagerDuty service and webhook, which is necessary to send information back to ServiceNow. It will also populate the associated fields in ServiceNow. Any Configuration Item that extends the base `cmdb_ci` table can be mapped to PagerDuty because it inherits the same field that contains the PagerDuty service ID. This makes it easy to map any type of Configuration Item to services in PagerDuty, although we recommend only provisioning business services, technical services and/or applications. For each Configuration Item type, the form view for it will need to be modified to show the PagerDuty object ID. ### Step 1: Choose Provisioning Method Under **Provision using CMDB relationship table**, you have two options for defining CI dependencies prior to provisioning: - **Yes (Default)**: [Provision CIs and dependencies based on the CMDB relationships table (Option 1)](#provision-using-cmdb-relationship-table-option-1). - **No (Custom Relationships)**: [Provision CIs and dependencies based on custom relationships (Option 2)](#provision-using-custom-relationships-option-2). > **Best Practices:** If you have a well-established CMDB, we recommend that you [provision using the CMDB relationship table](#provision-using-cmdb-relationship-table-option-1). #### Provision Using CMDB Relationship Table (Option 1) When provisioning based on the CMDB relationship table, you have two further options: - [Provision CI items based on selected CI classes](#provision-cis-based-on-selected-ci-classes). - [Provision a single CI along with its dependencies](#provision-a-single-cl-with-dependencies). ##### Provision CIs Based on Selected CI Classes ###### Use Service Classification Where Applicable If you have defined the type of service classification on the CI class service items and would like to use that value to classify the service as a business or technical service, select the **Use service classification where applicable** checkbox. > **Tip:** - If you select the checkbox, and you have defined the service classification values, we will honor the value. Only the CIs with business and technical service classification type will be provisioned, but the application service type will be ignored. > - If the value is left empty, we will provision it based on the classification in the slush buckets below, else if the service class is selected under both service types then the CI will be provisioned as both a business and technical service. > - CIs that are both business and technical services will have an additional relationship provisioned in PagerDuty with the business service having a dependency on the technical service of the same CI.  *Choose CI classes*  *Select service classification* ###### CIs Without Defined Service Classification If you have not defined the type of service classification on the CI class service items, or for other CI classes that you would like to provision into PagerDuty, select the CI classes which belong to business service type under the **Business Services** class slush bucket and select the CI classes which belong to **Technical Services** type under the technical service class slush bucket.  *Select CI classes* **Behaviors**: - Select the CI classes under **Business Services** for CIs that you'd like to provision as a business service. - Select the CI classes under **Technical Services** for CIs that you'd like be provision as a technical service. - Select the CI classes which could be both business and technical service under both the slush buckets. - Avoid the CI classes which you do not want to provision into PagerDuty on both of the slush buckets. - The CIs and dependencies will be considered based on the CI classes selected under both the slush buckets. - All other CIs which do not match the classification will be ignored. ###### Choose Table with CIs Once the CI classes are classified, under **Choose Table with CIs or a single CI to be provisioned along with dependencies**, select the **CI table** from where the CIs should be fetched. The dependencies will be identified for the items in the table based on the classes and they will be defined in the Services Provisioning Table. Example: Selecting `cmdb_ci_service` will provision the CIs from the service table along with its dependencies, which may or may not be restricted to the table. ###### Select a Filtered List of CIs (Optional) If you would like to only select a filtered list of CIs from the selected table, then select the option **Open selected table to set and save filter** to save and select the filter in the next field. **Note**: The filter option will appear only after you set the table value. Also, you will need to manually select the saved filter name to apply the filter for your provisioning.  *Select a filter list of CIs* ###### Select Column for Service Name Next, **select the column** which will define the service name in PagerDuty. The **Name** value is set by default, though you may change it to another value if required. #### Provision a Single Cl With Dependencies You can provision a single CI along with its dependencies based on the configuration within the same user interface. Select the **Provisioning single CI along with its dependencies** checkbox, and then select the CI that you would like to provision with its dependencies, matching the CI classification set above.  *Provision a single CI* Users can do bulk and single CI provisioning at the same time through the same configuration. Save the different combinations of configurations if you would like to set different types of relationships, allowing you to set all the services and dependencies before provisioning. #### Provision Using Custom Relationships (Option 2) > **Read Carefully:** Please read this user guide carefully before provisioning in bulk, as bulk deprovisioning is not supported. The custom relationships provisioning configuration allows users to define the relationships between CIs without taking into consideration the relationship that exists within ServiceNow CMDB. 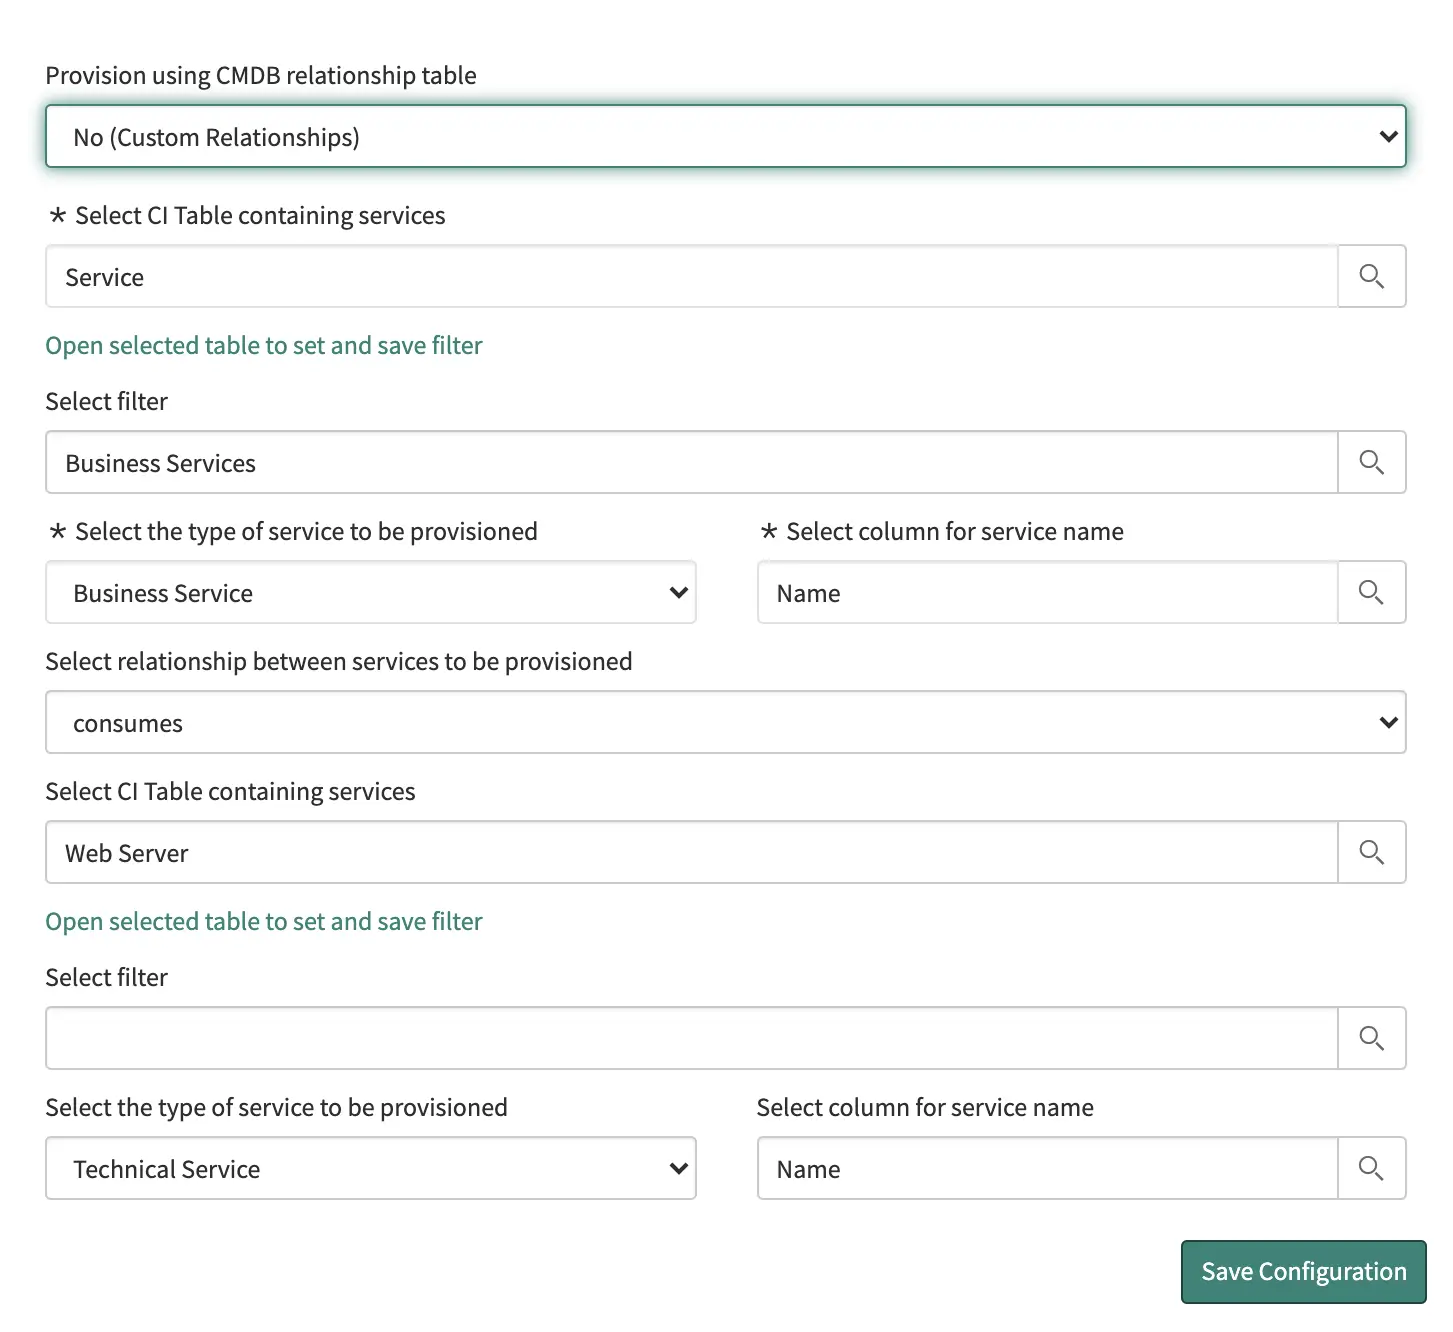 *Provision using custom relationships* | Field | Expected Value | | :--- | :--- | | Provision using CMDB relationship table | **No (Custom Relationships)** | | Select CI Table containing services | **Select the table** which contains the configuration items you would like to provision. Example: `Service(cmdb_ci_service)` if you would like to provision the items from this table. | | Select Filter | Open the **selected table** and **save a filter**, or **save a filter on the table view** before selecting this value. The filter selected will be applied to fetch a filtered list of items from the table selected in the previous field. | | Select the type of service to be provisioned | **Business Service** or **Technical Service**. This selected value will apply to all the items on the selected table. | | Select column for service name | This value will be used for the name to set on the service on PagerDuty. Default value: Name | | Select the relationship between services to be provisioned | **Consumes**: First being parent and second being child CI. OR **Consumed by**: First being child and second being parent CI. The first selected table and the second selected table items will have the above relationship between the services. | Once you've set the values, click **Save Configuration**. The custom relationship is set between each item on both the tables, or if only one table is selected in both the values, then relationships are set between each item and the other items within the same table. **Example**: A table is selected and filtered to provision the following list of configuration items: If table `cmdb_ci_A` contains: - CI 1 - CI 2 - CI 3 If table `cmdb_ci_B` contains: - CI 4 - CI 5 - CI 6 Then the following relationships will be defined on the view services table: **Parent CI 1:** - Child CIs: - CI 4 - CI 5 - CI 6 **Parent CI 2:** - Child CIs: - CI 4 - CI 5 - CI 6 **Parent CI 3:** - Child CIs: - CI 4 - CI 5 - CI 6 Please review this information and **delete the relationships and services which do not meet the requirements**, to ensure only the expected services and relationships are provisioned in PagerDuty. In other words, the custom relationship merely creates all possible relationships between the selected list of items, and you will need to remove any which are not required. ### Step 2: View Services Once saved, the configuration will populate the potential services and dependencies in the Services Provisioning table (**PagerDuty** → **Services Provisioning Table**), along with the service type. **Review the table information before provisioning the services.** The **Validation warnings** column will load any missing information on the services, which allows users to fix these errors before provisioning. Once the errors are fixed, click **Revalidate services**. Change the service type if there are any service types not as expected on the view services table, also remove any services and dependencies which you do not want to provision into PagerDuty. ### Step 3: Provision Services Once you have reviewed the list of services, click **Provision Services**. If there are any errors while provisioning, they will be captured in the **Provisioning errors** column. Fix the errors and retry provisioning. **Note:** If there are older services, which were not provisioned due to errors or any other reason, delete these services/relationships from the **View Services** table before provisioning new services again. ## Provision Users to PagerDuty This integration also allows you to provision users from ServiceNow to PagerDuty. In your ServiceNow Users list, you can see directly which users have already been created in PagerDuty as their **PagerDuty ID** field will be populated. Select a user that has not already been provisioned to PagerDuty and select **Provision PagerDuty User** to add them to your PagerDuty account: 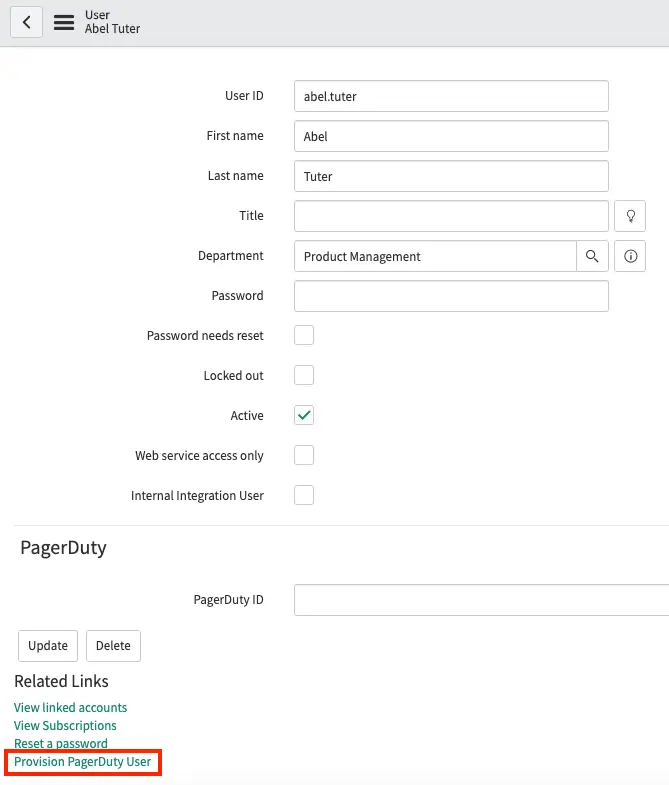 *Provision users to PagerDuty* You will then see a notice that the user is being provisioned. Upon completion, the **PagerDuty ID** field is automatically populated. The user also shows up in PagerDuty, with the same name and email address. If the user has their **Business phone** or **Mobile phone** fields populated in ServiceNow, these settings will also be automatically provisioned as [Contact Methods](/account-admin/user-profile/contact-information) and [Notification Rules](/account-admin/user-profile/notification-rules) in PagerDuty. You can also provision multiple users at once by selecting them and selecting **Provision PagerDuty User** from the dropdown on the Users screen.  *Select Provision PagerDuty User* --- URL: https://docs.pagerduty.com/integrations/servicenow-troubleshooting-guide-v7 # ServiceNow v7 Troubleshooting Guide Identifying and resolving common issues with the ServiceNow v7 integration The following are the most common issues, and their troubleshooting steps, for the [ServiceNow v7 integration](/integrations/servicenow-v7-integration-guide). ## PagerDuty App Does not Appear in the System Menu If you're having trouble finding the PagerDuty app in ServiceNow's system menu, please check the following first: - If you just installed the app, try a hard refresh in your browser, or log out and log in again, as the left menu may need to reload after installation. - Make sure the PagerDuty app has been added to your current instance from the [ServiceNow store](https://store.servicenow.com). - Install the app to your current instance by going to **System Applications** → **Applications** → **Downloads** tab. ### Conflicting Plugins If you've completed the [steps above](#pagerduty-app-does-not-appear-in-the-system-menu) and are still unable to see the PagerDuty app, check to see if you have any plugins that could prevent the installation from succeeding. For example, if you have installed a plugin that encrypts attachments in ServiceNow, we've seen cases where it looks like the installation completes when it has not actually done so. If you identify such a plugin, please try deactivating it and attempting installation again. ## ServiceNow Incidents and Updates do not Appear in PagerDuty 1. In ServiceNow, check the REST API connection by navigating to **PagerDuty** → **Actions** → **Test REST API Connection**. Check that trigger conditions are met. 2. Check your primary ServiceNow app settings under **PagerDuty** → **Configuration** → **PagerDuty Settings**. If auto-provisioning is disabled, check the value in the field **Default PagerDuty User ID to use if auto-provisioning is disabled**. 3. See the section [When is an incident sent to PagerDuty?](/integrations/servicenow-v7-faq#when-is-an-incident-sent-to-pagerduty), in our [ServiceNow v7 FAQ](/integrations/servicenow-v7-faq) page. > **Default PagerDuty User ID:** The **Default PagerDuty User ID** configuration property in the ServiceNow app needs to be a PagerDuty ID, rather than an email address or ServiceNow user ID. PagerDuty IDs are uppercase alphanumeric strings that begin with `P` (see: [Where do PagerDuty field values come from?](/integrations/servicenow-v7-faq#where-do-pagerduty-field-values-come-from)). > > There should be only one user that has the given PagerDuty user ID in your ServiceNow instance, and the user's email address should match the corresponding PagerDuty user with that ID. If they do not match, some API calls may not succeed. > > An email address is required for the REST API calls that create PagerDuty incidents. With that in mind, if this information is incorrect, the requests may not succeed. ## Incidents in ServiceNow are not Updated or Created from PagerDuty Most data and event synchronization from PagerDuty to ServiceNow happens via webhooks sent from PagerDuty to ServiceNow. For this reason, if you notice incidents are not updating or getting created from PagerDuty, a good place to begin troubleshooting is to review the webhook import process. ### Check webhook authentication and permissions To test all settings, go to **PagerDuty** → **Actions** → **Test ServiceNow User Authentication.** You should see the message: ``` x_pd_integration (PagerDutyTest): ServiceNow user authentication test successful (200) ``` If you see the following: ``` x_pd_integration (PagerDutyTest): ServiceNow user authentication test failed (403) ``` 1. Ensure that the **ServiceNow user for authentication** and **ServiceNow password for authentication** configured under **PagerDuty** → **Configuration** → **PagerDuty Settings** are valid credentials for a ServiceNow web service access user. 2. Ensure that the password is consistent between the user and the setting in the **PagerDuty Configuration** properties. 3. Ensure that the user for webhook authentication has the following roles: - `itil` - `rest_service` - `x_pd_integration.admin` If the password or username have changed in ServiceNow, you must also update the credentials in the ServiceNow [extensions on your PagerDuty services](/integrations/extensions). Alternately, in all versions 3.5 and later, you can delete the extensions, set the value of the *PagerDuty Webhook* field to blank in your provisioned assignment groups and configuration items, and then provision them again. ### Check Extensions on PagerDuty Services - Check that the extension's URL is correct. The host it points to should match the same ServiceNow subdomain that you integrated PagerDuty with. - If you have provisioned your services and webhooks in PagerDuty from a development or staging instance of ServiceNow, you will need to update your extension URLs to reflect your production ServiceNow instance. If you do not take this step, the bidirectional integration will not work because webhooks would be sent to the development/staging ServiceNow instance. Read more about PagerDuty service extensions, please read [Extensions](/integrations/extensions). ### Check That Assignment Groups Match the Escalation Policy - If a ServiceNow incident isn't updating after changes happen on the corresponding PagerDuty incident, make sure the relevant PagerDuty escalation policy has a corresponding assignment group in ServiceNow. - Ensure that the appropriate assignment group has its *PagerDuty Escalation* field set to the escalation policy's ID (for example, `PXXXXXX`). - You may need to add the two PagerDuty fields to the group form or list view to review their values. ### Check Webhook Import Records Check to see if the webhook messages have been saved in ServiceNow. In ServiceNow, go to **PagerDuty** → **Import Rows** → **Webhook Import Rows** and look for records with a creation time that coincides with when the incident in PagerDuty was triggered, acknowledged or resolved. ### Check for Required Fields If you can see that webhooks are getting through from PagerDuty to ServiceNow, but are not creating or updating an incident, try manually closing an incident in ServiceNow. If manually closing an incident requires you to enter values for certain fields, your required fields have likely been customized. Create [inbound field rules](/integrations/servicenow-integration-guide/advanced-servicenow-configuration#inbound-field-rules) so that required fields have a default value. ### Check for Interfering State Field Values Check to see if you have any custom choices set up for the *State* field in the ServiceNow incidents model: 1. Right-click on the *State* field's label (e.g., **New** or **Resolved**). 2. Select **Configure Dictionary**. 3. Switch to **Advanced view**. 4. Select the **Choices** tab and look for entries with higher numbers in the **Value** field. The integration follows the same convention as ServiceNow's out-of-box state values. Higher numbers imply a more advanced state (i.e., 6 or higher represents done, resolved, or some variant). If the state of the incident that did not automatically resolve is a higher numeric value, but the incident did not resolve, it is because it was treated as already resolved. To correct this, you may need to modify custom choice values for the **State** field to be lower than 6, so that they are treated as an unresolved state. ### Check For Interfering Data Policies Data policies, which allow the ServiceNow administrator to create validation rules on tables, can stop the webhook import process from committing PagerDuty changes to the ServiceNow incident record, and thus prevent the integration from automatically resolving incidents. When a data policy does this, there will not be any clear indication of it in the *application-scoped logs*. There will, however, be an error-level log entry in the *system logs* created at the time of the webhook import, with a message beginning that begins `Data Policy Exception`. As of version 4 of the integration, inbound field rules give you the ability to automatically fill fields in the incident, and this can be used to fill fields as needed in order to satisfy data policies. To address this: 1. Navigate to **System Policy** → **Rules** → **Data Policies**. 2. In the list view, create a new filter on the **Table** field: `=incident`. 3. Make note of all the fields and constraints. 4. Go to **PagerDuty** → **Configuration** → **PagerDuty Inbound Field Rules**. 5. For each incident field that was part of the data policy's conditions: - Create a new inbound field rule. - Set the webhook type to *Acknowledge* or *Resolve*, based on which action is experiencing an issue. - Enter a default value for the field, or dynamically based on the webhook payload. For more information, please see [Advanced ServiceNow Configuration: Inbound Field Rules](/integrations/servicenow-integration-guide/advanced-servicenow-configuration#inbound-field-rules). ## Inbound Field Rules not Filling Target Fields with Desired Values The most common causes include: - A business rule or some other process is overwriting the changes to the field after it is initially set by the field rule. - The inbound field rule only applies to a specific webhook event type (e.g., trigger/resolve), and the change didn't occur at the specified time because the relevant webhook type came through at a different time. - The inbound field rule is disabled. To troubleshoot: 1. In ServiceNow, go to **PagerDuty** → **Configuration** → **PagerDuty Inbound Field Rules** and verify the following: - For the inbound field rule in question, **Enabled** is `true`. - The **PagerDuty webhook type** is the expected type. 2. Go to **System Definition** → **Business Rules** and look for all rules that modify the field as follows: - Enable the field **Set field values** in the list view. - Search filter for table: `=incident`. - Filter out all rows where **Set field values** is blank. - If there is more than one page of results, search for all records where **Set field values** contains the column name, e.g., `*business_service`. If any results modify this field, it may explain why the field is not getting set according to the inbound field rule; check that the business rule is not overwriting the field. - If nothing turns up, look at all business rules that run a script and check whether any scripts set the value of the field in question. ## Some User Actions in PagerDuty are not Updated in ServiceNow A common cause of this type of issue is that the email address for the PagerDuty user and corresponding ServiceNow user do not match. Check the user's email address in ServiceNow to make sure it matches the user's email address in PagerDuty. Also confirm that the user is provisioned in both ServiceNow and PagerDuty. ## Incident Notes do not Sync - The user posting the note might not be provisioned in PagerDuty. In other words, it is possible that the user is not assigned a PagerDuty user ID in ServiceNow. This issue can also occur if automatic provisioning is disabled, and one of the following applies: - Under **Configuration** → **PagerDuty Settings**, there is no value set for the option **Default PagerDuty User ID to use if auto-provisioning is disabled**. - There is an incorrect or invalid value set for this option. The value must be a PagerDuty user ID, which is an uppercase alphanumeric code at the end of a given user's profile URL (for example, `PXXXXXX`). ## Webhook Migration If you do not see the option to migrate webhooks, you can re-enable the menu item and run the migration. To do this: 1. In ServiceNow, go to **System Definition** → **Application Menus**. 2. Search and select "PagerDuty" to go to the application's edit screen. 3. Under the menu items, find **MIGRATE WEBHOOKS** and check its box. 4. In the **Actions on selected rows** dropdown, select **Change active state**. 5. Refresh the page and go to the PagerDuty application in the system menu. The menu item should now be visible. ## ServiceNow Sends Too Many Emails or Worknote Updates on an Incident We've seen cases where ServiceNow sends hundreds, or even thousands of emails or worknote updates on an incident. This is usually due to a feedback loop, which can result from custom business rules or automation in ServiceNow. It is also possible to use webhooks to inadvertently create a feedback loop between ServiceNow and PagerDuty. This can happen if there are any business rules or other automated processes that alter the assignment group of the ServiceNow incident, and caution is not exercised when manually setting the integration fields. To give a high-level overview of an example of how this can possibly happen, let us assume the following configuration: - There is a business rule that automatically changes the assignment group to **B** if it is placed into assignment group **A**. - Both assignment group **A** and **B** are tied to PagerDuty escalation policy **Z.** A feedback loop occurs in the following scenario: 1. Incident changes assignment group to, or is created in, **B**. 2. A PagerDuty incident triggers and is assigned to escalation policy **Z**. 3. A webhook fires and escalation restarts (webhook type `incident.delegate` or `incident.trigger`). 4. Webhook import in ServiceNow assigns incident to assignment group **A**. 5. Automation changes assignment to **B**. 6. The loop repeats. If your configuration matches or is similar to the scenario described above, you'll need to make adjustments so that the loop is broken. ## Duplicate Incidents ### ServiceNow Creates Duplicate Incidents in PagerDuty This can happen when a workflow circumvents the methods designed to avoid triggering duplicate PagerDuty incidents. > **How the Integration Works:** The integration uses the **PagerDuty Incident** field in the ServiceNow incident as a marker to prevent race conditions. Initially it is populated with a placeholder value `---waiting---` and is later filled with the PagerDuty incident ID once it is available. > > The placeholder value is filled in immediately when the business rule runs, and the business rule's conditions exclude the case where the field has a value that starts with `---`. With this in mind, if two updates happen in succession, before the incident triggers in PagerDuty, the business rule won't run twice. > > The incident is updated again when the PagerDuty REST API is called to trigger the incident. To prevent other updates from triggering the same business rule more than once, `current.update()` is called to commit the incident with the placeholder value to the database. Assuming that there have been no customizations to the out-of-box PagerDuty integration, the most likely cause is an automation, i.e., a separate business rule, that is triggering a second automatic update on the incident record after the initial one. The business rule **PD Trigger PagerDuty Incident** runs with order = 100, meaning that it runs *after* changes are committed to the database. If two updates happen asynchronously in rapid succession, they risk triggering the business rule that creates a PagerDuty incident twice. To resolve this, first you will need to find out how the secondary updates take place: 1. In ServiceNow, go to **System Logs** → **Events**. 2. Find events named `x_pd_integration.trigger_incident` around the time duplicate incidents triggered. 3. Note the values of: - `param1`, the last worknotes entry. - `param2`, a comma-delimited list of extra parameters: current user `sys_id`, the operation (insert or update), and a boolean for whether the value of the assignment group or Configuration Item changed. - User ID - User name 4. Identify the event that was raised by the automated process based on how the event was submitted, vis-à-vis the available attributes. 5. Find some attribute of the automated update operation that can be used to distinguish it from others, e.g., if it was made by a human. 6. Add conditions to the business rule **PD Trigger PagerDuty Incident** that exclude updates which have the distinguishing characteristics of the automated updates. ### PagerDuty Creates Duplicate Incidents in ServiceNow > **How the Integration Works:** The PagerDuty App receives webhooks and saves them in an import table, and uses an import transform map to translate them to updates to existing incidents or insertion of new incidents. It uses the **PagerDuty Incident** field in the ServiceNow incident to identify existing incidents ### Coalesce Disabled You may also see this behavior if the import transform map is not set to coalesce on the incident ID. Verify that coalescing on the incident ID is enabled in the import transform map: 1. In ServiceNow, go to **PagerDuty** → **Import Rows** → **Webhook Import Service**. 2. At the bottom of the page, select **PagerDuty Webhook Import** under **Web Service Transform Maps**. 3. At the bottom of this page, find the section **Field Maps**. 4. In the mapping for `id` → `x_pd_integration_incident`, ensure that **Coalesce** is set to **true**. --- URL: https://docs.pagerduty.com/integrations/servicenow-v7-faq # ServiceNow v7 Frequently Asked Questions Frequently asked questions about the PagerDuty app for ServiceNow, version 7 ## FAQ **How can I tell what version of the PagerDuty app for ServiceNow I am using?** In ServiceNow, navigate to **System Applications** → **Applications** and select the **Downloads** tab to find the **PagerDuty Platform for Real-Time Operations** application. You see the version of the application directly under the application title. **When is an incident sent to PagerDuty?** By default, the PagerDuty application triggers an incident in PagerDuty when two conditions are met: - You can determine the service and escalation policy used for handling the incident. Refer to [How Are the Service and Escalation Policy Determined](#how-are-the-service-and-escalation-policy-determined) for details. - The incident priority is P1 or P2. You can adjust these conditions in ServiceNow by navigating to **Configuration Files** → **Business Rules** → **PD Trigger PagerDuty Incident**:  *Select Conditions* By default, the priorities **1 - Critical** and **2 - High** are selected. To trigger PagerDuty incidents for other priorities, select any combination of desired priorities. If you edit the priorities that trigger PagerDuty incidents, make the same adjustment to the priority conditions in a second business rule. This second rule is **PD Trigger PagerDuty Incident on update**. This adjustment covers scenarios where an existing ServiceNow incident that is not yet linked to PagerDuty updates in a way that meets the conditions to create a PagerDuty incident. > **Tip:** Before proceeding, ensure that PagerDuty [priorities](/incident-management/incidents/incident-priority) and ServiceNow priorities are synchronized and configured according to the [Advanced ServiceNow Configuration](/integrations/servicenow-integration-guide/advanced-servicenow-configuration) guide. > **Warning:** The PagerDuty Support Team does not support customizations that alter the out-of-the-box behavior of the integration. You may need to configure the synchronization between incidents to include priorities in addition to P1 and P2. **How are the service and escalation policy determined?** ServiceNow determines the service and escalation policy in PagerDuty using the following criteria: - If **ServiceNow to PagerDuty mapping** is set to **Assignment Groups map to PagerDuty**, the assignment group must be provisioned. Its **PagerDuty Service** field must correspond to a valid service ID and its **PagerDuty Escalation** field must correspond to a valid escalation policy ID. - If **ServiceNow to PagerDuty mapping** is set to **Configuration Items and Assignment Groups map to PagerDuty**: - The escalation policy can be determined from the assignment group, whether it is set as the assignment group of the incident or as the assignment group designated for the configuration item. - The service can be determined from the configuration item, or: - If the configuration item is not provisioned, the service can be determined from the configuration property **Default PagerDuty Service ID to use if Configuration Item is not mapped**. > **Versions 3.5 and Earlier:** In versions 3.5 and earlier, the PagerDuty escalation policy is not required to create an incident, but only assignment groups can be associated with PagerDuty services. **How can I see the PagerDuty fields in ServiceNow?** In version 4.0 and later, PagerDuty fields appear in three places on the group form: 1. Two fields on the incident form. 2. One field on the user form. 3. One field on the configuration items form. To make each field visible: 1. View the form you want to change and **right-click** the gray header. 2. Navigate to **Configure** → **Form Layout** to open the two-column configuration page. 3. Find the PagerDuty fields you want to include in the left column, select them, and click the **Right Arrow** button to add them. 4. Click **Save**. The new fields display the next time you view the form. To enable fields in the list view, click the **Gear** icon in the upper-left corner of the list to add columns to the display. **How can I manually edit PagerDuty fields?** 1. **Right-click** a field label and click **Configure Dictionary**. 2. Clear the **Read only** checkbox on the new page and click **Save**. **How do I undo provisioning of a group, user or CI?** This process allows you to reset provisioning for a user, group, or configuration item. 1. Enable writing to the integration fields as described in the previous section. The field labels start with **PagerDuty**, and their column names start with `x_pd_`. 2. Clear the values of the fields to leave them blank. 3. Delete or rename the corresponding objects in PagerDuty to avoid name collisions, with the exception of users. Objects must have unique names, ignoring differences in case and leading or trailing whitespace, which can cause errors when provisioning them again. Step three (deleting objects from your PagerDuty account) is necessary to ensure there are no pre-existing objects in the PagerDuty account with the same names. This step is not necessary for users because the integration does not attempt to create a new user if it finds a user with the same email address as the user in ServiceNow. Existing users in PagerDuty do not cause issues when provisioning from ServiceNow. **Can I provision a ServiceNow webhook again?** If you clear the value of the **PagerDuty Webhook** field in the ServiceNow assignment group or configuration item, a webhook automatically re-provisions in PagerDuty when an incident for this group or configuration item triggers in PagerDuty. The integration saves the new webhook object ID to this field. **Can I connect multiple PagerDuty services to a single ServiceNow group?** The integration provides one-to-one mapping out-of-the-box. It is, however, possible to map many PagerDuty services to a single ServiceNow assignment group or configuration item. Read more about this configuration in the [ServiceNow v6 Integration Guide](/integrations/servicenow-integration-guide-v6#connecting-multiple-pagerduty-services-to-single-assignment-group). **Where do PagerDuty field values come from?** Fields such as **PagerDuty Escalation** and **PagerDuty Service** that are added to the assignment group, configuration item, and user tables in ServiceNow automatically populate with IDs from PagerDuty when they are provisioned. These IDs are all upper-cased, alphanumeric strings that begin with `P`. Find any PagerDuty object ID by navigating to its details page in PagerDuty and examining the page URL. The ID is near the end of the URL. For example, if a PagerDuty service is located at `https://subdomain.pagerduty.com/service-directory/P2SID6B`, the service ID is `P2SID6B`. **How do I associate an assignment group or Configuration Item with a pre-existing escalation policy or service?** To manually provision objects and create a link between pre-existing objects in PagerDuty and ServiceNow: 1. Clear the fields that contain the PagerDuty IDs, such as **PagerDuty Escalation** and **PagerDuty Service**. 2. Obtain the object IDs from their respective detail pages in PagerDuty. 3. Input the ID values into the respective fields in the ServiceNow object (assignment group or configuration item). 4. Click **Save**. **What fields are sent to PagerDuty when provisioning a user?** The integration sends the following values when provisioning a user: - Display value (full name) - Phone numbers: - `phone` - `mobile_phone` - `email` - `title` **Is it possible to integrate more than one PagerDuty instance with a single ServiceNow instance?** This integration supports connecting a single PagerDuty instance with multiple ServiceNow instances, but you cannot integrate multiple PagerDuty instances with a single ServiceNow instance. --- URL: https://docs.pagerduty.com/integrations/servicenow-v7-integration-guide # ServiceNow v7 Integration Guide Configuring the v7.9.1 Integration ## ServiceNow and PagerDuty Integration Benefits - Leverage ServiceNow workflow and ticketing capabilities with PagerDuty robust on-call scheduling, notifications, and escalation policies. - Run Response Plays, post status updates, and set the impacted business service on a PagerDuty incident from the ServiceNow interface. - Perform assignment group and priority mapping to PagerDuty escalation policies. - Provision business and technical services from ServiceNow to PagerDuty along with their dependency relationships. - Send ServiceNow change requests to PagerDuty as change events. - Author custom code for outbound REST API calls. - MID server support. ### How It Works Incident communication between ServiceNow and PagerDuty is bi-directional, allowing you to trigger, reassign, resolve, use response plays, post status updates, and set impacted business services in either system. The integration supports the following workflows: - Third-party monitoring tool integrations detect an issue and trigger an incident in PagerDuty. You receive notifications from PagerDuty, and you can Acknowledge and resolve the incident via PagerDuty. A ServiceNow ticket opens when a PagerDuty incident triggers, and these actions remain in sync for the lifecycle of the incident. - A ticket is filed in ServiceNow, which automatically triggers an incident in PagerDuty and notifies you. You take ownership via PagerDuty, and these actions from PagerDuty remain in sync with ServiceNow. ### Requirements #### In ServiceNow - A ServiceNow Administrator role is required for configuration. #### In PagerDuty - The ServiceNow integration is only available to accounts on the following pricing plans: Business, Digital Operations (legacy), and Enterprise for Incident Management. [Contact our Sales Team](https://www.pagerduty.com/contact-sales/) to upgrade to a plan featuring the ServiceNow integration. - A Global Admin or Account Owner base role is required for configuration. ### Quick Links - [How the Integration Works](/integrations/servicenow-integration-guide/servicenow-integration-details) - [Advanced Configuration](/integrations/servicenow-integration-guide/advanced-servicenow-configuration) - [Troubleshooting the ServiceNow Integration](/integrations/servicenow-troubleshooting-guide-v7) - [Frequently Asked Questions](/integrations/servicenow-v7-faq) ### Version This guide details configuration for the latest [ServiceNow v7.9.1 integration](https://store.servicenow.com/sn_appstore_store.do#!/store/application/39a9d9664f834e00dd657bb28110c77b/7.9.1). > **Looking for Another Version?:** The [ServiceNow v6 integration](/integrations/servicenow-integration-guide-v6) is also available. ## Integration Walkthrough > **Assignment Groups and Change Groups:** ServiceNow Quebec refers to assignment groups as change groups. These terms are interchangeable in this guide. ### Complete ServiceNow Pre-Install Requirements #### Configure ServiceNow Application Access Controls To ensure the integration functions correctly, a ServiceNow administrator must allow configuration access in the specified ServiceNow tables. 1. Navigate to **System Definition** → **Tables**. 2. Search for and open the records for `sys_user`, `sys_user_group`, and `sys_user_grmember`. 3. Select the **Application Access** tab on each record and configure the following values: | Field | Value | | :---------------------- | :------ | | **Can read** | Checked | | **Can create** | Checked | | **Can update** | Checked | | **Allow configuration** | Checked | 4. Click **Update** in the upper-right corner of each record to save your changes. #### Install the Integration 1. Navigate to the [PagerDuty integration in the ServiceNow Store](https://store.servicenow.com/sn_appstore_store.do#!/store/application/39a9d9664f834e00dd657bb28110c77b/7.6.0) and install the application. #### Add PagerDuty Fields to Views To view PagerDuty ID fields within ServiceNow, manually add them to the Group, User, and Incident views. This makes it easier to see which ServiceNow objects map to PagerDuty. Complete instructions are detailed in the [Show or hide fields on a form](https://docs.servicenow.com/bundle/rome-platform-administration/page/administer/form-administration/concept/configure-form-layout.html#t_ConfigureAForm) documentation on the ServiceNow site. 1. Add the PagerDuty fields to the User and Group list views by clicking the **gear icon** in the upper-left corner of the grid to customize the display of columns. This makes them visible in your list views only.  *Click gear icon*  *Personalize list columns*  *Add PagerDuty fields to views* 2. Use the following table to identify the available PagerDuty fields you can add to the list views and forms: | List Views and Forms | PagerDuty Fields | | :-------------------------------------------- | :-------------------------------------------------------------------------------------------------------------------------------------------------------------- | | User list view and user form | - PagerDuty ID | | Group list view and individual Group form | - PagerDuty default escalation
- PagerDuty error message
- PagerDuty schedule
- PagerDuty service
- PagerDuty team
- PagerDuty webhook | | Applications list view and individual CI form | - PagerDuty Change Event Token
- PagerDuty service
- PagerDuty webhook | | Incident list view and Incident form | - PagerDuty incident
- PagerDuty incident id
- PagerDuty incident key | ### Configure PagerDuty #### Create a PagerDuty API Access Key 1. Log in to your PagerDuty account in the web app. Navigate to **Integrations** → **API Access Keys**. 2. Click **Create New API Key**.  *Create new API key* 3. In the dialog box, enter a **Description** for your key. Leave the **Read-only** box unchecked, as a full API key is required. Click **Create key**. 4. Copy the generated API key and save it in a secure place. You do not have access to the key after this step. If you lose a key, remove the key and create a new one. Click **Close**. #### Create a Default PagerDuty User Account for ServiceNow This integration requires ServiceNow to have access to your PagerDuty account via both an API token and a PagerDuty user account. The PagerDuty user account ensures that non-PagerDuty users can take action in ServiceNow and have those actions reflect in PagerDuty. > **Default User Provisioning Stipulations:** You can provision a Default User from the ServiceNow UI, but consider the following stipulations: > > - Provisioning the Default User creates a PagerDuty user based on the user who is logged in to ServiceNow and configuring this setting. If you agree to be provisioned as the Default ServiceNow user, follow the directions in this section and move to [Configure Your ServiceNow Instance](#configure-your-servicenow-instance). > - If you do not want to be provisioned as the Default ServiceNow user in PagerDuty, proceed with the steps below. 1. In your PagerDuty account, navigate to **People** → **Users** and click **Add Users**. 2. Configure the new user profile with the following values: | Field | Value | | :------------ | :----------------------------------------------------------- | | **Name** | `ServiceNow User` | | **Email** | Enter any valid email address and save it in a secure place | | **Base Role** | Select **Global Admin** | 3. Click **Add**, then click **Send Invitations** to save. 4. Locate the new ServiceNow User in your PagerDuty Users list, click the **user name**, and note the seven-character alphanumeric user ID in the URL of the page (for example, if the URL is `https://your-subdomain.pagerduty.com/users/PXXXXXX`, the user ID is `PXXXXXX`). Copy this user ID and store it in a secure place with the email address. ### Configure Your ServiceNow Instance #### Create a ServiceNow User Account for Webhook Authentication The PagerDuty integration requires a dedicated ServiceNow user account to allow PagerDuty to sync actions back to ServiceNow via webhooks. This security feature allows you to control integration permissions and roles within ServiceNow. 1. Log in to your ServiceNow instance. Navigate to **Organization** → **Users** and click **New**. 2. Configure the new user account with the following values: | Field | Value | | :---------------------------- | :------------------------------------------------------------------------------------------------------ | | **User ID** | Enter any desired username (save this value in a secure place) | | **First name** | Enter a first name | | **Last name** | Enter a last name | | **Password** | Set a password (save this value in a secure place) | | **Web service access only** | Checked (optional, if available) | | **Internal Integration User** | Checked (optional, if available) | | **Email** | Enter the exact email address used for the PagerDuty default user account in the previous section | | **PagerDuty ID** | Enter the seven-character user ID generated for the default PagerDuty account in the previous section | Click **Submit**.  *Create a ServiceNow user account for webhook authentication* 3. Search for and click into the newly created user profile. 4. Under the **Roles** tab, click **Edit** and assign the following three roles to the user account: `itil`, `rest_service`, and `x_pd_integration.admin`. Click **Save**.  *Add roles* The user account requires permissions to make API requests so that PagerDuty can create incidents in ServiceNow and manage existing incidents. If your ServiceNow instance allows all users to perform REST API calls, the `itil` and `x_pd_integration.admin` roles are sufficient. If REST API access is restricted by role, assign the required role, such as `snc_platform_rest_api_access` or `rest_service`. 5. Verify the following prerequisites are complete: - A default PagerDuty user account exists for ServiceNow. - An API key exists in PagerDuty. - A ServiceNow user account exists for the PagerDuty integration. - The accounts map to each other via their shared email address and PagerDuty User ID. Click **Update** to save the user record in ServiceNow. #### Configure PagerDuty Settings in ServiceNow 1. Navigate to **PagerDuty** → **Configuration** → **PagerDuty Settings**. If prompted, switch to the PagerDuty application scope to make the page editable.  *PagerDuty settings* 2. Configure the following fields on the configuration page: | Field | Value / Instruction | | :----------------------------------------------------------------- | :------------------------------------------------------------------------------------------------------------------------------------------------------------- | | **ServiceNow user for authentication** | Enter the user ID of the new ServiceNow user (must be all lowercase) | | **ServiceNow user password for authentication** | Enter the password of the new ServiceNow user | | **PagerDuty account URL** (`https://subdomain.pagerduty.com`) | Enter your PagerDuty subdomain URL (e.g., `https://subdomain.pagerduty.com`) | | **PagerDuty API access key** | Enter the API key generated in the previous section | | **Default Service ID** | Enter a seven-character PagerDuty service ID starting with `P`, or click **Provision default service** | | **Default User ID** | Enter the seven-character alphanumeric PagerDuty user ID starting with `P` from the previous section, or click **Provision default user** | | **REST API Endpoint** | Leave as the default value: `https://api.pagerduty.com` | Click **Save**. 3. Click **Actions** → **Test REST API Connection**. A successful integration configuration returns a `Connection test successful (200)` response. 4. Click **Actions** → **Test ServiceNow User Authentication**. A successful account configuration returns a `ServiceNow user authentication test successful (200)` response. 5. Click **Test Default User Settings**. A successful configuration returns a series of success messages. If the test fails, follow the on-screen instructions to make adjustments. #### Add the ServiceNow Extension to an Existing PagerDuty Service To create a new service, skip this section and proceed to [Review PagerDuty Settings in ServiceNow](#review-pagerduty-settings-in-servicenow). ##### Option 1: Manually Configure the Extension in PagerDuty *This option requires access to the username and password of the ServiceNow account used by PagerDuty.* 1. In your PagerDuty account, navigate to **Services** → **Service Directory**. Click the service **name**, select the **Integrations** tab, and select **Add or manage extensions** → **New Extension**. 2. In the **Extension Type** field, search for and select **ServiceNow (v7)**. 3. Enter a **Name** using the format `servicenow-service-name` (e.g., `servicenow-shopping-cart`). 4. Configure the remaining fields using the following table: | Field | Value / Instruction | | :---------------------------------------------- | :-------------------------------------------------------------------------------------------------------------------------------------------------------- | | **ServiceNow URL** | Enter the URL in this format: `https://[INSTANCE-NAME].service-now.com/api/x_pd_integration/pagerduty2sn` | | **ServiceNow User ID and ServiceNow Password** | Enter the credentials created in the **Create a ServiceNow User Account for Webhook Authentication** section | | **Sync Options** | Select **Sync All Incidents** to sync all new incidents, or select **Manually Sync Incidents** to manage sync preferences via the incident details page | | **Incident Type** | Select **Incident** to create standard incidents, or select **Security Incident** to generate ServiceNow Security Incidents | 5. Click **Save**. ##### Option 2: Use the ServiceNow Integration to Provision the PagerDuty Extension *This option requires the `x_pd_integration.admin` role in ServiceNow to provision the extension without providing account credentials directly to PagerDuty.* 1. Review the configuration on the **PagerDuty Settings** page to determine how ServiceNow maps to PagerDuty: - If mapping assignment groups only, navigate to the specific assignment group you want to map. - If mapping configuration items, navigate to the specific configuration item you want to map. 2. Open the record in ServiceNow. Ensure the **PagerDuty Service** field is blank, which indicates the object does not yet map to PagerDuty. 3. In your web browser, navigate to PagerDuty, select **Services** → **Service Directory**, and click into your service. Copy the seven-character **Service ID** starting with `P` from the URL bar. 4. In ServiceNow, paste this value into the **PagerDuty Service** field and click **Save**. Reopen the record if you are redirected to a list view. 5. Scroll to the **Related Links** section and click **Provision Webhook**. This creates the corresponding extension in PagerDuty and establishes the mapping. #### Review PagerDuty Settings in ServiceNow Review and configure global integration behaviors by navigating to **PagerDuty** → **Configuration** → **PagerDuty Settings**: | Settings Category | Options and Descriptions | | :----------------------- | :-------------------------------------------------------------------------------------------------------------------------------------------------------------------------------------------------------------------------------------------------------------------------------------------------------------------------------------------------------------------------------------------------------------------------------------------------------------------------------------------------------------------------------------------------------------------------------------------------------------------------------------------------------------------------------------------------------------------------------------------------------------------------------------------------------------------------------------------------------------------------------------------------------------------------------------------------------------------------------------------------------------------------------------------------------------------------------------------------------------------------------------------------------------------------------------------------------------------------------------------------------------------------------------------------------------------------------------------------------------------------------------------------------------------------------------------------------------------------------------------------------------------------------------------------------------------------------------------------------------------------------------------------------------------------------------------------------------------------------------------------------------------------------------------------------------------------------------------------------------------------------------------------------------------------------------------------------------------------------------------------------------------------------------------------------------------------------------------------------------------------------------------------------------------------------------------------------------------------------------------------------------------------------------------------------------------------------------------------------------------------------------------------------------------------------------------------------------------------------------------------------------------------------------------------------------------------------------------------------------------------------------------------------------------------------------------------------------------------------------------------------------------------------------------------------------------------------------------------------------------------------------------------------------------------------------------------------------------------------------------------------------------------------------------------------------------------------------------------------------------------------- | | **Integration Behavior** | - **Choose ServiceNow to PagerDuty mapping**: Select whether assignment groups map to PagerDuty, or if configuration items and assignment groups map to PagerDuty. Learn more in the [Choose How ServiceNow Objects Map to PagerDuty Objects](#choose-how-servicenow-objects-map-to-pagerduty-objects) section.
- **Incident state value to use when PagerDuty resolves an incident**: Select the integer value associated with the Resolved state in ServiceNow. Update this field if you use a customized value.
- **Resolve PagerDuty incident if ServiceNow incident is assigned to a group that does not exist in PagerDuty**: Choose whether a PagerDuty incident resolves if assigned to an unmapped group. This applies if some ServiceNow groups do not map to PagerDuty escalation policies.
- **Create a new PagerDuty user if one is not found with the ServiceNow user's email**: Auto-provision ServiceNow users to PagerDuty when they are assigned to or manage an incident. This action can affect billing.
- **Do not assign the ServiceNow incident until a PagerDuty user has acknowledged the incident**.
- **Provision current Assignment Group members into PagerDuty when provisioning Assignment Groups**: Auto-provisions group members when an assignment group provisions to PagerDuty.
- **Create PagerDuty Schedule when provisioning Assignment Groups**: Automatically creates a schedule for provisioned groups, adding the group manager to the schedule. Additional users must be added in PagerDuty.
- **Use PagerDuty teams**: Enables PagerDuty Teams functionality alongside assignment groups.
- **Create PagerDuty Team when provisioning Assignment Groups**: Automatically creates a PagerDuty team and provisions the group manager, even if group member auto-provisioning is disabled. If no manager is assigned, the user executing the provisioning is set as manager.
- **Enable Response Mobilizer**: Allows you to add responders from the ServiceNow interface. This requires the separately purchased Modern Incident Response add-on product.
- **Enable Conference Bridges**: Allows you to add conference bridge information from the ServiceNow interface. This requires the separately purchased Modern Incident Response add-on product.
- **Enable Response Play feature (Deprecated)**: Allows response plays to run from ServiceNow. This feature is deprecated starting with version 7.9; use Incident Workflows instead.
- **Enable Incident Workflows feature**: Allows incident workflows to run from ServiceNow. Learn more in the [Incident Workflows](/ai-automation/automation/incident-workflows) documentation.
- **Enable Status Update Feature**: Allows sending status updates to the PagerDuty Status Dashboard from ServiceNow. This requires a Business, Digital Operations (legacy), or Enterprise plan.
- **Customize PagerDuty Incident Body**: Define the body text format for PagerDuty incidents created from ServiceNow using column variables from the `incident` table and `{workNote}`. | | **PagerDuty Settings** | - **Choose ServiceNow to PagerDuty mapping**: Your PagerDuty subdomain URL (e.g., `yoursubdomain.pagerduty.com`).
- **PagerDuty API access key**: The API key used to authenticate with the PagerDuty REST API.
- **Default Service ID**: Paste a seven-character PagerDuty service ID starting with `P` here, or click **Provision default service** to generate one.
- **Default User ID**: The account used for API requests when the active ServiceNow user does not exist in PagerDuty. You can input an existing ID or click to provision one. Omitting this field can cause incident creation failures for unprovisioned users.
- **REST API Endpoint**: Leave as the default value: `https://api.pagerduty.com`. | | **ServiceNow Settings** | - **ServiceNow user for authentication**: The username PagerDuty uses to deliver webhooks.
- **ServiceNow user password for authentication**: The password for the webhook delivery user.
- **ServiceNow REST endpoint for webhook callback**: Defines the path PagerDuty uses to send webhooks. The default value is recommended. | | **Legacy Settings** | - **Logging verbosity level**: Adjust log details for the integration. The default is `info`. Change to `debug` for active troubleshooting. | #### Choose How ServiceNow Objects Map to PagerDuty Objects The **Choose ServiceNow to PagerDuty mapping** option supports two structural mappings: - **ServiceNow Assignment Groups map to PagerDuty** - Assignment groups map directly to both a PagerDuty service and a PagerDuty escalation policy. - **ServiceNow Configuration Items and Assignment Groups map to PagerDuty** - Configuration items map to PagerDuty services. - Assignment groups map to PagerDuty escalation policies. The following diagram illustrates object mappings when configuration items and assignment groups map to PagerDuty: 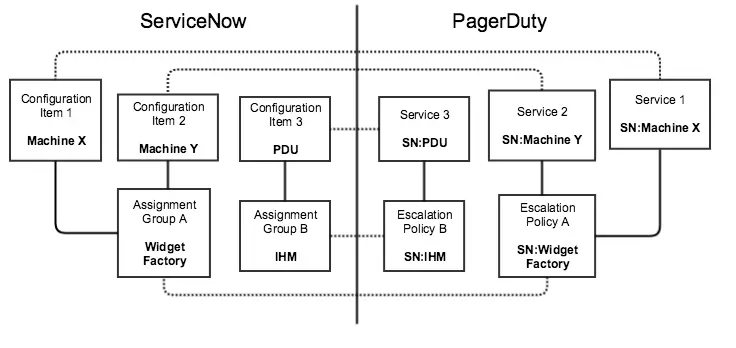 *Object mapping diagram* ## Provision From ServiceNow to PagerDuty To establish a bi-directional sync, you must provision at least one assignment group into PagerDuty. Converted assignment groups create the PagerDuty services and escalation policies where ServiceNow incidents trigger. You can optionally provision configuration items, services, users, and priorities. ### Provision Assignment Groups to PagerDuty Each assignment group corresponds to a PagerDuty escalation policy to ensure correct routing. Provisioned groups receive a default escalation policy, and you can map additional escalation policies to specific ServiceNow incident priorities. Depending on your configuration, certain attributes do not map: - If assignment groups map directly to PagerDuty, each group receives a PagerDuty escalation, service, and webhook ID. Schedule and team IDs are optional. - If configuration items and assignment groups map to PagerDuty, each group receives only an escalation ID (and optional schedule or team IDs). The service and webhook IDs map to configuration items instead. > **User Requirement:** The user executing provisioning actions must have a valid PagerDuty user ID attached to their user record in ServiceNow. 1. Navigate to **User Administration** → **Groups** and click the assignment group you want to provision. 2. Click **Provision Group into PagerDuty**.  *Provision assignment groups to PagerDuty* 3. A notification indicates group creation is underway. When complete, the **PagerDuty service**, **PagerDuty escalation**, and **PagerDuty webhook** fields populate within the record. Schedule and team IDs also populate if enabled in the settings. 4. To provision multiple groups at once, navigate to the Groups list view, select the checkboxes next to the desired groups, click the dropdown menu at the bottom of the list, and select **Provision Group into PagerDuty**.  *Select Provision Group into PagerDuty from the dropdown menu* 5. Review the **Sync Group Members with PagerDuty** setting for the provisioned groups. When enabled, the integration checks if new group members have a PagerDuty account. If no account is found, the integration provisions them and adds them to the associated PagerDuty team.  *Review settings for Sync Group Members with PagerDuty* ### Provision Configuration Items and Users to PagerDuty > **Configuration Note:** If you selected **Assignment Groups map to PagerDuty** in the configuration settings, skip this step. You do not need to provision configuration items. To provision configuration items and users, follow the instructions in the [Advanced ServiceNow Configuration](/integrations/servicenow-integration-guide/advanced-servicenow-configuration) guide. ## Step 5: Test the Integration 1. Navigate to **PagerDuty Incidents** in the application navigator and click **New**. 2. Configure the test incident with the following values: | Field | Value | | :-------------------- | :------------------------------------------------------------ | | **Caller** | Select the ServiceNow user mapped to your PagerDuty account | | **Short description** | Enter an incident title | | **Assignment Group** | Select an assignment group that maps to PagerDuty | Click **Submit**. 3. Verify that the incident appears in your PagerDuty account under the service mapped to the assignment group. The activity log tracks updates, such as group reassignments.  *Example incident* When you resolve the incident in PagerDuty, it resolves in ServiceNow, and vice versa. To ensure optimal system performance when querying tables, database administrators should index the following columns in ServiceNow: - `incident.x_pd_integration_incident` - `sys_user_group.x_pd_integration_pagerduty_escalation` - `sys_user.x_pd_integration_pagerduty_id` - `cmdb_ci.x_pd_integration_pagerduty_service` > **ServiceNow User Guide:** Once initial configuration is complete, see our [ServiceNow User Guide](/integrations/servicenow-integration-guide/servicenow-user-guide) for active operational instructions. ## Configure the ServiceNow Change Events Integration To send ServiceNow change requests to PagerDuty as change events, follow the [ServiceNow Change Requests Integration Guide](/integrations/servicenow-integration-guide/servicenow-change-requests-integration-guide). ## Configure Escalation Policy Priority Mapping You can assign multiple escalation policies to a single assignment group based on incident priority. You can configure this feature via the PagerDuty menu or on an individual assignment group record. ### Configure Priority Mapping via the PagerDuty Menu 1. Navigate to **PagerDuty** → **Map Priority to Escalation Policy** and click **New**. 2. Configure the mapping using the following table: | Field | Value / Instruction | | :-------------------- | :--------------------------------------- | | **Assignment Group** | Select the target assignment group | | **Escalation Policy** | Select the PagerDuty escalation policy | | **Priority** | Select the ServiceNow priority to map | | **Active** | Check this box | Click **Submit**. 3. To deactivate a mapping, return to the **Map Priority to Escalation Policy** list view, click the status in the **Active** column, uncheck the **Active** box, and click **Update**. ### Configure Priority Mapping on an Individual Assignment Group 1. Open the preferred assignment group record. 2. Select the **PagerDuty Escalation Policies** tab and click **New**. 3. Configure the mapping using the following table: | Field | Value / Instruction | | :-------------------- | :------------------------------------------------------ | | **Escalation Policy** | Search for and select the PagerDuty escalation policy | | **Priority** | Search for and select the target ServiceNow priority | | **Active** | Check this box | Click **Submit**. ## Author Custom Code for Outbound API Calls 1. Navigate to **PagerDuty Settings** and scroll to the **PagerDuty API requests customization** section. 2. Enter your custom headers, inputting one header per line without quotes (e.g., `name: value`). 3. Click **Save**. ## Configure a MID Server MID server support is optional. 1. Navigate to **PagerDuty** → **PagerDuty Settings**. 2. Under the **PagerDuty API requests customization** section, configure the following fields: | Field | Value / Instruction | | :----------------- | :--------------------------------------- | | **Use MID Server** | Check this box | | **Set MID Server** | The default MID server auto-populates | | **ECC parameters** | Enter your parameter values | 3. Click **Save**. ## Upgrade Your PagerDuty Integration 1. Revert app customizations prior to upgrading, as the upgrade path does not patch modified files. Capture customizations in an update set and store a copy for reference before reverting to out-of-the-box versions. 2. Upgrade the PagerDuty application to the newest version in the ServiceNow Store. 3. Navigate to **System Diagnostics** → **Upgrade History** and select the PagerDuty upgrade log. 4. Review the **Skipped Changes to Review** tab. For any Priority 1 or Priority 2 high-priority files, click the **File name** and select **Revert to Base System** on the details page. This overrides the local customizations that prevented the upgrade. Leave lower-priority skipped files as they are. 5. Navigate to the **PagerDuty Settings** page and run both **Test REST API Connection** and **Test ServiceNow User Authentication** to confirm a `success (200)` status code. 6. Run the **Migrate Webhooks to v7** script. 7. Run the **MIGRATE Escalation Policies to…** script to migrate mappings into the new table with empty priority values for default escalation policies. 8. Review your captured update set and reapply required customizations. --- URL: https://docs.pagerduty.com/integrations/slack-integration-guide # Slack Integration Guide | PagerDuty Connect Slack to PagerDuty to manage incidents, receive notifications, and use PagerDuty AI directly from Slack channels. ## Slack + PagerDuty Integration Benefits - Collaborate seamlessly while managing PagerDuty incidents `end-to-end` from [dedicated channels](/integrations/slack-integration-guide/slack-user-guide#dedicated-incident-channel). - Increase awareness of active incidents by receiving notifications in Slack, either by pre-configured [service/team channel connections](#configure-the-slack-integration), or [notification channels](/integrations/slack-integration-guide/slack-user-guide#notification-channel). - Look up who is `on-call`, create Insights reports and manage the integration. - [Take action](/integrations/slack-integration-guide/slack-user-guide#available-actions) on your incident, all without leaving Slack. - Declare, acknowledge, escalate and resolve PagerDuty incidents. - Run Incident Workflows, send status updates, assign roles and delegate tasks. - Save time by leveraging [PagerDuty AI GenAI](/ai-automation/advance#pagerduty-ai-benefits) capabilities. - Efficiently getting context (for example, @PagerDuty what changed?). - Generating status updates (for example, @PagerDuty draft a status update). - Summarizing the incident after resolution for `post-incident reviews`. - Easily build [`post-incident reviews`](/incident-management/after-incident/post-incident-reviews) by importing Slack data for analysis. ## Requirements **In PagerDuty**: - **Initial Configuration**: This integration requires an Admin, Global Admin or Account Owner base role to perform the [initial configuration](#initial-configuration). This includes mapping your PagerDuty account to your Slack workspace. - **Slack Connection Management**: Once your PagerDuty account has been mapped to your Slack workspace (see the previous section) Team Managers, Admins and Account Owners can [configure channels](#configure-the-slack-integration) for a PagerDuty service. - **Using the Integration**: For users to be able to perform PagerDuty actions from within Slack or create new channel connections on the PagerDuty side, users must first link their PagerDuty and Slack user accounts. Actions such as acknowledging, resolving, viewing incident details, adding a note, escalating or running an Incident Workflow follow the PagerDuty [user permissions](/account-admin/advanced-permissions) for each action. - Slack users without PagerDuty licenses can create incidents through either [unlinked user access](/integrations/slack-integration-guide/slack-user-guide#create-incidents-as-an-unlinked-slack-user) or a [Slack workflow](/integrations/slack-integration-guide/slack-user-guide#create-an-incident-declaration-slack-workflow). - The Slack integration is supported for both US and EU service regions. **PagerDuty AI** - We support PagerDuty AI's features for the following [service regions](/get-started/service-regions): - [PagerDuty AI Assistant](/ai-automation/advance/user-guide#pagerduty-ai-assistant): US and EU service regions - [PagerDuty AI for Status Updates](/ai-automation/advance/user-guide#pagerduty-ai-for-status-updates): US and EU service regions - [PagerDuty AI for Automation Digest](/ai-automation/automation/automation-actions#pagerduty-ai-for-automation-digest): US and EU service regions - [PagerDuty AI for Post-Incident Reviews](/ai-automation/advance/user-guide#pagerduty-ai-for-post-incident-reviews): US service regions - [AI Generated Runbooks](https://docs.rundeck.com/docs/manual/jobs/ai-generated-runbooks.html) (Early Access): US service region only **In Jeli** - Admin permissions are required to manage integrations in Jeli. - Jeli is available for accounts in the US service region only. **In Slack**: - To install the PagerDuty application, you need to be a workspace admin or owner. ## How It Works The Slack integration is organized around three channel types, each configured from its own tab on the Slack configuration page: - **Dedicated channels** — Unique channels created for each incident, so your work and context are centralized in one place. When an incident happens, you can jump in and get to work. - **Notification channels** — Channels that receive incident updates based on rules. Notification channels make it easy for responders to monitor incidents by service, team, and more. - **Announcement channels** — Channels used to broadly announce incidents to stakeholders, leadership, and customer-facing teams, based on rules. Announcement channels make it easy to update stakeholders on new and in-progress incidents. You can declare, acknowledge, resolve, and perform [other actions](/integrations/slack-integration-guide/slack-user-guide#available-actions) within Slack. When you configure a channel for a service or team, an incident card is automatically sent to the designated channel whenever an incident is declared for that service or team. You can then perform actions within Slack, or within PagerDuty, and the actions are synced `bi-directionally`. You can interact with PagerDuty AI for a broad range of `incident-related tasks`, such as catching up on an incident's status and drafting status updates. After resolving an incident, you have the option to create a [Post-Incident Review](/incident-management/after-incident/post-incident-reviews). See the [PagerDuty Privacy Policy](https://www.pagerduty.com/privacy-policy/) to read more about how we collect, use and disclose your information. ## Integration Walkthrough ### Initial Configuration 1. Map your PagerDuty account to your Slack Workspace. In PagerDuty, navigate to **Integrations** → **Extensions**. Select the **Slack** tile at the top. - If prompted, click **Authorize Integration**. 2. On the Slack Workspaces mapping screen, click **Add Workspace** to connect your PagerDuty account to your Slack workspace. Connecting your PagerDuty account to your Slack workspace ensures that the PagerDuty bot is present and that PagerDuty slash commands can be executed from any Slack channel. 3. Ensure the correct workspace is selected in the dropdown. 4. Click **Allow** to authorize. Once this step is complete, configure your channels from the Slack configuration page. See [Configure the Slack Integration](#configure-the-slack-integration). ### Configure the Slack Integration > **Required User Permissions:** You will only be able to configure channels that you have Slack permissions for. If you do not have the appropriate Slack permissions for a channel, it will not appear in search results. If you need permissions to access a Slack channel, contact your Slack administrator. > **Private Slack Channels:** If you connect a _private_ Slack channel, the PagerDuty app (**@pagerduty**) will be automatically added to the channel. If the PagerDuty app is thereafter manually removed from that channel, it will cause the automatic deletion of the connection between the PagerDuty service or team and that Slack channel, and no subsequent incident notifications will be received in the channel. Configure each channel type from the Slack configuration page (**Integrations** → **Extensions** → **Slack** → **your workspace**). The page has four tabs: - **Dedicated Incident Channel** - **Notification Channels** - **Announcement Channels** - **Advanced Options** > **Link Your Account:** You must link your PagerDuty and Slack accounts to manage this integration. If your accounts are not linked, click **Link Account** in the banner at the top of the configuration page. #### Dedicated Incident Channel On the **Dedicated Channel** tab, enable and manage settings for new dedicated channels. All dedicated channels have their incident details pinned to the top. | Field | Value | | :------------------------------------------- | :---------------------------------------------------------------------------------------------------------------------------------------------------------------------------------------------- | | **Channel name** | Set the naming convention for new dedicated channels (for example, `#inc-{{incident.incident_number}}`). | | **Automatically create dedicated channels** | Toggle on to auto-create channels for new incidents, based on conditions. | | **Auto-update dedicated channel topic** | Toggle on to keep the channel topic up to date with details such as the current assignee. You can also add custom logic with workflows. | | **Include a link to incident details** | Toggle on to add a channel bookmark that jumps to the incident details in PagerDuty. You can also add custom bookmarks with workflows. | | **Incident updates** | Select which types of updates to send to the channels. | | **Thread incident updates** | Toggle on to add all updates to a thread and reduce clutter. | > **Disable Automatic Dedicated Channels:** To stop PagerDuty from automatically creating dedicated channels, go to **Integrations** → **Extensions** → **Slack** → **Workspace**→ **Dedicated Channel** tab and toggle off **Automatically create dedicated channels**.  *Dedicated Channel - Channel Settings* #### Notification Channels On the **Notification Channels** tab, send updates to specific channels based on rules. Notification channels make it easy for responders to monitor incidents by service, team, and more. Rules are driven by orchestration: parameters defined in the event payload — such as the priority of an incident — can determine whether an incident is declared and routed to a notification channel.  *Edit Notification Channel Settings* #### Announcement Channels On the **Announcement Channels** tab, broadly announce incidents to different channels based on rules. Announcement channels make it easy to update stakeholders on new and in-progress incidents. Rules determine when an announcement is sent. For example, when an incident matches a high-priority rule, an announcement channel can be created and the incident broadcast to it. Those rules can be changed. 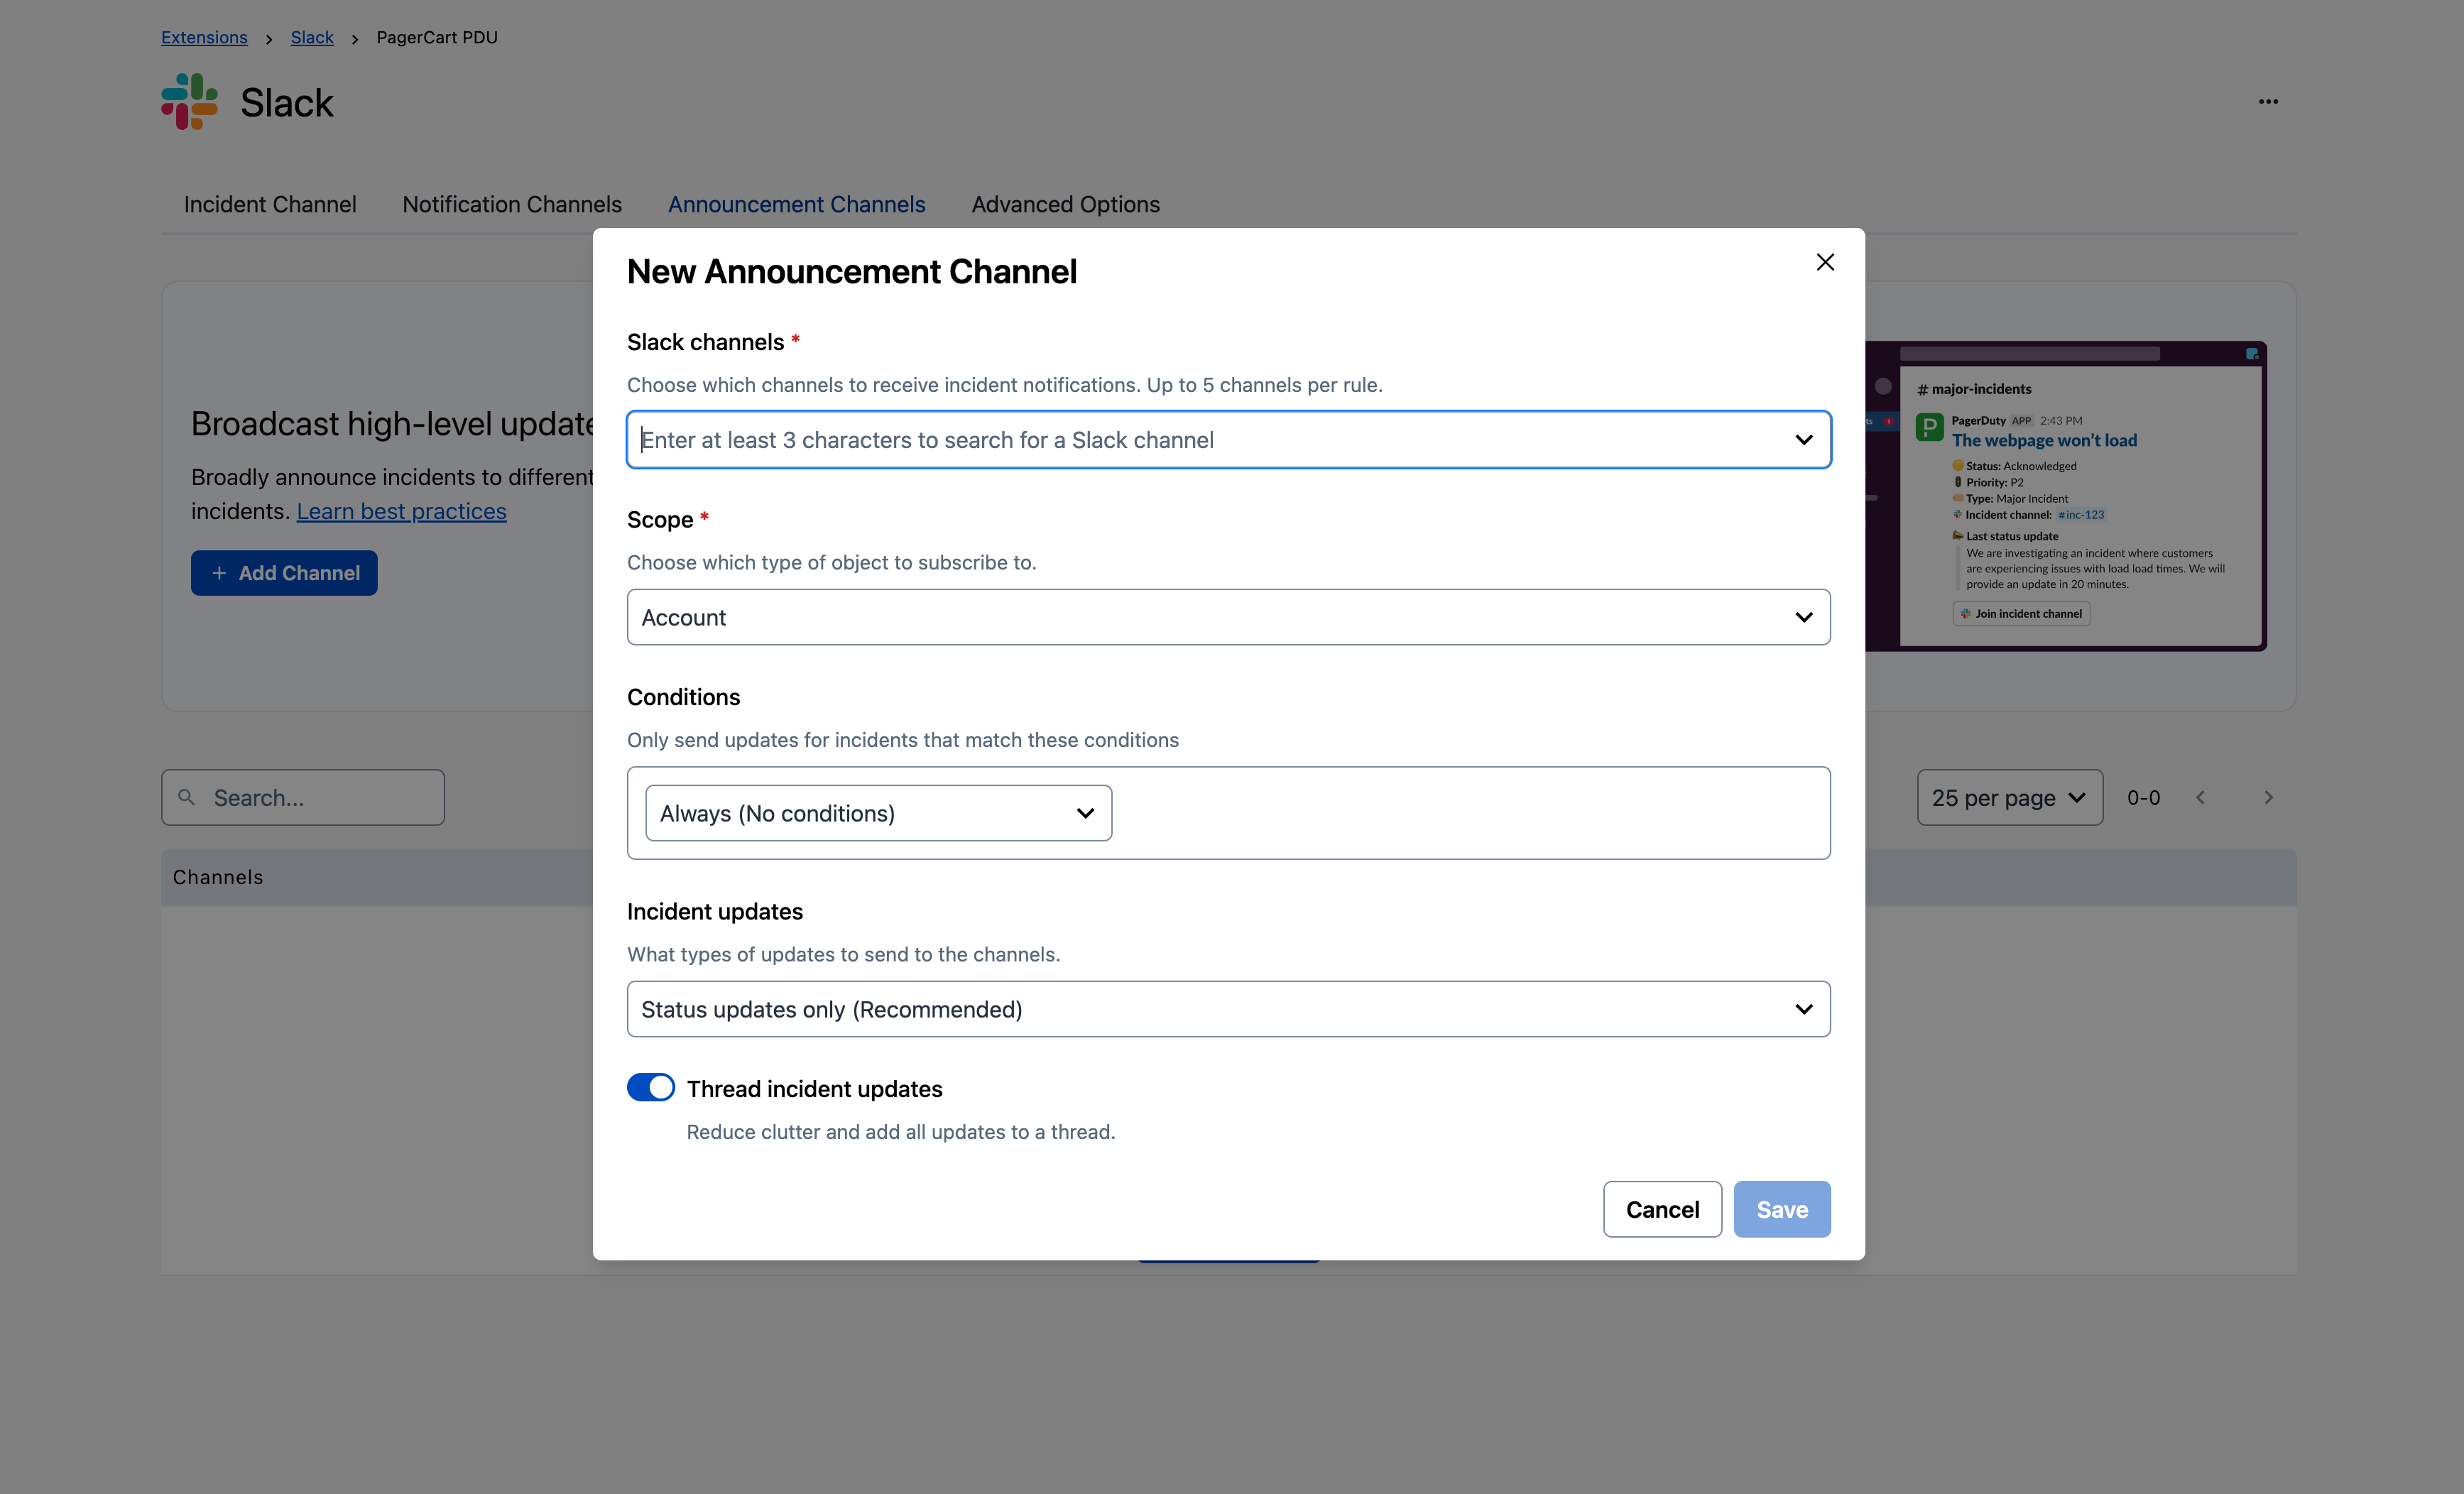 *Create an Announcement Channel* #### Advanced Options On the **Advanced Options** tab, configure general settings for the integration. ##### General Settings | Setting | Description | | :-------------------------------------------------------- | :-------------------------------------------------------------------------------------------------------------------------------------------------------- | | **Allow any Slack user to declare incidents on services** | By default, only Slack users with a linked PagerDuty account can declare an incident. Toggle on to allow any Slack user to declare incidents on services. | | **Enable rich previews for PagerDuty incident links** | Unfurls links to PagerDuty incidents with rich previews, additional details, and interactive buttons. | | **Display emojis in incident notifications** | Toggle on to display emojis next to fields in all incident notifications in Slack. | | **Hide Create/Join Dedicated Channel Button** | Toggle on to hide the Create/Join Dedicated Channel button from the incident card in Slack. | | **Mention assignees in incident card notifications** | Toggle on to @mention and notify a user in Slack when they acknowledge an incident. When off, users who acknowledge are not mentioned or notified. | ##### App Permissions There are four sets of optional scopes you may enable, depending on which PagerDuty platform features you intend to use. These scopes allow access to Slack chat messages, and read uploaded files enriching [PagerDuty AI](/ai-automation/advance) "catch me up" and "wrap me up" incident summaries, status updates, and proactive incident messages. They also enable you to connect our Slackbot to the PagerDuty MCP server to bring incident context and actions straight into your Slack conversations — see what's happening and respond, without switching tools. By enabling `Shared files` on the Slack configuration page, we will request one additional scope. The permission is disabled by default when a Slack workspace is added. | OAuth Scope | Slack Description | PagerDuty Request Reason | | :----------- | :------------------------------------------------------------------------------------ | :------------------------------------------------------------------------------------------------- | | `files:read` | View files shared in channels and conversations that your Slack app has been added to | Used to read and analyze files to provide enhanced incident response and platform recommendations. | By enabling `Chat messages`, we will request three additional scopes: | OAuth Scope | Slack Description | PagerDuty Request Reason | | :----------------- | :------------------------------------------------------------------------------------------- | :---------------------------------------------------------------------------------------------------------------------------------------------------------------- | | `channels:history` | View messages and other content in public channels that the PagerDuty app has been added to. | Used to ingest Slack messages into PagerDuty for use as evidence in `post-incident reviews` and to improve incident summaries with relevant conversation details. | | `reactions:read` | View emoji reactions in channels and conversations that the PagerDuty app has been added to. | Used to display emoji reactions when ingesting Slack messages as evidence for `post-incident reviews`. | | `reactions:write` | Add and edit emoji reactions. | When users make certain requests to the PagerDuty Slack app, the application responds with an emoji to indicate the request has been received. | By enabling `Private channel ingestion` on the Slack configuration page, we will request one additional scope: | OAuth Scope | Slack Description | PagerDuty Request Reason | | :--------------- | :-------------------------------------------------------------------------------------------- | :-------------------------------------------------------------------------------------------------------------------------------------------------------------------------------------- | | `groups:history` | View messages and other content in private channels that the PagerDuty app has been added to. | Used to ingest Slack messages from private channels into PagerDuty for use as evidence in `post-incident reviews` and to improve incident summaries with relevant conversation details. | By enabling `PagerDuty MCP` on the Slack configuration page, we will request the following scope: | OAuth Scope | Slack Description | PagerDuty Request Reason | | :------------ | :----------------------------------------------------- | :---------------------------------------------------------------------------------------------------------------------------------------------- | | `mcp:connect` | Allow PagerDuty slackbot to connect to PagerDuty MCP. | Bring incident context and actions straight into your Slack conversations — see what's happening and respond, without switching tools. | > **Disable App Permissions:** Only Slack admins can disable Slack workspace permissions. ##### Danger Zone From here you can disconnect the Slack workspace from PagerDuty. Stops all notifications, messages, automations, and integrations to Slack. This cannot be undone. #### Presets Presets control which incident events post to a channel. Set a preset for each channel type from its tab on the Slack configuration page. The preset replaces the individual selections in the **Incident updates** field. | Preset | Available on | Events posted | | :---------------------- | :--------------------------------------------------------------------- | :-------------------------------------------------------------------------------------------------------------------------------------------------------------------------------- | | **Highlights Only** | All channel types — default for the incident (dedicated) channel | Incident triggered, Incident acknowledged, Incident resolved, Incident reopened, Note added, Priority updated, Incident type updated, Automation action started / updated / ended | | **Status Updates Only** | All channel types — default for notification and announcement channels | Incident triggered, Incident resolved, Status update published | | **No Updates** | All channel types | Incident triggered | | **All Updates** | All channel types | Every event, including all selectable events | | **Custom** | Notification and announcement channels only | A user-defined combination of any selectable events | 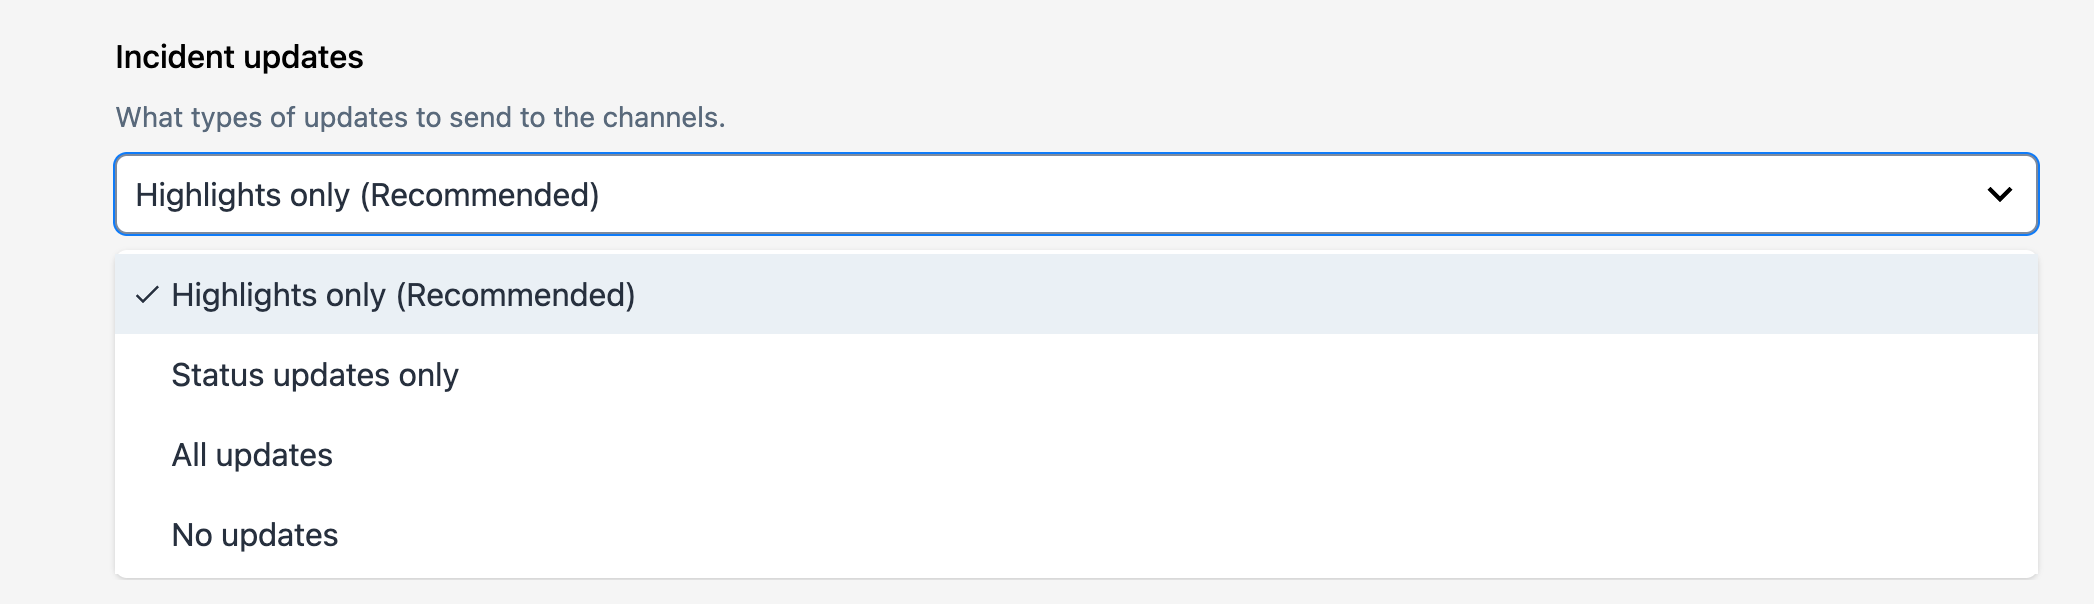 *Incident Updates - Presets* ##### Selectable Events The **All Updates** and **Custom** presets draw from the full set of selectable events: - Incident triggered - Incident acknowledged - Incident unacknowledged - Incident escalated - Incident delegated - Incident resolved - Incident reopened - Responder added - Responder replied - Note added - Priority updated - Status update published - Incident type updated - Automation action started / updated / ended - Task created (requires the incident tasks feature) - Task assignee, description, name, or status changed (requires the incident tasks feature) - Task completed (requires the incident tasks feature) - Role assigned to responder (requires the incident roles feature) > **Dedicated Channel Creation Notices:** When a dedicated incident channel is created, a short message linking to the new channel — for example, `Dedicated channel #inc-123-something created` — is posted to your notification and announcement channels. This notice is independent of the preset you select, and it is not posted inside the dedicated channel itself. #### Via Slack Command Navigate to your preferred **Slack channel**, enter the `/pd connect` command and make selections in the following fields based on your preferences:
| Field | Value |
|---|---|
| Choose a PagerDuty account | Select your **PagerDuty account** from the dropdown. |
| Connect service or team to `[CHANNEL-NAME]` | Search and select the **service** or **team** that you would like to connect to the channel. |
| How do you want to be notified? | Select the radio button for your preferred notification type: - **Responder**: Notifications include buttons for users to acknowledge, resolve, and take other actions on incidents. - **Stakeholder**: Notifications do not include any buttons to take action on incidents. |
> **This Action Cannot Be Undone:** If you would like to reconnect your workspace to PagerDuty, follow the instructions in the [Integration Walkthrough](#integration-walkthrough) again. ## PagerDuty Slack Integration API View our developer documentation for more information about the [PagerDuty Slack Integration API](/developer/api/reference/integration-slack/slack-dedicated-channels/get-dedicated-channel). ## Slack User Guide Read our [Slack User Guide](/integrations/slack-integration-guide/slack-user-guide) for more information about using the integration after it has been configured. ## Add a Slack Contact Method Once the [Slack integration has been configured](#integration-walkthrough), you can add Slack as an incident contact method. See our [Contact Information](/account-admin/user-profile/contact-information#add-a-slack-contact-method) article for more information. ## PagerDuty Advance AI Disclosure To learn more about how we designed, built, and assessed [PagerDuty AI](/ai-automation/advance) with mission-critical work in mind, you can access the PagerDuty Advance AI Disclosure by following these instructions: 1. Visit PagerDuty's [Assurance Profile](http://assurance.pagerduty.com). 2. In the **Documents** section of the page, click the **Public** tab to see the **PagerDuty Advance AI Disclosure** document. 3. Click **Download** while hovering over the document tile. > **PagerDuty Guidelines for the Safe and Secure Use of Generative AI:** Generative AI is a predictive technology, and sometimes the information it creates can be misleading or false. It is the responsibility of each user to `fact-check` the output of generative AI before you use it. See [PagerDuty Guidelines for the Safe and Secure Use of Generative AI](https://www.pagerduty.com/security/generative-ai-guidelines/) for more information. ## FAQ **What file types and limits exist for file upload?** We currently support .txt, .md, .jpg and .png files. One file can be attached to a slack message when the bot is mentioned, and file size can be up to 500Kb maximum. **Why is workspace mapping required?** Workspace mapping connects a PagerDuty account to a Slack workspace. This provides authorization and access to all channels in a workspace and removes the need to authorize connections on a channel by channel, service by service basis. **Can Managers perform the initial setup of a channel/service connection, or access and edit the settings for a connection?** - Users with a Manager role or higher can create and [manage their teams' connections](#slack-connection-management). - A PagerDuty user with an Admin role or higher is required to [connect the PagerDuty account to the Slack Workspace](#initial-configuration) first. **Is there a way to allow `non-PagerDuty users` to declare incidents in Slack?** A PagerDuty admin can enable the **Allow any Slack user to declare incidents on services** option on the **Advanced Options** tab to allow `non-PagerDuty users` to declare incidents from Slack. If this option has not been enabled, unlinked users can still declare incidents using a Slack workflow. See [Create an Incident Declaration Slack Workflow](/integrations/slack-integration-guide/slack-user-guide#create-an-incident-declaration-slack-workflow) for more information. **I changed my channel from public to private, and now my incidents are not posting to Slack.** Invite the PagerDuty bot (`@PagerDuty`) to your Slack channel after you set it to private. **Do I need to install anything else to use slash commands?** No, slash commands are available `out-of-the-box`. To use the `/pd trigger` command, ensure that you have mapped your Slack workspace to PagerDuty (step 4 of the [Integration Walkthrough](#integration-walkthrough)). **Can I add multiple Slack workspaces to a single PagerDuty account?** Yes, you can map multiple workspaces to a single PagerDuty account by repeating the [Initial Configuration](#initial-configuration). **Can I connect a workspace to both a PagerDuty account in the US service region and a PagerDuty account in the EU service region?** Yes, you can map a single workspace to PagerDuty accounts in different regions. You will just need to make sure to run [slash commands](/integrations/slack-integration-guide/slack-user-guide#slash-commands) with the appropriate prefix (`/pd` for US and `/pdeu` for EU). **How do I view `on-call` information in Slack?** Use the command `/pd oncall` to see who is on call. **I am seeing “Slackbot removed an integration from this channel: PagerDuty” in channels after a user was deactivated — did my integration break?** No. This message does not mean the integration is broken or that active configurations have been removed. All `PagerDuty-Slack` connections remain fully intact and functional. **Why this happens** Older, legacy versions of the `PagerDuty-Slack` integration relied on user-dependent [incoming webhooks](https://docs.slack.dev/messaging/sending-messages-using-incoming-webhooks/) managed on the Slack side. When the Slack user who originally authorized and created those legacy webhooks is deactivated, Slack automatically removes the associated resources, which triggers the Slackbot notification. **Current Architecture** The current version of the PagerDuty-Slack integration uses a centralized bot token instead of user-dependent authorization to send messages, and it no longer relies on Slack's incoming webhooks. Because legacy webhook resources could not be programmatically removed during past upgrades, they remained idle in your Slack workspace until the user's deactivation triggered their automatic removal. No action is required on your part, and your active incident workflows will continue to function normally. **Why am I receiving duplicate or repeated incident messages in a Slack channel?** Duplicate messages usually mean that more than one connection is posting to the same channel. Common causes include: - **Multiple connections to the same channel**: A service connection and a team connection can both post to the same channel, sending two messages for each incident. Review the connections for the channel on the Slack configuration page (**Integrations** → **Extensions** → **Slack** → **View**) and remove the connection you do not need. - **A legacy service-level extension**: If a service still has a legacy Slack extension configured alongside the current workspace-level integration, both versions post to the channel. Remove the legacy extension from the service's **Integrations** tab. - **A broad preset**: The **All Updates** preset posts every incident event. If the volume of messages is the issue rather than true duplicates, select a narrower [preset](#presets) such as **Highlights Only** or **Status Updates Only**. **Why do I see “channel not found” when connecting a Slack channel?** A channel that does not appear in search results, or returns "channel not found" when selected, is usually caused by one of the following: - **Slack permissions**: You can only configure channels that you have Slack permissions for. If you need access to a channel, contact your Slack administrator. - **Private channels**: The PagerDuty bot (`@PagerDuty`) must be a member of a private channel before it can be connected. Invite the bot to the channel and try again. - **Pending admin approval**: If your Slack workspace requires admin approval for app changes, new connections cannot be created until a Slack admin approves the request. See [Approve App Update](#approve-app-update). **Where do custom fields come from?** Custom fields are created and configured in the PagerDuty web app, then become available to select on the card template. For more information, visit [Custom Fields on Incidents](/incident-management/incidents/custom-fields-on-incidents). **Why doesn't a custom field appear in Incident Card Customization?** Available custom fields are filtered by incident type. Confirm the field is configured for the incident type you are building the template for. If the field does not exist yet, create it in the PagerDuty web app first — see [Custom Fields on Incidents](/incident-management/incidents/custom-fields-on-incidents). **Why do I see optional scopes and mcp.pagerduty.com when installing the PagerDuty Slack app?** The PagerDuty Slack app lists optional scopes and PagerDuty MCP (`mcp.pagerduty.com`), but it doesn't request those scopes during installation. When you click **Review and Approve for Workspace**, the optional scopes aren't included, so PagerDuty doesn't receive those permissions. PagerDuty can't connect to PagerDuty MCP unless you approve the `mcp:connect` scope, as described in [Slack's documentation](https://docs.slack.dev/reference/scopes/mcp.connect/). PagerDuty requests optional scopes only when you intentionally enable the features that require them. For details, see [App Permissions](#app-permissions). To confirm which scopes PagerDuty has access to, go to your Slack workspace, then **Installed Apps** > **Permissions**.
--- URL: https://docs.pagerduty.com/integrations/slack-integration-guide/slack-permission-changelog # Slack Permission Changelog A dated log of bot token scope additions for the Slack integration, including what each new permission enables users to do. **For more detailed information on all scopes requested by the PagerDuty Slack application, [see the full listing here](/integrations/slack-integration-guide#bot-token-scopes).** ## December 2, 2025 Added the optional bot token scope: `files:read`. This permission gives PagerDuty the ability to read and analyze files to provide enhanced incident response and platform recommendations. We will not request this scopes unless you explicitly opt-in, by enabling the associated settings on the Slack configuration screen in the PagerDuty web application. ## March 10, 2025 Added the following bot token scopes: `assistant:write`, `im:history`. The `im:history` permission gives PagerDuty the ability to read direct messages sent to the PagerDuty app. This can be used to ask the PagerDuty app for help directly, or to interact with PagerDuty within a group direct message. If [PagerDuty AI](/ai-automation/advance) is enabled for your organization, `assistant:write` allows you to interact with Advance using a new messaging interface, interacting with PagerDuty alongside your work in channels and direct messages (DMs). ## February 3, 2025 ### Change Added the following **[optional](/integrations/slack-integration-guide#app-permissions)** bot token scopes: `channels:history`, `groups:history`, `reactions:read`, `reactions:write`. For workspaces connected prior to February 3, 2025, we will not request these scopes unless you explicitly opt-in, by enabling the associated settings on the Slack configuration screen in the PagerDuty web application. 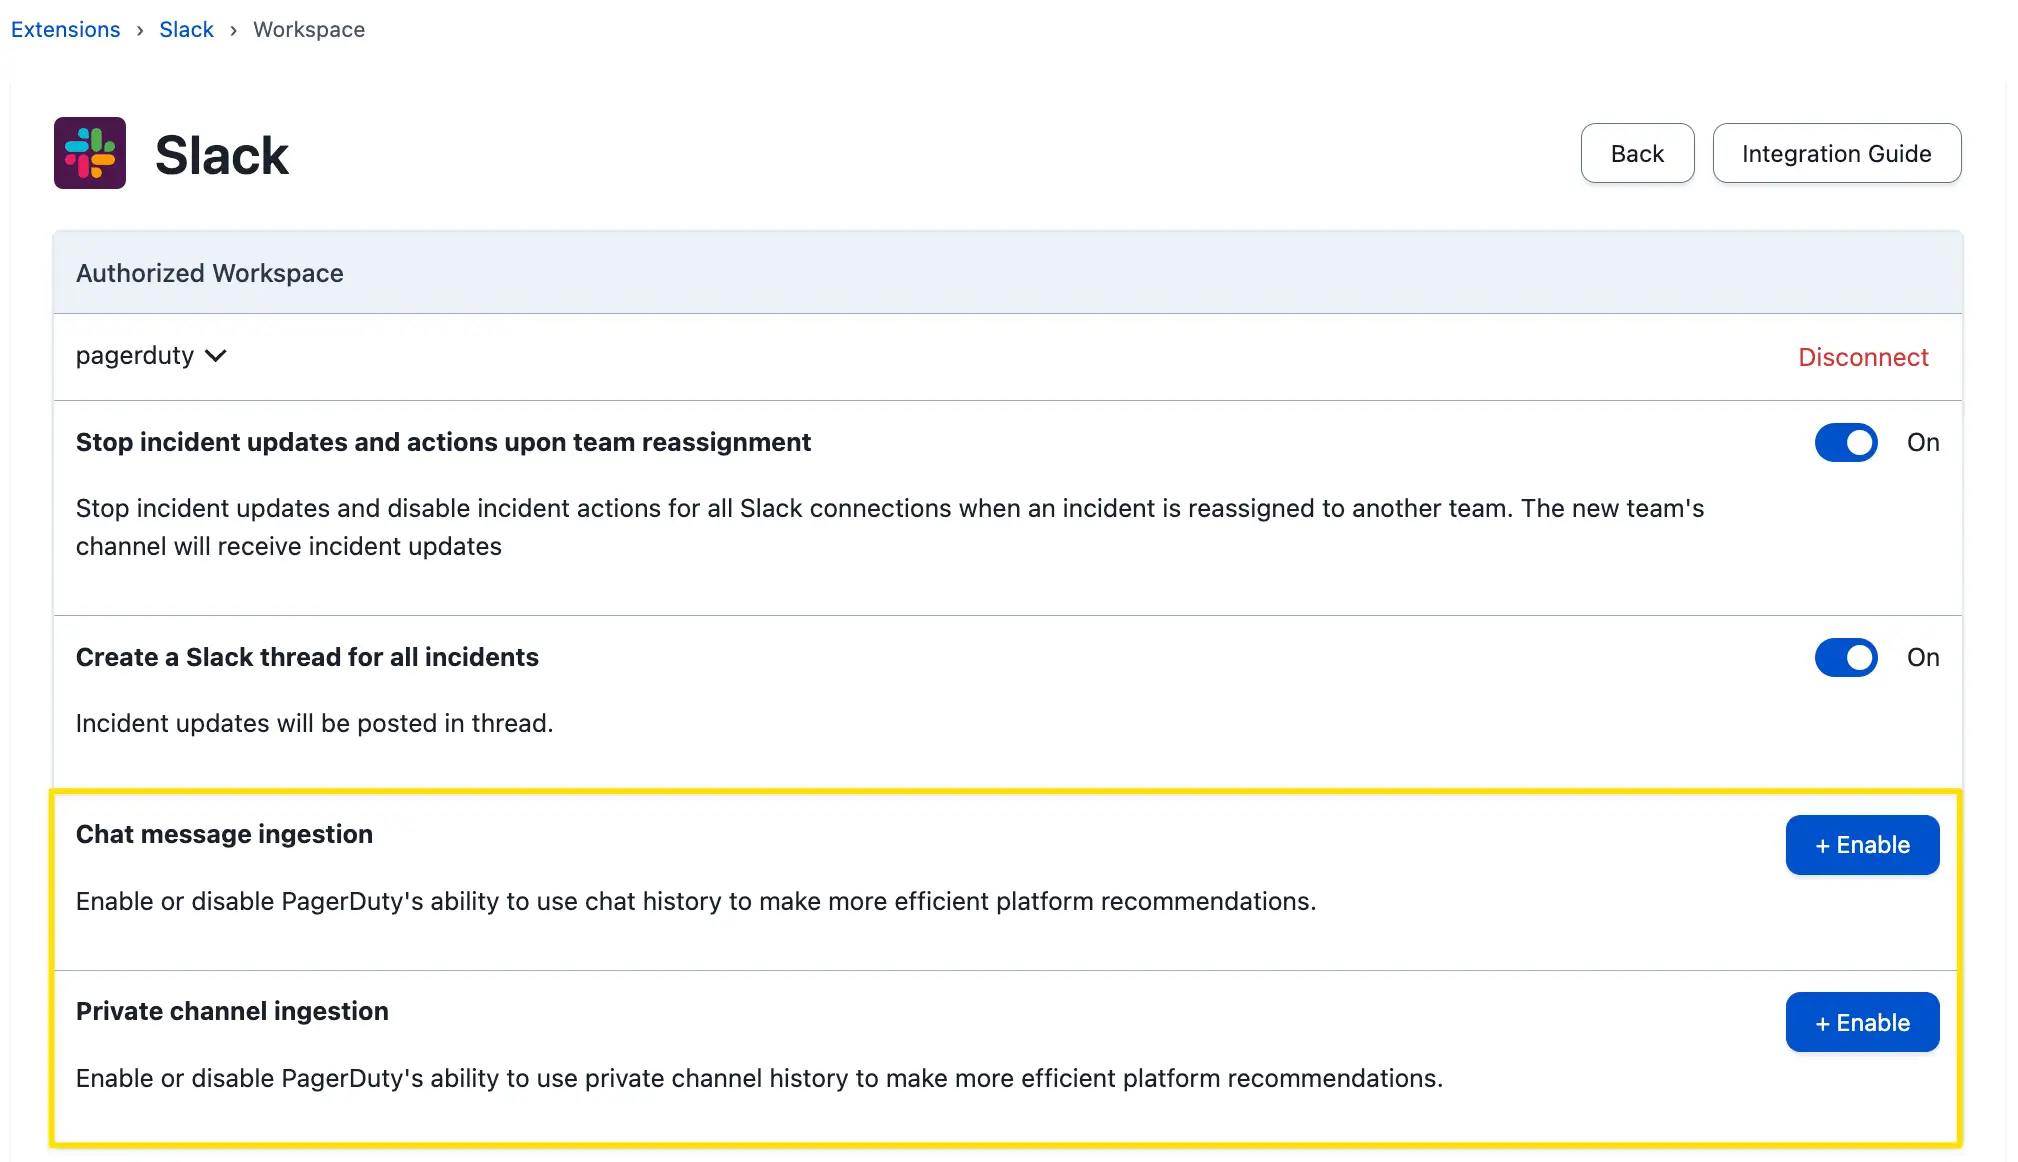 For any newly added workspaces, we will request these scopes. However, you may request to opt out by [contacting Support](https://www.pagerduty.com/contact-us/#contact-support). Please note that opting out requires you to revoke your Slack workspace token, which will also sever connections to private channels. ### Purpose The PagerDuty Slack application now allows customers to leverage [PagerDuty AI](/ai-automation/advance) directly from the PagerDuty Slack app, without needing to install the separate **PagerDuty Advance** Slack app. If you are already using the **PagerDuty Advance** Slack app, you may enable these optional scopes and uninstall the **PagerDuty Advance** app. Additionally, the PagerDuty Slack application now supports ingesting Slack data into [Jeli](/incident-management/after-incident/get-started-with-jeli-post-incident-reviews) for post-incident analysis. With these new scopes enabled, PagerDuty can automatically ingest the contents of your dedicated Slack channel into your Jeli Opportunity. ## November 22, 2024 ### Change Added the following bot token scope: `bookmarks:write`. ### Purpose This scope is used to enable the [Add a Bookmark](/workflow-actions/slack/add-a-bookmark) incident workflow action. --- URL: https://docs.pagerduty.com/integrations/slack-integration-guide/slack-user-guide # Slack User Guide Using the Slack integration after installation After [connecting PagerDuty with Slack](/integrations/slack-integration-guide), responders can handle the full incident lifecycle directly in Slack using slash commands or interactive buttons. Key features include dedicated incident channels, notification channels, and essential actions like acknowledgment and escalation—all without switching to the PagerDuty web interface. Teams using [PagerDuty AI](/ai-automation/advance) can use the AI assistant for automated status updates and incident insights. - [Link User Accounts](#link-user-accounts) - [Create and Link Incident Slack Channels](#create-and-link-incident-slack-channels) - [Dedicated Incident Channel](#dedicated-incident-channel) - [Notification Channel](/integrations/slack-integration-guide/slack-user-guide#notification-channel) - [Announcement Channel ](/integrations/slack-integration-guide/slack-user-guide#announcement-channel) - [Available Actions](#available-actions) - [Incident Card Actions](#incident-card-actions) - [Incident Card Customization](#incident-card-customization) - [Create Incidents as an Unlinked Slack User](#create-incidents-as-an-unlinked-slack-user) - [Create an Incident Declaration Slack Workflow](#create-an-incident-declaration-slack-workflow) - [Add a Slack Contact Method](#add-a-slack-contact-method) - [FAQs](#faq---slack-transformation-best-practices) > **Interactive App Tutorial:** When you install the PagerDuty app for Slack and link your accounts, you can view an interactive, in-app tutorial. This walkthrough demonstrates how to manage the full incident lifecycle directly within your Slack workspace. ## Link User Accounts Users must link their PagerDuty and Slack user accounts to perform PagerDuty actions in Slack or create new channel connections in the PagerDuty. Each user can link their accounts after the initial integration is complete. To link your PagerDuty and Slack accounts: 1. In a public Slack channel, run the command `/pd oncall`. 2. Click **link your accounts**. You will be directed to a browser window and presented with a prompt to sign in to PagerDuty. 3. Complete the PagerDuty login flow. Read [Log In to PagerDuty](/get-started/log-in-to-pagerduty) for more information. After successfully signing in to PagerDuty, your Slack and PagerDuty users will be linked. ## Create and Link Incident Slack Channels The Slack integration offers three channel types: - [**Dedicated Incident Channel**](#dedicated-incident-channel): Provides a single workspace for active incident response with full command access and responder collaboration. This is where the work happens. - [**Notification Channel**](/integrations/slack-integration-guide/slack-user-guide#notification-channel): Focuses on broadcasting updates to keep stakeholders informed across teams. Notification channels ensure the right people stay in the loop. - [**Announcement Channel**](/integrations/slack-integration-guide/slack-user-guide#announcement-channel): Broadly announce incidents to different channels, based on rules. > **Single Account Configuration:** PagerDuty currently supports one account configuration per Slack workspace. ### Dedicated Incident Channel > **Dedicated Incident Channel:** Each incident can have one dedicated channel where responders can coordinate actions, share updates, and track resolution progress. Dedicated Incident Channels provide access to dedicated channel commands and automated workflows, streamlining your team's response process. For more on Dedicated Incident channels, [view our FAQ](#what-is-the-dedicated-incident-channels-feature). #### Enable or Disable Automated Channel Creation You can turn this feature on or off at any time in your Slack settings. 1. Go to **Integrations** → **Extensions** → **Slack** → **Workspace**. 2. Click your workspace. 3. Select the **Dedicated Channel** tab. 4. Modify your **Channel Settings**. For channel creation, toggle **Automatically create dedicated channels**. 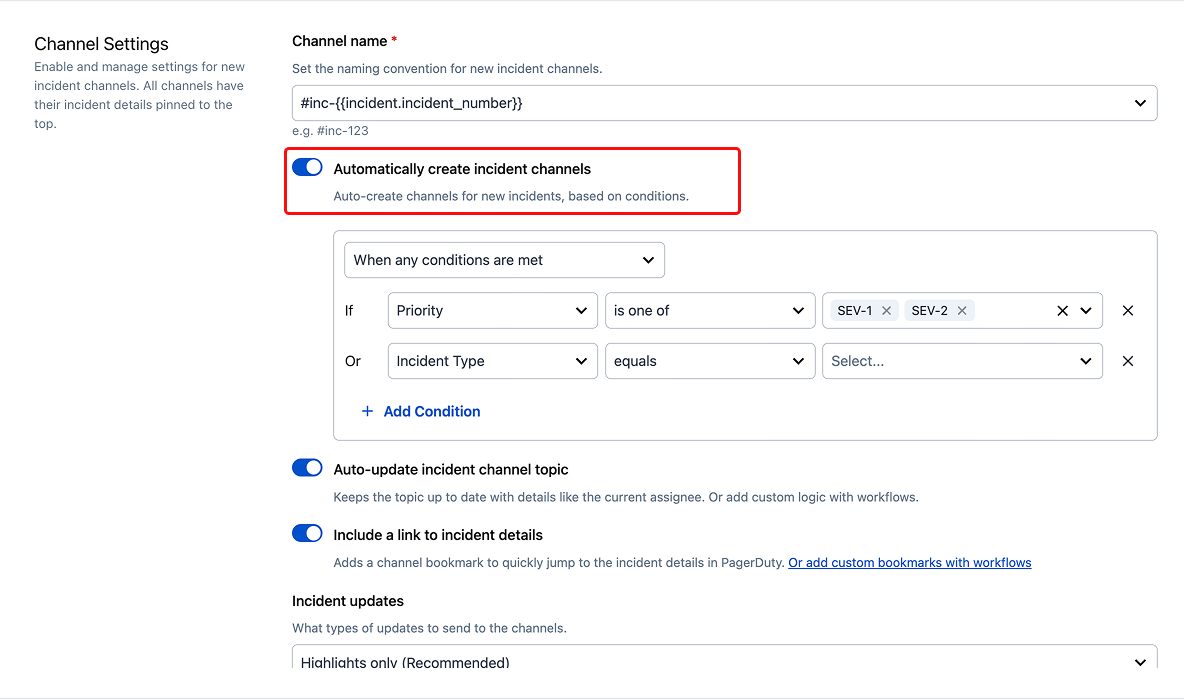 *Channel settings to manage automatic dedicated Slack channels* | Field | Value | | :----------------------------------------- | :-------------------------------------------------------------------------------------------------------------------------------------- | | **Channel name** | Set the naming convention for new dedicated channels (for example, `#inc-{{incident.incident_number}}`). | | **Automatically create dedicated channels** | Toggle on to auto-create channels for new incidents, based on conditions. | | **Auto-update dedicated channel topic** | Toggle on to keep the channel topic up to date with details such as the current assignee. You can also add custom logic with workflows. | | **Include a link to incident details** | Toggle on to add a channel bookmark that jumps to the incident details in PagerDuty. You can also add custom bookmarks with workflows. | | **Incident updates** | Select which types of updates to send to the channels. | | **Thread incident updates** | Toggle on to add all updates to a thread and reduce clutter. | > **Incident Workflows Take Precedence:** If you have Incident Workflows configured to **Create a Slack Channel** and **Set Topic** actions, the **Automatically create dedicated channels** and **Auto-update dedicated channel topic** settings do not override those workflows. #### Alternative Ways to Create Dedicated Channels You can also create dedicated channels using incident workflows or manual creation. - [Automatically with Incident Workflows](#create-an-incident-dedicated-channel-automatically-with-incident-workflows) - [Create a Channel Manually](#create-an-incident-dedicated-channel-manually) ##### Create an Incident Dedicated Channel Automatically with Incident Workflows Automatically create a dedicated channel for your incidents by configuring an Incident Workflow that uses the [Create Incident Dedicated Channel](/workflow-actions/slack/create-a-slack-channel-for-an-incident) workflow action. Please read [Incident Workflows](/ai-automation/automation/incident-workflows) for more information. 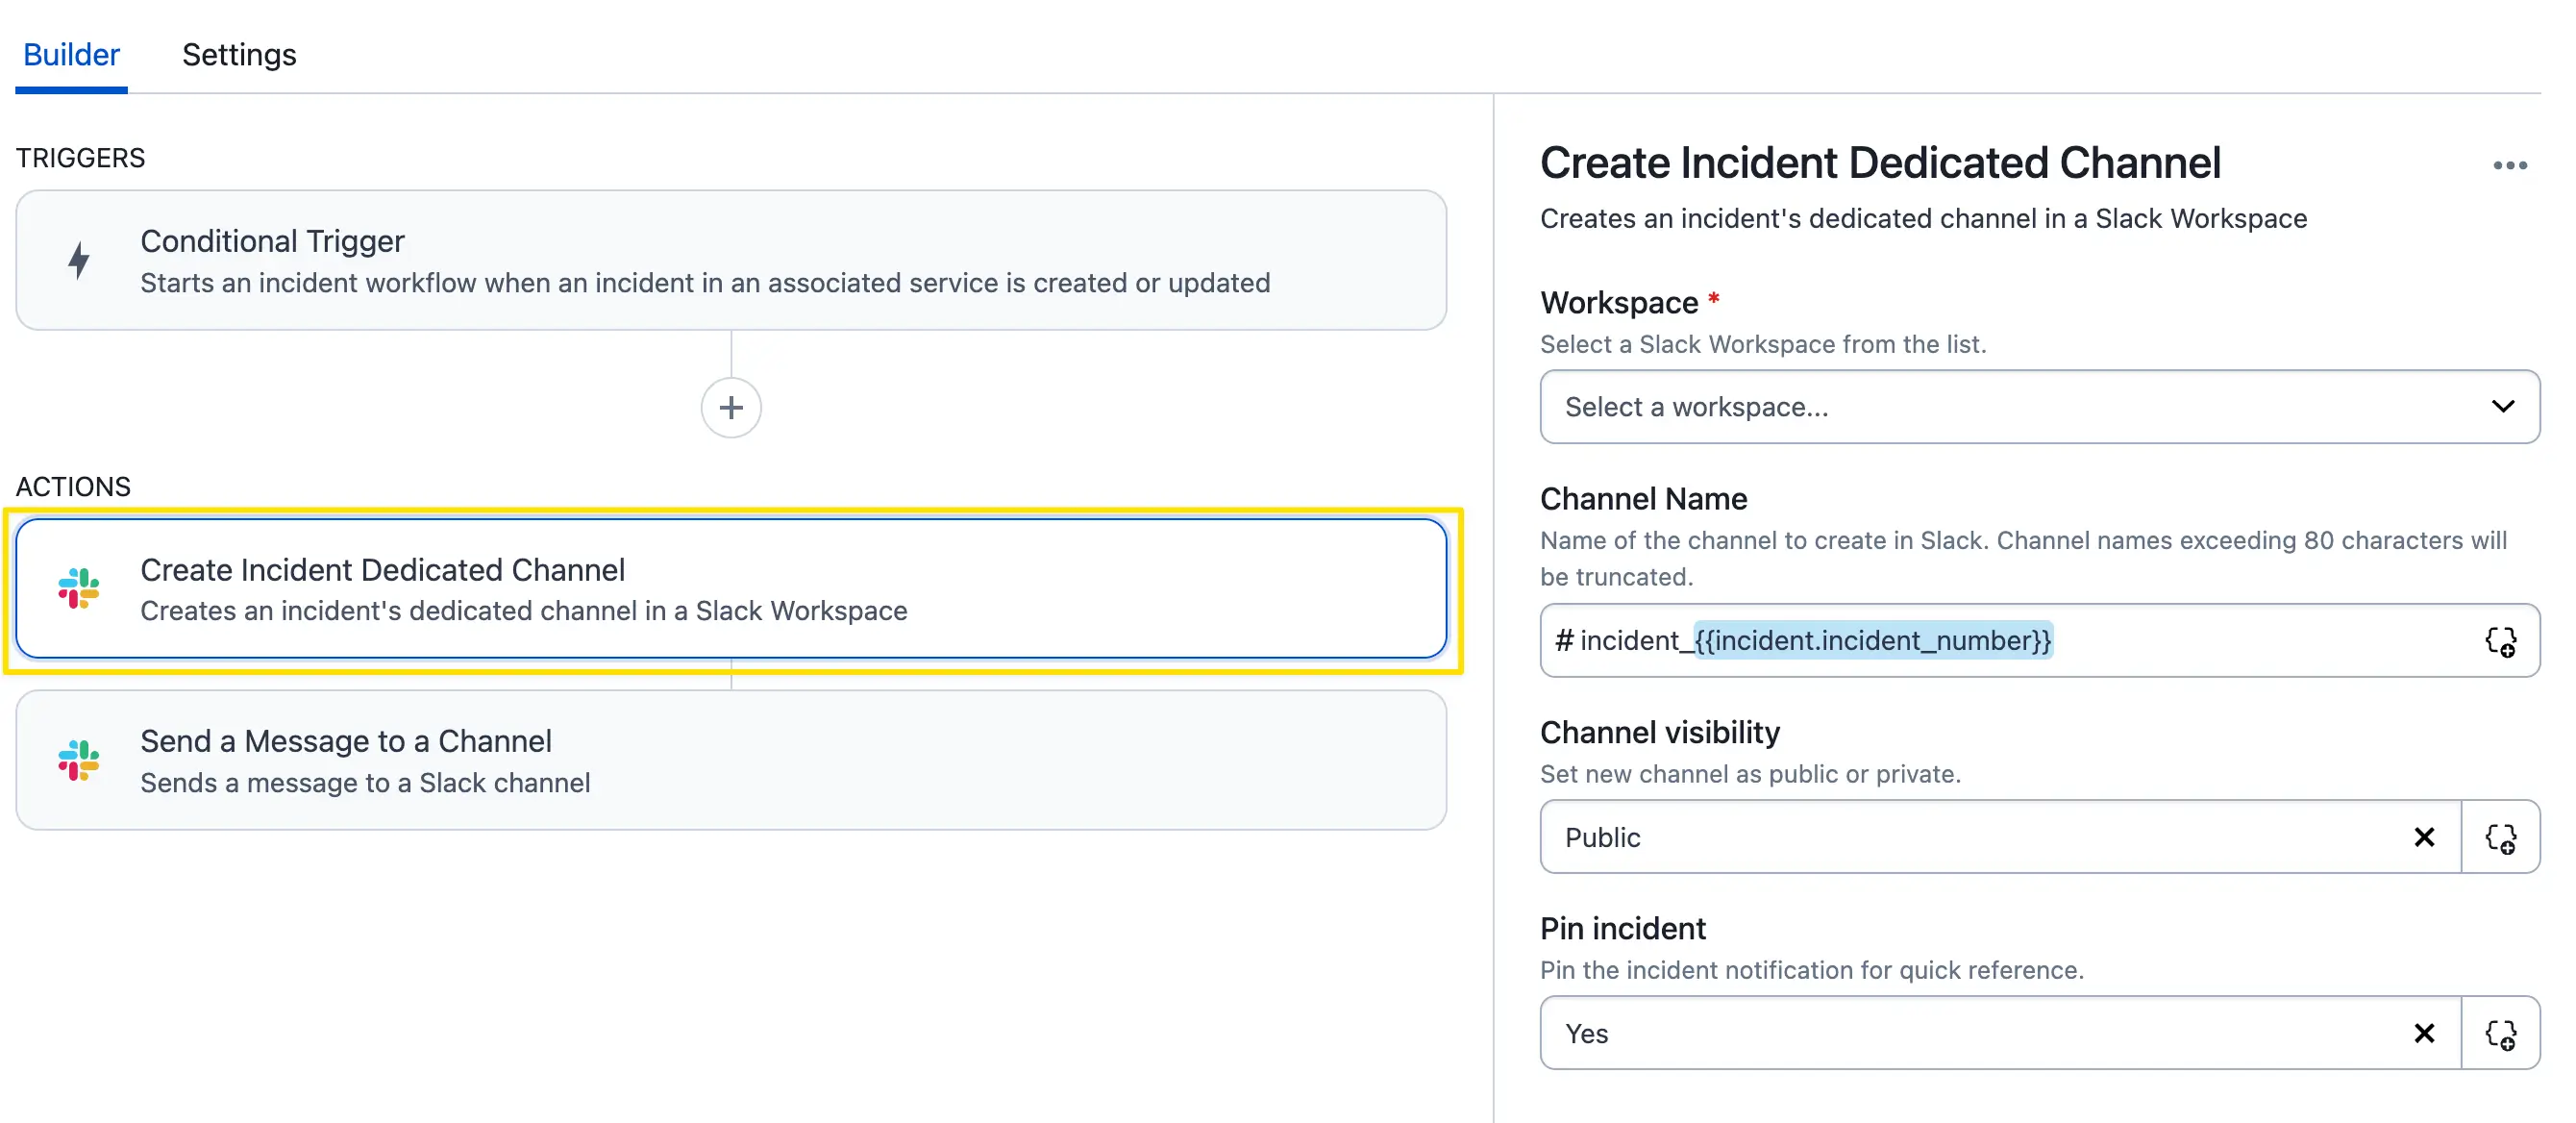 *A workflow using the Create Incident Dedicated Channel action* ##### Create an Incident Dedicated Channel Manually **In the PagerDuty Web App**: On an active incident, click into the details page and then click **Set Channel** to the right of **Dedicated Channel**. 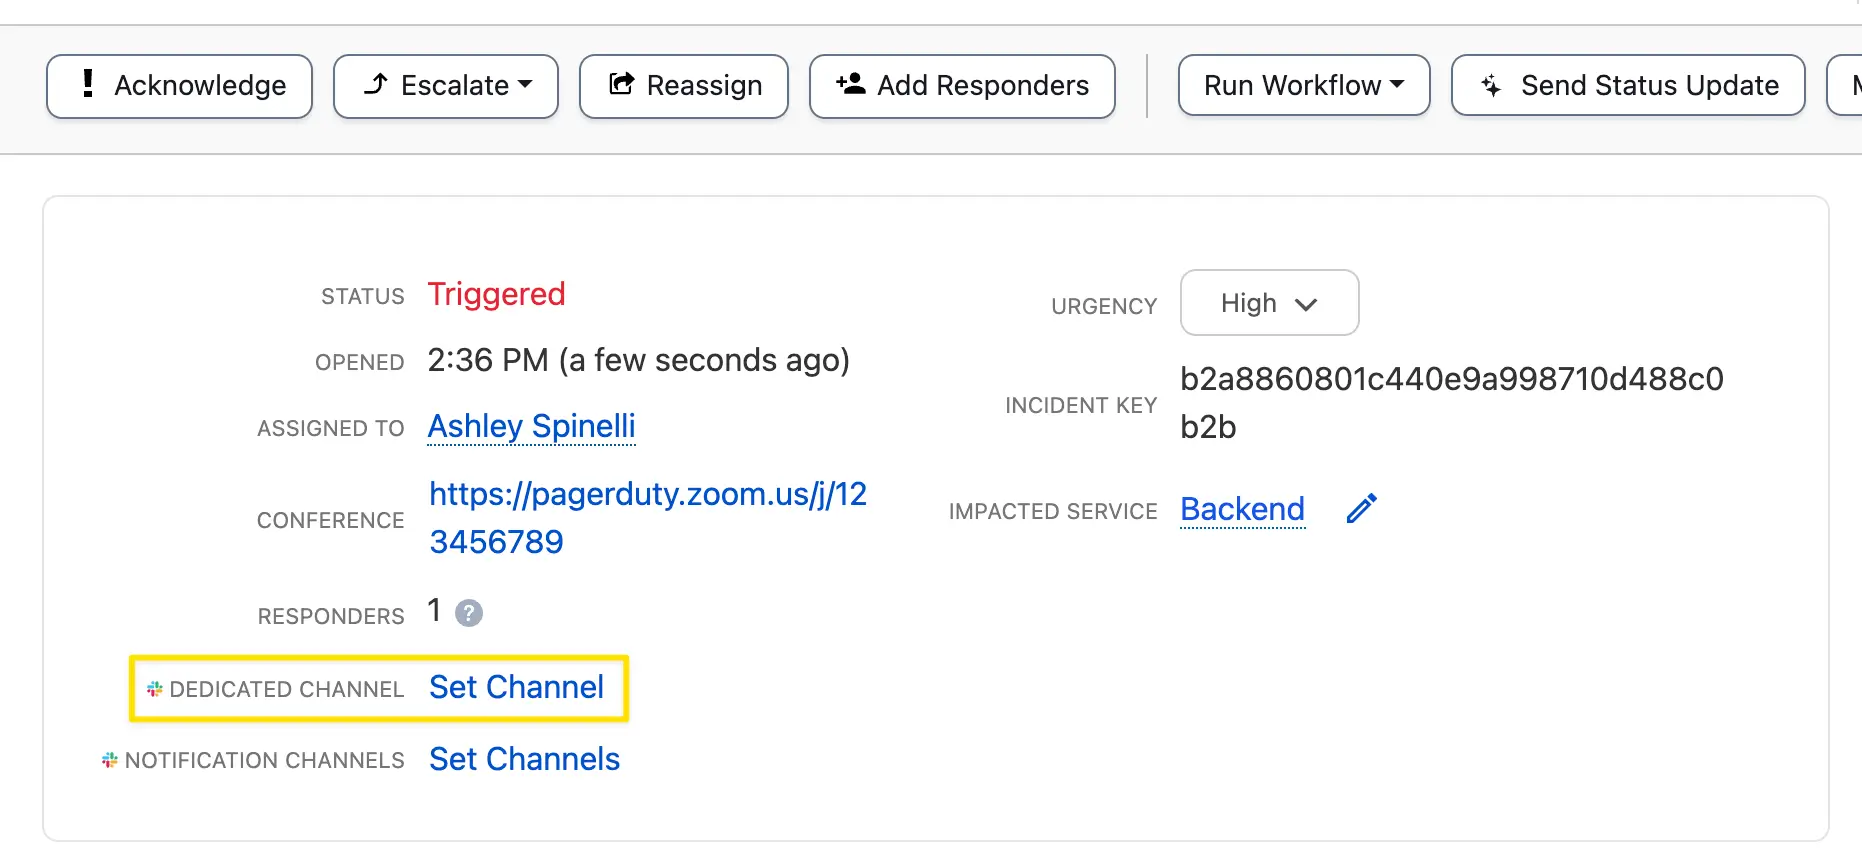 *Create a Dedicated Channel from the PagerDuty web app* **In Slack**: When you create an incident in Slack, it will not automatically create a Dedicated Channel using the naming conventions you set. You can create a dedicated channel by selecting **Create Dedicated Channel** on the incident card. ### Notification Channel Notification channels help you bring awareness of an incident to multiple channels in Slack. You can link these channels when an incident opens, or as the incident progresses and you need to inform additional groups. When you link a notification channel to an incident, PagerDuty sends an incident card to the channel. This card continuously updates as the incident progresses to reflect the current state of the incident. If the incident also has a dedicated incident channel, users can click **Join incident channel** to join the response. 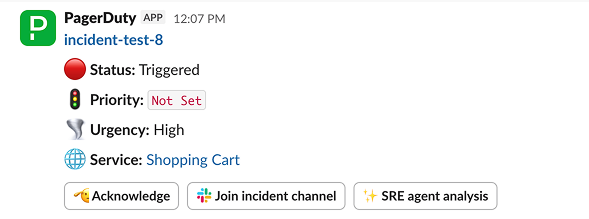 *A PagerDuty incident card in a notification channel* > **Notification Channels:** An incident may have up to three linked notification channels. #### Link an Incident Notification Channel You can automatically link notification channels with incident workflows, or you can manually link channels, as needed. - Link a Notification Channel Automatically - Link a Notification Channel Manually ##### Link a Notification Channel Automatically Automatically link notification channels to your incident by configuring an Incident Workflow, or multiple, that use the [Create Slack Channel](/workflow-actions/slack/create-a-slack-channel-for-an-incident) workflow action. Please read [Incident Workflows](/ai-automation/automation/incident-workflows) for more information. 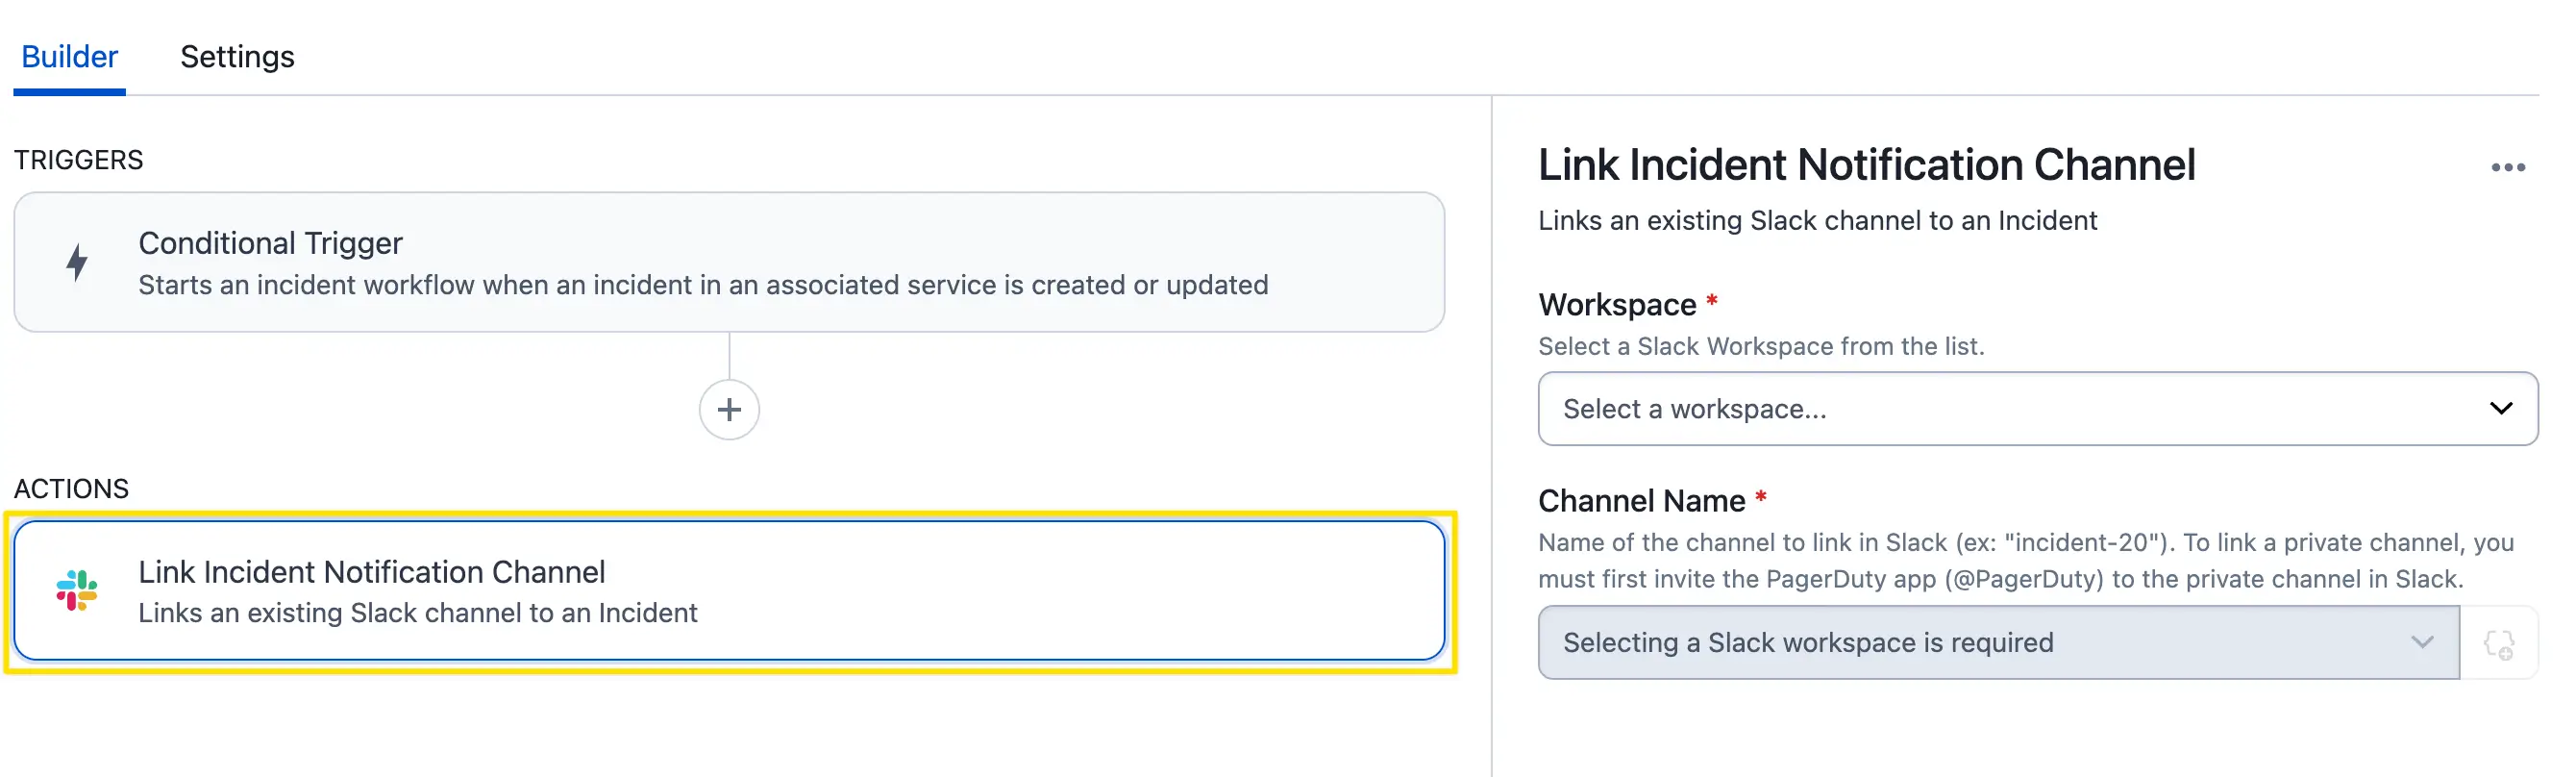 *A workflow using the Link Incident Notification Channel action* ##### Link a Notification Channel Manually **In the PagerDuty Web App**: > **User Permissions:** - When you click **[Set Channels](#create-a-slack-channel-from-a-pagerduty-incident)** you may receive a prompt to authorize the connection between your PagerDuty and Slack accounts. > - When linking notification channels, you will only be able to view channels that you have permission to access in Slack. > - If your PagerDuty account is connected to multiple Slack workspaces, you will have the option to select which workspace to use. On an active incident, click into the details page and then click **Set Channels** to the right of **Notification Channels**. ### Threaded Updates > **Opt-Out of Threaded Updates:** By default, incident updates are sent as threaded messages. You can toggle threaded updates on or off in each channel type's settings on the Slack configuration page. 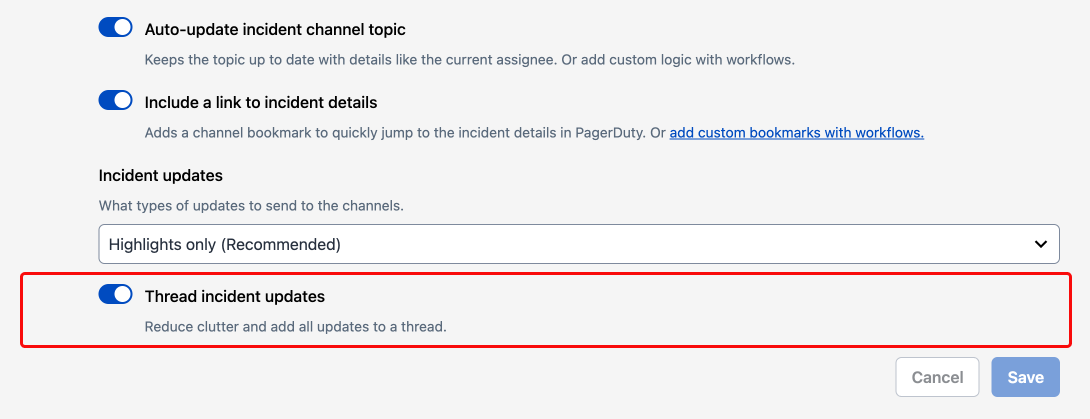 *Threaded Updates* ### Announcement Channel Use an Announcement Channel to broadcast polished, structured updates to stakeholders, leadership, and customer-facing teams. This channel is broadcast-only — it is intended for status updates and resolution notices, not back-and-forth discussion. PagerDuty posts formatted stakeholder updates to this channel, and it is read-only for most members. ## Available Actions ### Slash Commands > **PagerDuty EU Service Region:** If your PagerDuty account is in the EU [service region](/get-started/service-regions), you'll need to use `/pdeu` to run all slash commands instead of `/pd`. #### Help Command Run `/pd` or `/pd help` in Slack to return a message with suggested actions, and a directory of all available incident actions. This help response is interactive, and you may click the provided buttons to take the listed action. 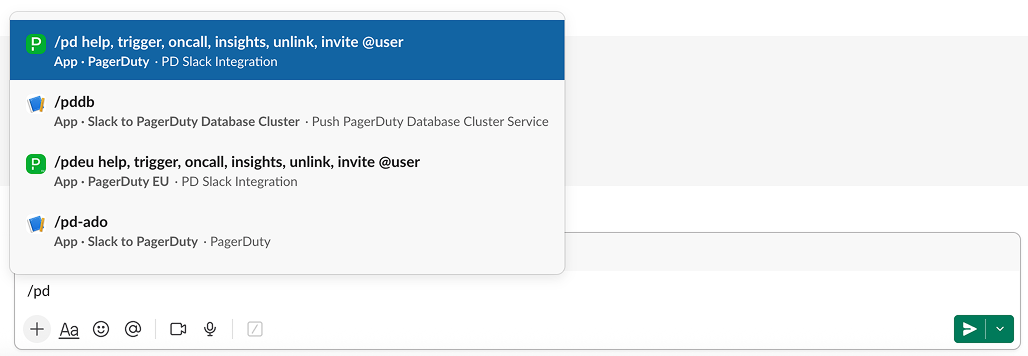 */pd help slash command* The /pd and /pd help command works in all channels to bring up the help command modal. 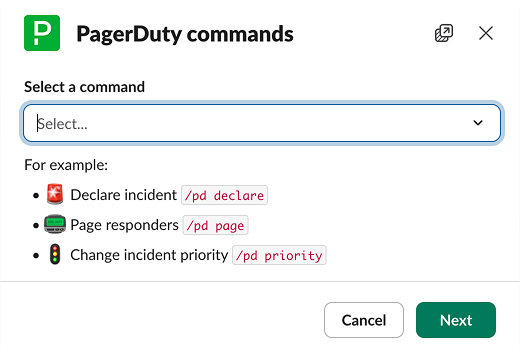 *PagerDuty help command modal* #### General Commands You can run general commands with parent messages in any Slack channel or conversation, with the exception of the PagerDuty app's chat channel. These commands can be used to view help information, declare an incident or manage PagerDuty configuration. > **Lookup all commands:** To view all available commands in Slack, type: > > `/pd`or `/pd help` | Command | Description | | :------------------------------------------- | :------------------------------------------------------------------------------------------------------------------------------------------------------ | | `/pd declare` or `/pd trigger` or `/pd open` | Declare an incident. | | `/pd oncall` | View who is on call for a service. | | `/pd insights` | Configure the [PagerDuty Analytics Slack Integration](/incident-management/analytics/pagerduty-analytics-slack-integration) to send recurring insights to Slack. | | `/pd unlink` | Unlink your current Slack user from your PagerDuty user. | | `/pd invite @{Slack User}` | Invites the specified Slack user to your PagerDuty account. | | `/pd connect` | Connect a service or Team to the current Slack channel. | | `/pd amazonq {question}` | Use PagerDuty AI to [retrieve information from data sources in Amazon Q](/ai-automation/advance/user-guide#pagerduty-ai-integration-for-amazon-q). | | `/pd scribe` | Add a [Scribe Agent](/ai-automation/advance/scribe-agent) to your incident’s meeting, to send meeting transcripts to the current Slack channel. | | `/pd meeting` | Edit [conference bridge](/incident-management/incidents/conference-bridge). | | `/pd default-account` | Choose a PagerDuty account (if multiple accounts are used). | | `/pd settings` | Open PagerDuty settings. | | `/pd import` | Import chat history from Jeli PIR into PagerDuty Slack. | #### Dedicated Channel Commands You can run dedicated channel commands with parent messages in a Dedicated Channel. These commands enable taking efficient actions on the incident. For example, you can type `/pd ack` in the Slack message box to quickly acknowledge the incident. Additionally, you can invoke many actions in a one-step, or two-step process. For example, to add a note to an incident, you can type `/pd note`, which will open a modal to type your note. Alternatively, you can type `/pd note This is my note` to immediately add a note with the contents `This is my note` to the current incident. A full directory of actions and commands is listed below: | Command(s) | Description | | :-------------------------------------------------------- | :----------------------------------------------------------------------------------- | | `/pd declare`or`/pd trigger`or`/pd open` | **Declare an incident** | | `/pd ack` or `/pd acknowledge` | **Acknowledge** | | `/pd resolve` or `/pd close` | **Resolve** | | `/pd page` | **[Add Responder](/incident-management/incidents/add-responders)** | | `/pd escalate` | **[Escalate](/incident-management/schedules/escalation-policies)** | | `/pd reassign` | **Reassign** | | `/pd priority` or `/pd severity` | **Change [Priority](/incident-management/incidents/incident-priority)** | | `/pd type` | **Change [Incident Type](/incident-management/incidents/incident-types)** | | `/pd update` | **Edit Incident** | | `/pd note` or `/pd note {your note}` | **Add a [Note](/incident-management/incidents/edit-incidents#add-a-note-to-an-incident)** | | `/pd workflow` | **Run a [Workflow](/ai-automation/automation/incident-workflows)** | | `/pd role` | **Assign [Roles](/incident-management/incidents/incident-roles)** | | `/pd tasks` or `/pd task {name of your task}` | **Create a [Task](/incident-management/incidents/incident-tasks)** | | `/pd status` or `/pd update {text of your status update}` | **New [Status Update](/incident-management/communicate/communicate-with-stakeholders#status-updates)** | | `/pd oncall` | **View on-call schedule** | | `/pd scribe` | **Add [Scribe Agent ](/ai-automation/advance/scribe-agent)to call** | | `/pd amazonq {question}` | **Ask Amazon Q** | | `/pd insights` | **Access [Insights Agent ](/ai-automation/advance/insights-agent)** | | `/pd connect` | **Connect service** | | `/pd unlink` | **Unlink PagerDuty account** | | `/pd invite` | **Invite user to PagerDuty** | | `/pd settings` | **Open PagerDuty settings** | | `/pd default-account` | **Choose an account** | | `/pd responder` or `/pd responders` | **View responders on an active incident** | #### View Responders and Re-Notify During an active incident, you can easily check the status of all requested responders and send additional pages to those who haven't responded yet from a dedicated incident channel in Slack. 1. In a dedicated incident channel, type `/pd responder`or`/pd responders`. 2. In the **View responders** modal, you will see a list of all requested users and their current response state (Joined or Pending). 3. To re-notify a user, click the context menu () next to their name. 4. Select **Notify again**. ### Incident Card Actions When using a dedicated channel, notification channels or [service/team channel connections](/integrations/slack-integration-guide#configure-the-slack-integration), PagerDuty will send an incident card to the channel. These incident cards display buttons, allowing responders to take action similar to slash commands in a dedicated channel. Incident cards display the following actions: - **Acknowledge**: Acknowledge the incident. - **Resolve**: Resolve the incident. - **Join Dedicated Channel**: If a dedicated channel exists for the incident, a button displays to join the dedicated channel. - **Run a Workflow**: Run an [Incident Workflow](/ai-automation/automation/incident-workflows). - **More actions…**: Select the dropdown to access the below actions. **Note**: Not all actions are available on all pricing plans. Please [contact Sales](https://www.pagerduty.com/contact-us/#contact-sales) to upgrade to a pricing plan that offers any features not present in your account. - **Add a Note** : [Add a note](/incident-management/incidents/edit-incidents#add-a-note-to-an-incident) to the incident. - **Add Responder**: [Add a responder](/incident-management/incidents/add-responders) to the incident. - **View Details**: View incident details within the PagerDuty web app. - **Add Task**: Create and assign an [Incident Task](/incident-management/incidents/incident-tasks). - **View Tasks**: View existing [Incident Tasks](/incident-management/incidents/incident-tasks) for this incident. - **Assign Roles**: Assign [Incident Roles](/incident-management/incidents/incident-roles) to responders. - **Change Priority** : Change an incident’s [priority](/incident-management/incidents/incident-priority). - **Reassign**: Reassign the incident to another [user, escalation policy, escalation level](/incident-management/incidents/reassign-incidents#reassign-an-incident) or [service](/incident-management/incidents/edit-incidents#reassign-an-incidents-service). - **Escalate**: [Escalate](/incident-management/schedules/escalation-policies) the incident to the next on-call responder. - **Create Channel**: [Create a dedicated Slack channel](#dedicated-incident-channel) for the current incident. - **New Status Update**: [Create a new status update](/incident-management/communicate/communicate-with-stakeholders#status-updates) for the incident. - **Change Type**: Change the [incident type](/incident-management/incidents/incident-types). - **Run an Action**: Run an [Automation Action](/ai-automation/automation/automation-actions). 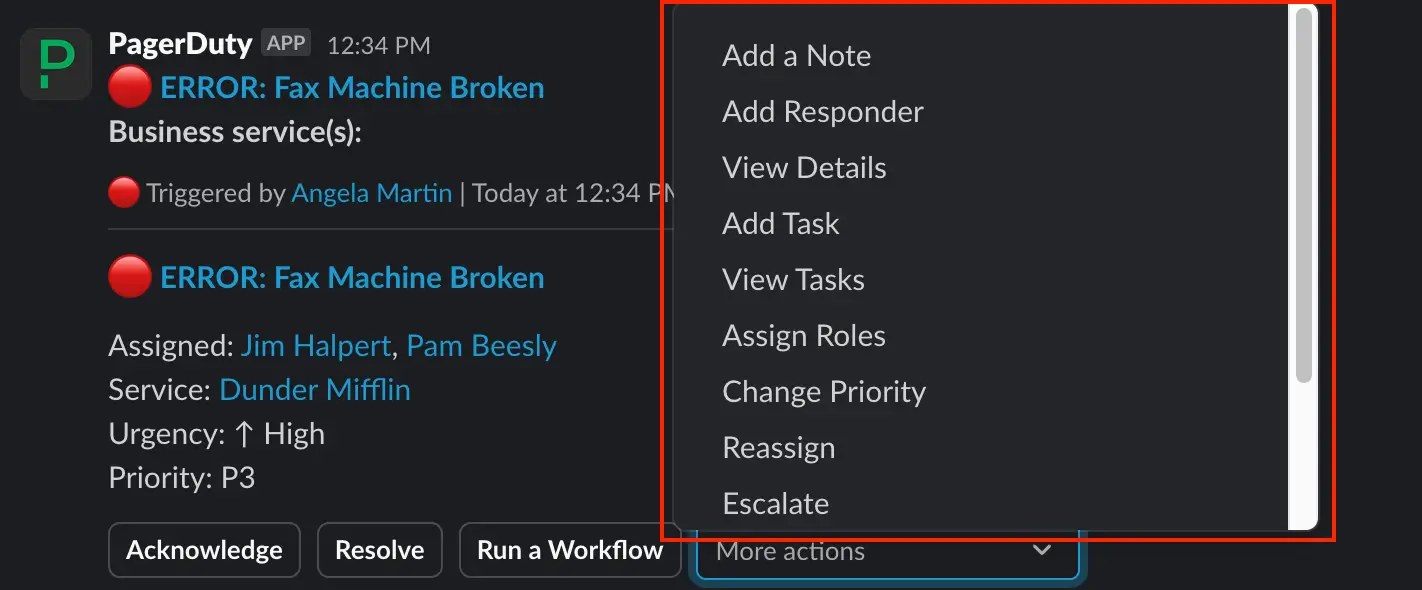 *Incident actions in Slack* > **Emoji and Card Customization:** PagerDuty's incident cards have a default number of fields and emojis. > > To disable emojis on the main fields, go to the PagerDuty Slack integrations page (**Integrations** → **Extensions** → **Slack** → **Your Workspace** → **Advanced Options**) and toggle off **Display emojis in incident notifications**. #### Incident Card Customization > **Permissions:** Users with the Global Admin, Account Owner, or Manager roles can edit card templates. Incident cards post the same fields to every channel by default, which means responders often leave Slack to find context that was not on the card. Card customization lets you choose which fields appear, per channel type — so a dedicated channel can carry troubleshooting context while an announcement channel carries only what stakeholders need. 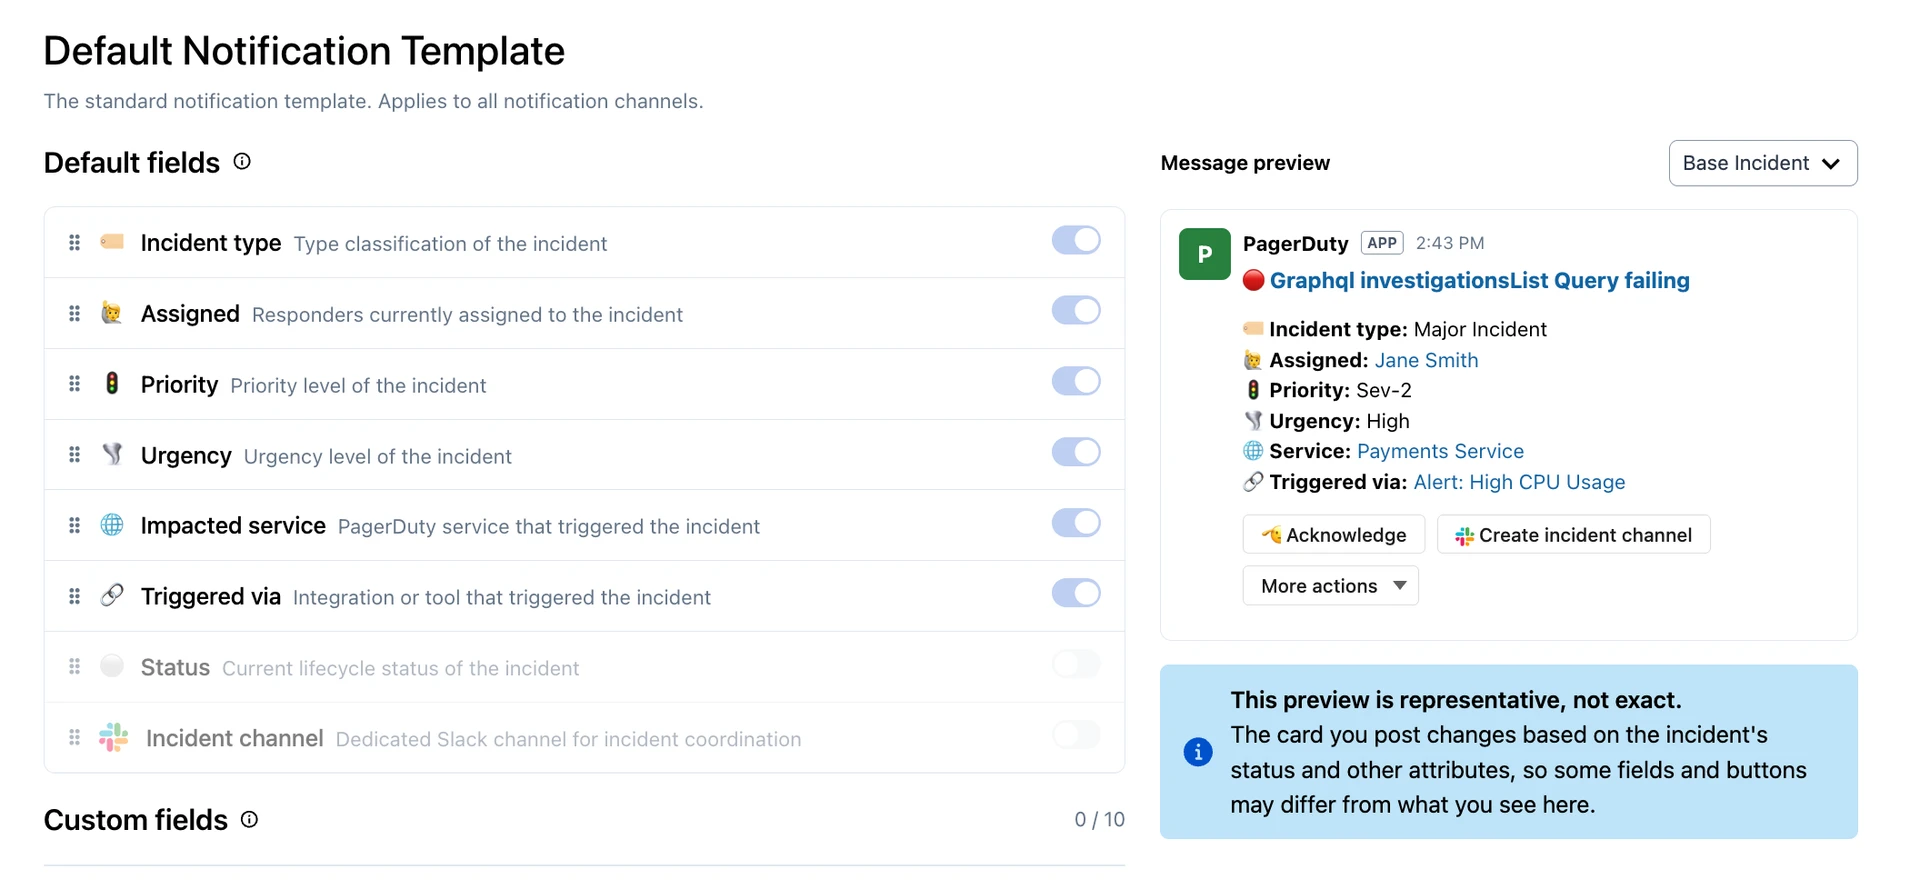 *Incident Card Customization in PagerDuty Settings* Each channel type has its own card template. 1. Navigate to **Integrations** → **Extensions** → **Slack Integration** → **your workspace**. 2. Select the tab for the channel type you want to customize: **Dedicated Channel**, **Notification Channels**, or **Announcement Channels**. 3. Select **Incident Card Customization** and open the card builder. 4. Under **Default fields**, toggle each field on or off — for example, status, priority, or assigned. **Incident type** is required and cannot be turned off. 5. Under **Custom fields**, add the [custom fields](/incident-management/incidents/custom-fields-on-incidents) you want to surface. Available fields are filtered by incident type, so you only see fields relevant to the type you are building for. 6. Use the incident type dropdown above **Message preview** to check how the card appears for each incident type. 7. Re-order the fields by dragging them into the desired order. 8. Click **Save**. The template applies to incident cards posted to that channel type going forward. To discard your changes and return to the default field set, click **Reset**. > **Presets and Card Fields Are Separate:** [Presets](/integrations/slack-integration-guide#presets) control which incident _events_ post to a channel. Card customization controls which _fields_ appear on the card for those events. Configure both for a channel type. > **Custom Fields Must Exist First:** Only [custom fields](/incident-management/incidents/custom-fields-on-incidents) already configured in the PagerDuty web app can be added to a card. Create the field first, then add it to the card template. ### View Impacted Applications in Slack View customer service application impact during an incident in Slack. Services with [Salesforce](/integrations/salesforce-service-cloud-integration-guide) or [Zendesk](/integrations/zendesk-integration-guide) integrations will list the number of cases related to the current incident, with links to individual cases. 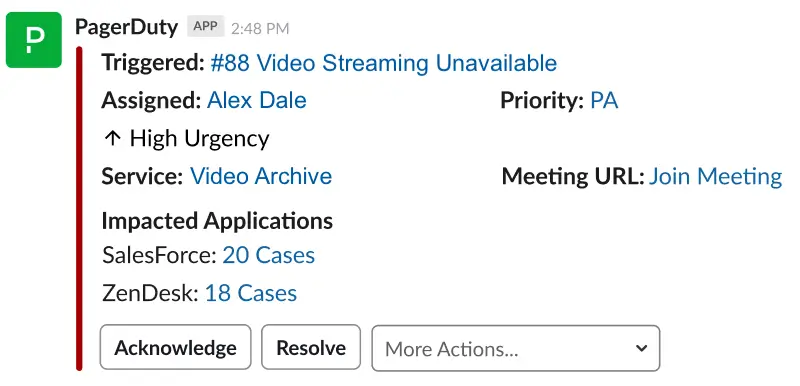 *PagerDuty incident card in Slack* To view individual cases: 1. To the right of the application you would like to view, click `[#]` **Cases**. 2. You will see a list of related cases in the modal that appears. Click a **case number** to navigate to the integrated application and view the case. 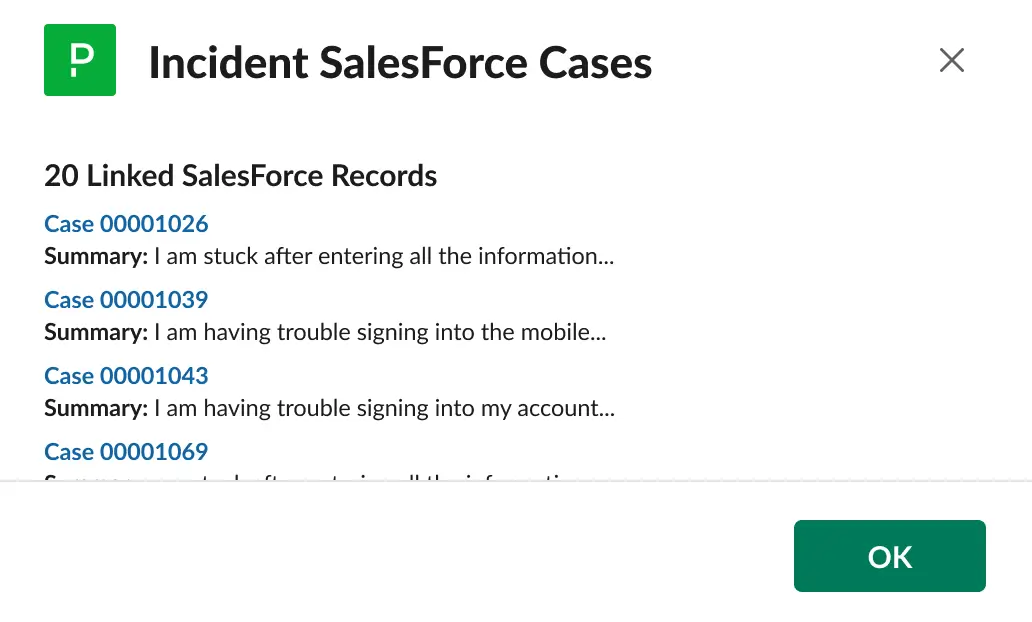 *Linked SalesForce cases* ### Post External Status Page Updates from Slack PagerDuty's [External Status Page](/incident-management/communicate/external-status-page) gives public audiences — customers, partners, or any outside stakeholder — a single source of truth about the health of your services. Historically, updating a status page meant leaving Slack and going into the PagerDuty web app. The `/pd status-page` command removes that step — responders can draft and publish a status page update without leaving the dedicated channel. #### Prerequisites Before `/pd status-page` works, two things must be true: 1. **An External Status Page must already exist and be published in PagerDuty.** Status pages are configured under **Status** → **External Status Page** in the web app, where an admin selects which [Business Services](/incident-management/services/business-services) appear on the page (up to 500 per page) and publishes it to a public subdomain (for example, `https://yourcompany.trust.pagerduty.com`). If no status page has been created and published, there is nothing for the Slack command to post to. 2. **The command must run from a Dedicated Incident Channel.** `/pd status-page` is scoped to Dedicated Incident Channels — it does not work from a general team channel or a direct message. This keeps status page updates tied to a specific, active incident. #### Running the Command In the incident's Dedicated Incident Channel, type: ```text /pd status-page ``` This opens a modal for composing the update. #### The Modal, Field by Field | Field | What It Does | | :---------------------------- | :------------------------------------------------------------------------------------------------------------------------------------------------------------------------------------------------------------------------------------------------------------------------------------------------------------------------------------------------------------------------------------------------------------------------------------------------- | | **Service** | Pre-populated based on the service tied to the dedicated channel. You can change this to a different service if the update should be attributed elsewhere. | | **Post Title** | A short, descriptive headline for the update (for example, "Elevated API latency"). | | **Update text** | The body of the message that external stakeholders read. You can write this yourself, choose a saved [Status Update Template](/incident-management/communicate/status-update-templates) to keep language consistent across incidents, or click **Generate** to have PagerDuty AI draft the text for you using AI, based on incident context and, if enabled, chat data from the channel. Review the draft before posting — it is going out to people outside your company. | | **Status** | One of **Investigating**, **Detected**, or **Resolved** — where the incident currently stands. | | **Impacted Business Service** | The Business Service or services this update applies to on the status page. | | **Impact** | The severity shown to visitors: **All Good**, **Minor**, or **Major**. | | **Time to next update** | An estimate for when subscribers should expect the next update (typically a choice of 15, 30, 45, 60, or 90 minutes). This sets expectations rather than triggering an automatic reminder. | Submitting the modal posts the update. #### Where the Update Goes Submitting the modal sends the update straight to the configured External Status Page — it appears on the incident's timeline on the public page, and, if notifications are enabled, subscribers are notified by email, Slack, or webhook depending on how they subscribed. Anyone visiting your public status page URL — customers, partners, or anyone without a PagerDuty login — sees the new status, the impact level, and the message text immediately. > **Approval Workflows:** If your organization has an approval workflow configured for the status page, the update may land in **Pending Approvals** instead of publishing immediately. An authorized approver then reviews and publishes it from the web app. Check with your status page admin to confirm whether approval is required for your page. #### A Few Things Worth Knowing - Because the update is public-facing, proofread it even when using **Generate** — AI-drafted text should read as something you would be comfortable with a customer seeing. - The **Service** field is pre-selected for convenience, but always double-check it, especially in incidents that span multiple services, to make sure the update lands against the right Business Service on the page. - Posting from Slack does not replace the web app workflow — you can still create and edit status page incidents directly in PagerDuty under **Status** → **External Status Page**. `/pd status-page` is a faster path for responders who are already working the incident in Slack. #### Related Documentation - [External Status Page](/incident-management/communicate/external-status-page) - [Status Pages Overview](/incident-management/communicate/status-pages-overview) - [Communicate with Stakeholders](/incident-management/communicate/communicate-with-stakeholders) - [Status Update Templates](/incident-management/communicate/status-update-templates) ### PagerDuty AI Accounts with PagerDuty AI can chat with the interactive assistant, generate status update drafts, and more by mentioning `@PagerDuty` in an incident channel. Please read [PagerDuty AI](/ai-automation/advance) for more information. Administrators should read [Manage PagerDuty AI Account Settings](/ai-automation/advance#manage-pagerduty-ai-account-settings) for more information about managing which actions and information PagerDuty AI can access. ## Use PagerDuty MCP in Slack [PagerDuty MCP](/ai-automation/advance/pagerduty-mcp-server) (Model Context Protocol) lets you ask Slackbot about your PagerDuty data — for example, how many incidents are currently triggered — and get an answer without leaving Slack. The `mcp:connect` Slack scope is only requested when you enable the permission, so existing Slack connections are not prompted to reauthorize. To use the PagerDuty MCP in Slack: 1. In Slack, open the **Slackbot** app. 2. At the bottom of the message input, click the **Apps** icon and choose **Manage Apps**. 3. Click **Connect** on the **PagerDuty MCP Server**. 4. Complete the authorization flow, signing in to the PagerDuty account you want Slackbot to query. 5. After you authorize, Slackbot shows the list of MCP actions available to you. Close the dialog. Ask Slackbot a PagerDuty question — for example, `How many triggered incidents are there?` — and it will query your data through the PagerDuty MCP server. ## Create Incidents as an Unlinked Slack User If your PagerDuty administrator has [enabled](/integrations/slack-integration-guide#initial-configuration) incident creation for unlinked users, you can create incidents via Slack command, even without a linked PagerDuty account: 1. In your Slack channel, type either `/pd trigger` ,`/pd declare`or `/pd open`. 2. Enter the new incident’s **Title**, **Incident Type**, and **Impacted Service**. 1. **Note**: As an unlinked user, you will only be able to select from the services that your PagerDuty administrator has configured for unlinked user access. If you are unable to locate your desired service, please contact your PagerDuty administrator. 3. Click **Declare**. 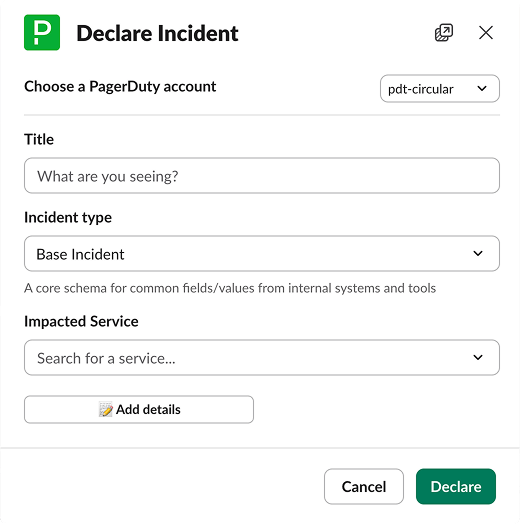 *Declare New Incident form for unlinked users* If this option is not enabled, unlinked users may still declare incidents using a Slack workflow, if one has been configured. ## Create an Incident Declaration Slack Workflow [Slack workflows](https://slack.com/help/articles/17542172840595-Build-a-workflow--Create-a-workflow-in-Slack) can be used to declare PagerDuty incidents via Slack with pre-configured details such as the associated service. This option is useful for employees who do not have PagerDuty licenses, but still need to be able to declare PagerDuty incidents in Slack. > **Slack Workflows:** **Slack workflows are developed and maintained by Slack.** > > With the deprecation of Slack’s legacy workflows, we highly recommend utilizing Slack's new Workflow Builder for creating incident declare workflows. > > The following sample workflow uses the current Workflow Builder’s PagerDuty connector steps. For issues or concerns with these connector steps or a Slack workflow, please reach out to [Slack’s Support team](https://slack.com/help). 1. In your Slack desktop app, navigate to **Go** → **Workflow Builder**. 2. Click **New Workflow** → **Build Workflow**. Select the option for how you’d like to start the workflow. Enter the required information, if any, then click **Continue**. 3. Next, you will create a form for users to enter information about the incident. Click **Add steps**. On the workflow steps modal, search for or select **Collect info in a form**. 4. On the **Collect info in a form** modal: 1. Enter the following information: | Field | Value | | ---------- | --------------------------------------------------------- | | Form Title | Enter a title for the form, such as `Create PD incident`. | 2. Click **Add Question**.
On the **Question 1** modal, enter the following information:
| Field | Value |
|---|---|
| Your question | Enter `Title`. This will be the title of the created incident. |
| Question type | Select `Short answer` |
| Make this required | Enable this checkbox. |
On the **Question 2** modal, enter the following information:
| Field | Value |
|---|---|
| Your question | Enter `Details`. This will populate the custom details of the created incident. |
| Question type | Select `Short answer` |
| Make this required | Enable this checkbox. |
| Field | Value |
|---|---|
| Select a channel | Select `Channel where the workflow was used`. |
| Add a message | Enter your preferred **message** to be sent with the workflow. Click **Insert a variable** under the message form to include variables that contain PagerDuty Incident, Escalation Policy, Service, and/or Team data. |
To reopen an incident: 1. Navigate to the resolved incident’s message on the incident card. 2. Click **Reopen**. 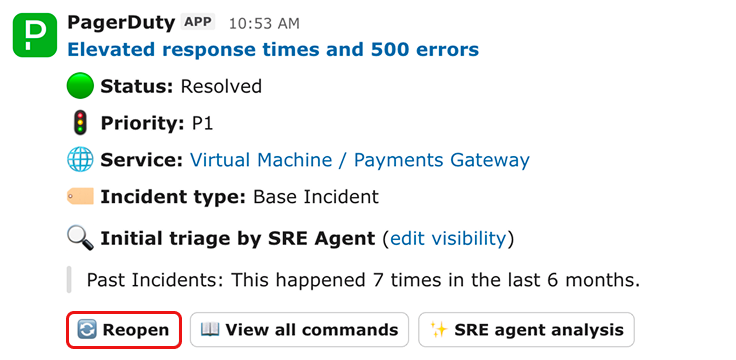 *Reopen incident modal* For more, read [Reopen Incidents](/incident-management/incidents/reopen-incidents). ## Declare an Incident Without a Service [Quick Declare](/incident-management/incidents/quick-declare) lets you declare an incident in Slack without selecting an impacted service, so you can open an incident and pull in responders before you know which team owns the problem. The **Impacted Service** field is optional by default. > **Account Linking Required:** To declare an incident from Slack, your Slack account must be linked to a PagerDuty user. Unlinked Slack users see an error message. For more information, visit [Link User Accounts](#link-user-accounts). 1. In your Slack channel, run `/pd declare`. 2. Enter the incident name. 3. Leave **Impacted Service** unselected. 4. Click **Declare**. A confirmation card appears with **Page** and **Set Impacted Service** actions, and states whether responders were notified. Incidents declared without a service route to the [Default Mobilization Service](/incident-management/services/default-mobilization-service). Whether the confirmation card reports that responders were notified depends on that service's escalation policy: by default the policy has no responders, so no one is paged, you become the incident owner, and the incident is acknowledged. To page responders automatically on these incidents, add users to the Default Mobilization Service escalation policy. To require an impacted service on every incident instead, an Admin can disable Default Mobilization in **Account Settings** → **Incident Settings**. For both, visit [Quick Declare](/incident-management/incidents/quick-declare). ## Add a Slack Contact Method Once the [Slack integration is configured](/integrations/slack-integration-guide), you can add Slack as an incident contact method. Please read [Add a Slack Contact Method](/account-admin/user-profile/contact-information#add-a-slack-contact-method) for more information. ### Slack Delivery Limits PagerDuty sends incident notifications to Slack subject to Slack's messaging limits. These limits are set and enforced by Slack, not PagerDuty. PagerDuty delivers notifications both to Slack channels and to individual users through Slack direct messages, and both are subject to the following limits. #### Per-Channel Limit Slack permits about one message per second to any individual channel or direct message conversation. Brief bursts above that rate may succeed, but sustained high-volume posting can be rate limited. When this happens, Slack returns a rate-limit response — for HTTP-based sends, a `429 Too Many Requests` response with a `Retry-After` header — and some messages may not be stored or displayed. Because Slack does not always surface this to the sender, dropped messages can appear as silently missing updates rather than errors. As a result, sending too many PagerDuty notifications to the same Slack channel can produce missed or delayed updates. > **High-Volume Notification Streams:** Slack may rate limit high-volume notification streams. If PagerDuty posts too many messages too quickly, some Slack notifications may be delayed or dropped. #### Workspace-Wide Limit Separately from the per-channel limit, Slack enforces an aggregate limit on the total number of messages an app can post into a workspace, on the order of several hundred messages per minute. Slack does not publish an exact number for this limit. This workspace-wide limit is shared across all Slack notifications PagerDuty sends into that workspace, not a single incident. A burst of multiple incidents happening around the same time — each notifying different users and posting into different channels and direct messages — can add up against this shared limit, even when no single conversation is near its own per-second cap. If the workspace-wide limit is reached, Slack rejects additional message attempts with a `429 Too Many Requests` response until the limit resets, which can delay or prevent delivery of a Slack notification for that burst window. #### Reduce the Risk of Missed Notifications To reduce the risk of missed notifications, use narrower notification rules, avoid routing multiple high-volume services into the same channel, and use [Threaded Updates](#threaded-updates) or summaries where possible. > **Configure More Than One Contact Method:** Configure more than one contact method in your notification rules — for example, push, SMS, and phone — rather than relying on a single channel. This improves delivery resilience and protects against the case where a burst of concurrent incidents causes a Slack workspace-level rate limit to delay or block a Slack notification. #### Practical Guardrails - Keep each channel **under one notification per second** on average. - Avoid sending every event to the same channel when incident volume is high. - Use a quieter preset or fewer rules for announcement and notification channels. ## FAQ - Slack Transformation Best Practices **What is the Dedicated Incident Channels feature?** Automated Dedicated Incident Channels is a new default behavior where PagerDuty automatically creates a focused Slack channel for each major incident (P1/P2 or whatever are the top two priorities set by your organization). This centralizes communication, reduces noise, and provides a complete audit trail for post-incident reviews. It is considered an industry best practice. **What if we already use Incident Workflows to create dedicated channels?** Your existing workflows are **NOT** affected. The new global feature respects workflow-level settings. If you already have dedicated channels created via incident workflows, those configurations (including custom topics and triggered actions) continue to work exactly as before. The hierarchy is: workflow-level settings take precedence over global defaults. **How do I auto-archive new channels that have been created?** Currently, to enable auto-archiving of channels, you must use an [incident workflow](/ai-automation/automation/incident-workflows). **Can we opt-out of Automatic Dedicated Incident Channels?** **YES**. Your admin can turn off the global setting in their Slack configuration. They can also customize when channels are created (such as by priority or severity) and how they are named. Navigate to **Integrations** → **Extensions** → **Slack** → **your workspace** → **Dedicated Channel**.  *Slack channel settings* **What are the three types of channels you should know about?** - **Dedicated Incident Channel**: A focused space created for each major incident where responders collaborate - **Announcement Channel** (formerly "Stakeholder Notification Channel"): Where high-level updates are broadcast to stakeholders - **Notification Channel**: Where alerts land for initial notification **Can we use both Notification Channels and Dedicated Incident Channels?** **YES**. You can keep the ability to triage incidents in a single channel and only move certain incidents to dedicated channels. You can switch the global configuration to OFF but still use incident workflows or the manual button to create dedicated incident channels when needed. **I linked my Slack account to the wrong PagerDuty account.** If you see an error stating that your Slack account is authorized from a different account, your Slack user is linked to another PagerDuty account. To relink your accounts: 1. In a public Slack channel, run `/pd unlink` to unlink your current Slack user from your PagerDuty user. 2. Follow the steps in [Link User Accounts](#link-user-accounts), making sure to sign in to the correct PagerDuty account when prompted. **Why does the `/pd` command return an error?** If a `/pd` command fails or returns an error, check the following: - **Workspace mapping**: Slash commands require your Slack workspace to be mapped to your PagerDuty account. See [Initial Configuration](/integrations/slack-integration-guide#initial-configuration) in the Slack Integration Guide. - **Service region prefix**: Accounts in the US service region use `/pd`, and accounts in the EU service region use `/pdeu`. Running the wrong prefix for your account returns an error. - **Account linking**: Most actions require your PagerDuty and Slack user accounts to be linked. See [Link User Accounts](#link-user-accounts).
--- URL: https://docs.pagerduty.com/integrations/solarwinds-orion-troubleshooting-guide # SolarWinds Orion Troubleshooting Guide Troubleshoot the SolarWinds Orion VBScript integration, including failed alert imports and stuck or malformed queued events. The [SolarWinds Orion integration](https://www.pagerduty.com/docs/guides/solarwinds-integration-guide/) is based on a [VBScript](https://github.com/jcurreee/pagerduty-vbs) that runs locally on the SolarWinds host. The script is designed to work as follows: 1. When an alert triggers in Solarwinds Orion, a text file containing JSON-encoded data is created, based on an alert template, through a **Log Alert to File** alert action. This file is intended to be sent to PagerDuty and is stored temporarily in `C:\PagerDuty\Queue`. 2. The script is executed to deliver that event (and any others that are still in that directory) to PagerDuty through the [Events API v1](/developer/events-api-v1-overview). 3. The script removes the file once delivery is successful. If the integration is not working as expected, it typically has something to do with one of the steps outlined above. ## Errors Importing Sample Alerts If an alert cannot be imported, you may be presented with an error such as the following: > There was an error while importing alert from ... Please check OrionWeb.log for more details. To find the path to the error’s log file, refer to [Orion Core Logs](https://support.solarwinds.com/SuccessCenter/s/article/CORE-Available-Orion-Core-Logs). In the case of `OrionWeb.log`, the path will be `Logs\Orion\OrionWeb.log`, and the `Logs` folder will be in `C:\Documents and Settings\All Users\Application Data\SolarWinds\` or `C:\Documents and Settings\All Users\SolarWinds\`. The error in the log will provide more information on why the import did not succeed. Sometimes, the error is related to one or more software components that are not present in the SolarWinds Orion installation. For example, [APM (Application Performance Monitor)](https://www.solarwinds.com/apm-app-performance-monitor) alerts, which have "Application" in their names, require that the APM module be installed and activated. ## PagerDuty Incidents Not Triggered The first place to look is in `C:\PagerDuty\Queue` for `.txt` files that are "stuck" in the event queue. They would have creation timestamps earlier than a few seconds ago. If there are any stuck event files, move them out of the folder so that the script will stop trying to send them to PagerDuty while you troubleshoot the integration. ### Malformed Events Open some of the text files to review their contents. The files' contents must be valid JSON, and the integration key must be a valid value. If the file contains either invalid JSON or is missing a valid integration key, PagerDuty’s [Events API](/developer/events-api-v1-overview) will be unable to process the event. If you notice anything that needs adjustment, you can address this in SolarWinds Orion by going to **Main Settings & Administration** → **Manage Alerts** or **Manage Custom Properties**. 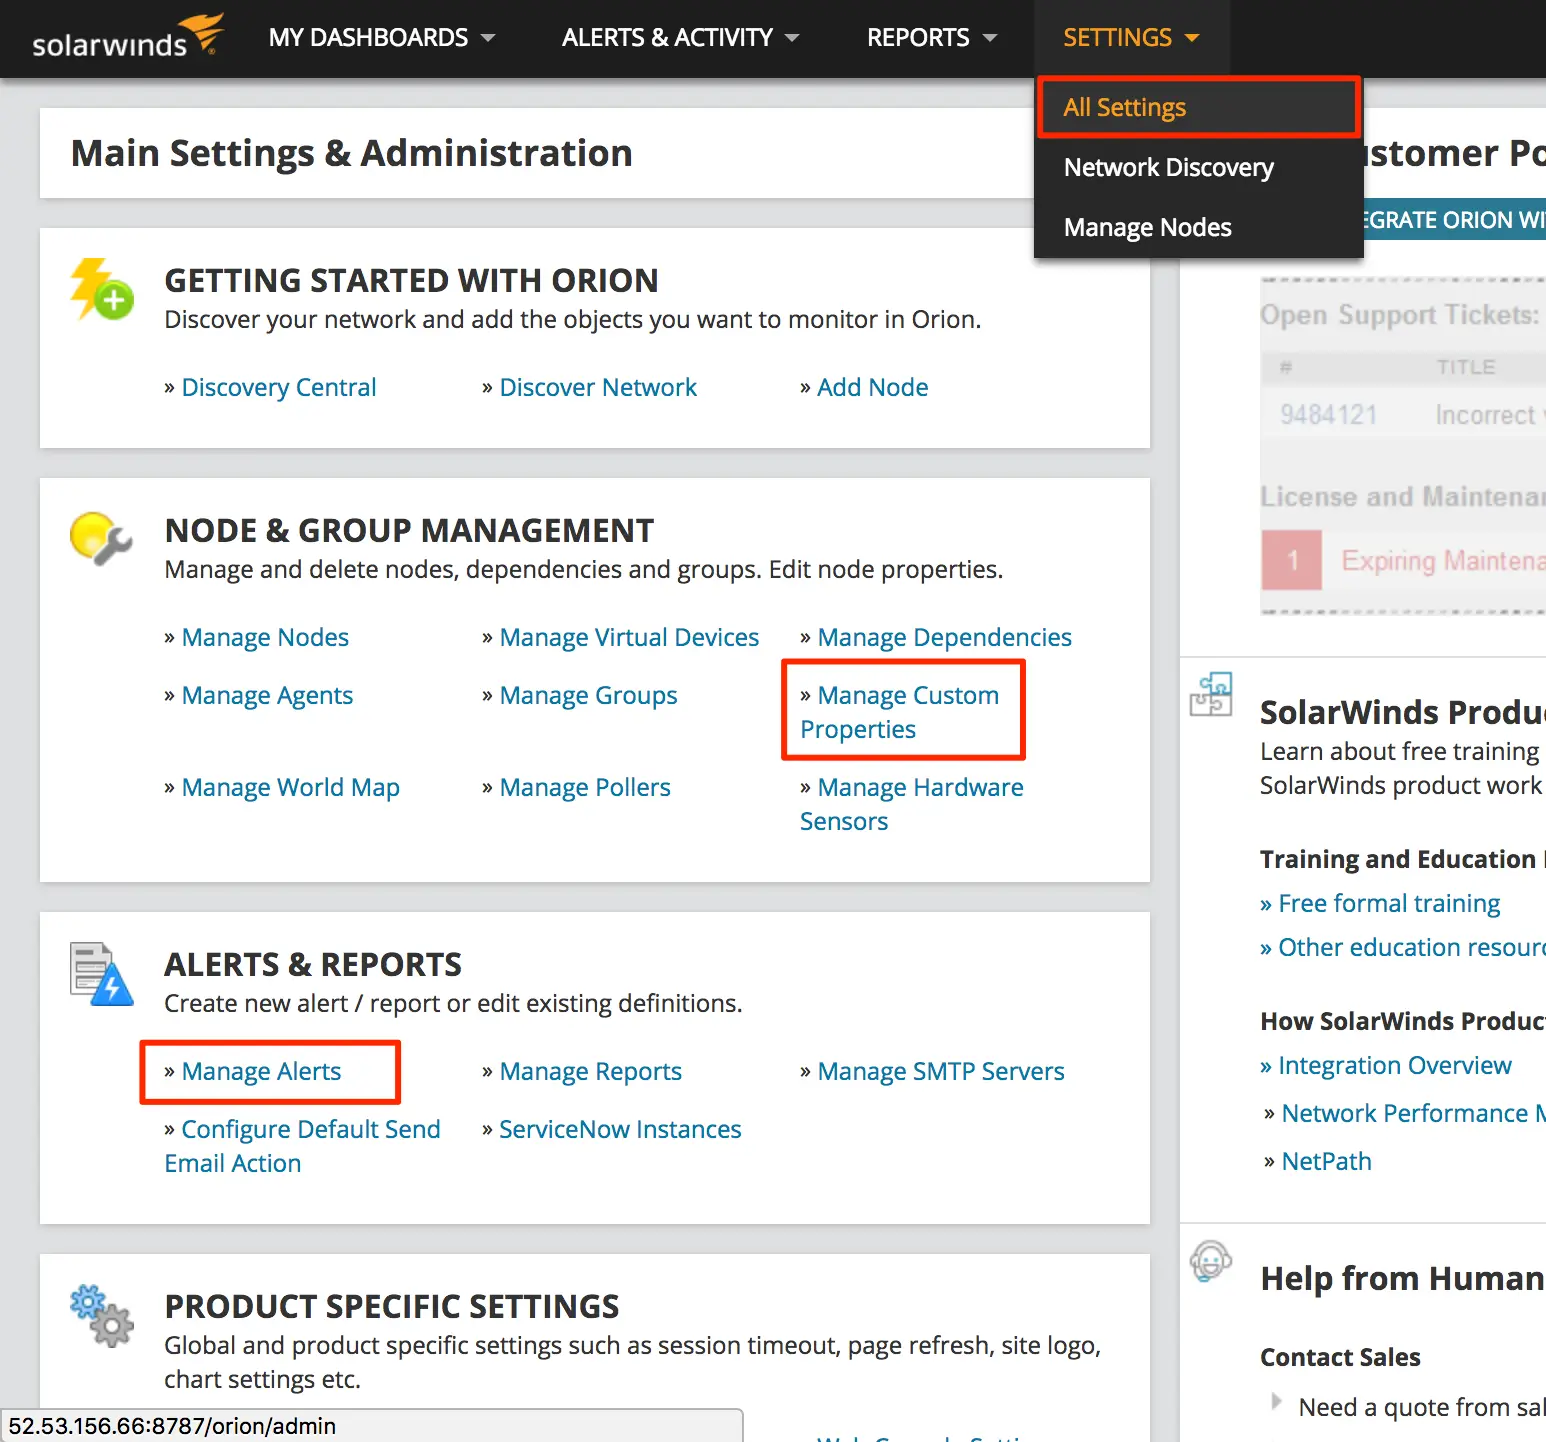 #### Stray Quote Characters If property names or values contain escaped double quote characters (i.e., for instance, `"Last Time \"Up\""`), this will cause the alert sent to PagerDuty to contain invalid JSON. To address this: 1. From the main menu, go to **Manage Alerts**. 2. Find the alert that created the file and select the **alert** to edit it. 3. Navigate to the **Trigger Actions** step. 4. Under the **Trigger Actions** section on this page, click **Edit** on the **Log Alert to PagerDuty Queue** action, remove the errant characters from the message template, and save the alert. 5. To test the updated alert action, click **Simulate**, select a node, and open the file to verify it is now valid JSON. You can also click **Simulate** on the **Execute PagerDuty VBScript** action to send a mock event and trigger a PagerDuty incident. 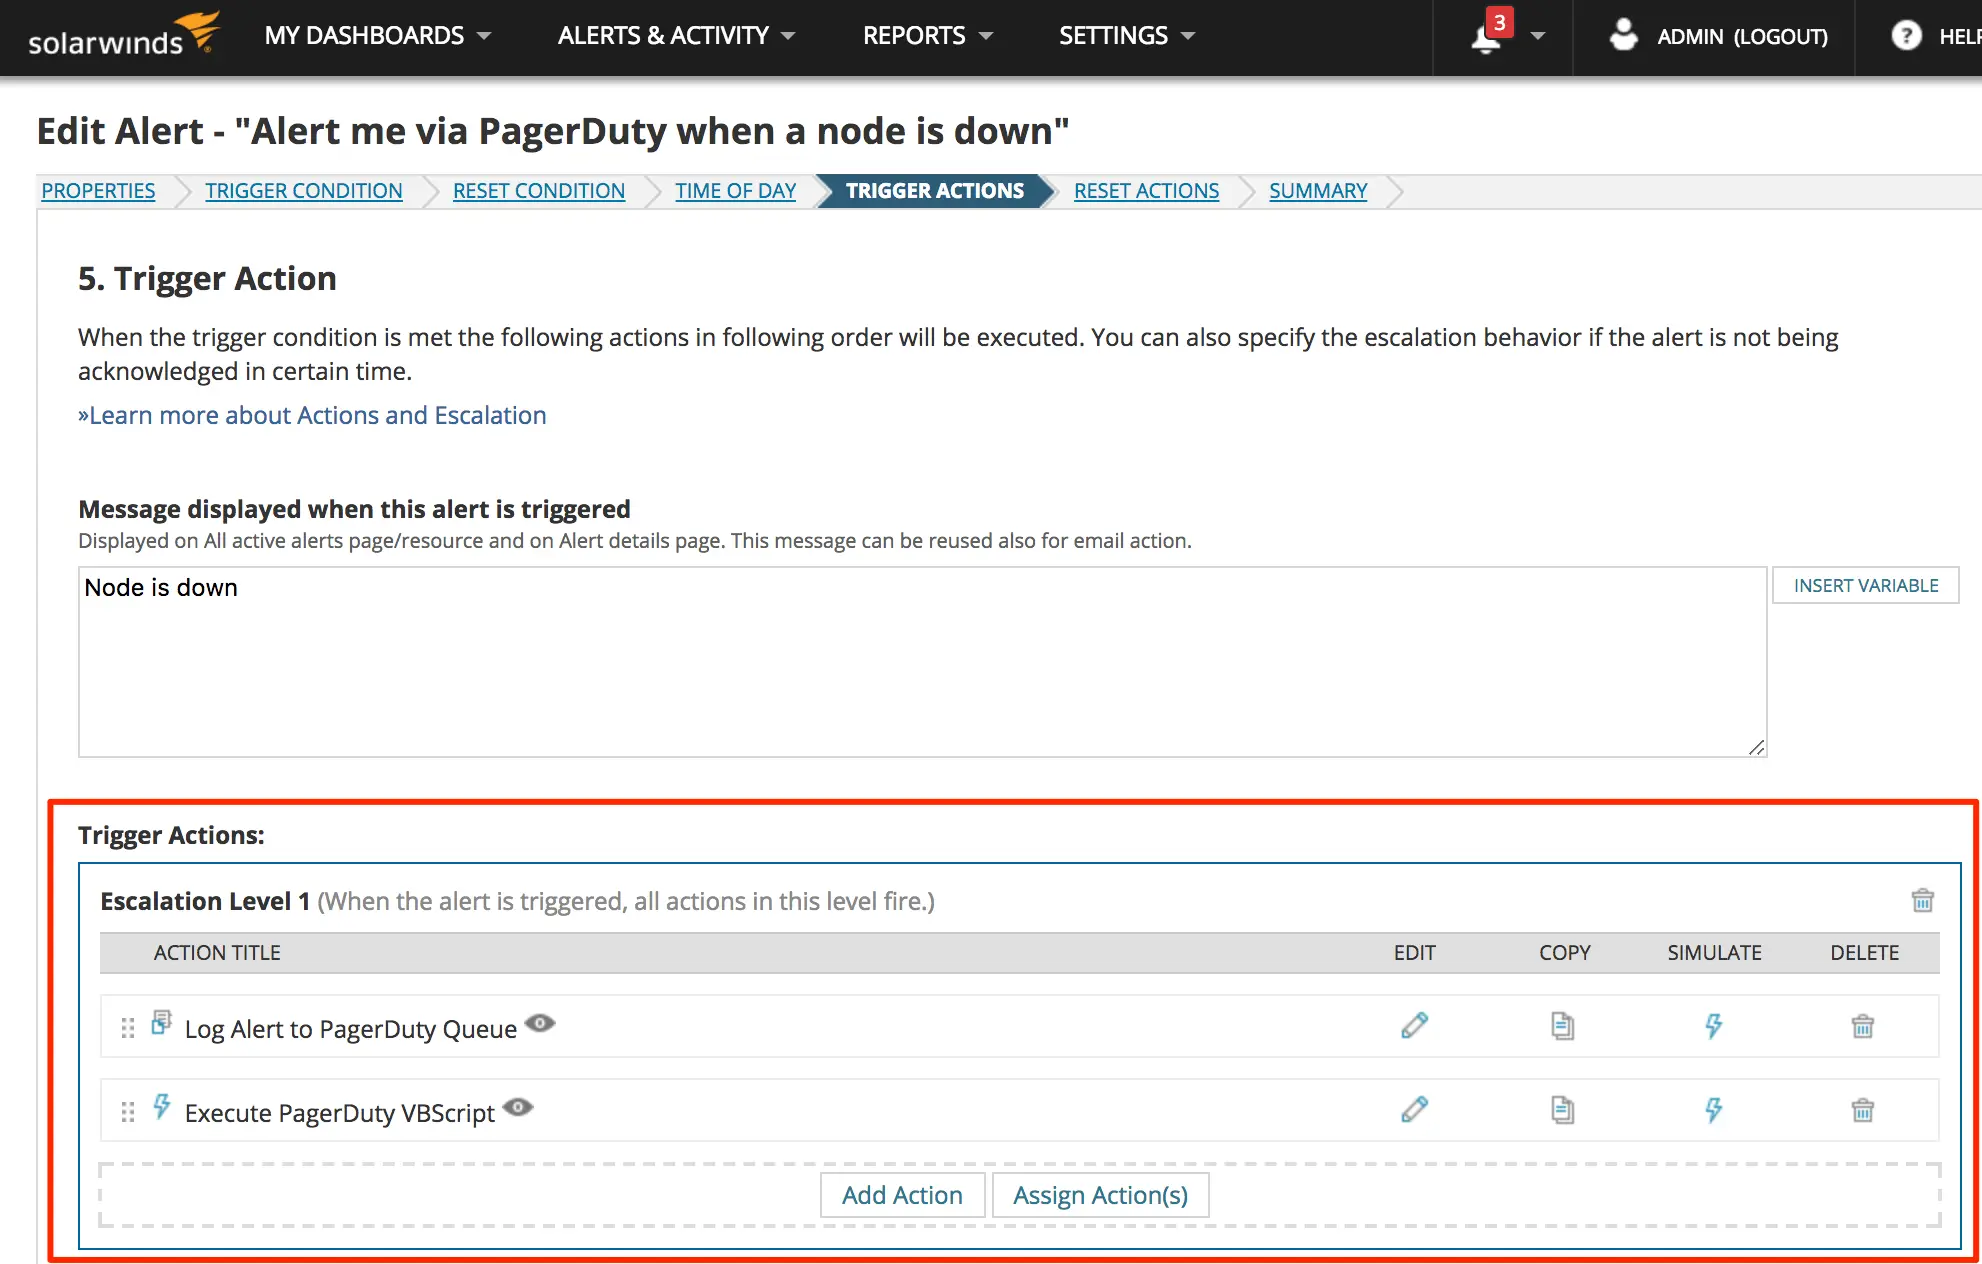 #### Blank or Invalid Integration Key Next, look for the `service_key` property in the JSON data, and verify that it has a valid integration key. This should be the 32-character key generated for the integration in the setup process. If the property is blank or does not exist, or if the integration key is not associated with any of your PagerDuty services, you should modify the node in question for the alert and set a value for the integration key as described in the [SolarWinds Integration Guide](https://www.pagerduty.com/docs/guides/SolarWinds-integration-guide/). #### Skip Alerts if the Integration Key is Blank If you see a line in the event file that looks like the following, then there is a node that lacks a value in the `PDIntegrationKey` field: ```xml "service_key": "", ``` One option to resolve this is to [set a value](#blank-or-invalid-integration-key) for the `PDIntegrationKey` field on the node(s) that produced the invalid events. However, there is another approach involving the **Trigger Condition** that will help you avoid this problem in the future. This alternate approach has the following advantages: - It will allow you to create nodes that optionally don't send alerts to PagerDuty. - It will avoid creating invalid alert events that collect in the queue folder. You can implement this with the following steps: 1. From the main menu, go to **Settings** → **All Settings**. 2. Under **Alerts** → **Reports** go to **Manage Alerts**. 3. Click an **alert** to edit it and go to the **Trigger Condition** step. 4. Make sure that conditions are combined with **AND**. 5. Click to add a trigger condition and select **Add Single Value Comparison**. 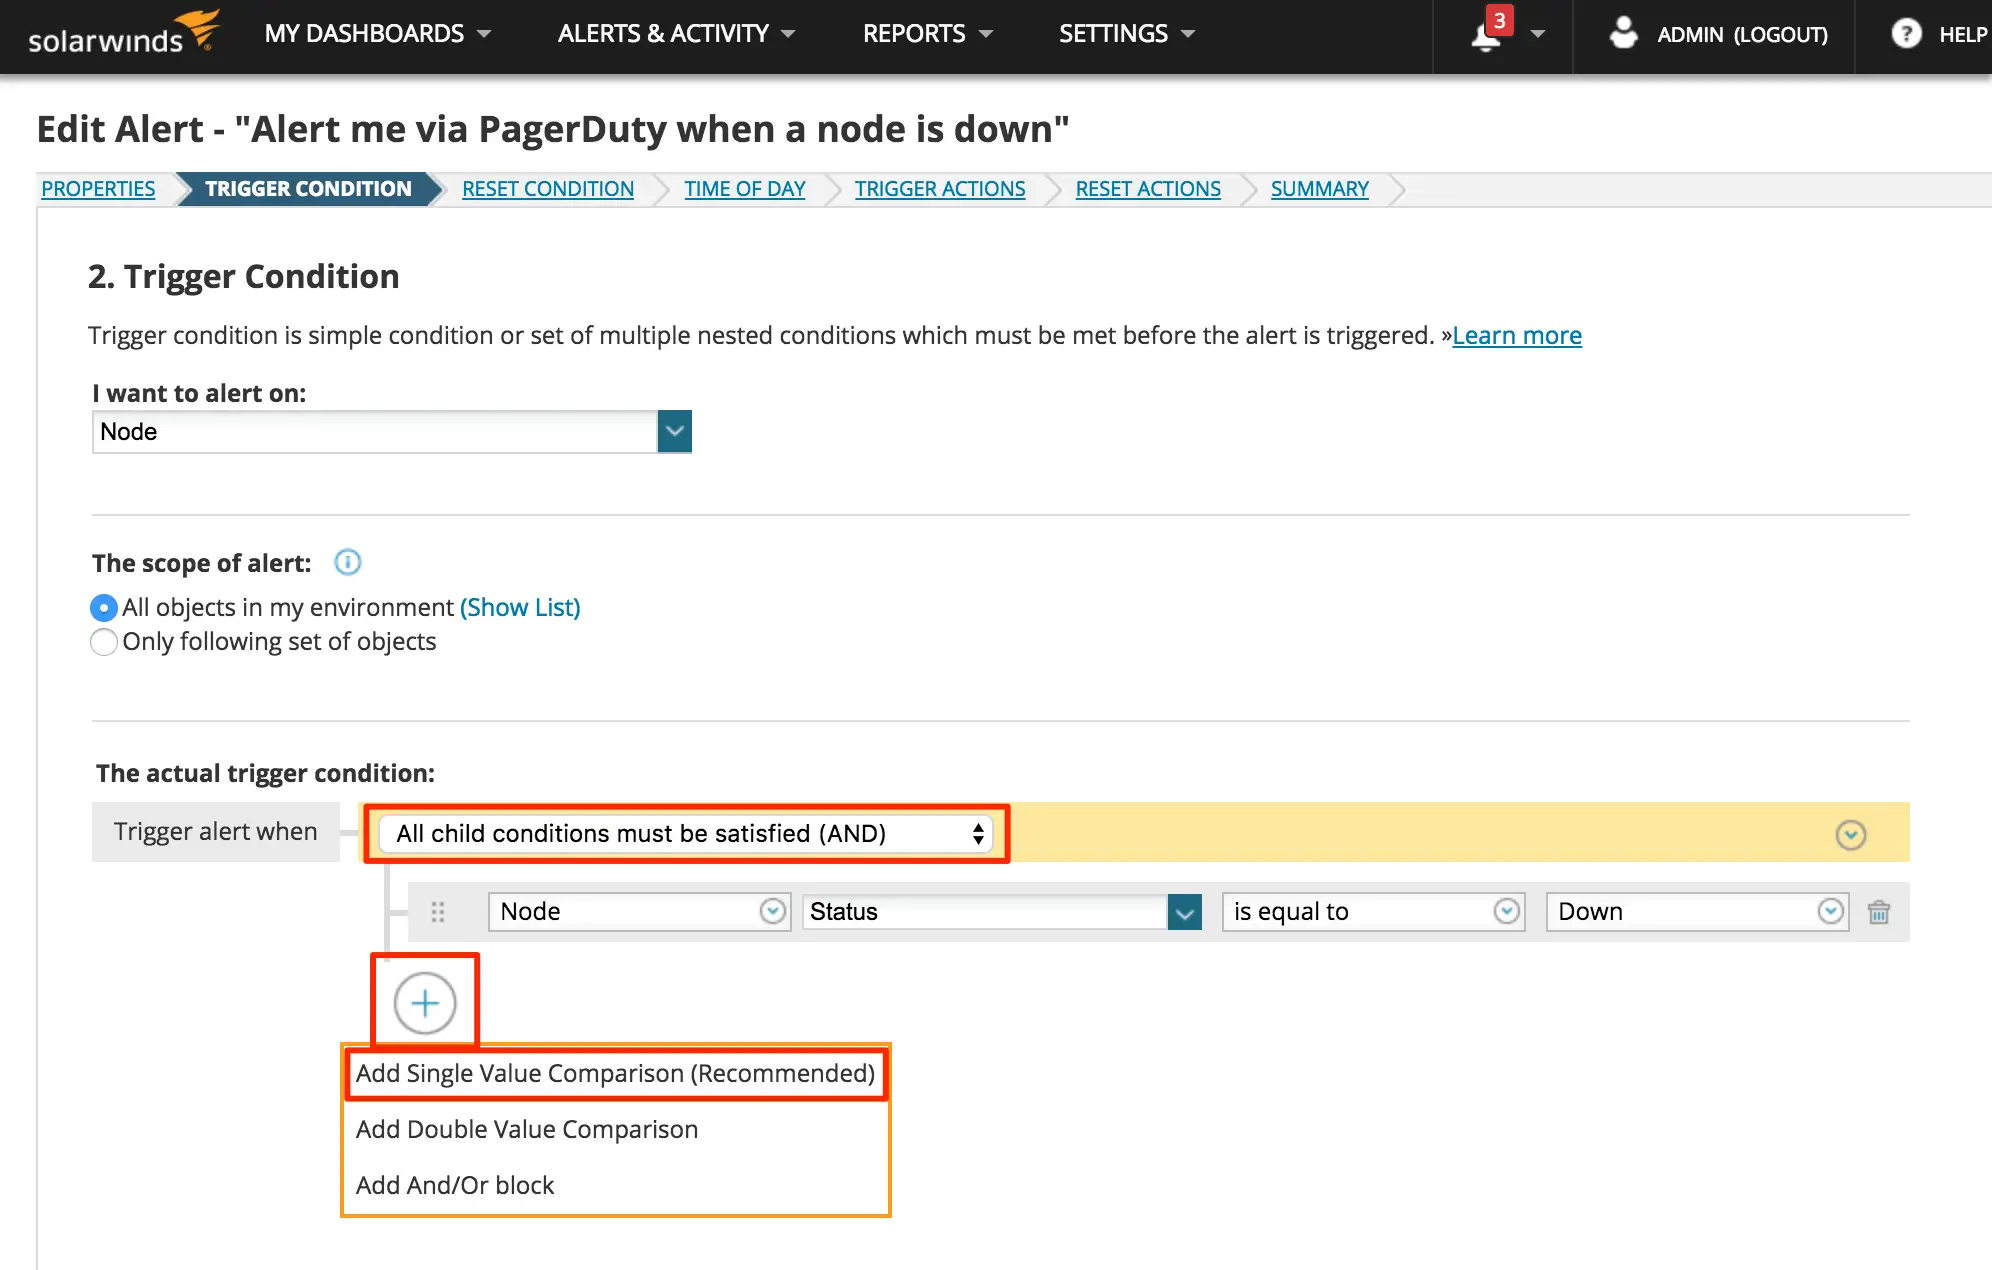 *Trigger conditions* 6. Set the condition to `Node :: PDIntegrationKey :: is not empty`. 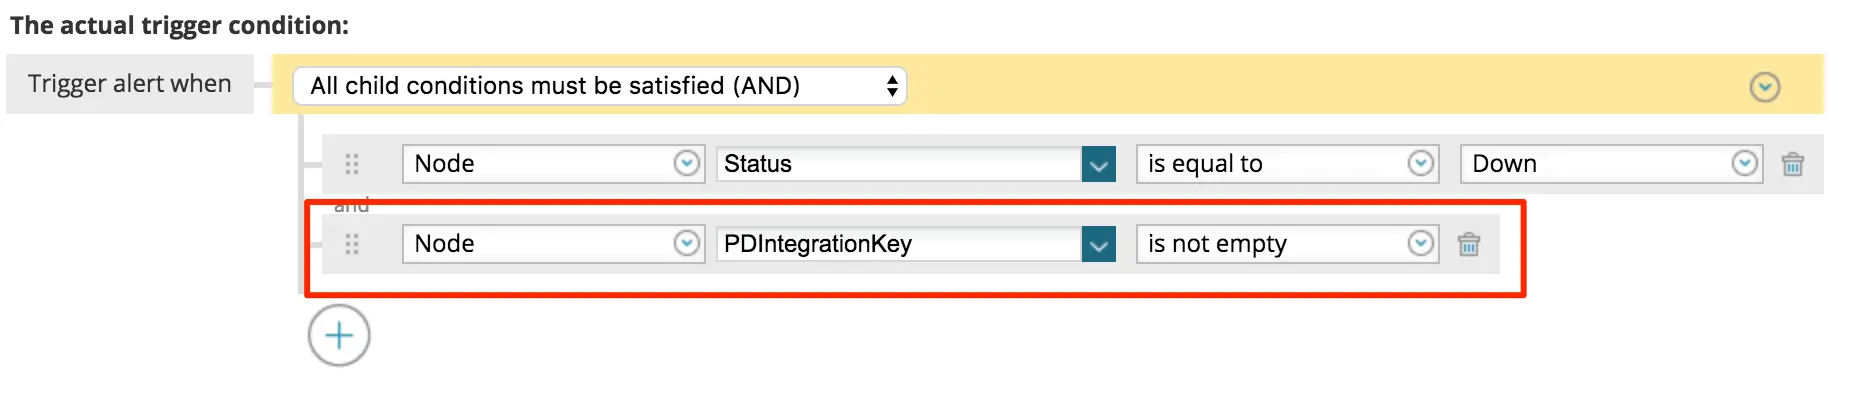 *Node "PDIntegrationKey" field is not empty* ### Review Application Log Errors The script’s error output can reveal useful troubleshooting information. Review this information with the following steps: 1. Go to **Control Panel** → **System and Security** → **Administrative Tools** → **Event Viewer**.  *Application log errors* 2. Select **Windows Logs** → **Application**.  *Select **Windows Logs > Application*** > **Connection to PagerDuty:** If the VBScript cannot connect to PagerDuty’s [Events API v1](/developer/events-api-v1-overview), you will see related errors in the Windows Event Logs. If you run the script manually, errors will appear in the command line output. 3. Look for an error source `WSH`: - If it is from `msxml3.dll` (or `msxml6.dll`) and the message is `Couldn't connect or send data to PagerDuty`, it indicates a network connection issue. - If the error is `File could not be opened` or similar, the issue is with the permissions and ownership of the file. 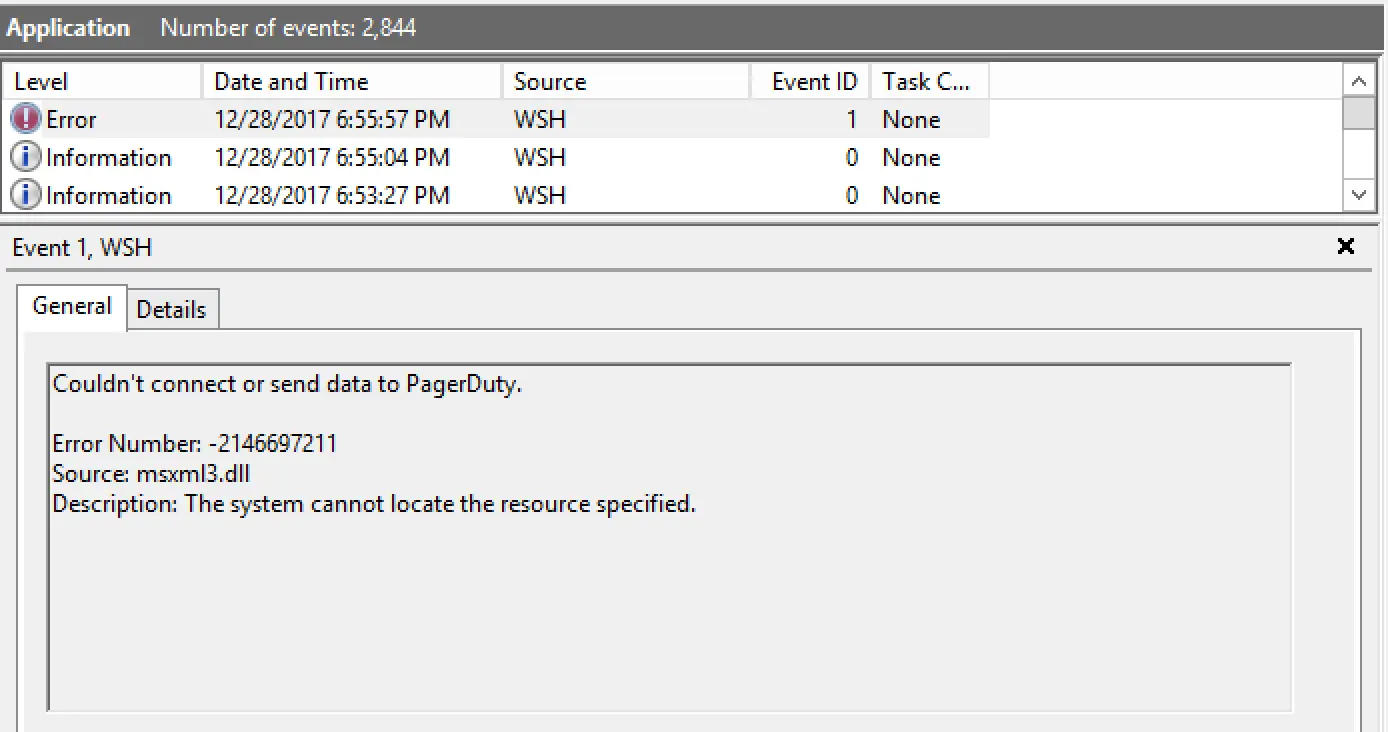 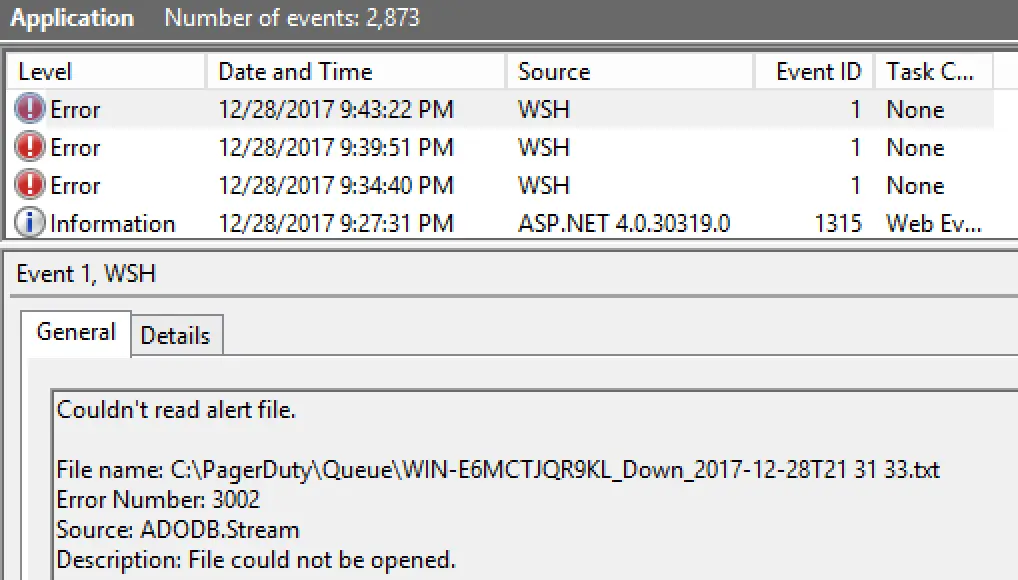 *Windows Event Logs error* ### Outbound HTTPS Connectivity If the problem appears to be network-related, perform the following diagnostic steps to determine the nature of the connection issue: 1. Try establishing a TCP connection via `telnet.exe events.pagerduty.com 443`. Note the following: - If you don't have the telnet client enabled on the SolarWinds server, you can enable it by following [Microsoft Technet's guide to enabling telnet on Windows 10](https://learn.microsoft.com/en-us/archive/technet-wiki/38433.windows-10-enabling-telnet-client). If for some reason you cannot enable telnet on the SolarWinds server, skip to the next step. - If you receive an `unknown host` error, this indicates a localized DNS resolution issue. - If you get a `Connect failed` error, it is due to firewall/ACL rules that prevent outbound TCP connections. - Otherwise, try typing in `GET /` and hit enter. If you see an HTTP 400 response, that means the TCP connection succeeded and `telnet` received a HTTP response from the Events API server.  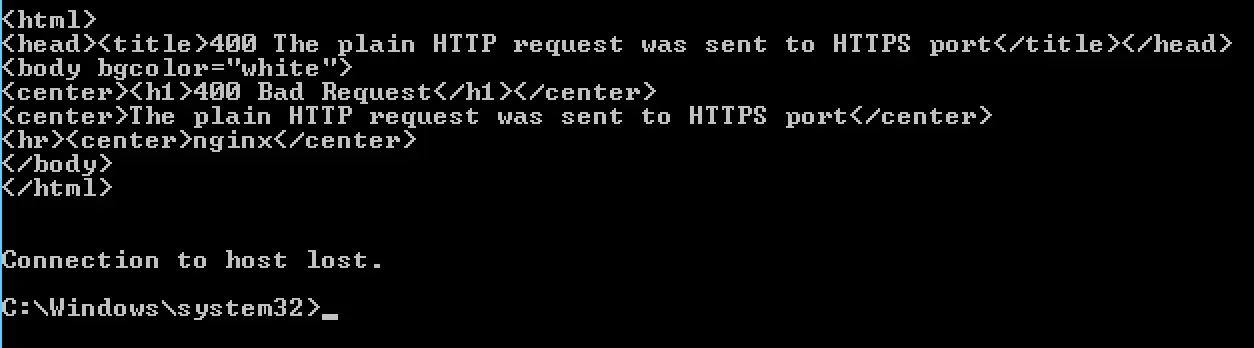 *Expected response when the TCP connection succeeded* 2. Open the Edge internet browser and navigate to `https://events.pagerduty.com`. - You should receive a HTTP response (status `404`) and a "webpage cannot be found" message, which indicates that both establishing a TCP connection and the TLS handshake succeeded. - If you were able to connect via Telnet but not Edge, this may indicate that the certificate authority behind the Events API's TLS certificate is not trusted locally. To resolve this, try adding the [GeoTrust Root CA certificates](https://www.digicert.com/kb/digicert-root-certificates.htm) to your trusted certificates. See [Microsoft Technet: Manage Trusted Root Certificates](https://learn.microsoft.com/en-us/previous-versions/windows/it-pro/windows-server-2008-R2-and-2008/cc754841(v=ws.11)?redirectedfrom=MSDN) for further details.  *Successful test*  *Possible certificate issue* Once you have gathered the necessary information about the nature of the connection issue, contact your local network or IT administrator for further assistance. Ask them to enable outbound HTTPS connections to remote hosts. It is also helpful to confirm there are no local firewall rules (e.g., on the SolarWinds server) that prevent connections. ## Alert Recovery Does Not Resolve PagerDuty Incident 1. Go to **Settings** → **All Settings** → **Manage Alerts**. 2. Select the alert that did not automatically resolve and go to the **Reset Actions** step. 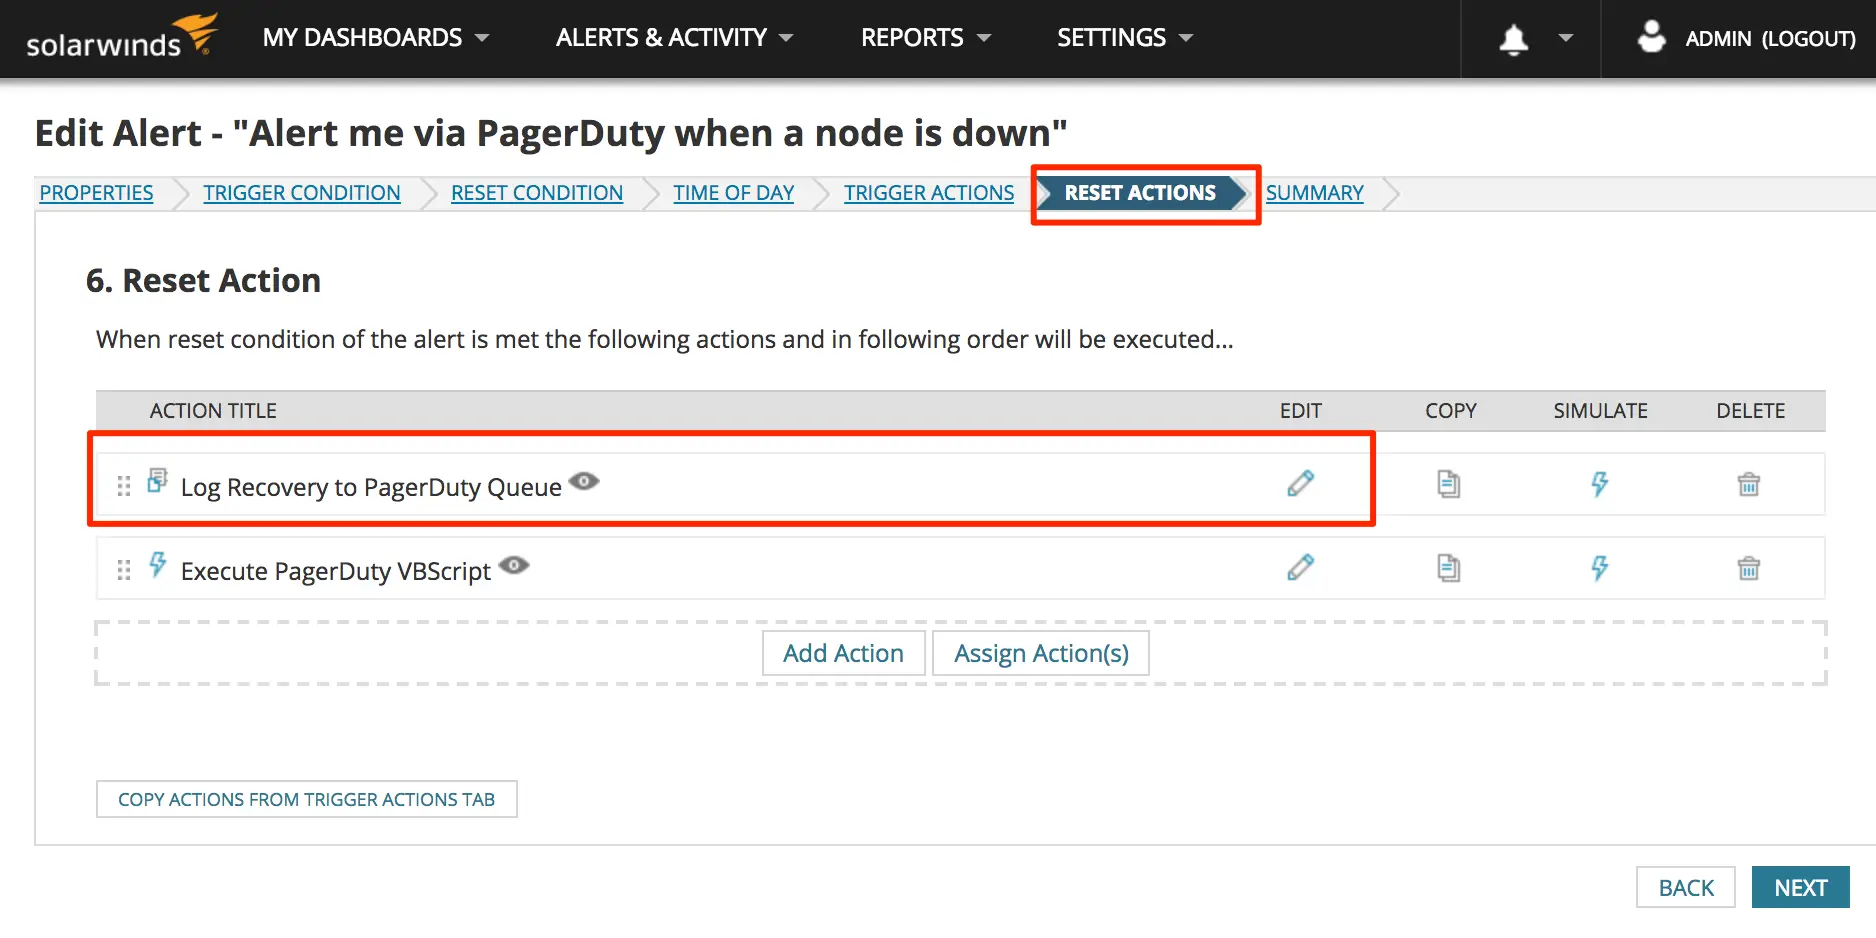 *Edit Alert* 3. Ensure that it has the **Log Recovery to PagerDuty Queue** action. 4. Edit the log-to-queue action, and make sure all of the following apply: - The `event_type` property in the JSON is `resolve`. - The `incident_key` is the same value as it is in the template for the log-to-queue action in the **Trigger Actions** step. 5. Simulate the recovery action and review the content of the file that it creates. Do the same with the alert action. Compare the `incident_key` values in both files. When a `resolve` event is sent to PagerDuty and its deduplication key does not match an existing open incident or alert, the event will be dropped because there is nothing for the resolve to act upon. If any template variables (e.g.,`${...}`) are present in the template, you will need to ensure that they are the right kind of variables, i.e., they must have the same values during the reset action as they have in the trigger action. For instance, node state is not an optimal choice of template variable to use in an incident deduplication key because the node state will be "Up" during the reset action, and likely "Down" for the alert action. --- URL: https://docs.pagerduty.com/integrations/upload-and-manage-enrichment-data # Upload and Manage Enrichment Data in the CDP Upload data to PagerDuty's Contextual Data Platform via CSV, verify it, and troubleshoot common errors The Contextual Data Platform (CDP) is PagerDuty's data storage layer that holds enrichment data used to add context to your events. CDP organizes contextual data into data tables that can be referenced in [Event Enrichment](/integrations/event-enrichment) rules to automatically inject information like team ownership, runbook links, CMDB details, and more into your alerts. The CDP consists of: **A. Enrichment Schema** - Defines the structure of a data table, including: - **Column names and types** - **Query fields** - Columns used to look up rows (match against incoming events) - **Enriched fields** - Columns that provide contextual data added to matched events **B. Enrichment Data** - The actual rows in a data table. Each row contains values for the columns defined by the schema. You populate this data by uploading CSV files or through integrations like ServiceNow. ## Upload Data to the Enrichment Service PagerDuty allows you to upload contextual data via CSV files to enrich your PagerDuty events. This guide covers three common workflows: - **[Create an Enrichment Schema from a CSV](#create-an-enrichment-schema-from-a-csv)** - Automatically generate a schema and upload data in one step. - **[Create a Schema Without Data](#create-a-schema-without-data)** - Define your schema structure first, add data later. - **[Add Data to an Existing Schema](#add-data-to-an-existing-schema)** - Upload additional CSV data to an existing schema. > **Prerequisites:** **API Endpoint**: `https://api.pagerduty.com` (or your regional PagerDuty API endpoint) > > **Authentication**: Include your API token in the Authorization header (see examples [below](#example-create-schema-and-upload-initial-data)) > > **CSV File Format**: First row must contain column headers matching your schema fields ## Create an Enrichment Schema from a CSV When you upload a CSV file, the Enrichment feature automatically generates a schema based on the CSV structure. The API will: 1. Automatically create a schema with the first column as the QUERY field and **all remaining columns** as ENRICHED fields. 2. Derive the schema name from the filename. 3. Set the description to `Auto generated schema from CSV upload`. 4. Accept the CSV file for asynchronous processing. 5. Return immediately with a `202 Accepted` response. ### Example: Create Schema and Upload Initial Data ```text curl -X POST "https://api.pagerduty.com/enrichment/schemas" \ -H "Authorization: Token token=YOUR_API_TOKEN" \ -H "Content-Type: multipart/form-data" \ -F "file=@team_data.csv;type=text/csv" ``` The schema is automatically generated from your CSV headers. ### CSV File Format Example Your `team_data.csv` must have column headers in the first row. ```text Application,Manager,Team,Runbook URL Authorization,alice@example.com,Auth Team,https://wiki.example.com/auth Payment API,bob@example.com,Payments Team,https://wiki.example.com/payments User Service,carol@example.com,User Platform,https://wiki.example.com/users ``` In this example: - **Application** (first column) becomes a QUERY field used to match against incoming events. - **Manager, Team, Runbook URL** (remaining columns) become ENRICHED fields and are added to matched events. #### Response ```json { "schema": { "id": "9f194d8d-0f58-4c5c-b1d2-a5adf7171821", "type": "enrichment_schema", "integration_type": "CSV", "name": "team_data", "description": "Auto generated schema from CSV upload", "fields": [ {"name": "Application", "type": "query"}, {"name": "Manager", "type": "enriched"}, {"name": "Team", "type": "enriched"}, {"name": "Runbook URL", "type": "enriched"} ], "created_at": "2026-02-23T15:17:30Z", "updated_at": "2026-02-23T15:17:30Z" } } ``` ### How Schema Auto-Generation Works The automatic schema generation follows these conventions: - **Schema name**: Derived from the uploaded filename without the .csv extension. - **Schema description**: Set to `Auto generated schema from CSV upload`. - **First column**: Becomes the QUERY field used to look up enrichment data. - **All other columns**: Become ENRICHED fields and is the data added to events. ### Updating Schema Name and Description After creation, you can update the schema name and description: ```text curl -X PUT "https://api.pagerduty.com/enrichment/schemas/9f194d8d-0f58-4c5c-b1d2-a5adf7171821" \ -H "Authorization: Token token=YOUR_API_TOKEN" \ -H "Content-Type: application/json" \ -d '{ "schema": { "name": "Application Runbooks", "description": "Maps applications to team leads and runbook information" } }' ``` ## Create a Schema Without Data If you need more control over your schema definition, such as multiple query fields, you can create a schema using JSON without uploading data. This is useful when you need to define your schema structure first and add data later. ### Example: Create Schema with JSON ```text curl -X POST "https://api.pagerduty.com/enrichment/schemas" \ -H "Authorization: Token token=YOUR_API_TOKEN" \ -H "Content-Type: application/json" \ -d '{ "name": "Application Environment Enrichment", "description": "Enriches events with team and runbook information based on application and environment", "integration_type": "CSV", "fields": [ {"name": "Application", "type": "query"}, {"name": "Environment", "type": "query"}, {"name": "Manager", "type": "enriched"}, {"name": "Team", "type": "enriched"}, {"name": "Runbook URL", "type": "enriched"} ] }' ``` #### Response ```json { "schema": { "id": "a1b2c3d4-e5f6-7890-abcd-ef1234567890", "type": "enrichment_schema", "integration_type": "CSV", "name": "Application Environment Enrichment", "description": "Enriches events with team and runbook information based on application and environment", "fields": [ {"name": "Application", "type": "query"}, {"name": "Environment", "type": "query"}, {"name": "Manager", "type": "enriched"}, {"name": "Team", "type": "enriched"}, {"name": "Runbook URL", "type": "enriched"} ], "created_at": "2026-02-23T15:17:30Z", "updated_at": "2026-02-23T15:17:30Z" } } ``` ### Benefits of JSON Schema Creation - **Multiple query fields**: Define multiple fields for matching (e.g., Application + Environment). - **Custom field order**: Control the exact order of fields. - **Explicit naming:** Choose meaningful schema names upfront. - **Field type control:** Explicitly define which fields are QUERY vs ENRICHED fields. ### Field Types - `query`: Fields used to look up enrichment data. You can have 1-3 `query` fields. - `enriched`: Remaining fields that will be added to matched events. > **Note:** After creating the schema, you can upload CSV data using the [Add Data to an Existing Schema method](#add-data-to-an-existing-schema). ## Add Data to an Existing Schema Once you have created a schema, you can upload additional CSV files to add or update ENRICHMENT data. ### Example: Upload CSV to Existing Schema ```text curl -X POST "https://api.pagerduty.com/enrichment/schemas/a1b2c3d4-e5f6-7890-abcd-ef1234567890/records" \ -H "Authorization: Token token=YOUR_API_TOKEN" \ -H "Content-Type: multipart/form-data" \ -F "file=@enrichment_data.csv;type=text/csv" ``` ### CSV File Format for Upload Your CSV must include all fields defined in the schema (both query and enriched fields): ```text Application,Environment,Manager,Team,Runbook URL Authorization,production,alice@example.com,Auth Team,https://wiki.example.com/auth Authorization,staging,alice@example.com,Auth Team,https://wiki.example.com/auth-staging Payment API,production,bob@example.com,Payments Team,https://wiki.example.com/payments User Service,production,carol@example.com,User Platform,https://wiki.example.com/users ``` #### Response ```json { "upload_id": "605d87a2-c67c-441e-a4cb-dbbbd94a340c", "schema_id": "a1b2c3d4-e5f6-7890-abcd-ef1234567890", "filename": "enrichment_data.csv", "size_bytes": 2048, "status": "accepted", "accepted_at": "2026-02-23T16:30:00Z" } ``` > **Important Notes:** - The CSV file must contain columns matching the fields defined in your schema. > - Missing columns will result in empty values for those fields. > - Extra columns in the CSV that don't match schema fields will be ignored. > - Records are identified by the **combination of query field values** (case-insensitive). > - Uploading the same query field combination again will **update** the existing record (not create a duplicate). ## Verify Your Data ### List All Records in a Schema You can list all records in a schema to verify your data was uploaded correctly. ```text curl -X GET "https://api.pagerduty.com/enrichment/schemas/a1b2c3d4-e5f6-7890-abcd-ef1234567890/records" \ -H "Authorization: Token token=YOUR_API_TOKEN" ``` #### Response ```json { "schema_id": "a1b2c3d4-e5f6-7890-abcd-ef1234567890", "records": [ { "record_id": "a3b2c1d4e5f6", "type": "enrichment_record", "created_at": "2026-02-23T15:17:30Z", "enrichment_data": { "Application": "Authorization", "Environment": "production", "Manager": "alice@example.com", "Team": "Auth Team", "Runbook URL": "https://wiki.example.com/auth" } }, { "record_id": "b4c3d2e1f678", "type": "enrichment_record", "created_at": "2026-02-23T15:17:30Z", "enrichment_data": { "Application": "Payment API", "Environment": "production", "Manager": "bob@example.com", "Team": "Payments Team", "Runbook URL": "https://wiki.example.com/payments" } } ], "next_cursor": null } ``` The `next_cursor` field contains a pagination token if there are more records. Pass it as a `?cursor=` query parameter to fetch the next page. ### Query a Specific Record You can also query for a specific record by providing values for all query fields. ```text curl -X POST "https://api.pagerduty.com/enrichment/query" \ -H "Authorization: Token token=YOUR_API_TOKEN" \ -H "Content-Type: application/json" \ -d '{ "schema_id": "a1b2c3d4-e5f6-7890-abcd-ef1234567890", "query": [ {"field": "Application", "value": "Authorization"}, {"field": "Environment", "value": "production"} ] }' ``` > **Note:** When querying, you must provide values for **all query fields** defined in your schema. #### Response ```json { "records": [ { "record_id": "a3b2c1d4e5f6", "type": "enrichment_record", "created_at": "2026-02-23T15:17:30Z", "enrichment_data": { "Application": "Authorization", "Environment": "production", "Manager": "alice@example.com", "Team": "Auth Team", "Runbook URL": "https://wiki.example.com/auth" } } ] } ``` ## Delete a Record You can permanently delete a single enrichment record by its record ID. This is a hard delete — the record cannot be recovered. ```text curl -X DELETE "https://api.pagerduty.com/enrichment/schemas/a1b2c3d4-e5f6-7890-abcd-ef1234567890/records/a3b2c1d4e5f6" \ -H "Authorization: Token token=YOUR_API_TOKEN" ``` ## Delete a Schema You can delete an enrichment schema when it is no longer needed. Only CSV type schemas can be deleted through the API. ```text curl -X DELETE "https://api.pagerduty.com/enrichment/schemas/a1b2c3d4-e5f6-7890-abcd-ef1234567890" \ -H "Authorization: Token token=YOUR_API_TOKEN" ``` ## ServiceNow CMDB Integration PagerDuty also provides a first class integration with ServiceNow that provides a managed data source for Enrichment that automatically creates schemas and synchronizes data to them from ServiceNow CMDB tables. When using the ServiceNow integration the Enrichment Schemas and data tables used for Event Enrichment are automatically managed for you. See the [ServiceNow CMDB Integration Guide](/integrations/servicenow-integration-guide/servicenow-cmdb-integration-setup-guide) for complete setup instructions. ## Troubleshooting ### 400 Bad Request - When creating schema from CSV - Check that your CSV file size doesn't exceed 10MB (maximum allowed). - Verify the file has a `.csv` extension. - Ensure the CSV has at least 2 columns (one query field, one enriched field). - Check that the Content-Type is set to multipart/form-data or text/csv. - Check that the CSV filename is unique. Auto-generated schemas derive their name from the uploaded filename and schema names must be unique. ### 400 Bad Request - When creating schema with JSON - Ensure you have at least one query field and one enriched field. - Verify field names are unique within the schema. - Check that field types are either `query` or `enriched`. - Ensure schema name is 50 characters or less. - Ensure description is 2048 characters or less. ### 400 Bad Request - When adding data to a schema - Check that your CSV file is properly formatted with valid syntax. - Verify the file is not corrupted. - Ensure CSV headers don't contain special characters that could cause parsing issues. ### 404 Not Found - When adding data to a schema - Verify the schema ID exists and hasn't been deleted. - Check that you're using the correct endpoint URL. - Ensure you have access to the schema in your account. ### Additional Resources - To list all your schemas: `GET https://api.pagerduty.com/enrichment/schemas` - To view schema details: `GET https://api.pagerduty.com/enrichment/schemas/{schemaId}` - To list records in a schema: `GET https://api.pagerduty.com/enrichment/schemas/{schema_id}/records` - To delete a schema: `DELETE https://api.pagerduty.com/enrichment/schemas/{schema_id}` --- URL: https://docs.pagerduty.com/integrations/webhooks # Webhooks Configure and manage V3 webhook subscriptions, including migrating existing V1 and V2 webhook extensions to the current version. Webhooks allow you to receive HTTP callbacks when significant events happen in your PagerDuty account — for example, when an incident triggers, escalates, or resolves. Details about the event are sent to your specified URL, such as [Slack](/integrations/slack-integration-guide) or your own [custom PagerDuty webhook processor](/developer/webhooks-overview). > **Migrate to V3 Webhook Subscriptions:** - If you are currently using [V1/V2 webhook extensions](/integrations/extensions) and need to migrate to V3 webhook subscriptions, follow the [Migration Guide](#migrate-from-v1v2-generic-extensions-to-v3-webhook-subscriptions) or use the [migration script](https://github.com/PagerDuty/public-support-scripts/tree/master/migrate_webhooks_to_v3) (provided as is). > - An end-of-life date for V2 webhooks has not been set. End-of-support for V2 webhooks began on October 31, 2022. Existing integrations based on V2 webhooks will continue to work; however, PagerDuty cannot accept new feature requests or implement bug fixes. > - V1 webhook extensions became unsupported on November 13, 2021 and lost functionality on October 31, 2022. See [Webhook V1 Alternatives](/integrations/webhooks) for a list of affected integrations and alternative solutions. ## Webhook IPs > **Safelist Updates:** As of May 5, 2022, the `/webhook_ips` endpoint will no longer be updated. Use the page linked below for all safelist updates. For a list of IP addresses that PagerDuty uses to send webhooks in each service region, visit the [Developer Documentation](/developer/webhook-ips). These IP addresses apply to incident and event webhooks. They do not apply to [External Status Page](/incident-management/communicate/external-status-page) webhook subscriptions, which are sent from a separate system with unpublished source addresses. ## Manage V3 Webhook Subscriptions You can manage V3 webhook subscriptions in two places: - [On the Generic Webhooks Page](#add-a-v3-webhook-subscription-on-the-generic-webhooks-page) - [On the Service Details Page](#add-a-v3-webhook-subscription-on-the-service-details-page) > **Required User Permissions:** The following roles can manage V3 webhook subscriptions: > > - Manager base role (for service-level and Team-level webhooks) > - Users with a Manager Team role (for service-level and Team-level webhooks associated with their Teams) > - Admin/Global Admin > - Account Owner > > If you do not see **Integrations** in the menu due to your user role (for example, a Restricted Access user with a Manager Team role), manage V3 webhook subscriptions on the [Service Details Page](#add-a-v3-webhook-subscription-on-the-service-details-page). > **Product Limit:** You can create up to 10 webhook subscriptions per unique service and [Team](/account-admin/teams) ID (for example, `PXXXXXX`), as well as for the account-level scope. Attempts to create additional webhook subscriptions generate an error: `Failed to create webhook. Webhook subscription limit exceeded for the selected scope.` > > Read more about the **Product Limit Reached** error code (2019) in the developer documentation: [PagerDuty Error Codes](/developer/errors#pagerduty-error-codes). ### Add a V3 Webhook Subscription on the Generic Webhooks Page 1. Navigate to **Integrations** → **Generic Webhooks (v3)**. 2. Click **New Webhook** and complete the following fields: | Field | Value | | :--------------------------- | :-------------------------------------------------------- | | **Webhook URL** | Enter the webhook URL. | | **Description** (optional) | Enter an optional description. | | **Event Subscription** | Select the event types you would like to subscribe to. | | **Custom Header** (optional) | Enter a **Name** and **Value** to create a custom header. | 3. Click **Add Webhook**. A confirmation modal appears notifying you that the webhook has been created and supplies a secret if you would like to [verify webhook payloads](/developer/verifying-webhook-signatures). ### Edit a V3 Webhook Subscription on the Generic Webhooks Page 1. Navigate to **Integrations** → **Generic Webhooks (v3)**. 2. Select the webhook's URL or select → **Manage**. 3. Click **Edit** and make the required changes. 4. Click **Save Changes**. ### Delete a V3 Webhook Subscription on the Generic Webhooks Page 1. Navigate to **Integrations** → **Generic Webhooks (v3)**. 2. To the right of the webhook you would like to delete, select → **Delete**. 3. In the confirmation modal, click **Delete**. ### Add a V3 Webhook Subscription on the Service Details Page 1. Navigate to **Services** → **Service Directory** and select the service where you would like to add the webhook subscription. 2. Select the **Integrations** tab, scroll to the **Webhooks** section, and click **Add or manage webhooks for this service**. > **No V3 Webhooks Found on this Service:** If this is the first webhook subscription on the service, you see **No V3 webhooks found on this service**. Click **Webhook** to manage webhook subscriptions on the service, then continue to step 3.  *No V3 Webhooks Found on this Service* 3. Click **New Webhook** and complete the following fields: | Field | Value | | :--------------------------- | :-------------------------------------------------------- | | **Webhook URL** | Enter the webhook URL. | | **Description** (optional) | Enter an optional description. | | **Event Subscription** | Select the event types you would like to subscribe to. | | **Custom Header** (optional) | Enter a **Name** and **Value** to create a custom header. | 4. Click **Add Webhook**. A confirmation modal appears notifying you that the webhook has been created and supplies a secret if you would like to [verify webhook payloads](/developer/verifying-webhook-signatures). ### Edit a V3 Webhook Subscription on the Service Details Page 1. Navigate to **Services** → **Service Directory** and select the service where you would like to edit the webhook subscription. 2. Select the **Integrations** tab, scroll to the **Webhooks** section, and click **Add or manage webhooks for this service**. 3. Select the webhook's URL or select → **Manage**. 4. Click **Edit** and make the required changes. 5. Click **Save Changes**. ### Delete a V3 Webhook Subscription on the Service Details Page 1. Navigate to **Services** → **Service Directory** and select the service where you would like to delete the webhook subscription. 2. Select the **Integrations** tab, scroll to the **Webhooks** section, and click **Add or manage webhooks for this service**. 3. To the right of the webhook you would like to delete, select → **Delete**. 4. In the confirmation modal, click **Delete**. ### Send a Test Event 1. Navigate to **Integrations** → **Generic Webhooks (v3)**. 2. Select the webhook's URL or → **Manage**. 3. Under **Test**, click **Send Test Event**. 4. In the confirmation modal, click **Yes, Send Event**. The following is an example of the test event payload: ```json { "event": { "id": "01CH754SM17TWPE2V2H4VPBRO7", "event_type": "pagey.ping", "resource_type": "pagey", "occurred_at": "2021-12-08T22:58:53.510Z", "agent": null, "client": null, "data": { "message": "Hello from your friend Pagey!", "type": "ping" } } } ``` ## Supported Resources and Event Types The following resources and event types are available with V3 webhooks. Additional event types may be added over time. Refer to the [Developer documentation](/developer/webhooks-overview#event-types) for more information. ### Incidents | Event Type | Description | | :---------------------------- | :------------------------------------------------------------------------------------ | | `acknowledged` | Sent when an incident is acknowledged | | `annotated` | Sent when a note is added to an incident | | `conference_bridge.updated` | Sent when a conference bridge is updated | | `custom_field_values.updated` | Sent when custom field values are updated | | `delegated` | Sent when an incident has been reassigned to another escalation policy | | `escalated` | Sent when an incident has been escalated to another user in the same escalation level | | `incident_type.changed` | Sent when an incident has changed its incident type | | `priority_updated` | Sent when the priority of an incident has changed | | `reassigned` | Sent when an incident has been reassigned to another user | | `reopened` | Sent when an incident is reopened | | `resolved` | Sent when an incident has been resolved | | `responder.added` | Sent when a responder has been added to an incident | | `responder.replied` | Sent when a responder replies to a request | | `service_updated` | Sent when the service of an incident has changed | | `status_update_published` | Sent when a status update is added to an incident | | `triggered` | Sent when an incident is newly created/triggered | | `unacknowledged` | Sent when an incident is unacknowledged | | `workflow.completed` | Sent when an Incident Workflow finishes | | `workflow.started` | Sent when an Incident Workflow begins | ### Services | Event Type | Description | | :---------------------------- | :---------------------------------------------------- | | `created` | Sent when a service is created | | `deleted` | Sent when a service is deleted | | `updated` | Sent when a service is updated | | `custom_field_values.updated` | Sent when a service's custom field values are updated | ## V3 Webhook Subscriptions versus V1/V2 Webhook Extensions Conceptually, V3 webhook subscriptions and [V1/V2 generic webhook extensions](/integrations/extensions) are similar; however, there are some key differences: - **V3 Webhook Subscription**: A subscription configured to send a webhook to an endpoint every time an event happens on an incident within a specific scope (team or service). - **V1/V2 Generic Webhook Extension**: An endpoint configured to receive webhooks every time an incident is created, updated, or deleted. ### Key Differences #### Payload The final payload differs between V1/V2 and V3. The destination service of the webhook needs to be updated to handle the new payload. - [V3 payload explanation](/developer/webhooks-overview#webhook-payload) - [V2 payload explanation](/developer/webhooks-overview#webhook-payload) ##### Incident ID In V3 webhooks, the incident ID is found in a different payload location than in earlier versions. Use the following code snippet to extract the incident ID: ```javascript if event.data.type == "incident" { incident_id = event.data.id } else { incident_id = event.data.incident.id } ``` #### Custom Headers You can add custom headers to V3 webhook subscriptions in the web app: 1. Navigate to **Integrations** → **Generic Webhooks (v3)**. 2. Click **New Webhook** to create a new webhook subscription, or select an existing webhook and click **Edit**. 3. Under **Custom Headers**, click **Add custom header**. 4. Enter a **Name** and **Value** for your header. > **Unique Header Names:** Each custom header must have a unique **Name** if you add more than one. 5. Click **Save Changes**. Custom header values are redacted after saving for security.  *Redacted Custom Header* ##### Delete a Custom Header 1. Navigate to **Integrations** → **Generic Webhooks (v3)**. 2. Select a webhook and click **Edit**. 3. Under **Custom Headers**, click to the right of the custom header you want to delete. 4. Click **Save Changes**. #### Request Headers The `user-agent` header in the request displays which webhooks version was used: `PagerDuty-Webhook/V2.0` for V2 and `PagerDuty-Webhook/V3.0` for V3. V3 webhook subscriptions also introduce two new headers: `x-webhook-subscription` and `x-pagerduty-signature`. #### Version Comparison V3 webhook subscriptions offer more event types than previous versions. Note that some event types have a slight name difference between versions — for example, `trigger` (V1 and V2) and `triggered` (V3). | Resource | Event | V1 | V2 | V3 | | :------- | :------------------------------- | :- | :- | :- | | Incident | `trigger`/`triggered` | ✓ | ✓ | ✓ | | | `acknowledge`/`acknowledged` | ✓ | ✓ | ✓ | | | `unacknowledge`/`unacknowledged` | ✓ | ✓ | ✓ | | | `resolve`/`resolved` | ✓ | ✓ | ✓ | | | `assign` | ✓ | ✓ | ✓ | | | `escalate`/`escalated` | ✓ | ✓ | ✓ | | | `delegate`/`delegated` | ✓ | ✓ | ✓ | | | `annotate`/`annotated` | | ✓ | ✓ | | | `priority_updated` | | | ✓ | | | `reassigned` | | | ✓ | | | `reopened` | | | ✓ | | | `responder.added` | | | ✓ | | | `responder.replied` | | | ✓ | | | `status_update_published` | | | ✓ | | | `conference_bridge.updated` | | | ✓ | | | `custom_field_values.updated` | | | ✓ | | | `workflow.completed` | | | ✓ | | | `workflow.started` | | | ✓ | | | `incident_type.changed` | | | ✓ | | | `service_updated` | | | ✓ | | Service | `created` | | | ✓ | | | `deleted` | | | ✓ | | | `updated` | | | ✓ | | | `custom_field_values.updated` | | | ✓ | ## Migrate from V1/V2 Generic Extensions to V3 Webhook Subscriptions There are two options to migrate to V3 webhook subscriptions: - Follow the [Migration Guide](#migration-guide) below. - Use the [migration script](https://github.com/PagerDuty/public-support-scripts/tree/master/migrate_webhooks_to_v3) (provided as is). ### Migration Guide The following guide explains how to migrate existing V1/V2 generic webhook extensions to V3 webhook subscriptions. End-of-support for V2 webhooks began on October 31, 2022, and an end-of-life date is TBD. V1 webhook extensions became unsupported on November 13, 2021 and lost functionality in October 2022. > **Required User Permissions:** - Admins and Account Owners can migrate an account's V1/V2 webhook extensions to V3 webhook subscriptions. > - Team Managers can migrate a subset of an account's V1/V2 webhook extensions to V3 webhook subscriptions based on their Team access. #### Step 1: Generate an API Key **Admins and Account Owners:** 1. Navigate to **Integrations** → **API Access Keys** and click **Create New API Key**. 2. Enter a **Description** to help you identify the key later. Check **Read-only** if you want to restrict the key to read-only access. Click **Create Key**. 3. Copy the generated API key to a secure location — this is the only time it is displayed in full. Click **Close**. If you lose the key, you must delete it and create a new one. **Team Managers:** > **Restrictions:** Team Managers can only migrate webhooks for the Teams they are assigned to. To migrate webhooks for an entire account, have an Admin or Account Owner perform the steps above. 1. Navigate to **User Icon** → **My Profile** → **User Settings** → **Create API User Token**. 2. Enter a **Description** to help you identify the key later. 3. Copy the generated user API key to a secure location — this is the only time it is displayed in full. Click **Close**. If you lose the key, you must delete it and create a new one. #### Step 2: Get a List of Existing Webhooks Get a list of existing V2 webhooks using the [extensions API endpoint](/developer/api/reference/rest/extensions/list-extensions). Set the `query` field in the request to `webhook` to filter by Generic Webhooks only. If the extension has a name other than Generic Webhook, use that name in the `query` field instead. > **Team Managers:** Filter results by services belonging to your Team(s). In this example, calling the `GET /extensions` endpoint returns a list containing a single extension: ```json { "extensions": [ { "endpoint_url": "https://example.com/webhooks_go_here", "name": "My Webhook", "config": { "headers": null, "referer": "https://subdomain.pagerduty.com/extensions" }, "extension_schema": { "id": "PJFWPEP", "type": "extension_schema_reference", "summary": "Generic V2 Webhook", "self": "https://api.pagerduty.com/extension_schemas/PJFWPEP", "html_url": null }, "extension_objects": [ { "id": "PYKHOXQ", "type": "service_reference", "summary": "My Application Service", "self": "https://api.pagerduty.com/services/PYKHOXQ", "html_url": "https://subdomain.pagerduty.com/service-directory/PYKHOXQ" } ], "id": "PUGLEKG", "type": "webhook", "summary": "My Webhook", "self": "https://api.pd-staging.com/webhooks/PUGLEKG", "html_url": null } ], "query": "webhook", "limit": 25, "offset": 0, "total": null, "more": false } ``` #### Step 3: Note the Important Fields For each `extension` in the `extensions` array returned in Step 2, take note of the `endpoint_url`, `name`, and `id`. To identify the service the extension is linked with, note the `id` and `type` inside the `extension_objects` array. From the response in Step 2, take note of lines 4, 5, 19, 20, and 26. #### Step 4: Decide on Event Types V3 webhook subscriptions introduce a new way to refine subscriptions with event types. Before creating a new V3 webhook subscription, select the [event types](/developer/webhooks-overview#event-types) you want to receive. > **Replicating V2 Behavior:** To receive the same data as a V2 generic webhook extension, all V3 event types must be added. To replicate the existing behavior of the V2 generic webhook extension, use all available `event_types`: ```json "incident.acknowledged" "incident.annotated" "incident.delegated" "incident.escalated" "incident.priority_updated" "incident.reassigned" "incident.reopened" "incident.resolved" "incident.responder.added" "incident.responder.replied" "incident.triggered" "incident.unacknowledged" ``` #### Step 5: Create a New V3 Webhook Subscription Using the [webhook subscriptions API endpoint](/developer/api/reference/rest/webhooks/create-webhook-subscription), create a new webhook subscription. The following table maps the V2 request fields to the V3 request fields: | V2 Generic Webhook Extension | V3 Webhook Subscription | | :--------------------------- | :---------------------- | | `endpoint_url` | `delivery_method.url` | | `name` | `description` | | `extension_objects.id` | `filter.id` | | `extension_objects.type` | `filter.type` | The new request to `POST /webhook_subscriptions` looks like the following: ```json { "webhook_subscription": { "delivery_method": { "type": "http_delivery_method", "url": "https://example.com/webhooks_go_here" }, "description": "My Webhook", "events": [ "incident.acknowledged", "incident.annotated", "incident.delegated", "incident.escalated", "incident.priority_updated", "incident.reassigned", "incident.reopened", "incident.resolved", "incident.responder.added", "incident.responder.replied", "incident.triggered", "incident.unacknowledged" ], "filter": { "id": "PYKHOXQ", "type": "service_reference" }, "type": "webhook_subscription" } } ``` #### Step 6: Clean Up A new V3 webhook subscription has been created to replicate the existing V1 or V2 generic webhook extension. Duplicate webhooks are sent as long as both V1/V2 and V3 subscriptions exist. Once you confirm that the new V3 webhook subscription is functional, [delete the old generic webhook extension](/developer/api/reference/rest/extensions/delete-extension) using the `id` found in Step 2. From the example in Step 2, the old extension `id` is found on line 26. --- URL: https://docs.pagerduty.com/integrations/zabbix-troubleshooting-guide # Zabbix Troubleshooting Guide Identify and resolve common Zabbix integration issues You may run into some issues when integrating Zabbix with PagerDuty. Troubleshooting steps will vary depending on which integration you use: - [General Configuration Troubleshooting](#general-configuration-troubleshooting) - [Agent-Based Integration](#agent-based-integration) - [Python-Based Integration](#python-based-integration) ## General Configuration Troubleshooting ### Review Zabbix Logs If PagerDuty is not receiving Zabbix events, check your Zabbix logs. You can see if the PagerDuty action was called and if there were any related errors To view your Zabbix logs: **For Zabbix 2.x**: Navigate to **Monitoring** → **Events**, then click the **event timestamp** for the problem event. Check the **Message actions** section in the event details. **For Zabbix 3.x-7.x**: Navigate to **Reports** → **Action Log** to view the status of the Zabbix event. ### PagerDuty User/Action Configuration in Zabbix If events are not being sent to the PagerDuty user/action in Zabbix, please check the following: - Make sure the PagerDuty group in Zabbix has read permissions for the hosts and/or host groups in question. Also confirm that the PagerDuty user is in the PagerDuty group. - Check that the PagerDuty media type is **enabled** under **Alerts** → **Media types**. ### Zabbix Events not Received in PagerDuty Events may look like they were sent to the PagerDuty user/action, but do not appear in PagerDuty. If this happens, please check the following: - Both the `zabbix-agent` and `zabbix-server` services must be running for Zabbix to send notifications to PagerDuty. To check that these are running use the following commands: ```shell $ service zabbix-agent status $ service zabbix-server status ``` - Make sure your Zabbix server can make outbound HTTP/HTTPS connections to `events.pagerduty.com` on ports 80 and 443. If your environment requires a proxy to be set for outbound HTTP/HTTPS connections, make sure you [set the proxy in the agent configuration](/integrations/pagerduty-agent-integration-guide#using-a-proxy) or see the information below for [using a proxy with the old Python integration](#python-based-integration). - Check that the integration key is set correctly in your PagerDuty user's media settings. - If you see an error such as "pagerduty_python: PagerDuty server REJECTED the event in file...Event object is invalid," check the trigger and recovery subjects and message formats in your PagerDuty action. 1. Under **Alerts** → **Actions**, your desired action type and then select the action you configured to notify PagerDuty. 2. Remove any extra characters, such as whitespace or newline characters, after the text so that the configuration exactly matches the following: **Default subject**: `trigger` **Recovery subject**: `resolve` **Default message** and **Recovery message**: ``` name:{TRIGGER.NAME} id:{TRIGGER.ID} status:{TRIGGER.STATUS} hostname:{HOSTNAME} ip:{IPADDRESS} value:{TRIGGER.VALUE} event_id:{EVENT.ID} severity:{TRIGGER.SEVERITY} ``` - If you're using Zabbix 3.x, make sure you have specified these script parameters for the PagerDuty media type under **Administration** → **Media types**: - `{ALERT.SENDTO}` - `{ALERT.SUBJECT}` - `{ALERT.MESSAGE}` 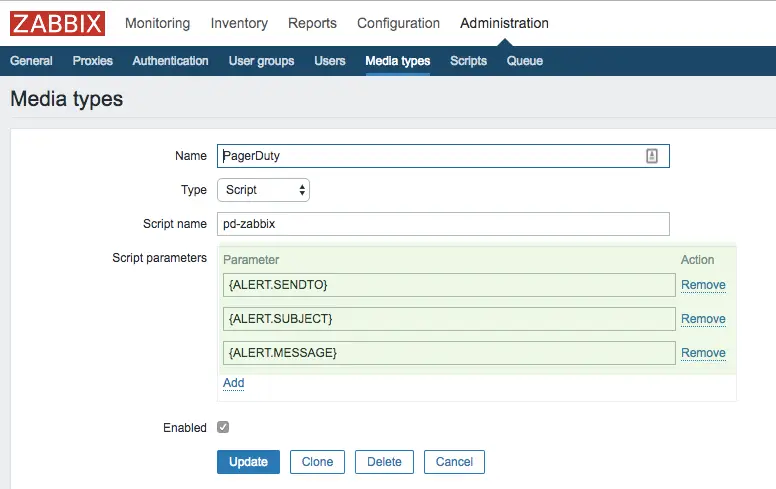 - Refer to our [Why Incidents Fail to Trigger](/incident-management/incidents/why-incidents-fail-to-trigger) article for additional PagerDuty-specific troubleshooting steps. ### PagerDuty Incidents not Resolving after Recovery in Zabbix Please check the following items to ensure that Zabbix can deliver recovery events to PagerDuty and resolve associated incidents: - Ensure that your **PagerDuty Notifications** action has messaging operations (send to user/group) defined for its **Recovery operations**. - Make sure that the **PagerDuty Notifications** action’s messaging operations use the same message template for both the main action and the recovery action. - Make sure the message template is the one given in the integration guide for your Zabbix integration: [Zabbix 4.x-7.x Integration Guide](https://www.zabbix.com/integrations/pagerduty), [Zabbix 3.x Integration Guide](https://www.pagerduty.com/docs/guides/zabbix-3-integration-guide/), [Zabbix 1.x Integration Guide](https://www.pagerduty.com/docs/guides/zabbix-1-integration-guide/). - Ensure that the recovery operation’s default message subject is `resolve` (case sensitive). - Ensure that the trigger event and recovery event use the same value for the incident_key. This is how PagerDuty matches and [resolves alerts](/incident-management/incidents/alerts#resolve-alerts). The default value used by the integration is `{EVENT.ID}`. ## Agent-Based Integration ### Verify the Agent is Installed When an issue with the agent-based installation arises, it is commonly related to the agent installation (i.e., trying to install the agent on an incompatible distribution, such as CentOS 5). The first step in troubleshooting agent-based integrations is to make sure that the [PagerDuty Agent](/integrations/pagerduty-agent-integration-guide) is both compatible with your distribution and successfully installed. **CentOS 5 users**: Please use the [Python-based integration](https://www.pagerduty.com/docs/guides/zabbix-integration-guide-agentless/), as the PagerDuty Agent requires a newer version of Python than the version available with CentOS 5. ### Verify the Agent is Running Once you've verified the agent is successfully installed, you'll want to make sure that it is running. You can check the status by running `service pdagent status` in the command line. If the agent isn't running, you can start it with the command `service pdagent start`. ### Check the Agent's Logs for Errors The agent logs activity and errors to `/var/log/pdagent/pdagentd.log`, which may contain helpful troubleshooting information. ### Trigger a Test Incident with the Agent's CLI Try manually triggering an incident using the `pd-send` command and check for errors (replace `PD_SERVICE_KEY` with one of your own PagerDuty [integration keys](/incident-management/services/services-and-integrations#add-integrations-to-an-existing-service)): ```shell $ export PD_SERVICE_KEY=YOUR_INTEGRATION_KEY_HERE $ pd-send -k $PD_SERVICE_KEY -t trigger -d "Server is on fire" -i server.fire ``` If the `pd-send` command triggers an incident in PagerDuty, check the tips in the [General Configuration Troubleshooting](#general-configuration-troubleshooting) section. You may need to verify the trigger subject and message in your Zabbix configuration. ### Trigger a Test Incident with pd-zabbix Try manually triggering an incident using the `pd-zabbix` command and check for errors (replace `PD_SERVICE_KEY` with one of your own PagerDuty [integration keys](/incident-management/services/services-and-integrations#add-integrations-to-an-existing-service)): ```shell $ /usr/share/pdagent-integrations/bin/pd-zabbix PD_SERVICE_KEY trigger "name:Test id:1 status:onfire hostname:localhost ip:127.0.0.1 value:5 event_id:2 severity:1" ``` ## Python-Based Integration ### Python Version The integration requires Python 2.7.9 or later to make a secure connection to PagerDuty. This is due to a security vulnerability in SSLv3 ([POODLE](https://en.wikipedia.org/wiki/POODLE)), which older versions of Python use. Python 2.7.9 uses a backported version of Python 3's SSL library, so versions 2.7.9 and newer (up to 3.x) are able to make a secure connection to PagerDuty. The script does not work with Python 3.x due to other language changes in this version of Python. ### Outbound HTTP/HTTPS Connections with a Proxy If you need to set a proxy, use this [modified version of the Python script](https://gist.github.com/ryanhoskin/a173cf5d43b06abdc2d2) for proxy support. Replace `SOME_PROXY` on line 68 with your proxy address (i.e., `http://proxy.company.com:3128`). ### Trigger a Test Incident with the pagerduty.py Script Manually trigger an incident with `pagerduty.py` via the command line and check for errors (set `PD_SERVICE_KEY` to your own PagerDuty integration key): ```shell $ /etc/zabbix/alert.d/pagerduty.py PD_SERVICE_KEY trigger "name:Test id:1 status:onfire hostname:localhost ip:127.0.0.1 value:5 event_id:2 severity:1" ``` ### Verify the Python Script is in the Correct Location The script should be placed in your **AlertScriptsPath**. This is usually `/usr/lib/zabbix/alertscripts` or `/etc/zabbix/agent.d`, but could be different if you installed Zabbix from non-standard packages. You can find the correct path for your particular environment by checking `zabbix_server.conf` in your Zabbix server configuration directory. ### Verify the Zabbix User has Write Permissions The script queues events in `/tmp/pagerduty`. If the Zabbix user cannot write to this directory, it will not be able to send alerts to PagerDuty. --- URL: https://docs.pagerduty.com/integrations/zendesk-integration-guide # Zendesk Integration Guide | PagerDuty Configure the Zendesk integration ## Zendesk + PagerDuty Integration Benefits - PagerDuty for Zendesk facilitates cross-team communication between ITOps, DevOps, and your customer service teams. Communication silos are broken down, allowing you to mobilize the right resources across teams, in real-time, every time. - Installing the PagerDuty app for Zendesk will add an Incident Command Console to your Zendesk account. This console allows PagerDuty to create Zendesk tickets, sync priority, and update tickets in real-time. ## How it Works - Ticket events are sent from Zendesk in JSON format to PagerDuty. These events will trigger new or update existing incidents based on the integration configuration. This will notify the configured services' on-call responders. - Agents can manually trigger PagerDuty incidents from a Zendesk ticket, as well as associate Zendesk tickets with PagerDuty incidents. - In PagerDuty, you can configure the Zendesk extension to sync updates bidirectionally. ## Requirements > **Availability:** The Zendesk integration is available to accounts on the following pricing plans: Customer Service Professional, Customer Service Business, Customer Service Digital Operations (legacy) and Enterprise for Customer Service. Please [contact our Sales Team](https://www.pagerduty.com/contact-us/#contact-sales) if you would like to upgrade to a plan featuring the Zendesk integration. - **In PagerDuty**: An Admin base role is required to connect PagerDuty to Zendesk. If you do not have this role, please reach out to an Admin or Account Owner within your organization to configure the integration. - **In Zendesk**: A Zendesk administrator is required to install the marketplace app and add any Webhooks or Triggers you choose to set up. ## Version **This guide is for Zendesk v3, our most current integration version.** > **Looking For a Different Version?:** Our legacy, email-based [Zendesk v1](https://www.pagerduty.com/docs/guides/zendesk-v1-integration-guide/) integration guide is also available. > > Support for Zendesk v2 ended in March 2023 and is no longer available. ## Integration Walkthrough ### Step 1: Add the Incident Command Console to Zendesk #### In PagerDuty 1. In the PagerDuty web app, navigate to **Integrations** → **Extensions**. 2. Under the Service Extensions menu, click **New Extension**, then search and select **Zendesk**. 3. Confirm that you want to add the app by clicking **Open** in the popup window. 4. Click **install the PagerDuty app** to open a new window where you can install the Incident Command Console for your users to manage incidents. #### In Zendesk 5. You will be directed to a new tab for the PagerDuty app in the Zendesk marketplace, click **Install**. 6. Select your preferred account from the dropdown and then click **Install**.  *Install integration* 7. You will be directed to your Zendesk account. Click **Install** again to complete the installation of the app in the Zendesk marketplace.  *Installation details* 8. You will then see PagerDuty listed under Enabled Apps ( → **Apps and Integrations** → **Enabled Apps**).  *Enabled app icon in Zendesk* > **Previous Versions:** If you have a previous version of the Zendesk app, log in to Zendesk and navigate to **Admin** → **Go to Admin Center** → **Apps and Integrations**. Select the **PagerDuty** application, then click **Update** at the bottom of the page. ### Step 2: Configure Bi-Directional Workflows #### Configure the PagerDuty Integration 1. In PagerDuty, navigate to **Integrations** → **Extensions** → **Zendesk**, then click **Authorize Account.** 2. Enter your Zendesk subdomain, then click **Continue**. 3. Click **Authorize** to complete the Zendesk OAuth flow. You’ll be redirected to Zendesk to grant access, then returned to PagerDuty once authorization succeeds. > **Migration Notes:** Complete the steps above for Authorized Zendesk accounts to migrate from Basic Authentication to OAuth. During the transition, the legacy Zendesk user email and API token fields will remain visible in read-only mode for accounts that have not yet migrated, and will be removed once Zendesk fully disables Basic Authentication. > > If OAuth credentials are not configured before Basic Authentication is removed, the integration will stop working. 4. Return to the Zendesk Extension page and enter your **PagerDuty user email**. 5. Click **Save Changes**. ### Step 3: Add Services In order to configure workflow rules, or manually create a Zendesk ticket from a PagerDuty incident, you must first map your PagerDuty services to Zendesk. 1. Select the **Connections** tab to connect PagerDuty services to Zendesk and build automation rules. 2. Click **Add Service**, select a service from the dropdown, and then click **Add Service** again. 3. A pop-up will confirm that the service webhooks are correctly configured. If there are any errors, you can click the **Check webhooks** button to recreate broken webhooks. Repeat steps 1-2 if you would like to add more services. > **Upgrading from V2 to V3:** If you are upgrading from Zendesk v2 to Zendesk v3, clicking the **Check webhooks** button will list your existing Zendesk v2 triggers that will be deactivated and replaced with Zendesk v3 triggers. Please take note of any conditions that have been manually added to these Zendesk v2 triggers. You will need to manually copy these from the Inactive section in the Triggers settings to update the new PagerDuty v3 triggers in the Active section. 4. After you add a service, we predefine some of the automation rules for you. **If you would like to change how the integration's rules are configured**, you can click the service's **name** to update these rules and follow instructions in the [Synced Attributes](#synced-attributes-optional) and [PagerDuty to Zendesk Automation](#pagerduty-to-zendesk-automation-optional) sections. Otherwise, the integration configuration is now complete. **If you would like to add more services: Repeat steps 1-4**. 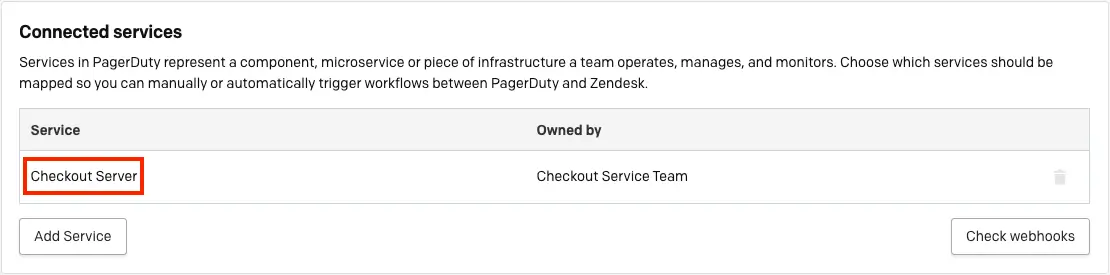 *Connected service* ### Step 4: Configure Access Levels In the **Permissions** tab, you can configure if different groups should have access to all or some actions for the Incident Command Console in the Zendesk platform. 1. Navigate to the **Permissions** tab, and choose the abilities that your users should be allowed to perform in the Incident Command Console. 2. If you’d like to add a new Group Ability, click **Add Group Ability**, choose the group from the dropdown you’d like to configure, and then select the actions they can take. 3. Once finished, click **Save Changes** to save the permissions. > **Permissions Scope:** These permissions only apply to actions users can take in Zendesk. If you’d like to restrict permissions in the PagerDuty platform, please refer to our [Advanced Permissions](/account-admin/advanced-permissions) article. #### Edit Access Levels You can edit [access levels](#step-4-configure-access-levels) after initial configuration. 1. In PagerDuty, go to **Integrations** → **Extensions**. 2. Find the Zendesk extension under **Extension Type** and click **Edit on the Zendesk Extension page**. 3. Under **Authorized accounts**, select your desired **Zendesk account**, then select the **Permissions** tab. 4. Make your desired changes and click **Save Changes**. ### Synced Attributes (Optional) Synced attributes allow you to keep PagerDuty incidents and Zendesk tickets in sync. There are two attributes that sync: [Incident Priority](/incident-management/incidents/incident-priority) and [Notes](/incident-management/incidents/edit-incidents#add-a-note-to-an-incident). To manage synced attributes: 1. In PagerDuty, go to **Integrations** → **Extensions** find the Zendesk extension under **Extension Type** and click **Edit on the Zendesk Extension page**. 2. Under **Authorized accounts**, select your desired **Zendesk account**, then select the **Connections** tab and click the **name** of the service. - **To edit priority syncing**: Click the dropdown under **PagerDuty priority** and select your preferred priority or delete syncing by clicking next to each priority level and click **Save Changes**. - **To sync notes**: Check the **Sync notes** checkbox and click **Save Changes**. ### PagerDuty to Zendesk Automation (Optional) To manage what changes are made to a Zendesk ticket when there is a change to a PagerDuty incident: 1. In the PagerDuty web app, go to **Integrations** → **Extensions** find the Zendesk extension under **Extension Type** and click **Edit on the Zendesk Extension page**. 2. Under **Authorized accounts**, select your desired **Zendesk account**, then select the **Connections** tab, click the **name** of the service, and scroll to the section **PagerDuty → Zendesk**. 3. From each **Zendesk status** dropdown, select what status the Zendesk ticket should change to when a PagerDuty incident changes status. 4. Check the checkbox to **Automatically create Zendesk tickets** if you would like Zendesk tickets to be automatically created when there are incidents triggered for this service. If you do not select this option, you can still [create a Zendesk ticket manually from an incident](/integrations/zendesk-integration-guide/zendesk-user-guide#create-a-zendesk-ticket-from-a-pagerduty-incident). 5. _Optionally_ select the following **checkboxes** to enable your preferred settings: - **Sync description on ticket creation**: Sync the PagerDuty incident with the Zendesk ticket comment upon Zendesk ticket creation. - **Set incident priority threshold**: Zendesk tickets will be created for incidents with a specific [Incident Priority](/incident-management/incidents/incident-priority). Enable this setting and select your preferred **threshold** from the dropdown. 6. From the **Zendesk ticket type** dropdown, select which type of ticket you would like to PagerDuty incidents to create. 7. Click **Save Changes**. ### Zendesk to PagerDuty Automation (Optional) To manage what changes are made to a PagerDuty incident when there is a change to a Zendesk ticket: 1. In PagerDuty, go to **Integrations** → **Extensions**, find the **Zendesk** extension under **Extension Type** and click **Edit on the Zendesk Extension page**. 2. Under **Authorized accounts**, select your desired **Zendesk account**, select the **Connections** tab, click the **service name** and scroll to the **Zendesk → PagerDuty** section. 3. From each **PagerDuty status** dropdown, select what **status** the PagerDuty incident should change to when a Zendesk ticket status changes. 4. Check the checkbox to **Automatically create PagerDuty incidents** if you would like Zendesk to automatically create PagerDuty incidents when Zendesk tickets are created. If you do not select this option, you can manually create a PagerDuty incident from a Zendesk ticket. 1. **Note**: This will add a new trigger marked **PagerDuty** and the **Service ID** in the connected Zendesk account. The default condition for this trigger is to create a PagerDuty incident when a Zendesk ticket is created. You can adjust this setting as required with the available Zendesk trigger conditions. 5. _Optionally_ select the following checkboxes to enable your preferred settings: - **Set PagerDuty Urgency on incident creation**: PagerDuty Incidents will be created with the urgency setting selected; select the incident priority to map as low urgency. - **Sync description on incident creation**: Sync the comment of the Zendesk ticket with the PagerDuty incident description upon PagerDuty incident creation. 6. Click **Save Changes**. > **Zendesk User Guide:** Once initial configuration is complete, please read our [Zendesk User Guide](/integrations/zendesk-integration-guide/zendesk-user-guide) for instructions on how to use the integration. ## Upgrade to Zendesk v3 > **Requirements:** - Support for Zendesk v2 ended on March 31, 2023. All PagerDuty customers using Zendesk v2 must upgrade to Zendesk v3 before it sunsets. There will be no new development on this version of the feature, and bug fixes will be handled case-by-case. > - The upgrade needs to be completed by a PagerDuty Admin and Zendesk Admin. ### Upgrade from Zendesk v2 to v3 1. Complete the [Zendesk v3 Integration Walkthrough](#integration-walkthrough) steps and test the integration. 2. After completing the walkthrough, confirm that your new PagerDuty triggers are set to notify active webhooks per [Zendesk’s announcement](https://support.zendesk.com/hc/en-us/articles/6255324672154-Converting-targets-to-webhooks). ### Upgrade from Zendesk v1 to v3 1. Complete the [Zendesk v3 Integration Walkthrough](#integration-walkthrough) steps and test the integration. 2. In the [Automatically Trigger PagerDuty Incidents From Zendesk](#automatically-trigger-pagerduty-incidents-from-zendesk) section, create new or update your existing PagerDuty Triggers to **Notify active webhooks** instead of an email target. 3. In PagerDuty, on the service(s) that have the Zendesk v1 email integration, navigate to the service's **Integrations**, click next to the Zendesk v1 email integration, and click **Delete Integration** to remove the integration from PagerDuty. 4. In Zendesk, navigate to → **Go to Admin Center** → **Apps and Integrations** → **Targets**. On the target for the PagerDuty email integration, select **Edit** → **Delete** to remove the email target. 5. Then navigate to → **Go to Admin Center** → **Objects and rules** → **Business Rules** → **Triggers** to confirm that your existing PagerDuty triggers have been updated to **Notify active webhooks**. If new triggers were created, [delete the older triggers](https://support.zendesk.com/hc/en-us/articles/4408882237722-Managing-ticket-triggers#topic_fqc_2m2_zsb) here. ## Zendesk User Guide Please read our [User Guide](/integrations/zendesk-integration-guide/zendesk-user-guide) for more information about using the integration after it has been configured. ## FAQ **Can I set the incident priority when automatically creating an incident from Zendesk?** At this time, we aren’t able to set the priority of an incident when creating it through the webhook/Trigger method. You can submit this as a feature request [with our Support team](https://www.pagerduty.com/contact-us/). --- URL: https://docs.pagerduty.com/integrations/zendesk-integration-guide/zendesk-custom-field-mappings # Zendesk Custom Field Mappings Map Zendesk record fields to PagerDuty incident custom fields so field values sync bidirectionally between the two systems. The Zendesk Custom Field Mappings feature allows you to define field-level mapping between Zendesk fields and PagerDuty Incident Custom Fields of the same data type. When you map fields, the options for single and multi-select fields and other standard values will sync bidirectionally. You can then link a PagerDuty incident to a Zendesk record, allowing custom field data to sync bidirectionally. Custom Fields defined as part of the integration will count towards the account’s limits for custom fields. For more information, please see our [Custom Fields on Incidents](/incident-management/incidents/custom-fields-on-incidents) article. > **Required User Permissions:** **In PagerDuty**: Only Global Admins and Account Owners on Enterprise Customer Service licenses can create, edit, and delete custom fields. ## Create Custom Field Mappings > **Restrictions:** You cannot map multiple Zendesk Record Fields to one PagerDuty custom field. 1. Navigate to **Integrations** → **Extensions** → click **Edit on the Zendesk Extension page** to the right of the Zendesk extension. 2. Select your preferred **Zendesk Account** → select the **Custom Field Mappings** tab → **Open Custom Field Mappings**. 3. Click **New Mapping** in the top right. 4. **Select a Zendesk field** (Required): Select your preferred **Zendesk field** from the dropdown. We will only fetch Zendesk fields that match the approved field types. 5. There are two options for creating a custom field mapping: 1. **Map an Existing Custom Field**: Select the existing **Custom Field** that you’d like to map to the selected Zendesk field. **Note**: We will only show PagerDuty fields that are of a compatible field type to the Zendesk field. 2. **Create and Map a New Custom Field**: Click **New PagerDuty Custom Field** to create a new PagerDuty field to map the Zendesk field. Enter the following information: 1. **Display Name**: This will prefill with the Zendesk field name; change as needed. 2. **Field Name**: This will prefill with the Zendesk field name; change as needed. 3. **Description** _(Optional)_: Enter an optional description. 4. The field type will auto-select based on the selected Zendesk field. 5. **Set a default value** _(Optional)_: Set a default value for the new custom field. 6. You may use the **Field Enabled** toggle to enable the field upon saving, or leave it disabled. Enabled fields start syncing data with Zendesk and mirror information. 7. Review the mapping and then click **Create Mapping**. ### Edit Custom Field Mappings At this time, you cannot edit Custom Field Mappings. Once created, you will need to delete and then recreate them. ### Delete Custom Field Mappings > **Deletion Order:** You must delete the Custom Field mapping before deleting the Custom Field on the Custom Fields Page. 1. Navigate to **Integrations** → **Extensions** → click **Edit on the Zendesk Extension page** to the right of the Zendesk extension. 2. Select your preferred **Zendesk Account** → select the **Custom Field Mappings** tab → **Open Custom Field Mappings**. 3. Select the menu to the right of the **record** you want to delete and select **Delete Mapping**. 4. A confirmation modal will appear. Click **Delete** again to confirm. ## Precedence The latest value updated in either platform will always take precedence. You can change these fields even after an incident is resolved. ## View Custom Field Mappings To view your Zendesk custom field mapping in PagerDuty: 1. Navigate to **Integrations** → **Extensions** → click **Edit on the Zendesk Extension page** to the right of the Zendesk extension. 2. Select your preferred **Zendesk Account** → select the **Custom Field Mappings** tab → **Open Custom Field Mappings**. ## Zendesk Fields Eligible for Mapping Fields of the following data types are eligible for mapping: | Zendesk Field Type | PagerDuty Field Type | | :----------------- | :------------------- | | Drop down | Single Select | | Multi Select | Multiple Select | | Text | Text | | Checkbox | Checkbox | | Numeric | Integer | | Decimal | Decimal | | Date | Date Time | > **Note:** You cannot map Read only and Look up Zendesk fields with PagerDuty custom fields. ## Post-mapping Behavior ### Post-mapping Behavior on the Custom Field Mappings Page The following behaviors are possible on the [Custom Field Mappings](#view-custom-field-mappings) page: - You **can** delete the mapping. When this happens, future synchronization will stop. Any value on historical integration records from this mapping will be preserved (i.e., no back-deleting values). - You **can’t** delete the PagerDuty Custom Field created by the integration on the Custom Field Mappings page. You must delete PagerDuty Custom Fields on the Custom Fields Page. - You **can’t** edit the PagerDuty Custom Field Name or Description from the Custom Field Mappings page; it is effectively a read-only mapping. ### Post-mapping Behavior on the Custom Fields Page The Custom Fields page in PagerDuty is located at **Incidents** → **Incident Types** → **Fields** tab. The following behaviors are possible on this page: - You **can** edit the Custom Field Display Name and/or the Description. - You **can** view the Custom Field in the PagerDuty UI. - You **can’t** edit the Custom Field options (if it is a Single/Multi-select data type), but you can view the options. - You **can’t** delete the Custom Field if it’s mapped to an integration. You must delete the Custom Field mapping before deleting the Custom Field. ### Other Post-mapping Behavior The integration will immediately update PagerDuty Custom Fields options when you make changes to the mapped Zendesk Record Field: - If you add an option to a mapped Zendesk Record Field, the integration will add the option to the dropdown on the PagerDuty incident detail page. - If you delete an option from a mapped Zendesk Record Field, the integration will delete the option from the dropdown on the PagerDuty incident detail page. - If you rename an option in the Zendesk Record Field, the integration will reflect the new name in the dropdown on the PagerDuty incident detail page. ## Sync Custom Field Data Bidirectionally In order for custom field data to sync bidirectionally, you must link the PagerDuty incident to a Zendesk record. Please see our [Zendesk User Guide](/integrations/zendesk-integration-guide/zendesk-user-guide) for more information. --- URL: https://docs.pagerduty.com/integrations/zendesk-integration-guide/zendesk-user-guide # Zendesk User Guide Using the Zendesk integration after installation After completing the [integration configuration](/integrations/zendesk-integration-guide), you can manage PagerDuty incidents in Zendesk, create Zendesk tickets from PagerDuty incidents, and view the PagerDuty status dashboard within Zendesk. > **Pricing Plan:** The Zendesk integration is available to accounts on the following pricing plans: Customer Service Professional, Customer Service Business, Customer Service Digital Operations (legacy), and Enterprise for Customer Service. [Contact our Sales Team](https://www.pagerduty.com/contact-sales/) to upgrade to a plan featuring the Zendesk integration. ## Manage PagerDuty Incidents From Zendesk 1. To manage PagerDuty incidents in Zendesk, navigate to a **Zendesk ticket** and click **Apps** on the right side of the screen. 2. The PagerDuty app appears and prompts you to log in to your PagerDuty account. **Note**: If you do not have a PagerDuty account, you can still view any incidents linked to the Zendesk ticket, but you cannot take action to coordinate a response or communicate with stakeholders. 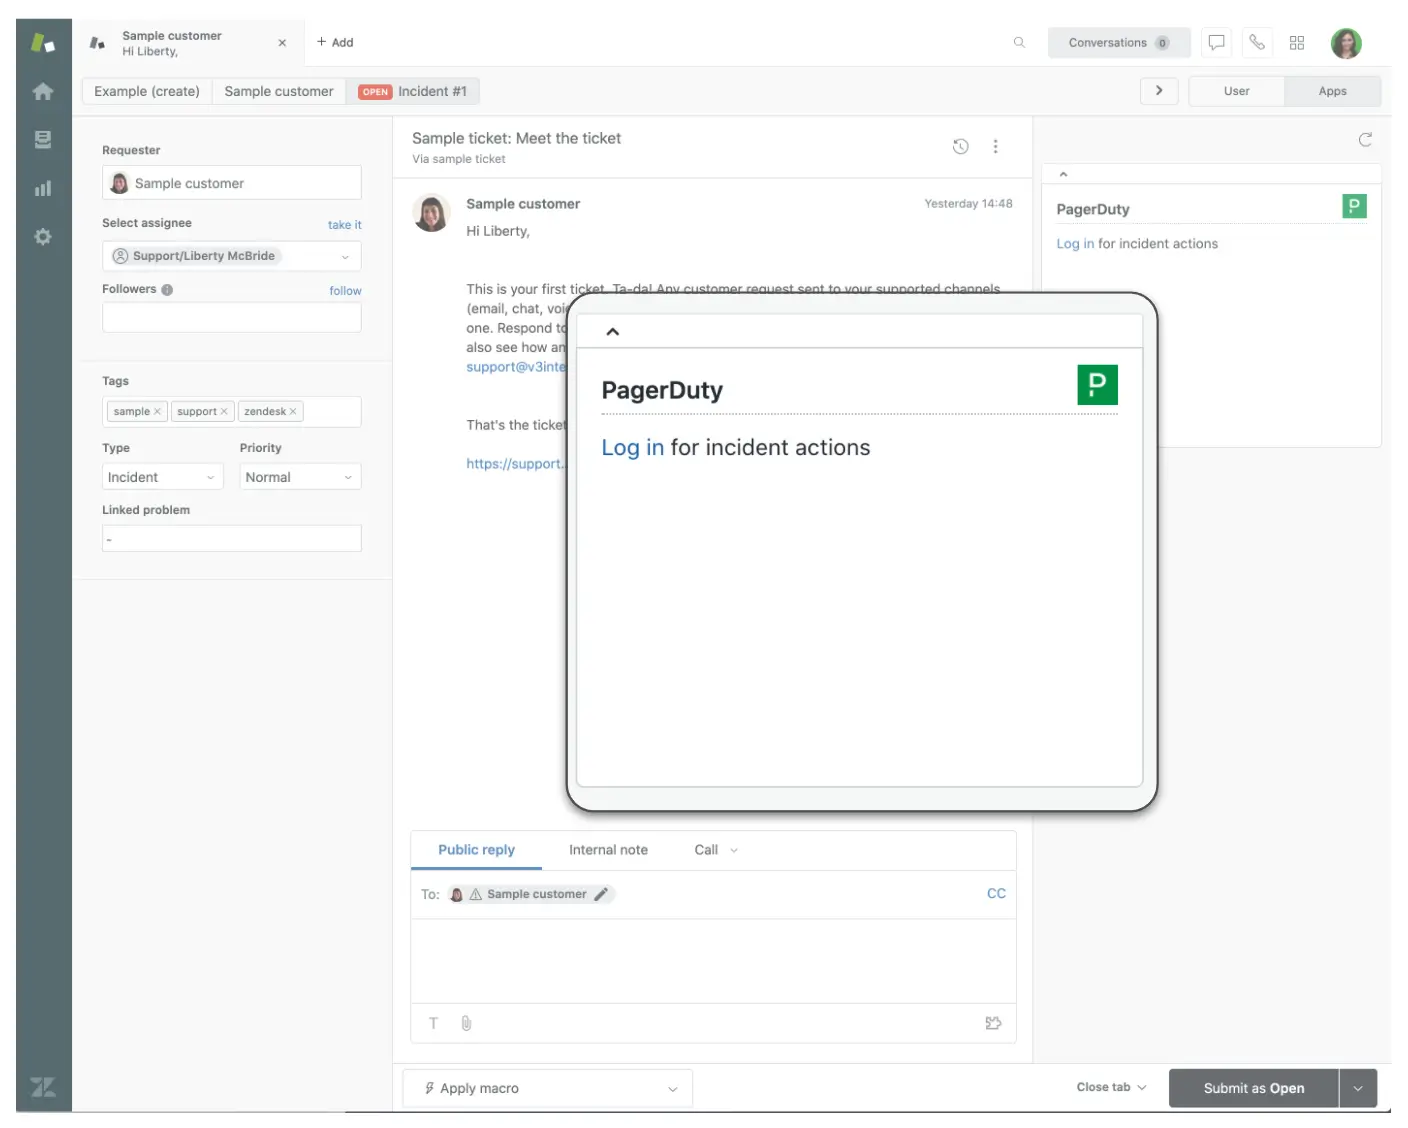 3. After logging in to PagerDuty, you can take actions from the Zendesk Incident Command Console on the right side of a ticket: - **Create Incident** or **Link Incident**: [Create a new incident](#create-a-pagerduty-incident) or [link to an existing open incident](#link-to-a-pagerduty-incident). The following actions are also available from the menu: > **Required Permissions:** If you do not see some of the actions listed below, you can have a limitation based on your permissions, which are listed in the linked article for each feature. Contact your team’s administrator for assistance. \* _Features marked with an asterisk are available on the following pricing plans: Business, Digital Operations (legacy), and Enterprise for Incident Management. [Contact our Sales Team](https://www.pagerduty.com/contact-us/#contact-sales) to upgrade to a plan with these features._ | Action | Instructions | | :-------------------------------------------------------------------------------------------------- | :--------------------------------------------------------------------------------------------------------------------------------------------------------------------------------------------------------------------------- | | [Acknowledge](/incident-management/incidents/overview#incident-states) | Acknowledge that you are working on the incident and pause any further escalation. Confirm your selection by clicking **Acknowledge** in the modal. | | [Resolve](/incident-management/incidents/overview#incident-states) | Resolve the incident. Enter an optional resolution note and click **Resolve** in the modal. | | [Edit Incident Details](/incident-management/incidents/edit-incidents) | Edit the PagerDuty incident title or [incident priority](/incident-management/incidents/incident-priority), then click **Update incident**. | | [Escalate](/incident-management/incidents/reassign-incidents) | Escalate the incident to another user or level on the associated escalation policy. Select a user from the dropdown and click **Escalate**. | | [Add Note](/incident-management/incidents/edit-incidents#add-a-note-to-an-incident) | Add a note about the incident to communicate with internal teams following it. Enter your desired text and click **Add Note**. | | [Add Responders](/incident-management/incidents/add-responders)\* | Add more responders to help with the incident. Select **Users** and/or **Escalation Policies**, enter an optional message, and click **Add Responders**. | | [Add Subscribers](/incident-management/communicate/communicate-with-stakeholders#add-subscribers-to-an-incident)\* | Add subscribers to the incident to receive future status updates. Select the desired **Users** and/or **Teams**, and click **Add Subscribers**. | | [Send a Status Update](/incident-management/communicate/communicate-with-stakeholders#sending-status-updates-to-subscribers)\* | Send a status update to internal stakeholders subscribed to this incident. Enter your desired text and click **Send a Status Update**. | | [Run an Incident Workflow](/ai-automation/automation/incident-workflows) | Run an incident workflow to mobilize responders, engage stakeholders with status updates, and set up collaboration in Slack, Zoom, and Microsoft Teams. Select an **Incident Workflow** from the dropdown and click **Run**. | | [Run Automation Actions](/ai-automation/automation/automation-actions) | Run Automation Actions from PagerDuty to execute scripts run by an automation runner and shorten resolution times. | | [Reassign](/incident-management/incidents/reassign-incidents#reassign-an-incident-from-pagerduty) | Reassign the incident to a different user or to another team’s escalation policy. Select **Users** and/or an **Escalation Policy**, and click **Reassign**. | | Unlink Incident | Unlink the incident from this Zendesk ticket. The system prompts you to confirm your selection. Click **Unlink Incident** in the modal. | 4. To condense the information in the Incident Command Console, you can collapse the **Detail**, **Timeline**, or **Notes** headers. You can also click at the bottom of the console to choose which pieces of information to display. ### Create a PagerDuty Incident 1. While viewing a Zendesk ticket, expand the **PagerDuty** app from the right pane and click **Create Incident**. 2. Enter values for the following fields: **Incident Title**, **PagerDuty Service**, **PagerDuty Priority**, and **Incident description**. 3. Click **Create Incident**. ### Link to a PagerDuty Incident 1. While viewing a Zendesk ticket, expand the **PagerDuty** app from the right pane and click **Link Incident**. 2. In the dropdown menu of the modal, search or select a PagerDuty incident. 3. Click **Link Incident**. This links the Zendesk ticket to the PagerDuty incident. You can view the link to the Zendesk ticket on the incident details page in PagerDuty. - You can repeat this process as needed to link multiple PagerDuty incidents to a Zendesk ticket. 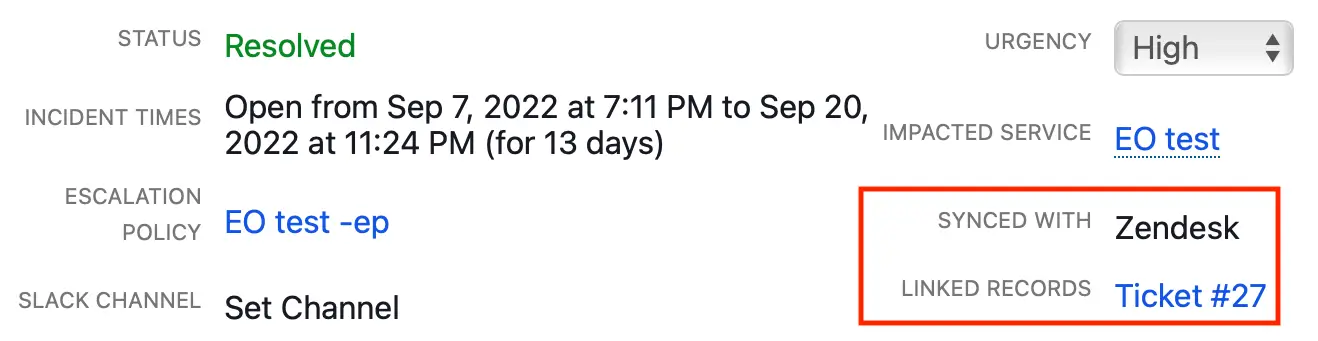 **Note**: You can view up to 10 linked Zendesk tickets on the incident details page in PagerDuty. ## Create a Zendesk Ticket From a PagerDuty Incident To create a Zendesk ticket based on a PagerDuty incident, execute the action from the incident details page in PagerDuty. You can only create a Zendesk ticket if the service for the incident connects to Zendesk. 1. In PagerDuty, click an incident title to open the incident details page. 2. Select **More** → **Create Ticket -** `your-subdomain`. 3. In the **Create Ticket** modal, enter the following information: - **Ticket Type** - **Ticket priority** - **Subject** - **Comment** 4. Click **Create Ticket**. Zendesk creates a corresponding ticket via its API:  ## View Internal Status Page in Zendesk > **Pricing Plans:** The [Internal Status Page](/incident-management/communicate/internal-status-page) feature is available on the following pricing plans: Customer Service Business, Customer Service Digital Operations (legacy), and Enterprise for Customer Service. [Contact our Sales Team](https://www.pagerduty.com/contact-sales/) to upgrade to a plan including the Internal Status Page feature. The PagerDuty [Internal Status Page](/incident-management/communicate/internal-status-page) is available in Zendesk, allowing support agents to check real-time system health from where they work. To view your Internal Status Page in Zendesk, in an account with the PagerDuty Zendesk integration configured, click the **PagerDuty** app icon at the top right near your user icon. A dropdown appears with an overview of your current status. Click a [business service](/incident-management/services/business-services) name to expand a list of impacting incidents.  To the right of an impacting incident, click → **Subscribe to this incident** to receive [status updates](/incident-management/services/business-services/subscription) for the incident. ### Select a Different Internal Status Page If your PagerDuty account configures more than one Internal Status Page, you can select a different dashboard: 1. Click the **PagerDuty** app icon at the top right near your user icon and click in the bottom right of the pane. 2. Select a status dashboard from the dropdown and click **Save**. --- URL: https://docs.pagerduty.com/integrations/zendesk-v1-integration-guide # Zendesk v1 Integration Guide Configure the legacy Zendesk v1 integration > **Newer version available:** Please consider using our most recent [Zendesk integration (v3)](/integrations/zendesk-integration-guide), which offers greater security and a more robust feature set. Zendesk is a popular web-based ticketing system. This guide will show you how you can use Zendesk's built-in functionality to integrate it with PagerDuty. This allows you to send notifications to your team even if it's after hours. The PagerDuty system allows you to define how and when members of your team should be notified. You can also set up optional email parsing and a two-way integration to allow Zendesk to auto-resolve PagerDuty incidents, and to allow PagerDuty to leave internal notes on Zendesk tickets when actions are taken on the corresponding PagerDuty incident. Steps to set up the two-way integration are outlined after the basic Zendesk to PagerDuty integration, below. ## Version **This guide is for Zendesk v1, a legacy version.** > **Looking For a Different Version?:** - The [Zendesk v3 integration](/integrations/zendesk-integration-guide) is our most current version. > - The [Zendesk v2 integration (deprecated)](/integrations/zendesk-v2-integration-guide) is also available. ## Integration Walkthrough ### In PagerDuty #### Create an Email Integration on a Service 1. Navigate to **Services** → **Service Directory**. 2. On the Service Directory page: - If you are creating a new service for your integration, click **+New Service**. - If you are adding your integration to an existing service, click the **name** of the service you want to add the integration to. Select the **Integrations** tab and click **Add an integration**. 3. Select the **Email** integration type and click **Add**. 4. Click the **Add Service** or **Add Integration** button to save your new integration. You will be redirected to the page of your service. 5. Copy the **Integration Email** for your new integration. ### In Zendesk #### Set Up an Email Target In the Zendesk admin portal: 6. Navigate to **Apps and integrations** → **Targets**. 7. Click **add target** and select **Email target**. 8. Fill out the **Title**, **Email Address** (the email integration address from the [previous step](#create-an-email-integration-on-a-service)), and **Subject** line. The subject can use Zendesk [placeholders](https://support.zendesk.com/entries/20203943-Zendesk-placeholders-reference). The subject is what you will see within your PagerDuty alert. **Note**: The email address is the integration email that you created earlier in PagerDuty. If you're using the email parsing and/or two way integration option described later in this guide and following our email parsing examples, add parentheses around the ticket ID placeholder, for example: **Use this:** `({{ticket.id}})` **Not this:** `{{ticket.id}}` This is shown in the example below, but is optional if you're only using the one-way Zendesk integration (Zendesk incidents sent to PagerDuty, no autoresolving in PD or updates to ZD tickets from PD). 9. Change the dropdown to **Create target** and click **Submit**. #### Set Up a Trigger 10. Still in the Zendesk admin portal, navigate to **Objects and rules** → **Business rules** → **Triggers**. 11. Click **Add trigger**. Enter a **Trigger title** and adjust the conditions to which you want to trigger a PagerDuty alert. The below example will trigger a PagerDuty alert any time that a new Zendesk ticket is created, but your conditions may vary. Under **Perform these actions**, select **Notifications: Notify target** and select the target that you created earlier. Enter a message that you would like to include within the PagerDuty notification. This field is also customizable with Zendesk [placeholders](https://support.zendesk.com/entries/20203943-Zendesk-placeholders-reference). 12. Click **Create** when you're done with your configuration. Below is the text that we used for the example message: `A new Zendesk ticket (#{{ticket.id}}) has been created. To review the status of the ticket and add updates, follow the link below: http://{{ticket.url}} {ticket.comments_formatted}}` Now when you receive a ticket within Zendesk, a corresponding incident will also be triggered within PagerDuty. ## Configure Email management and the Two-Way Integration Many customers use PagerDuty in conjunction with Zendesk to notify teams or individuals if a ticket has been opened, changes status, or is out of SLA. The email management feature will allow you to automatically resolve PagerDuty incidents when a Zendesk ticket changes status (i.e. a ticket is closed). This article will explain how to create custom email management rules for incidents coming from a Zendesk email integration. Keep in mind, you may choose to build your rules differently depending on your use case. ### Review Zendesk Triggers and Email Templates To automatically resolve incidents in PagerDuty you will need to complete the PagerDuty/Zendesk integration and create both an email target to reach your PagerDuty integration, as well as Zendesk triggers. Zendesk fires a trigger when specific events take place (e.g., a ticket is opened or solved). These triggers can then send emails from a customizable template. You'll use these emails to create an incident key which tells PagerDuty when to append new incidents to an existing incident. #### Creating Triggers and Email Templates Below are two Zendesk triggers which we'll use to create email management rules — the first fires when a ticket is opened and the second fires when a ticket is solved. If you've followed the examples in the integration guide above, your email target that reaches your PagerDuty Zendesk integration is set up so that the ticket ID number always appears in the subject line. We'll later use this ticket ID to create our incident key. You can optionally also include the ticket ID in the email body, which we've shown below. #### Example Zendesk Triggers  *Configure a Zendesk Trigger* ``` Zendesk ticket (#{{ticket.id)}}) was created by `{{current_user.organization.name}}. To review the status of the ticket and add updates, follow the link below: `{{ticket.link}}` ``` ``` Zendesk ticket `(#{{ticket.id}})` has been marked as solved. To review the status of the ticket and add updates, follow this link: `https://{{ticket.link}}`. ```  *Example Zendesk tickets* ### First Rule: Trigger a PagerDuty Incident Now that our Zendesk triggers are set up, we need to create email management rules in PagerDuty. In our first rule we will define the conditions which must be met to create an incident in PagerDuty (i.e. a ticket is created in Zendesk). In this example, an incident should be triggered if the email contains created *and* Zendesk in the email body. Make sure the conditions you use for the trigger email are not the same as ones that would be found in a recovery email. Also note that email management rules are case sensitive, so emails containing created will not trigger for a rule that says Created, as well as the other way around. Next we'll create the incident key which will be used to append new emails to existing ones. The incident key should always be a unique identifier that appears in both the trigger and recovery email. In this case we'll tell PagerDuty to append emails on the Zendesk ticket ID, which per the email target mentioned earlier is located in the email subject line between the parentheses (ticket ID).  *PagerDuty Email Management trigger rules* ### Second Rule: Resolve a PagerDuty Incident In the second rule, we'll tell PagerDuty to resolve incidents that contain solved *and* Zendesk in the email body. We'll use the same incident key as we did in the first rule, so PagerDuty knows that these emails are linked to the same incident and that it should be resolved.  *PagerDuty Email Management resolve rules* ### What if Incident Emails Don't Match Rules? Finally, we'll specify what PagerDuty should do with an email if it doesn't meet the rules established in the rule conditions: either create a generic incident or discard it. If you've selected to create a generic incident, the incident will still be created but won't match any of your rules or be able to be resolved. You'll also see the incident key pulled as the full subject line, rather than the ticket ID or other criteria you specified in your trigger rule. ### Testing Management Rules It's a good rule of thumb to test if your email management rules are set up correctly. To do so, forward an email to trigger an incident, as well as an email to resolve an incident, to the Integration Email address displayed on the service's Integrations tab. If your management rules are set up correctly, the incident activity log will show the incident as having been triggered and then resolved. Congratulations! You can now automatically trigger and resolve incidents via email for Zendesk. ## FAQ ### How do I create incident keys using regex? If you'd like to review creating an incident key for Zendesk integrations using regex, see the following article: [Regular Expressions: Capture Group](/incident-management/services/regular-expressions#capture-group). --- URL: https://docs.pagerduty.com/integrations/zendesk-v2-integration-guide # Zendesk v2 Integration Guide Configure the legacy Zendesk v2 integration > **Version No Longer Supported:** Support for Zendesk v2 ended on March 31, 2023. All PagerDuty customers using Zendesk v2 must upgrade to [Zendesk v3](/integrations/zendesk-integration-guide) before it sunsets. There will be no new development on this version of the feature, and bug fixes will be handled case-by-case. > **HTTP Targets No Longer Supported:** On February 22, 2022 Zendesk deprecated HTTP targets. You can read more about this on [Zendesk's Knowledge Base](https://support.zendesk.com/hc/en-us/articles/4408826284698-Announcing-the-deprecation-of-HTTP-targets-and-conversion-to-webhooks). Please reference our most current [Zendesk v3 integration guide](/integrations/zendesk-integration-guide) to integrate Zendesk and PagerDuty. ## Zendesk + PagerDuty Integration Benefits - The Zendesk integration uses Extensions, Targets and Triggers to send Zendesk Support Ticket events to PagerDuty, triggering incidents. - The PagerDuty app for Zendesk retrieves and interacts with the PagerDuty incident from the Zendesk User Interface. ## How It Works - Ticket events are sent from Zendesk in JSON format to PagerDuty's Events API based on the Conditions and Actions set during Trigger configuration in Zendesk. - These events will turn into incidents in PagerDuty, notifying the configured service's on-call responders. ## Requirements - **In PagerDuty**: A base role of Manager or higher is required to configure this integration. If you're not sure what role you have, or if you need your permissions adjusted, visit our sections on [Checking Your User Role](/account-admin/user-roles#check-your-user-role) or [Changing User Roles](/account-admin/user-roles#edit-user-roles). - **In Zendesk**: An Administrator role or higher is required to install the app and configure extensions and Triggers. ## Version **This guide is for Zendesk v2, a legacy version.** > **Looking for a Different Version?:** - The [Zendesk v3 integration](/integrations/zendesk-integration-guide) is the most current version. > - Our [Zendesk v1 integration](/integrations/zendesk-v1-integration-guide), a legacy version, is also available. ## Integration Walkthrough ### In PagerDuty 1. In the **Services** menu, select **Service Directory**. 2. - **If you are adding your integration to an existing service**: Click the **name** of the service, select the **Integrations tab**, click **Add a new integration** and continue to step 3. - **If you are creating a new service for your integration**: Please read our documentation in section [Create a Service](/incident-management/services/services-and-integrations#create-a-service) and follow those steps, selecting **Zendesk API** as the **Integration Type** in step 4. Continue with step 4 (below) once you have finished these steps. 3. Enter an **Integration Name** in the format `ZendeskAPI-Service-Name` (e.g., `ZenDeskAPI-Support-Tickets`) and select **Zendesk API** from the **Integration Type** menu. Click **Add Integration**. 4. On the next screen, you will see the **Integration Key** for this integration. Copy this key and keep it in a safe place for future use. ### In Zendesk 1. In the left hand menu, click the Admin and select **Extensions** under Settings. 2. Click **Add Target** and then **HTTP Target**.  *Add target*  *Select HTTP target* 3. On the HTTP Target screen, enter the following: - **Title**: Enter a title that will be identifiable when configuring Triggers in later steps. - **Url**: Enter the following value: `https://events.pagerduty.com/v2/enqueue`. - **Method**: Select **POST**. - **Content type**: Select **JSON**. - **Basic Authentication**: Leave **unchecked**. Select **Create Target** from the dropdown and then click the **Submit** button. 4. Next, navigate back to the Admin and select **Triggers** under Business Rules. Depending on your current configuration, you have the following two options: - **If you have an existing trigger that you wish to send to PagerDuty**: Click the trigger **name** and modify the **Actions** section by adding an action to **Notify Target** and select the target created in step 3, above. Continue on to step 5. - **If you are creating a new trigger**: Click **Add Trigger** and enter a **Trigger name** and **Description** that describes its desired functionality. Configure your preferred **Conditions** that will determine when you would like Zendesk to send an event to PagerDuty. Next, in the **Actions** section, add an action to **Notify Target** and select the target created in step 3, above. Continue on to step 5. 5. Next, you will be prompted for a JSON body that takes Zendesk Placeholder values. We have provided a sample JSON body that you can use out-of-the-box. If you want to modify the payload in any way, here are some rules to keep in mind: - The `dedup_key` should follow the format of `Zendesk_[your_zendesk_subdomain]_{{ticket.id}}`. The PagerDuty plugin looks for Zendesk-created incidents with that pattern as a key. Changing this may result in the App Plugin not being able to retrieve the associated PagerDuty incident. - The `routing_key` determines which account or service this information should be sent to. Paste your **Integration Key** here (depending on how you are integrating, this key was generated in step 2 of **Integrating With Global Event Routing**, or step 4 of **Integrating With a PagerDuty Service**, above). - The `event_action` determines what PagerDuty should do once this event is received. You can specify either `trigger`, `acknowledge` or `resolve` here. - The `payload.custom_details` is a custom object that will take in additional fields in case you want to include additional information. ``` { "dedup_key": "Zendesk_[your_zendesk_subdomain]_{{ticket.id}}", "routing_key": "[your_integration_key]", "event_action": "trigger", "payload": { "summary": "{{ticket.title}}", "source": "{{ticket.via}}", "severity": "critical", "custom_details": { "priority": "{{ticket.priority}}", "requester_name": "{{ticket.requester.name}}", "status": "{{ticket.status}}", "description": "{{ticket.description}}" } }, "client_url": "{{ticket.link}}", "client": "Zendesk" } ``` After configuring the JSON body, click **Create**. 6. Next, navigate to the [Zendesk App Marketplace](https://www.zendesk.com/apps/directory/), search for PagerDuty and install the PagerDuty app. 7. Once you've installed the app, navigate back to your Zendesk account, click **+Add** in the upper left corner and select **Ticket**. On the new ticket, click the **Apps** button on the upper right to display the PagerDuty application. Click **login with PagerDuty** to sign in and access PagerDuty from the Zendesk interface.  *Login with PagerDuty* 8. There are two ways to test the integration: - Modify the ticket created in the last step to meet the Conditions for the Trigger to execute. This should automatically trigger an Event API call once the Priority is set to **URGENT**. - You may also create a ticket after signing in to PagerDuty from the Zendesk interface and click the blue **Create Incident** button. On the next screen, select which PagerDuty service you would like to open an incident on. ## FAQ ### I'm using the Business Rules Triggers in Zendesk to trigger notifications to PagerDuty, and incidents are being created, but the PagerDuty App in Zendesk is not loading the incident information on the ticket. What's happening here? Within the JSON Payload of your Actions from the Business Rules Triggers, ensure that the formatting of the value for `dedup_key` is `Zendesk_[your_Zendesk_subdomain]_{{ticket.id}}`. For example, if the URL to your Zendesk account is `acme.zendesk.com`, the formatting of the the `dedup_key` value should be `Zendesk_acme_{{ticket.id}}`. ### Will PagerDuty create a new Zendesk ticket if there's a non-Zendesk-generated incident on the same service? No, PagerDuty will not create a new Zendesk Support Ticket if there's an incident that did not originate from Zendesk. ### How does the PagerDuty app in Zendesk look up the incident? What if there are users that shouldn't have access to those incidents? The PagerDuty app utilizes OAuth to determine the user's permissions to access incidents within PagerDuty. If the user does not have access to a team's incidents, the PagerDuty app will not display that information in the sidebar app. --- URL: https://docs.pagerduty.com/integrations/zoom-integration-guide # Zoom Integration Guide | PagerDuty Configure the Zoom integration ## Zoom + PagerDuty Integration Benefits - Responders can quickly create on-demand Zoom meetings with the click of a button from a PagerDuty incident. - Incident Workflows can create on-demand Zoom meetings and attach them to incidents. ## Requirements ### To Configure the Integration **In PagerDuty**: Users with Admin/Global Admin or Account Owner roles can configure the integration. **In Zoom**: Users with administrator permissions can configure the integration. ### To Use the Integration PagerDuty users with a Responder role or higher can create Zoom meetings via incidents. ## How it Works - On a PagerDuty incident, responders can create an incident-specific Zoom ID by [clicking a link](#create-a-zoom-meeting-manually) or they can optionally run a pre-configured [Incident Workflows](/ai-automation/automation/incident-workflows). This information is sent as an event to AWS Lambda, which transforms it to a Zoom-compatible format and it creates a meeting ID. **Note**: The meeting ID is incident-specific and cannot be used for other incidents. - Once the meeting ID has been created, this information is sent back through the same lambda to PagerDuty and creates a [Conference Bridge](/incident-management/incidents/conference-bridge) with the meeting ID information. - Responders can join the Zoom conference bridge directly from the incident in the web app and mobile app, via conference bridge notifications, or they can use [One Touch to Join](/incident-management/incidents/conference-bridge#one-touch-to-join-conference-bridge). ## Integration Walkthrough ### In Zoom 1. Navigate to the [Zoom App Marketplace](https://marketplace.zoom.us/) and install the **PagerDuty** app. > **EU Service Region:** If your PagerDuty account is in the EU [Service Region](/get-started/service-regions), please install the **PagerDuty EU** app in the Zoom App Marketplace. 2. You will see the following authorization screen. Click **Allow**. 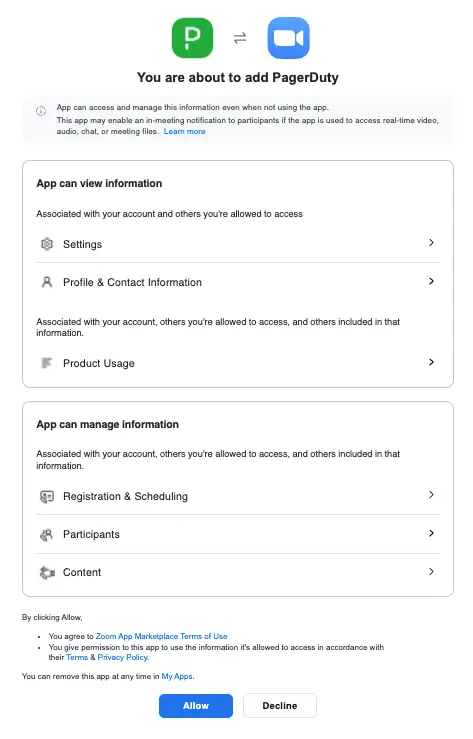 3. If prompted, sign into your PagerDuty account. Please read [Log In to PagerDuty](/get-started/log-in-to-pagerduty) for more information about logging in to your PagerDuty account. 4. After successfully installing the integration, you should see a confirmation message in your browser. 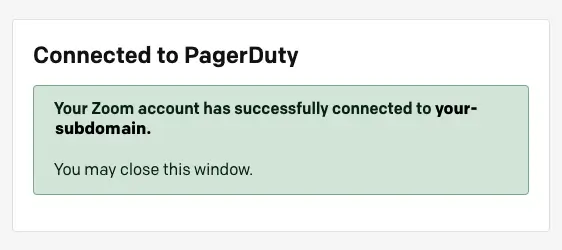 *Connected to PagerDuty* ## Zoom User Guide ### Create a Zoom Meeting Manually > **Required User Permissions:** Users with a Responder role and higher can create Zoom conference bridges. 1. In PagerDuty, click an incident’s **title** to view the incident details screen. 2. Next to **Conference Zoom**, click **Create Zoom Meeting**. The new meeting ID will automatically populate. 3. Responders can now click this meeting link from the incident in the web app, mobile app or via conference bridge notifications and [One Touch to Join](/incident-management/incidents/conference-bridge#one-touch-to-join-conference-bridge). ### Create a Zoom Meeting via Incident Workflows Follow the [Incident Workflows guide](/ai-automation/automation/incident-workflows#create-an-incident-workflow-from-scratch) and select the [Create a Zoom Meeting](/workflow-actions/zoom/create-a-zoom-meeting) action. After publishing, you can then create a Zoom meeting via the Incident Workflow. ### Enable Zoom Settings for Optimal Use By default, when responders create Zoom meetings from incidents, the integration will check to see if the responder's PagerDuty email matches their Zoom email. If it does, it will create the Zoom meeting ID on their account. If the email does not match, the meeting ID will be created on the Zoom account of the administrator who configured the integration. If the account where the Zoom meeting ID is created does not have **Join before host** enabled for both the **Account** and **Group** level, other users will not be able to join the meeting until this administrator joins as the host. Please read [Zoom's documentation on how to enable **Join before host**](https://support.zoom.com/hc/en/article?id=zm_kb&sysparm_article=KB0060501) on both the **Account** level and the **Group** level. > **Recommended Settings for Optimal Use:** - Join before host on Account and Group Level. > - Anyone can record. > - Anyone can share screen. ## Uninstall the Zoom Integration To uninstall the PagerDuty Zoom application, users must perform the uninstall through the Zoom Marketplace. When the Zoom app is uninstalled, all authorization tokens will be deleted and users will no longer be able to create Zoom meetings from PagerDuty. 1. Log in to your Zoom account and navigate to the [Zoom App Marketplace](https://marketplace.zoom.us/). 2. Search and select the **PagerDuty** app. Select **Manage** in the left side panel, then click **Remove** next to the Remove the app section. ## FAQ **Can I link more than one PagerDuty account to the same Zoom account?** At this time, this integration supports linking one Zoom account with one PagerDuty account. **Why don't I see a telephone number attached to the PagerDuty incident for my Zoom meeting?** If your Zoom account does not provide telephone number dial-in, only the URL will be attached to the PagerDuty incident. **Note**: Zoom removed telephone dial-in for free Zoom accounts, please check your Zoom account pricing plan. --- URL: https://docs.pagerduty.com/ops-guides/auto-remediation # Auto-Remediation Automation is a key component in the management of complex, modern IT systems. Automation helps teams avoid mistakes, increase reliability, and reduce toil in  Automation is a key component in the management of complex, modern IT systems. Automation helps teams avoid mistakes, increase reliability, and reduce toil in their day-to-day tasks. While building a production environment might rely on a number of automation tools, the lifecycle of that environment will include unplanned incidents and other work that often is performed manually. Human mistakes during an incident can increase the time to resolution and even make the problem worse. When our systems experience incidents during non-working hours, our team might be away from their computers, or unavailable, or even asleep. We want to minimize the number of incidents that require human intervention and limit alerting responder teams to only those alerts that require a human element. ## Who Is This For? This resource is for teams that develop or operate software applications who want to make effective use of automation tools during their incident response process. ## What is Covered? ### Automation Use Cases in IT Many teams already use a lot of automation to help get their tasks accomplished in a reliable, repeatable way. This section touches on some examples in: - [Build and Deploy](/ops-guides/auto-remediation/use-cases#build-and-deploy) - [Software Testing](/ops-guides/auto-remediation/use-cases#software-testing) - [Environment Provisioning](/ops-guides/auto-remediation/use-cases#environment-provisioning) ### Automating the Incident Response Process Automation can help your team respond to incidents more effectively and efficiently. This section covers the workflows of responding to an incident: * [Team Alerting and Orchestration](/ops-guides/auto-remediation/automating-response#team-alerting-and-orchestration) * [Triage and State Analysis](/ops-guides/auto-remediation/automating-response#triage-and-state-analysis) * [Business Communication](/ops-guides/auto-remediation/automating-response#business-communication) * [Automation of Remediation](/ops-guides/auto-remediation/automating-response#automation-of-remediation) This section covers Self Healing Systems and Runbooks ### Automation for Incident Remediation Actually fixing issues after getting alerted is the next step in your team's journey to uninterrupted sleep. This section is a more in-depth discussion of managing automation for incident remediation processes. ### Getting Started with Automated Incident Resolution Some things to keep in mind when you are working on automation for Incident Remediation: * [Reducing Noise](/ops-guides/auto-remediation/getting-started#reducing-noise) * [Identify Candidate Workflows](/ops-guides/auto-remediation/getting-started#identify-candidate-workflows) * [Evolving Automation Components](/ops-guides/auto-remediation/getting-started#evolving-automation-components) * [Maintaining Automation](/ops-guides/auto-remediation/getting-started#maintaining-automation) ### Automation in Regulated Environments Regulation can present unique and interesting challenges when teams are automating workflows. ### Challenges to Automation Not everyone will be enthusiastic about the prospect of automating parts of their job - even if they don't particularly like some of the tasks. There are challenges to introducing automation goals to already established teams. Some of these challenges are well understood and others are more abstract. We can refer to decades of research on systems automation for some tips and guidance. ### References and Further Reading Some references we used to create this document. If you have suggestions for additions to this list, let us know! ## License This documentation is provided under the Apache License 2.0. In plain English, that means you can use and modify this documentation and use it both commercially and for private use. However, you must include any original copyright notices and the original LICENSE file. Whether you are a PagerDuty customer or not, we want you to have the ability to use this documentation internally at your own company. You can view the source code for all of [this documentation](https://github.com/PagerDuty/automated-remediation-docs) on our [GitHub account](https://github.com/PagerDuty). Feel free to fork the repository and use it as a base for your own internal documentation. --- URL: https://docs.pagerduty.com/ops-guides/auto-remediation/additional-resources # Additional Resources Deploying automation helps your team reduce toil and creates space for innovation that would otherwise be used to respond to unplanned work.  Deploying automation helps your team reduce toil and creates space for innovation that would otherwise be used to respond to unplanned work. Our automation needs to fit snugly into the application lifecycle; in some cases it might be completely bespoke, while in other cases it might be something off the shelf. But it should be treated in the same way we treat the development of the application - undergoing testing and employing good practices. When we approach the operational life of our applications as part of the features of the applications, creating and maintaining automation components becomes part of the application development process itself. There are many areas where automation can help your team. These resources can help you think about where automation makes the most impact. ## Videos Allspaw, John. Taking Human Performance Seriously in Software. Monitorama Conference, 2019. [https://www.youtube.com/watch?v=ND5AUkHrec8&list=PLZgKfFadVM0mrWuVL6H9P3j5MhWUizXOB&index=1](https://www.youtube.com/watch?v=ND5AUkHrec8&list=PLZgKfFadVM0mrWuVL6H9P3j5MhWUizXOB&index=1) ## Papers Bainbridge, Lisanne. “Ironies of Automation”. *Automatica*, Vol. 19 No. 6 pp 775-779, 1983. International Federation of Automated Control. Strauch, Barry. “Ironies of Automation: Still Unresolved After All These Years”. *IEEE Transactions on Human-Machine Systems*. August 2017. Pp 1-15. ## Books Atchison, Lee. [_Architecting For Scale, 2nd Edition_](https://www.oreilly.com/library/view/architecting-for-scale/9781492057161/). O'Reilly, 2020. Forsgren, Nicole, PhD. Gene Kim. Jez Humble. [_Accelerate: The Science of Lean Software and DevOps: Building and Scaling High Performing Technology Organizations_](https://itrevolution.com/book/accelerate/). Portland: IT Revolution Press, 2018. Gene Kim, Jez Humble, Patrick Debois, John Willis. [_The DevOps Handbook_](https://itrevolution.com/book/the-devops-handbook/). Portland: IT Revolution Press, 2016. Perrow, Charles. [_Normal Accidents: Living with High-Risk Technologies_](https://press.princeton.edu/books/paperback/9780691004129/normal-accidents). Princeton, NJ, Princeton University Press, 1999. --- URL: https://docs.pagerduty.com/ops-guides/auto-remediation/automating-response # Automating the Response Process When an incident occurs, everyone wants to be able to call the expert, but your experts might be elsewhere—on vacation, commuting, or just unavailable. When  When an incident occurs, everyone wants to be able to call the expert, but your experts might be elsewhere—on vacation, commuting, or just unavailable. When that happens, you can use automation to borrow their expertise. Team SMEs (subject matter experts) who create automation are building artifacts for the rest of the team to use when they’re not around; their knowledge goes into some code instead of staying locked away in their heads. Encouraging your experts to automate the tasks they would use in response to incidents means they can be alerted less frequently, and more members of the team will have the tools they need to solve issues appropriately. Your workflows for responding to incidents and unplanned work will contain some of the tasks that your regular, planned work incorporates. When you find parts of your workflow that can be automated, consider using automation to reduce mean time to recover (MTTR), alert fatigue, and toil. When considering automating these workflows, we find many team automation projects follow these **five** phases:  You’ll still want to automate the tasks that happen the most often so your automation development is giving you the best return on investment. Determining what steps are valuable to automate might be challenging at first if your team doesn’t have a mature set of monitors and alerts to draw from. Your long-term alert and incident trends will lead you to the best candidates for automated remediation. In this section, we’ll break down the incident response process into four sections: 1. **Team alerting and orchestration**: Automating the process of getting the right people in the right place at the right time. 1. **Triage and state analysis**: Collecting ecosystem and timeline data for the whole team 1. **Business communication**: Keeping stakeholders informed in a timely manner 1. **Automation of remediation**: Fixing the things that can be fixed automatically If your team is just getting started with incident response, you’ll find more detailed documentation in our other Ops Guides, [Incident Response](/ops-guides/incident-response-guide) and [Stakeholder Communications](/ops-guides/stakeholder-comms-guide). ## Team Alerting and Orchestration If your organization has been operating in a more traditional model with a Network Operations Center (NOC) staffed by technicians around the clock, the task of notifying and coordinating responders may fall to that team. When technical systems expand and become more complex, the job of finding and notifying responders can slow down as the NOC technicians search for the right teams, the on-call responder for those teams, and that person’s contact information. Automating this part of the alert process is a first step toward reducing response and mobilization times. When an alert is triggered in your monitoring systems that needs intervention from a human responder, automation will link the alerting service to the owning team and that team’s on-call responder. To learn how to accomplish this in PagerDuty, visit our [Getting Started Guide](/get-started/trial-account-onboarding) and follow the walkthrough for setting up responders, teams, schedules, and services. Once your responders have been alerted, they will need a place to communicate. This might be over SMS, phone, video conference, or a chat tool. The creation of a communications hub during an incident can also be automated so when the incident is started, all team members and potential responders will know where to go and how to access the communication channels. If your work platforms provide APIs, your incident response workflow can also include the creation of the channels or calls that your team will need to coordinate the incident response. Automating this step alleviates the risk that someone will have or be given the wrong information, delay their response time, or that the person creating the channel won’t have the appropriate account or permissions. > **Tip:** See our knowledge base for more on how PagerDuty handles incidents. Effectively deploying automation for team alerting requires some pre-work to clearly establish which teams own what services. With a human notifier, they might call around to various folks until they eventually find the right person, but they are wasting time and prolonging any service alerts. Creating a clear relationship between your responder teams and their services eliminates these delays, but this can take some time to set up properly. When your team has completed a responder-to-service map, your next step could be “human-initiated automation, which might be a button or bot for your NOC to interact with to notify responders. Eventually, your response plan could be completely automated, allowing the error alerts themselves to notify your responders and run automation to create communication channels. You can get an idea of how PagerDuty implements this workflow in our knowledge base under [Mobilize a Coordinated Response](/incident-management/incidents/add-responders). ## Triage and State Analysis Once your responders are online and investigating an incident, they will be collecting data and state information from services that are experiencing issues and general information about what is going on. This might be in the form of log files, status pages, monitoring reports, command output, or other data produced by your infrastructure. During this step of your response process, there may also be external data that can be collected from the application ecosystem. Your automation might query a build or deploy pipeline to determine if there were any deploys prior to the alerts triggering. A list of recently updated packages on the systems running your services could be helpful in determining if a security update impacted your service. You might also want to add a report of past issues on the service that could be related to the current alert. When any of your responders collect the same information, it makes sense to create some automation that will perform this task automatically for the benefit of everyone involved in the incident. These resources can be compiled to a central location or attached to the outage channel. This also helps establish timelines and informs next steps. If this information is already available when the responders log in, then triage can start even faster. Automating tasks in this step of your incident response process gives your team a leg up in responding to common alerts and problems. Even for uncommon or novel incidents, automated triage can help responders narrow down potential causes and solutions by eliminating the first set of questions your responders might ask. It will also help newer members of your team be more effective if they don’t have to determine which machines to access, the preferred commands to run in your environment, or be knowledgeable in all the service dependencies. ## Business Communication Hopefully your team is incorporating stakeholder updates in your incident response process. For incidents that impact externally facing services, keeping customers up to date is an important step in reputation management and customer service. For services that only impact internal users, keeping users updated is still important. This work can be distracting and challenging for teams to work into their incident response workflow, so we’ve already written some guidance for you in our other [Ops Guides](/ops-guides). Automating aspects of your stakeholder communications during an incident can alleviate the stress of these kinds of administrative and indirect tasks. Hopefully your team already has a communications position as part of your incident response. If you don’t, consider implementing one so your teams know there is a plan in place or person in charge of dealing with communications during an incident. Your team can automate various pieces of your communications plan, including: * Setting up automated reminders or timers to provide updates * Sending an automatic update if there is no change to the status of the incident via a bot or other automated function * Adding a function to your communications channel to send updates without having to log into specific accounts directly Any of these automated actions will improve your team’s response practices and help you keep your users and stakeholders informed during an incident. Various tools exist to integrate with your workflow. Your team might already be using similar methods for what has been termed “ChatOps” — using shortcuts to send instructions to APIs and other tools. You could be halfway to automated communications already. Streamlining communications with automation keeps all of your responders engaged in solving problems rather than dealing with answering questions. To further help your team manage communications, consider creating [customer liaisons](/ops-guides/incident-response-guide/customer-liaison) and [internal liaisons](/ops-guides/incident-response-guide/internal-liaison) to be responsible for updates. ## Automation of Remediation As your team’s incident response process improves, you will likely find that some of the issues that arise require the same steps to recover from. As trends start to emerge, you can look at removing human intervention completely and automating the remediation phase of common alerts. ### Self Healing Systems You may have heard the term “self-healing” applied to technology systems. Self-healing refers to the ability of a system to discover errors and fix them without external intervention. At the most basic level, a self-healing environment will include three core components: * The running service, application, or other component that is expected to be always-on * A monitoring system that periodically checks the running system to determine whether or not it is performing as expected * A set of software components that can restore the running service if the monitoring system finds it in a bad state These three components come in a vast array of different structures and tools, so any one environment is unlikely to be exactly the same as another. Regardless of the specific tools employed, the goal is the same: to preserve the running services with as little external intervention — and potential downtime — as possible. No matter how fast and efficient your team’s incident response process is, it won’t be as fast as the system fixing itself. Getting to this state of self-healing will include working through the steps in the diagram above. It’s unlikely that your team will have all the scripts and automation components at hand to fix all of the errors and alerts that arise on your systems, so it will require taking some time to learn the common alerts and fixes. From there, you and your team can discover the best path to automate those fixes to the extent that your team will trust them to run themselves. Eventually, you will have a library of components that can cure common issues without having to alert any of your team members. > **Tip:** For a more in-depth intro to self-healing systems, see this article at [Mindtree](https://www.mindtree.com/blog/self-healing-it-systems-less-choice-more-mandatory-requirement#:~:text=In%20the%20IT%20world%2C%20self,restore%20itself%20to%20normal%20operation%E2%80%9D). ### Runbooks Before your systems are ready to begin healing themselves, there are some practices you can employ to make systems management easier that speeds up incident response. One of those is runbooks, which are a type of technical documentation dedicated to listing the steps to take to perform a specific task. [Runbooks](https://www.pagerduty.com/resources/learn/what-is-a-runbook/) allow your team to preserve knowledge in a sharable format. The subject matter experts on your team can write runbooks for the systems they know best, and that knowledge is then available for your junior team members to use. They’re also helpful for legacy systems that were not designed with automation in mind. Early generations of web server software was built to be manually configured—with heavy GUIs and no text configurations. Having runbooks for these systems is imperative to keeping them running while you still need them. > “We have legacy systems from 10 years ago that aren’t as easy to automate as modern technologies. We have invested some time in automating our runbooks so we can move faster.” - Andrew Rundle, Claranet, PagerDuty Summit 2020 The use of runbooks in your environment gives your team the advantage of having expert knowledge always available—even when the expert isn’t the on-call responder. By creating runbooks and other automation artifacts, your experts can document their best practices in a way that makes them safe to execute for the other members of your team. Depending on the toolset you use for your runbooks and other automation, you might also have access to sophisticated permissions and privilege management tools so your team can designate certain people to run certain tasks on certain systems. To see an example of this kind of tooling in action, check out [PagerDuty Rundeck](https://www.rundeck.com/). --- URL: https://docs.pagerduty.com/ops-guides/auto-remediation/automation-for-resolution # Automation for Incident Resolution Responding to incidents and alerts presents opportunities for automation in some environments as well. While we find automation in the creation steps of  Responding to incidents and alerts presents opportunities for automation in some environments as well. While we find automation in the creation steps of technical products, it is less common in the longer term maintenance of the systems. Automation improves the health of our running systems and helps us better manage issues that arise. When considering automation for incident remediation, keep in mind that in complex systems, failure is inevitable. Our automation goals at this stage aren’t to prevent failures, but to swiftly deal with failure when it happens and optimize for it as much as possible. Creating monitoring and health-checks for production systems is fairly ubiquitous since organizations that don’t count IT as a customer product space still heavily rely on IT services to be functional and performative. As long as all services are up and running, everything is fine. When something goes wrong, what happens next could be chaos or it could be a well-managed practice of contacting responders and remediating issues. Automation can be employed from the first blip or hiccup, including how the correct team is contacted, how they are able to respond, and whether there is additional infrastructure to support troubleshooting and remediation. More efficiency and the intentional use of automation in even these early phases of remediation reduce the time it takes to acknowledge and repair issues that arise. Making changes safely is particularly important when a team is attempting to fix an incident, but unplanned changes made during troubleshooting are often made manually. When a service is unavailable or not performing in some way, making a mistake because of a manual process can delay the resolution. It could even make matters worse. If an incident responder makes a copy-and-paste error, skips a step in a runbook, or executes a command in the incorrect terminal, any number of unpredictable things could happen. So, we look to employ automation in our remediation processes to mitigate this unpredictable risk. We want automated remediation for many of the same reasons we want automation in general — as systems increase in number and complexity, the amount of information needed to run and maintain them effectively also increases. The decision to auto-remediate alarms from certain inputs might consist of several points: * How often the alarm triggers. * We reduce the noisiest alarms for the greatest gain. * How often the alarm is non-impacting to end users at first instance. * Early warnings like disk usage can be dealt with by automation. * If the first step in a manual remediation is always the same for the alarm. * If a human typically restarts a service to see if that fixed the issue, the automation should do that step. Teams may find that their alarms have a consistent set of solutions that can be automated. Creating this automation — via any number of tools — removes these alerts from the immediate attention of the team and lessens the potential for what we refer to as “alert fatigue.” Alert fatigue occurs in a number of industries where workers are exposed to alerts and alarms on a regular basis to the point where the alerts lose meaning. Large numbers of alarms, or alarms with high frequency, can cause responders to become desensitized over time. As responders become desensitized, their response times become longer and the potential for mistakes increases when there is an important alarm. We see this in IT when a preponderance of low-urgency alerts are passed to responders in real time, 24 hours a day instead of being added to a work queue, delayed to working hours, or otherwise managed. IT teams can deploy automation to combat the contributing factors to alert fatigue. While a dashboard may seem like a good idea as it can help eliminate the cacophony of beeps, chimes, chirps, and buzzes from alerts, a screen full of red status reports or flashing issues can be difficult to make use of in a timely manner. When using a dashboard, teams that categorize their alarms by severity and urgency can also categorize them as targets for future automation. When everything else has been mitigated by automated processes, the team will have more capacity to deal with the alerts that do need human attention. We also want to use automation when the solution should be faster than a human could be expected to perform the actions. This might include production activities like autoscaling when a service is under heavy load or prohibiting IP addresses that are repeatedly attempting a bad request. Depending on your use of IaaS platforms, you might already be making use of some of these functions that are built into the service. Machines are faster than humans at some tasks, and they don’t mind work that is boring and repetitive. As we build automation, we focus on the tasks with the most toil (i.e. those that require humans to do a lot of work, but the work is relatively low value). Those are the tasks that can be completed by automated processes. Automation can help a team respond to incidents in a predictable and defined way. Your team may already be using documentation or guides like runbooks that prescribe the steps to take to remediate an issue. When runbooks can be performed using automation, fewer distractions and alerts will go to the human responders. Particularly for remediation tasks that are low value, like restarting services or clearing disk space, this work is better allocated to automation. The automation can then also be applied to multiple sets of similar systems. --- URL: https://docs.pagerduty.com/ops-guides/auto-remediation/challenges # Challenges of Automation Automation has quite a history, starting in the early days of the Industrial Revolution. When weavers and textile workers were faced with the realities of new  Automation has quite a history, starting in the early days of the Industrial Revolution. When weavers and textile workers were faced with the realities of new machinery, they worried that their hard-won skills and craftsmanship would no longer be needed, and some banded together to destroy machines. We still use their name, Luddites, to refer to people who are reluctant to use or are hesitant around technology. For more than 200 years, processes and human work have become increasingly automated in many industries, from electrical power generating, to aerospace, to shipping, to IT. Making use of automation creates its own set of challenges. Researchers in human behavior, human-computer interaction, neuropsychology and other intersecting fields have been looking at the effects of automation on workers for decades. While not all the findings in these areas are applicable to IT, there are a few that we might find interesting; in particular, a set of “ironies” presented by Lisanne Bainbridge in a 1983 paper entitled *Ironies of Automation*. This paper is short - only a few pages - but it has had a significant impact on the field of automation research. Automation research often focuses on industries in which failures create spectacular or catastrophic results, such as aviation, power generation, or healthcare. The downstream learnings can help us work with the automation in our systems as well. The *Ironies*, as presented by Bainbridge, focus on the impact automation has on the behavior and readiness of human operators. Two in particular are related to how the operator feels about their engagement with their work. In a heavily automated system, a human operator may not feel ownership of the performance of the system. Operator detachment from many of the activities the system performs also contributes to a question of the value of their work. An operator watching automated processes for feedback can find that work incredibly boring, but the level of responsibility on that operator if they are needed by an anomalous situation creates an odd dichotomy. This also contributes to a problematic balance between boredom and vigilance that is still being studied, especially in the field of autonomous vehicles. One place that might impact your team’s overall performance after deploying automation at scale is the potential degradation of skill of the operator. Bainbridge discusses this a bit, but a follow-up paper by Barry Strauch in 2017, *Ironies of Automation: Still Unresolved After All These Years*, investigates in more depth, especially in relation to aviation. Operators stepping into an incident in the middle of some automated action may not have the knowledge required to solve the problem or may not have a full accounting of what the automation has already done. In the worst cases, the operators may have never had sufficient training to repair a system that has had some kind of automation failure because they trained only with the automation in place. When we look to apply this foundational idea to IT automation. We might find that operators become rusty over time when they aren’t constantly exposed to the system. We ask the folks responding to an incident to be more knowledgeable about the system than they were before the automation—they will only be stepping in when the incident is more complex than the automation can take care of. At PagerDuty, senior staff may be well prepared for this kind of lifecycle, but it presents new challenges when training junior staff. Catastrophic failures attributed to automation, as they get reported in the press, also make our automation tasks more difficult from an organizational standpoint. When folks express reluctance or trepidation around automation, it’s often down to several common concerns: * Fear of the automation creating a larger problem * Fear of the automation just being wrong or doing nothing * Fear of losing their job Any unplanned work on a system might cause more errors or have no positive effect on an alert, whether a human is responding or the system has an automated response. While no effect is better than increasing the scope of a problem, it also delays the time to recover from the incident. Part of keeping the automation “trustworthy” is maintaining a narrow functional scope. A functional scope helps to contain the potential blast radius if anything does go wrong. The automation we build should focus on one particular function and should report back if something doesn’t work as expected. Think about our earlier example of installing a software package. There are a couple of checks we’d want to employ inside the automation, such as not continuing if the package can’t be accessed. We also want to keep the focus narrow; the installation of the package doesn’t necessarily mean we also want the service started immediately on all platforms, so we might leave that out of the automation component. Similarly for tasks like clearing disk space. Our human responders might first log into the system and double check that the “usual” culprit is responsible for the issue before taking any action. Our automation should also run these commands and act accordingly. Job loss or recategorization is a real issue in organizations applying automation to many parts of their workflow. As with increased automation in many industries, the types of jobs that are available will change. If your team chooses to use more cloud-based infrastructure via automation and APIs, you’ll have less need for someone on your team to spend their day performing tasks like imaging machines or building virtual hosts. These are repetitive tasks more [aptly] performed by automation; we want to save the human time for solving problems. So part of your automation journey will likely require you to spend some time and attention on helping some of your staff retrain and learn new tasks. It’s unlikely that, as you automate, you’ll have less work to do. Once organizations start reaping the benefits of faster time to market (TTM) and higher quality output, their ability to innovate also increases. More innovation creates more projects for your technical teams to work on as well. --- URL: https://docs.pagerduty.com/ops-guides/auto-remediation/getting-started # Getting Started We can take a multistage approach for implementing automated remediation in our production systems: Automation should be reliable and consistent, so as we  We can take a multistage approach for implementing automated remediation in our production systems:  Automation should be reliable and consistent, so as we build out our automation, we’ll also want to keep these goals in mind: * The procedure should be testable * The procedure should be flexible and implemented for future improvements * The procedure should be reviewable by someone else as a check * The procedure should be put under version control * The procedure should be applicable to related resources, and “one-off” changes should be discouraged, and it should be applied to all related resources in the same way * The procedure should be repeatable and auditable ## Reducing Noise Before even thinking about automating processes, take a long, hard look at the alerts being generated by your systems and ask yourself these questions: * Are there unactionable alerts? * Are there alerts that are overly complex? * Are there alerts that should be fixed in engineering? Round 1 of automating incident response is to ensure the alerts that are coming through are useful and can be fixed in the production environment. You can find more guidance on creating useful alerts in our Ops Guide on Incident Response. Good alerts will contain an appropriate amount of useful information about the impacted system. They’ll be rated in line with their impact on users. And they’ll be something that can be remediated in production under normal conditions. If your systems generate alerts that can’t be fixed via changes to the production environment, send them back to engineering. For example, when moving to a distributed services model in a cloud, you might see a need to increase the timeouts for requests to remote services. This is an expected performance tradeoff for the architectural change, and the timeout for those types of requests often needs to be increased. ## Identify Candidate Workflows Once you have the alerts cleaned up, take a look at the data you have on the number of alerts that fire, when they occur, and what their impacts are. This will give you candidates that will have the most impact on your responders when you create automated remediation. Create a list of potential alerts that can be automatically remediated based on their volume or simplicity. Potential candidates for your first round of automation might be alerts for single subsystem issues, like disk space warnings, or alerts that already have a manual runbook that can be automated. ## Evolving Automation Components Your first automated remediation targets should be well defined and well contained. Part of building up trust in your automation tools will come from creating cumulative successes, so start with a small collection of alerts to automate. Keeping the first set all within a single team of responders can help with training and communication. Use your data set to determine the performance of your automation efforts. Ask yourself questions like: * Is the team seeing a **reduction in alerts**? * Are incidents still getting **resolved in a timely and correct manner**? * Has there been any **negative impact** to the customer? * Have you **reduced the amount of toil** the team is required to do on a daily basis to support the services? As the illustration above shows, you might want your team to implement automation in phases, allowing the automation to run but still alerting a human responder as a check. Even before that, you can build trust in the automation by alerting a team member and having that person initiate the automation process. Over time, this ensures that the automation runs as expected, but also gives the team background knowledge of what the automation is intended to do. Working with unfamiliar automation can have negative impacts for responder teams who aren’t sure what behaviors might have triggered the automation and what side effects are of the automation itself. Some teams might also want a place for the automation to report a status for later tracking and trend determination. For example, your automation might be clearing unused files out of a cache directory to clear disk space, but if this starts happening more and more often, your team will want to engage and find the underlying cause. The automation can only do so much. This is a good point to report your efforts to other teams to highlight what you’ve learned about the process and how the automation is making the operation of systems and services better. ## Maintaining Automation The addition of an automation component to your production incident response will require tracking for updates when the services they work on are updated. Downstream activities might be impacted by changes to things like service names or command options. Remediation automation components, if they meet the goals mentioned above, will be testable and checked into version control. They travel the software development lifecycle with the services that they support, either in their own repository or in the project repository. Make sure you have a plan for how they are updated, tested, and released when new versions of your services are deployed. --- URL: https://docs.pagerduty.com/ops-guides/auto-remediation/introduction # Introduction Automation has become a key competency for modern IT teams. The proliferation of platforms, tools, and contexts for developing, testing, and running  Automation has become a key competency for modern IT teams. The proliferation of platforms, tools, and contexts for developing, testing, and running applications creates a near-infinite number of toolset combinations. Each tool requires expertise to use well and that knowledge needs to be preserved, evaluated, and learned from over time. This process can be difficult if all the processes are manual. While teams have become comfortable with the automation of certain steps in their workflows (like building software or performing some testing), teams are often slow to apply much automation to the operational part of the software delivery lifecycle. Manual processes combined with complex operational environments have a number of negative potential consequences for technical teams: * Fast-moving Agile development practices outpace documentation * Mistakes are easy to make in manual processes * Manual toil contributes to burnout and employee disengagement Automating manual processes helps teams avoid these drawbacks, helping mitigate the risk, cost, and negative team health impacts of this type of work. The negative impacts of manual processes follow applications into production environments and make an outsized impact when something goes wrong. Incorrect documentation, copy-and-paste errors in manual processes, and repeated steps create risk when all systems are running as expected - but can have catastrophic impacts during an incident. Applying automation to incident response contributes to the overall consistency, predictability, and reliability of the response process. If your team is not yet applying automation to your incident response processes, we hope this guide will help you think about and experiment with automating for incident response. --- URL: https://docs.pagerduty.com/ops-guides/auto-remediation/regulated-environments # Regulated Environments Process automation, for incident response and remediation as well as other IT services, can be of particular benefit to teams in regulated environments.  Process automation, for incident response and remediation as well as other IT services, can be of particular benefit to teams in regulated environments. Well-written automation that is maintained in a source code repository provides a concrete, auditable history of actions performed on production systems. Additionally, it can provide a laundry list of permitted actions that can be limited to specific activities in programmatic ways. Codifying permitted commands into automation and scripts provides a secure way for teams to delegate specific activities to other personnel without risking giving away too many privileges. > **Tip:** One customer use case is a situation where they have a particular app that costs them between £500k-£750k for every hour of downtime, and for this app is to just reboot the server. With internal processes and approvals, it can take an hour to get the correct permissions to take the reboot action. After creating automation to run the reboot and getting approval for that automation for the issue, they are able to restart the service automatically within a few seconds of the error surfacing. Teams benefit from creating automation that can be peer-reviewed, unit tested, and approved in advance of it being needed during an incident. Automation can benefit the day-to-day functions of complex systems, as well as improving response to incidents by creating safe pathways for non-experts to get work done effectively. --- URL: https://docs.pagerduty.com/ops-guides/auto-remediation/use-cases # Use Cases for Automation in IT With the spread of DevOps as a framework for overhauling IT workloads and the increasing popularity of public clouds, the automation of various work has become  With the spread of DevOps as a framework for overhauling IT workloads and the increasing popularity of public clouds, the automation of various work has become key to a successful digital transformation. Cloud platforms offer opportunities for flexibility and developer autonomy, along with complexity, scale, and speed that is difficult to maintain with manual processes. As more and more technology teams find themselves at the intersection of traditional, manual practices and modern, API-driven practices, it is necessary to not only build the skills needed for automation, but also to embrace the mindset that automation is a benefit to the overall health of the systems. Automation for IT processes has many of the same goals as automation does in any other industry. We strive to deliver consistent, reliable results, no matter who the practitioner is, or which machine or service is involved. Automating repetitive, low-value tasks reduces toil and allows people to perform higher-value, more rewarding work. Many teams will find that a variety of tools will help them alleviate the issues related to incorrect documentation, mistakes, and toil that plague teams using manual processes. As systems have increased in number and complexity, the need for automation has also increased. Safe, reliable automation gives IT teams a place to abstract their processes so they don’t have to be memorized or exposed to the risk of manual work. Manual workflows like cutting-and-pasting carry heavy risks for mistakes. Outdated documentation can slow down task completion or cause errors on its own. And the toil of repetitive, manual tasks can have negative impacts on employee productivity, satisfaction, and engagement. Automation can be applied to many facets of a technical project, from building and testing software, to creating the runtime environments, to responding to error conditions and incidents. Various stages of the software development lifecycle include tasks that are candidates for automation, as well as tasks that are done repeatedly that require little or no input from humans and have consistent end states. Creating and maintaining automation, whether in the form of scripts or libraries or other components, comes with a cost, so we want to find the tasks that will have the most impact on team resources when they are performed by the automation. When we perform tasks or otherwise make changes to any part of a system, there are some goals we should keep in mind. In *Architecting for Scale*, Lee Atchison has categorized these goals as the following: * The procedure should be testable * The procedure should be flexible and implemented for future improvements * The procedure should be reviewable by someone else as a check * The procedure should be put under version control * The procedure should be applicable to related resources, “one-off” changes should be discouraged, and it should be applied to all related resources in the same way * The procedure should be repeatable and auditable While we can potentially satisfy these goals with manual processes, automation codifies the tasks into repeatable processes and ensures they are performed the same way each time they are needed. If we keep these goals in mind when we are thinking about every change that will be made to our systems, we establish practices that prioritize the reliability of our systems in all phases of the life cycle, including when we are responding to incidents. Let’s look at some of the ways your team is already using automation. ## Build and Deploy Building and packaging software applications is inherently a form of automation. Different types of languages and runtimes have different requirements, but the tasks are well defined and repetitive. Whether an application requires compilation and linking or the organizing of external dependencies, the developer can employ automation to perform these tasks reliably. Application builds can be run as part of a pipeline of processes where the entire workflow is created and stored for repeated use, ensuring that steps aren’t forgotten or run incorrectly. For technical and organizational reasons, automated deployments are not as ubiquitous as automated builds. For example, organizations utilizing rigid change management programs are reluctant to authorize automated deployments of new builds to production, though they may deploy into shared development environments or a staging environment for testing and integration purposes. Even in loosely coupled environments, services may have a dependency on changes to data schemas that require more manual intervention, such as a full backup to be taken before the update. Automated deployment often comes at the end of a long modernization journey, after teams have successfully changed a number of other development practices. This includes small, incremental changes and employing methods like feature flagging and dark launching. Automated builds and deployments are often combined into a set of practices known as continuous integration and continuous deployment, or CI/CD. The challenges presented by automated deployments have expanded the definition of CI/CD to also be defined as continuous delivery. Delivery places the software in a repository for later use, while deployment installs the software into a specific environment. Tools that perform CI/CD tasks help teams create pipelines or workflows to build, test, package, and deploy or deliver software. Automated deployment isn’t possible for all software. Software that wasn’t designed for automated installs or upgrades might require the acceptance of a license agreement with no option to pre-populate metadata, settings file, or registry entry. It might still require the installer to make selections manually without the aid of a pre-populated inventory or other aid. These installs fail the goal of repeatability and are incredibly difficult to reproduce effectively, making them harder to repair or rebuild when needed. ## Software Testing Automated testing is a different topic all on its own. It’s beyond our scope in this guide however, it’s part of the application lifecycle, so we’ve included it here for completeness. Various programming languages and frameworks have specific testing paradigms and tooling, but overall, manual testing is a tedious process. With the increasing complexity and volume of software components used in many organizations, manual testing is simply no longer sustainable or time efficient. Automated testing can start from the first time a developer saves a file in their text editor or when the editor itself initiates a syntax checker or linter. As a change proceeds through the build process, more tests can be performed. This includes unit tests and integration tests, depending on the features or services impacted by the change. There’s zero chance that a test step will be forgotten if they are all automated. ## Environment Provisioning The building and maintenance of environments on full systems, virtualized systems, and containers is another area that has been highly automated. For new projects, no one will ever put a warm coat on, walk into a highly air-conditioned data center, roll a “crash cart” with keyboard and mouse up to a rack of servers, install the OS on them from a CD or DVD, and click through options and package selections manually like we did 10 or 15 years ago. Building infrastructure is susceptible to the challenges we outlined in the introduction. Documentation of the process will rapidly become out of date, mistakes are easy to make, and the repeated tasks required to build out a large environment are tiresome. But automation for the base layers beneath your applications is key to maintaining large-scale production environments and for the maintenance of smaller environments. Automating the provisioning of infrastructure ensures that: * All the systems in the environment are identical, even if they aren’t built at the same time. * All the systems in the environment will have all the components required in the correct versions. * The systems can be rebuilt to the correct specifications in case of disaster or catastrophic loss. When services run in cloud or Infrastructure as a Service environments, the APIs provided by the vendor also give teams a strong starting point for automated management of services and systems. Tools like [HashiCorp’s Terraform](https://www.terraform.io/), combined with configuration management tools like Chef, Puppet, or Ansible, provide an automated path from first provisioning through preparation for services to actively managing and maintaining services. This path for making planned changes is fairly well understood, and also has a set of testing tools like [Test Kitchen](https://kitchen.ci/) and [ansible-test](https://docs.ansible.com/ansible/latest/dev_guide/testing.html) to help achieve our goals for testing changes before they are applied to our environments. --- URL: https://docs.pagerduty.com/ops-guides/business-incident-response # Business Incident Response When business service disruptions are highly visible over prolonged periods, customer backlash can ruin your company’s reputation. Mitigating material brand  When business service disruptions are highly visible over prolonged periods, customer backlash can ruin your company’s reputation. Mitigating material brand damage requires your company to have an incident response plan that also addresses the needs of the business during those critical disruptions. Business Incident Response is an application of PagerDuty’s Incident Response framework for non-technical response to mitigating business impact from severe technical incidents. This guide focuses on the business operations that should occur in parallel, while technical responders work to resolve severe technical incidents. Business incident response consists of two primary functions: transitioning normal business operations into emergency business operations mode, and managing proactive communications with both external customers and internal stakeholders. ## Who Is This For? This resource is for non-technical business leaders who want to establish incident response plans to protect business interests during severe technical incidents. ## Prerequisites This guide presumes that your organization already has a [technical incident response plan](/ops-guides/incident-response-guide) in active use. The functions and roles described in this guide are in addition to--not in replacement of--the practices used for technical incident response. This guide must be used in tandem with that response plan and it cannot be used effectively in a standalone fashion. ## What Is Covered? First, you should understand what specifically constitutes a business incident. - [Definitions](/ops-guides/business-incident-response/definitions) - A few key terms to know before getting started - [What Is a Business Incident?](/ops-guides/business-incident-response/what-is-a-business-incident) - The what and why of business incident response - [How to recognize a business incident](/ops-guides/business-incident-response/recognizing-a-business-incident) - The how and when of business incident response: criteria thresholds and initiating response ### Before an business incident This is a set of considerations to help you prepare a response plan well in advance, before a business incident occurs. - [Different Roles](/ops-guides/business-incident-response/different-roles) - A set of responder roles necessary to effectively resolve a business incident - [The Business SME](/ops-guides/business-incident-response/business-sme) - How and when to introduce a subject matter expert that represents the needs of the business - [Triggering a business incident](/ops-guides/business-incident-response/triggering) - The specific mechanics for how a technical incident call triggers a business incident - [Incident call Etiquette](/ops-guides/business-incident-response/call-etiquette) - Etiquette guidelines for business incident calls, before you find yourself in one ### During an incident The process to follow during a business incident. - [Do not panic](/ops-guides/business-incident-response/do-not-panic) - Ground rules for engagement - [Incident briefing](/ops-guides/business-incident-response/incident-briefing) - Start by getting everyone on the same page - [Emergency business operations](/ops-guides/business-incident-response/emergency-operations) - Switch from normal business operations to emergency business operations - [Managing communications](/ops-guides/business-incident-response/managing-communications) - Proactively communicate with external customers, internal stakeholders, and other relevant parties - [Resolving an incident](/ops-guides/business-incident-response/resolving) - Steps to take to restore normal operations and set follow up action items ### After an incident: - [Preliminary Analysis](/ops-guides/business-incident-response/after-an-incident#preliminary-analysis) - How to answer questions, until a postmortem is published - [Customer Meetings](/ops-guides/business-incident-response/after-an-incident#strategic-customer-meetings) - Proactive opportunities to regain customer trust - [Postmortems](/ops-guides/business-incident-response/after-an-incident#postmortems) - How to participate in the postmortem process ## License This documentation is provided under the Apache License 2.0. In plain English that means you can use and modify this documentation and use it both commercially and for private use. However, you must include any original copyright notices, and the original LICENSE file. Whether you are a PagerDuty customer or not, we want you to have the ability to use this documentation internally at your own company. You can view the source code for all of this documentation on our GitHub account, feel free to fork the repository and use it as a base for your own internal documentation. --- URL: https://docs.pagerduty.com/ops-guides/business-incident-response/after-an-incident # After an incident Steps to take after a severe technical incident has been resolved  Although the severe technical incident and the business incident have both been resolved, there are still many questions to answer and follow up actions to take. The business incident response team should continue to work together to contribute to postmortem processes, send out proactive internal communications, and begin the work of gaining back eroded customer trust. ## Preliminary Analysis After an incident is resolved and until the postmortem is published (the Analysis phase), there’s a period of time in between where communication about what happened during the incident isn’t typically relayed to anyone not directly working on the postmortem. But a reality for for customer-facing teams is that as soon as the incident is over, their customers will start demanding answers about what happened during the incident. Whether or not your company sanctions an official response, customers will seek out additional details from whomever they can contact. Getting ahead of that need helps ensure a more consistent incident narrative. The Preliminary Analysis report exists to fill this potential gap and produce an officially sanctioned response to customer inquiries. The report should only be shared with internal stakeholders and is not meant for publishing to external channels. The goals of the Preliminary Analysis report are to: - Issue a succinct recap of known events during the incident, pending further investigation - Provide customers with useful steps to take, pending further investigation - Ensure internal stakeholders are equipped to answer customer questions - Encourage customers to wait for the postmortem to publish before seeking further details The Preliminary Analysis should not include any details that are not yet shareable with customers. The report should avoid zeroing in on contributing factors or making assertions about systems failures and remediations, even if these are perceived to be well known (they are still being investigated and will be shared in the postmortem). Instead, the report should focus on communicating essential information that customers may find useful until the postmortem is published. Examples of essential information include, but are not limited to: - The business services impacted & how that disruption impacted customer experience - Approximate time frames for incident detection and resolution - How to detect ongoing related issues and what customers should do if they are detected - A summary of actions that led to incident resolution - What is being done to continually monitor the situation The report is a non-exhaustive recap of events that occurred and is only meant to fill in the gaps of communication until the postmortem is published. The report should be drafted, reviewed, and published to internal stakeholders within 24 hours of the incident being resolved. Internal stakeholders should not share this report with customers, but instead use it as a reference for any talking points in customer conversations. ## Strategic Customer Meetings A recommended practice for mitigating eroded customer trust is offering strategic customers a chance to connect with you directly. These one-to-one meetings connect strategic customers with technical executives to discuss any ongoing concerns. Staffing of these meetings is split between the entire Technical SLT on-call rotation. It’s impossible to speak to every customer directly in a timely manner. For example, a three person on-call rotation meeting with customers at full capacity would need over one week to address more than 100 customers (neglecting other responsibilities like participating in postmortems or duties that drive incident resolution). After a severe technical incident, the only thing worse than not following up with a customer directly is offering to follow up with them, only to keep them waiting for two weeks. Therefore, these customer meetings should be offered sparingly. Typically, these customer meetings should occur after the postmortem is published and all incident details and remediations are known. Some customers may demand answers prior to the publishing of the incident postmortem. Customer meetings can occur prior to the postmortem, however any details that can be shares will probably not exceed far beyond what is in the Preliminary Analysis. A pre-postmortem meeting may be the right thing to do for certain customers, but most will appreciate the depth of conversation they can have once all incident details are well understood. If your organization adopts this as a response strategy, you should make this offer available to strategic customers in your resolution message. ## Postmortems The Technical SLT and Customer Liaison during the incident should participate in the technical postmortem to provide details around customer communications during the incident. The entire Comms Incident team should also use the Post-mortem Process to review the incident and determine ways to improve the process. --- URL: https://docs.pagerduty.com/ops-guides/business-incident-response/business-sme # The Business SME More details about how to use a business subject matter expert to initiate a business incident  The [Technical SLT](/ops-guides/business-incident-response/different-roles#technical-slt) is the first business response role to get involved during an ongoing technical incident. As a member of the Senior Leadership Team, they join a technical incident call as a subject matter expert representing business needs. This role has an on-call rotation and they can be paged to join a technical incident at any time. Incident Commanders should be trained to recognize when the severe technical incident thresholds, as defined by your organization, are close to being reached. When those thresholds are near, the Incident Commander should request that a business SME join the incident call. When joining the technical incident call, the sole responsibility of this SME is to determine if a wider company response is warranted. They should evaluate whether the current incident meets the [defined criteria](/ops-guides/business-incident-response/recognizing-a-business-incident#severe-technical-incident-criteria) for escalation to a severe technical incident. Incident severity should not be litigated during an incident. That’s to say that escalation to a severe technical incident should not be an argument to make and achieve consensus from responders on the technical incident call. The job of someone in the business SME role is to consider the defined thresholds in the context of the current technical incident and make a recommendation for escalation to the Incident Commander when they determine the thresholds have been met. The Incident Commander has final authority over escalating the status of the incident. --- URL: https://docs.pagerduty.com/ops-guides/business-incident-response/call-etiquette # Call Etiquette Understanding incident call etiquette before an incident occurs  You've just joined a business incident call, and you've never been on one before. You have no idea what's going on, or what you're supposed to be doing. This page will help you through your first time on a business incident call, and will provide a reference for future calls you may be a part of. ## First Steps - If you intend on participating on the incident call you should join both the call and chat (e.g. Slack). - Make sure you are in a quiet environment in order to participate on the call. Background noise should be kept to a minimum. - Keep your microphone muted until you have something to say. - Identify yourself when you join the call; state your name and the role you are here to fill. - Speak up and speak clearly. - Be direct and factual. - Keep conversations/discussions short and to the point. - Bring any concerns to the Business Lead on the call. - Respect time constraints given by the Business Lead. - Use clear terminology, and avoid using acronyms or abbreviations during a call. Clear and accurate communication is more important than quick communication. ## Communication You don't need a special set of lingo to participate in a business response call. However, acknowledgement of requests and verification of understanding are paramount for good communication. These are useful terms to have in your arsenal to ensure good communication. - Say Again - "Repeat your last message" - Standby - "Please wait a moment for the next response" - Acknowledged - "I have received and understood" - Will do - "I have received and understood your request and will comply" ## The Commander The Business Lead is the leader of the business incident response process and is responsible for bringing the incident to resolution. They will announce themselves at the start of the call, and will generally be doing most of the talking. - Follow all instructions from the business lead, without exception. - Do not perform any actions unless the business lead has requested you do so. - The business lead will typically poll for any strong objections before performing a large action. That is your time to raise any objections if you have them. - Once the business lead has made a decision, that decision is final and should be followed--even if you disagreed during the poll. - Answer any questions the business lead asks you in a clear and concise way. - Answering that you "don't know" something is perfectly acceptable. Do not try to guess. - The business lead may ask you to investigate something and get back to them in X minutes. Make sure you are ready with an answer within that time. - Answering that you need more time is perfectly acceptable, but you need to give the business lead an estimate of how much time. ## Problems? ### There's no business lead on the call! I don't know what to do! Ask on the call if a business lead is present. If you have no response, type `!bizlead page` in Slack. This will page the primary and backup business lead to the call. ### I can join the call or Slack, but not both, what should I do? You're welcome to join only one of the channels, however you should not actively participate in the incident response if so, as it causes disjointed communication. Liaise with someone who is both in Slack and on the call to provide any input you may have so that they can raise it. --- URL: https://docs.pagerduty.com/ops-guides/business-incident-response/definitions # Definitions Defines severe technical incidents and distinguishes business responders from technical responders within the business incident response guide.  ## Severe technical incident A severe technical incident is a critical issue causing continued unacceptable business impact, requiring larger company engagement. These types of incidents are typically ones that put the business at serious risk, with a high chance of eroding customer trust, and where there is low confidence of reaching resolution in a timely manner. These incidents are technical disruptions that typically occur in high-visibility areas that create a very significant customer impact. Severe technical incidents should be a very rare occurrence in most organizations. For more details on severe incident criteria, see [recommendations for declaring a severe technical incident](/ops-guides/business-incident-response/recognizing-a-business-incident). ## Business Responders For the sake of clarity, this guide uses “business responder” to refer to incident responders who are 1. not a part of the technical incident call 1. acting to shift normal business operations into emergency mode 1. managing internal and external stakeholder communications This shorthand term is meant to quickly differentiate responders on the technical incident bridge (engineers, developers, the Incident Commander, etc) and those on the business incident response bridge (the [roles covered in this document](/ops-guides/business-incident-response/different-roles)). ## Technical Responders In this document, a distinction is made between technical and non-technical responders for more easily understood context. But the reality is that plenty of technical abilities are still necessary for business responders to be effective in their roles. For the sake of clarity, this guide uses “technical responder” to mean any responder on the technical incident bridge who is not a “business responder.” --- URL: https://docs.pagerduty.com/ops-guides/business-incident-response/different-roles # Different Roles The different roles ofbusiness incident response  Business responders are paged as appropriate when needed. These roles are ordered by functional groups for reference. --- **Initial responders** These roles are the first to respond and necessary for the resolution process to begin ## Business Lead This role is very similar to an [Incident Commander](/ops-guides/incident-response-guide/different-roles#incident-commander-ic), but is labelled differently to avoid confusion. The Business Lead acts as the single source of truth of what is currently happening in the business incident. They are not a resolver: they delegate work instead of doing it themselves. The Business Lead drives business incidents to resolution and ensures there is clarity of ownership and action. Responsibilities include: - Getting everyone on the same communication channel - Collecting and documenting information from team members for their area of ownership/status - Delegating all actions during a business incident; the Business Lead is NOT a resolver - Being the single authority on business incident status ## Technical SLT This role should be filled by a technical member of the Senior Leadership Team. They are a business stakeholder and they initially act as a subject matter expert representing the needs of the company during a technical incident. Once a business incident is triggered, the Technical SLT role becomes the designated spokesperson for personalized customer communications. For example, if a direct email was sent to customers, they would sent with this person’s name attached. They become the public face of the incident when directly communicating with customers. The Technical SLT is responsible for generating the first draft of any outbound messaging and works with the rest of the messaging collaborators to produce a finalized draft. ## Customer Liaison During a technical incident, the Customer Liaison is responsible for managing customer communications and keeping a pulse on customer impact. Because this role is typically filled by a technical member of your staff that is intimately familiar with your product, they function well as a technical subject matter expert for the business incident. When a business incident is declared, the Customer Liaison will hand off their responsibilities in the technical incident to a standby responder and then join the business incident as a technical SME. The job of the Customer Liaison in the business incident is to provide an initial briefing to business incident responders, relay updates, become a communication conduit between the technical incident and the business incident, and ensure that any messaging generated by the business incident group is technically accurate. --- **Operations responders** Functionally, these roles are responsible for performing the actions that switch business operations between normal and emergency mode. Emergency business operations entail temporarily halting normal outbound customer activities for the duration of the severe technical incident. Responders in this role should also keep a pulse and report on any abnormal business operations that may occur. ## Marketing Officer Outbound demand generation activities should be halted during a severe technical outage. Many outbound marketing campaigns are designed as top of funnel activities requiring some engagement of a fully functional product. During a severe technical outage, those outbound marketing efforts will have an adverse effect is they’re not halted. This role is responsible for halting and, later, restarting any outbound campaigns that typically belong to marketing functions (e.g. paid ads, email blasts, calling campaigns, etc). Because Marketing typically has access to a CRM or similar tool that can be used to contact current customers, they are also responsible for doing the work of sending approved personalized communications directly to customers during the business incident. ## Social Officer This role is responsible for halting and, later, restarting outbound social campaigns. Once halted, the Social Officer also monitors social channels to track and report on customer sentiment. They will publicly post responses when necessary or manage direct messages for followers that raise questions or concerns about the severe technical incident. The Social Officer also monitors internal company communication channels (e.g. Slack, email distribution lists, etc) to track, report, and respond to any questions or concerns raised within the walls of your organization. ## Media Officer The Media Officer is primarily responsible for generating responses to inbound inquiries from media-related third parties (e.g. news outlets, reporters, analysts, influencers, public officials, etc). This role should be filled by a trained member of your corporate communications team that typically works with PR agencies and coordinates any press-related communication. --- **Messaging Responders** Functionally, these roles are responsible for collaborating on any outbound communications to internal stakeholders or external customers. Responders in this role work with the Technical SLT to ensure that any outbound communications meet corporate requirements. ## Legal Officer This role is filled by a lawyer from your corporate legal team. In situations where material damage could occur, it’s best to involve legal counsel as early in the process as possible. The person in this role is also responsible for ensuring that any outbound communications meet your company’s legal requirements. ## Messaging Officer This role is filled by a trained member of your corporate communications team. The Messaging Officer is primarily responsible for ensuring any outbound communications meet your corporate messaging guidelines. ## ELT Approver This role is filled by a member of the Executive Leadership team. The ELT Approver role has “final” approval over any outbound communications generated by this group. The approval is “final” because authorization for distributing any finalized communications from the business incident group rolls up to the technical Incident Commander. Although typically filled by the CEO, like any and every responder role, this role should have backup responders that can take this responsibility in the case of any unforeseen unavailability. --- **Departmental Responders** You may have additional roles that are necessary to switch normal company operations into emergency mode or collaborate on customer messaging. The roles above cover the minimum necessary considerations, although your company may identify more roles, as necessary. Additional responder roles may be needed to carry out necessary and unforeseen functions, such as providing context-specific updates depending on the impact of the incident. These additional responders would likely be from customer-facing teams such as Support, Sales, Professional Services, etc. However, they may also include responders from Marketing, Business Development, Finance, etc. Each of these departments should have a rotating on-call role that can help mobilize a business response as needed. --- URL: https://docs.pagerduty.com/ops-guides/business-incident-response/do-not-panic # Do not panic During an incident, the most important thing to do is not panic  Once a business incident has been triggered, responders should acknowledge that they have received a page and do the following. ## Don't Panic! - Join the incident call and chat. - Anyone is free to join the call or chat to observe and follow along with the incident. - If you wish to participate however, you should join both. If you can't join the call for some reason, you should have a dedicated proxy for the call. Disjointed discussions in the chat room are ultimately distracting. - Follow along with the call/chat, add any comments you feel are appropriate, but keep the discussion relevant to the problem at hand. - If you are not an SME, try to filter any discussion through the primary SME for that role. Too many people discussing at once become overwhelming, so we should try to maintain a hierarchical structure to the call if possible. - Follow instructions from the business lead. --- URL: https://docs.pagerduty.com/ops-guides/business-incident-response/emergency-operations # Emergency business operations Steps to enter emergency operations mode  After an incident briefing has concluded, the next order of business should be to mitigate any additional damage by switching normal business operations into emergency mode. At a minimum, you should halt all outbound marketing activities and start tuning into broader communication channels. One of the worst times to draw new attention to your company or its products are when they aren’t fully functional. External customers and internal stakeholders will also notice the prolonged impact and you should be ready to respond to their concerns. ## Steps for the Business Lead 1. Instruct the Marketing Officer to halt all outbound marketing activities. Ask the Marketing Officer to provide a time estimate for completion and check back in once that time has elapsed. 1. Instruct the Social Officer to halt all social activity & monitor social channels. Ask the Social Officer to provide a time estimate for completion and check back in once that time has elapsed. ## Steps for the Marketing Officer 1. Stop all outbound marketing campaigns. 1. Stop all paid social campaigns. 1. Stop any outbound calling campaigns. 1. Stop any additional paid advertisement. 1. Ensure that no new promotional content is posted to your web properties. 1. Notify the Business Lead when all outbound marketing activities are stopped. ## Steps for the Social Officer 1. Stop any auto-scheduled posts to external social channels (e.g. Twitter, Facebook, LinkedIn, etc). 1. Notify the Business Lead when all scheduled social posts are stopped. 1. Monitor all external social channels for user comments, posting replies if necessary. 1. Monitor internal communication channels for questions & concerns, replying if necessary. 1. Notify the Business Lead of any noteworthy activity when monitoring social comments (e.g. major changes in overall sentiment, critical questions, or other emergencies). --- URL: https://docs.pagerduty.com/ops-guides/business-incident-response/incident-briefing # Incident briefing Walks the Business Lead through the questions and handoffs needed to run an incident briefing once business responders join the technical bridge.  Once the Business Lead, Customer Liaison, and Technical SLT are present on the business incident call, a technical briefing can begin. ## Steps for the Business Lead 1. Verify the Customer Liaison is ready to deliver an incident briefing. 1. Verify the Technical SLT is ready to take notes during the briefing. 1. Ask the Customer Liaison the following questions. It is okay if the answers are unknown at the start of the business incident. If they are unknown, it is the responsibility of the Customer Liaison to update the Business Lead once answers are determined. - When did the technical incident start? - What error occurred that triggered the incident? - How many customers are currently affected? - How many customers could be affected in the worst case scenario? - Which business services are affected? - As a customer, how would this affect my ability to use the product? - When do we expect to have updates on new developments for the technical incident? - Any other relevant details? 1. Ask the Technical SLT if they have all the details they need in order to start drafting communications. If not, the Technical SLT should ask any additional questions necessary for that to happen. 1. When the Technical SLT confirms that they have the information they need, you can release the Customer Liaison to rejoin the technical incident call in listen-only mode to keep track of any new developments. 1. Instruct the Technical SLT to post the documented details of the incident briefing into the business incident chat channel. 1. Instruct the Technical SLT to create a shared document where proposed outbound communications will be staged. --- URL: https://docs.pagerduty.com/ops-guides/business-incident-response/managing-communications # Managing communications Precise steps for managing proactive communications  Once business operations are in emergency mode, the business incident group should begin generating outbound communications that are reviewed and approved by the messaging group. This is a balance between speed and caution. In practice, this managing communications phase starts very soon after the business operations phase if **responders are working in parallel.** The Technical SLT should already have already set up a shared document that collaborators can use to review any proposed messaging. In practice, it may take a few minutes for all necessary reviewers and approvers to join the business incident call and be in a place where they can review the document. The Technical SLT should use any available time to churn through a list of messages that should be created for multiple audiences until all reviewers and approvers have joined the call. ## Phases of an Incident Business incidents have distinct phases that align with the lifecycle of technical incidents. The phases of a technical incident are: - **Detection** - An issue is initially detected and an incident is triggered. This happens long before severe technical incident conditions are met. - **Investigation** - The incident is being investigated, but no contributing factor(s) has yet been identified. Because duration is a threshold consideration, it’s possible that an incident could escalate into a severe technical incident during this phase, but not before. - **Identification** - The suspected contributing factor(s) has been identified, but a remediation has yet to be taken. It’s also possible that an incident could escalate into a severe technical incident during this phase. - **Monitoring** - A remediation has been attempted with initial signs of success, but incident symptoms have not yet fully disappeared. An incident would not escalate into a severe technical incident during or after this phase since a recovery is underway. - **Resolution** - The remediation has been confirmed, no symptoms persists, and the issue is officially closed. - **Analysis** - This is the time between incident resolution and when an incident postmortem is published. - **Publishing** - This is when the Incident postmortem has been made public. Business incidents may begin during a technical incident’s Investigation or Identification phases. Different considerations apply based on where in the incident lifecycle a business incident is triggered. ## Audiences During each phase of a business incident, this group should generate messages aimed at different audiences using different mediums. The exact choice(s) will vary between organizations, but the basic considerations are: - **Internal Stakeholders** - These are employees, board members, or other key members of your organization who may be affected by the severe technical incident in progress. When determining a recipient list for sending update, the risk is that this important notifications can be treated as noise if your blast radius is too large. Recipients who cannot take action as a result of this notification, or whose job functions are largely unaffected by the incident, will disregard. As a rule of thumb, anyone in a customer facing role or anyone likely to be contacted by any external persons with questions should be updated by this group. Refer to our [stakeholder communications](/ops-guides/stakeholder-comms-guide) guide for more in-depth guidelines. - **Strategic Customers** - Customers that are most critical to the health of your business should be specifically addressed during a severe technical incident. The goal of contacting strategic customers is to give them an opportunity to open a two-way conversation with you, if needed. Creating personalized one-to-one communication (e.g. via email) proactively can help mitigate some of the trust erosion that can occur during severe technical incidents. Many strategic customers will want to engage during and after these incidents, so be mindful that you have the capacity to engage directly when determining your recipient list. The worst thing to do here is offer to speak to customers directly about their concerns and then be unable to get back to them for weeks. - **All Customers** - Every customer is important, even if you do not have the capacity to address each customer in a one-to-one manner. The goal of general customer communications is to proactively reach out to customers and address their concerns in a one-to-many fashion. These types of communications are typically already happening in a major incident (e.g. Twitter status updates). This group should determine if additional communications (e.g. a follow up email) are warranted under the circumstances. > **How many messages to send:** At a minimum, the business incident group should generate messages to distribute to each audience for each phase of an incident. For example, if a business incident was triggered during the Investigation phase of a severe technical incident, the following messages would be created: > > 1. Internal stakeholder investigation phase message > 1. Strategic customer investigation phase message > 1. All customers investigation phase message > > 1. Internal stakeholder identification phase message > 1. Strategic customer identification phase message > 1. All customers identification phase message > > 1. Internal stakeholder resolution phase message > 1. Strategic customer resolution phase message > 1. All customers resolution phase message ## Message Creation Loop The process for creating messages to distribute to each audience during each phase is the same, although the outputs are different. The Message Creation Loop is a set of steps to go through for each message being created. Prioritize which audiences should be contacted first in each phase and go through the loop in order until all audiences have been contacted. > **Note:** It’s possible that messages being created may not be sent to each audience during each phase. For example, the incident may move from the Investigation phase to the Identification phase while you’re still working on the Investigation message. If that occurs, you should stop working on the Investigation messages and start working on the Identification messages. Similarly, you may decide that an update to a particular audience is not appropriate at this phase. Going through the steps in the message loop for each audience at each phase will help you make those decisions. ## Steps for the Business Lead It is your job to set the pace for which audience is being addressed at which incident phase. Keep track of which responders have completed their review. Ensure everything is happening in a timely manner. Seek any **strong objections** from reviewers and approvers to help drive the process to completion. It is also your job to manage competing demands and keep the business incident resolution process moving. You must direct the show. Ensure that all responders are reviewing drafts in a timely manner. 1. Instruct the Technical SLT to begin drafting the audience message for this phase of the incident. Ask the Technical SLT to provide a time estimate for completion and check back in once that time has elapsed. 1. When the draft is complete, direct each message reviewer (Messaging Officer, Legal Officer) to review the draft and make suggestions/edits as necessary. Ask each reviewer to provide a time estimate for completion and check back in once that time has elapsed. 1. Once reviews are complete, contact the Customer Liaison and alert them that you will soon have a pending message for distribution. Ask them to rejoin the business incident call as soon as possible. 1. When the reviews are complete, direct the ELT Approver to review the message and authorize it for release. Ask the ELT Approver to provide a time estimate and check back in once that time has elapsed. 1. Once approved, tell the Customer Liaison that an outbound message is ready and needs approval to send from the Incident Commander. 1. Once the Incident Commander approves sending the message, direct the appropriate business responder to do the work of distributing this message to its audience. Ask that responder to provide and update when the message has been sent and to provide a time estimate for completion. Check back in once that time has elapsed. 1. Move on to the next audience if still in the same phase. If not, wait for updates from the technical incident group when a new phase is started. ## Steps for the Technical ELT > **Using Message Templates:** The business incident team has a finite number of messages to produce and audiences for which to tune them. Using templates to create these messages can both jumpstart the communication cycle and address the needs of various reviewers in advance. Generate static boilerplate message components with pre-approved language in advance and create placeholders for dynamic incident details. Focusing on incident specifics, rather than creating everything from scratch, can save valuable time. 1. Size up the situational requirements for each message by answering the questions below. 1. What information is vital for setting expectations during the severe technical incident? 1. What other information do you need to put the event in perspective? 1. Who will be receiving this message internally and externally? 1. What technical details are relevant to share at this time? 1. Use a statement template as the basis for your message to jumpstart the draft process. 1. Share the document with the reviewers--Legal & Messaging Officer for language, Customer Liaison for technical content, and the ELT Approver for final approval. 1. Customer Liaison to verify technical accuracy. Inform the Business Lead that the initial draft is ready for review. 1. Work with reviewers & approvers to reach consensus on message content. As the designated spokesperson for the event, the message is in your voice and tone. Seek strong objections to content that should be adjusted, but try to minimize small tweaks and edits that may prolong the review process unnecessarily. ## Steps for Reviewers & Approvers 1. Review drafts for your area of concern. In other words, it’s okay to make spelling and grammatical edits if necessary. However, your main focus is to ensure the messaging guidelines for the portion of the business are represented. 1. Make wording suggestions to the Technical SLT, but ultimately it is their tone and voice that takes precedence. 1. Use **strong objections** for non-negotiable wording choices that must be adhered to for policy compliance. ## Steps for the Customer Liaison 1. When reviewing a draft, focus primarily on the technical accuracy of the message. Suggest alterations as necessary. 1. When a draft is approved and ready for distribution, rejoin the technical inciden call and inform the Incident Commander that a new message is ready for distribution at the earliest opportunity. 1. Wait for the Incident Commander to review the message and approve it for distribution. 1. Inform the Business Lead that the draft has approval for distribution. --- URL: https://docs.pagerduty.com/ops-guides/business-incident-response/recognizing-a-business-incident # Recognizing a Business Incident Criteria for setting business incident thresholds and an overview of declaring a business incident  Technical issues do not begin as severe technical incidents. Deciding when they escalate into severe technical incident status has many considerations. Regardless of what you decide to use as the exact criteria for defining a severe technical incident, we recommend that category be set as the highest possible [severity level](/ops-guides/incident-response-guide/severity-levels) for any incident your organization can experience. To do that, it may be necessary to redefine incident severity levels or create a new severity level to reserve a space for the rare occurrences that meet this criteria. For example, if today you use categories label P5-P1 (where P1 is highest severity), you may create a new P0 category to fit the criteria below. Similarly, you may redefine the criteria for your levels P5-P2, and reserve P1 to match your definition of severe technical incidents. The goal is to create an explicit label for incidents that require a broader response from the business. If your severity levels were not previously defined with that in mind, this is an opportunity to do so now. ## Severe technical incident criteria The exact criteria for what constitutes situations that may cause material brand damage to your company will vary from organization to organization. However, generally speaking, the considerations for determining those thresholds should take _at least_ the following three considerations into account: visibility, impact, and duration. Visibility quantifies how noticeable the disruption may be to customers. Does the technical incident affect a primary (i.e. core) component of the services your company provides that is used by a majority of your own applications and those of customers, or does it impact a secondary (i.e. ancillary) component that is less often used and has a lower potential impact across your customer base? The goal of this consideration is to consider the *potential* impact that the technical incident might have on your customer base. Impact quantifies the *actual* impact that is currently being experienced by your customers. You may have a high visibility component of your application that is currently unavailable. But the incident may be occurring during a part of your business day where you experience the lowest customer traffic. You may have high potential for impact, but the actual impact being felt could be substantially lower at this particular time. Duration quantifies how long your customers have been impacted. You may have a high visibility incident, with substantial customer impact, but if the duration has only been 2 minutes so far, then is it worth mobilizing a broader response across your entire organization? More importantly, duration also quantifies *how long you expect* this incident to continue. While a time to resolution is never really known, this is more of a gauge of confidence. In other words, how high is confidence that the technical issue may be resolved within the next hour? At a minimum, these considerations should factor into how you determine your severe incident thresholds. Any criteria that you set should account for the _totality_ of impact that could or is currently being experienced by your customers. In other words, we recommend devising a formula for determining an overall impact score based on the factors you select. Set your severe technical incident threshold based on that overall impact score. ## How to declare a business incident While criteria exists for defining severe technical incident thresholds, we do not recommend that an automatic escalation exist to trigger a business incident. A reality for many businesses is that not all customer impact scenarios carry the same risk of material damage. Further, some judgment calls may be required when gauging softer measures like confidence in timely incident resolution. To address these challenges, we recommend that business incidents be manually triggers as a mutual collaboration between a designated business stakeholder and the Incident Commander. When severe technical incident thresholds have been met--or even appear likely--a designated business stakeholder (typically, a member of the [senior leadership team in a technical role](/ops-guides/business-incident-response/different-roles#technical-slt)) should be paged to join the technical incident call. The business stakeholder’s role on the call is to act as a business SME and to assess whether a broader company response is warranted. If a wider response is warranted, a recommendation is made to the Incident Commander to escalate the incident to severe technical incident status. That escalation is what starts a new business incident. --- URL: https://docs.pagerduty.com/ops-guides/business-incident-response/resolving # Resolving an incident How to resolve a business incident  A business incident resolves after its parent severe technical incident has been resolved. Go through the Message Creation Loop to create a resolution message. After the resolution message has been approved and distributed, the Business Lead should instruct responders to complete the following actions. 1. Instruct the Social Officer to resume all regularly scheduled social activities. The Social Officer will notify the Business Lead when all social activities are resumed. 1. Instruct the Marketing Officer to resume all regularly scheduled marketing activities. The Growth Officer will notify the Comms Lead when all marketing activities are resumed. 1. Instruct the Technical SLT to prepare a Preliminary Analysis that should be ready within 24 hours. 1. Ensure all actions and owners have been documented via chat. Transcribe any additional actions/notes as necessary. 1. End the Business Incident call and resolve the business incident. --- URL: https://docs.pagerduty.com/ops-guides/business-incident-response/triggering # Triggering a business incident The precise mechanics for how to trigger a business incident from a severe technical incident  When an ongoing incident is escalated to severe technical incident status, a new business incident is triggered. Business incident response operates as a subgroup of the technical incident. Therefore, two key roles must shift into the subgroup and away from the technical incident group. The Technical SLT, formerly in the role of a business SME on the technical call, must then leave the technical incident call and join the new business incident call. Additionally, a technical subject matter expert is needed on the new business incident call to ensure technical accuracy and brief the subgroup on the details of the technical incident. The Customer Liaison on the technical incident call should page a backup responder that can fill their role. Once the backup Customer Liaison is present on the technical call, the primary liaison should handoff their responsibilities to the backup. The formerly-primary liaison will then leave the technical incident call to join the new business incident call. This handoff is designed to ensure the least possible time for both groups to have someone in each role that is up to speed on the current situation. Once a [Business Lead](/ops-guides/business-incident-response/different-roles#business-lead) is also on the business incident call, resolution of the new business incident can begin. --- URL: https://docs.pagerduty.com/ops-guides/business-incident-response/what-is-a-business-incident # What is a Business Incident The basics of Business Incidents. What business incidents are and why they matter.  A business has many different types of incidents to manage. A Technical Business Incident occurs when there is an ongoing technical incident in progress and it creates enough impact to require a larger response across several business units in order to mitigate the damage. The escalation of a technical incident into a severe technical incident is what triggers a new business incident. Technical issues do not begin as [severe technical incidents](/ops-guides/business-incident-response/definitions#severe-technical-incident). Rather, they escalate to severe status over time. When that escalation happens, business incident response occurs in a parallel session that works as a subgroup of the technical incident. The goals of [business responders](/ops-guides/business-incident-response/definitions#business-responders) in this subgroup are to start by switching normal business operations into emergency business operations mode, then shift to managing stakeholder and customer communications throughout the course of the technical incident. After the technical incident is resolved, the goals are to start by restoring business operations to normal mode, then shift to conducting proactive customer communications related activities and participating in a postmortem. Business responders work in a subgroup outside of the technical incident call in order to allow [technical responders](/ops-guides/business-incident-response/definitions#technical-responders) to focus on resolving the technical incident. Business responders must coordinate complex tasks and may need to involve a wide number of additional business responders. Business incidents work as a subgroup to minimize distractions for technical responders. Although business incident response is a subgroup of a current technical incident, there are many moving parts to this process that require tracking and coordination. We recommend that a business incident be tracked as a separate incident from (but related to) its parent incident. A business incident should also have its own version of an “incident commander” to manage coordination and competing business demands. Tracking business response as a separate incident helps business responders and technical responders have clarity when examining their own actions during a postmortem. It’s important to note that while business incident response is managed as a separate incident for tracking and improvement purposes, the subgroup still reports to the technical Incident Commander and business responders should participate in the technical postmortem. --- URL: https://docs.pagerduty.com/ops-guides/customer-service-ops # Customer Service Ops The requirements of digital operations for businesses in any industry can stretch resources and cause stress — for technical teams racing to keep up, for  The requirements of digital operations for businesses in any industry can stretch resources and cause stress — for technical teams racing to keep up, for marketing and PR teams striving to stay ahead of potential issues, and for executive teams watching the market and competitors. Digitalization and transformation present new challenges and opportunities every day for organizations of all sizes and industries. We know that digital operations is a complex mix of distributed systems mastery and in-depth awareness of the broader IT industry ecosystem. Staying on top of and maintaining your organization’s technical platforms can be daunting. It’s easy to miss things when something goes wrong and your team is embroiled in an incident. One thing you can never, ever go short on is communications with your team and your users during an incident. We highlight the role of the [customer liaison](/ops-guides/incident-response-guide/customer-liaison) in our [Incident Response Training](/ops-guides/incident-response-guide). In this guide, we will revisit some of those points — but with a focus on the role of your customer service team in a digital operations environment. If your team is new to incident response, you can read up on our methods in the other guide, but it isn’t a pre-requisite for the material provided in this guide. ## Who Is This Guide For? Customer service, sometimes also referred to as customer support, has a critical role to play in the organization’s day-to-day interactions with customers — and this role is even more important when an incident occurs. We prepared this guide to help customer service practitioners and managers establish strong practices with their peers in engineering organizations. Additionally, engineering leaders should not hesitate to partner with their customer service colleagues to ensure the best experience for their customers and end users. Customer service is a discipline much like any other throughout the digital organization. Customer service teams need access to tooling and automation that can help them accomplish the organization’s goals and provide an ideal customer experience. ## What is Covered? - [Introduction](/ops-guides/customer-service-ops/introduction) - [What Is Full-Case Ownership?](/ops-guides/customer-service-ops/introduction#full-case-ownership) Our definition of full-case ownership and why customer service teams should adopt this set of practices. ### Customer Service in Digital Organizations How full-case ownership fits into digital transformation initiatives and ways for customer service teams to quickly demonstrate an increase in value. - [Why Customer Experience Matters to Digital Organizations](/ops-guides/customer-service-ops/digital-organizations) - [Creating White-Glove Experiences](/ops-guides/customer-service-ops/digital-organizations#white-glove-experiences) - [Improving Customer Service Agent Experience](/ops-guides/customer-service-ops/digital-organizations#customer-service-agent-experience) ### Aligning Customer Service and Engineering How to align customer service teams with engineering teams in support of the customer experience. - [Customer Service in the Software Delivery Lifecycle](/ops-guides/customer-service-ops/customer-service-in-sdlc#customer-service-in-the-software-development-life-cycle) ### The Customer Service Role in Incidents How to make your customer service and development teams part of delivering customer satisfaction instead of just reporting on it. - [Customer Service Role in Incident Response](/ops-guides/customer-service-ops/customer-service-role-in-incidents) - [Aggregation of Customer-Reported Issues](/ops-guides/customer-service-ops/customer-service-role-in-incidents#aggregation-of-customer-reported-issues) - [Prioritization and SLAs](/ops-guides/customer-service-ops/customer-service-role-in-incidents#prioritization-and-slas) - [Customer Liaison and Stakeholder Communication](/ops-guides/customer-service-ops/customer-service-role-in-incidents#customer-liaison-and-stakeholder-communication) - [Post-Incident Follow Up](/ops-guides/customer-service-ops/customer-service-role-in-incidents#post-incident-follow-up) ### Metrics That Matter From CSAT, to NPS, to FCR: how to understand and improve on your metrics. - [Metrics, Goals, and Incentivization](/ops-guides/customer-service-ops/metrics) - [CSAT, NPS and FCR](/ops-guides/customer-service-ops/metrics#csat-nps-and-fcr): Common customer service metrics such as Customer Satisfaction, Net Promoter Score, and First Contact Resolution. - [MTTA and MTTR](/ops-guides/customer-service-ops/metrics#mtta-and-mttr): Incident response metrics including Mean Time to Acknowledge and Mean Time to Recover. ### Next Steps Put Full-Case Ownership into practice for your team using the PagerDuty platform as an example and learn about our Zendesk and Salesforce Service Cloud Integrations. - [Integrating Zendesk and PagerDuty](/ops-guides/customer-service-ops/next-steps#integrating-zendesk-and-pagerduty) - [Integrating Salesforce Service Cloud and PagerDuty](/ops-guides/customer-service-ops/next-steps#integrating-salesforce-and-pagerduty) ### Additional Resources Links to additional reading from PagerDuty and other industry sources to help you get started with full-case ownership. - [Additional Resources](/ops-guides/customer-service-ops/additional-resources) ## License This documentation is provided under the Apache License 2.0. In plain English, that means you can use and modify this documentation and use it both commercially and for private use. However, you must include any original copyright notices and the original LICENSE file. Whether you are a PagerDuty customer or not, we want you to have the ability to use this documentation internally at your own company. You can view the source code for all of [this documentation](https://github.com/PagerDuty/full-case-ownership-docs) on our [GitHub account](https://github.com/PagerDuty/); feel free to fork the repository and use it as a base for your own internal documentation. --- URL: https://docs.pagerduty.com/ops-guides/customer-service-ops/additional-resources # Additional Resources PagerDuty has a number of resources available:  ## PagerDuty Resources [PagerDuty](https://pagerduty.com) has a number of resources available: - Download our report, [*the State of Unplanned Work*](https://www.pagerduty.com/resources/reports/unplanned-work/). - Check out our ebook, [*Where Real-Time Work Meets Customer Service*](https://www.pagerduty.com/resources/ebook/real-time-work-customer-service/). - Learn more about our customer service integrations [on our blog](https://www.pagerduty.com/blog/customer-service-plan-2020/). - View our webinar, [*Solve Customer Issues in Real-Time by Uniting Your Customer Service and Technical Teams*](https://pagerduty.wistia.com/medias/35va08byec). - PagerDuty's Chief Customer Officer, Manjula Talreja, talks about [*Getting Ahead of Customer Issues With PagerDuty for Customer Service*](https://www.pagerduty.com/resources/webinar/pagerduty-for-customer-service/). ### Integrations - [PagerDuty for Customer Service and Salesforce Service Cloud](https://www.pagerduty.com/integrations/salesforce/) - [PagerDuty for Customer Service and Zendesk](https://www.pagerduty.com/integrations/zendesk/) - [Integrate PagerDuty and Freshdesk](https://support.freshdesk.com/support/solutions/articles/50000002937-integrating-your-freshdesk-account-with-pagerduty) ### Other Ops Guides - [Stakeholder Communications](/ops-guides/stakeholder-comms-guide) - [Customer Liaison discussion in Incident Response](/ops-guides/incident-response-guide/customer-liaison) ## Industry Resources - [*7 Best Practices to Prepare for a New Digital Support Reality* at Coveo](https://blog.coveo.com/7-best-practices-to-prepare-for-a-new-digital-support-reality/). - [*How Customer Experience Drives Digital Transformation* at SuperOffice](https://www.superoffice.com/blog/digital-transformation/) - From [McKinsey](https://www.mckinsey.com/), a discussion on customer experience and personalization. [*The vision for 2025: Hyperpersonalized care and 'care of one'*](https://www.mckinsey.com/business-functions/operations/our-insights/the-vision-for-2025-hyperpersonalized-care-and-care-of-one) - Forrester's [*Predictions 2020*](https://go.forrester.com/predictions-2020) - This piece on the [Salesforce](https://salesforce.com) blog, [*40 Customer Service Statistics to Move Your Business Forward*](https://www.salesforce.com/blog/customer-service-stats/) - A post at [HubSpot](https://hubspot.com), [*The Hard Truth About Acquisition Costs (And How Your Customers Can Save You)*](https://blog.hubspot.com/service/customer-acquisition-study) --- URL: https://docs.pagerduty.com/ops-guides/customer-service-ops/customer-service-in-sdlc # Customer Service in SDLC For digital businesses, users interact with products and services via software, on their mobile devices, and/or computers. How that software behaves and  For digital businesses, users interact with products and services via software, on their mobile devices, and/or computers. How that software behaves and performs in production can be monitored and measured, but live user experience is difficult to pin down before release. Customer service teams provide a crucial feedback route for users of your digital products to report bugs and request features. ## Customer Service in the Software Development Life Cycle 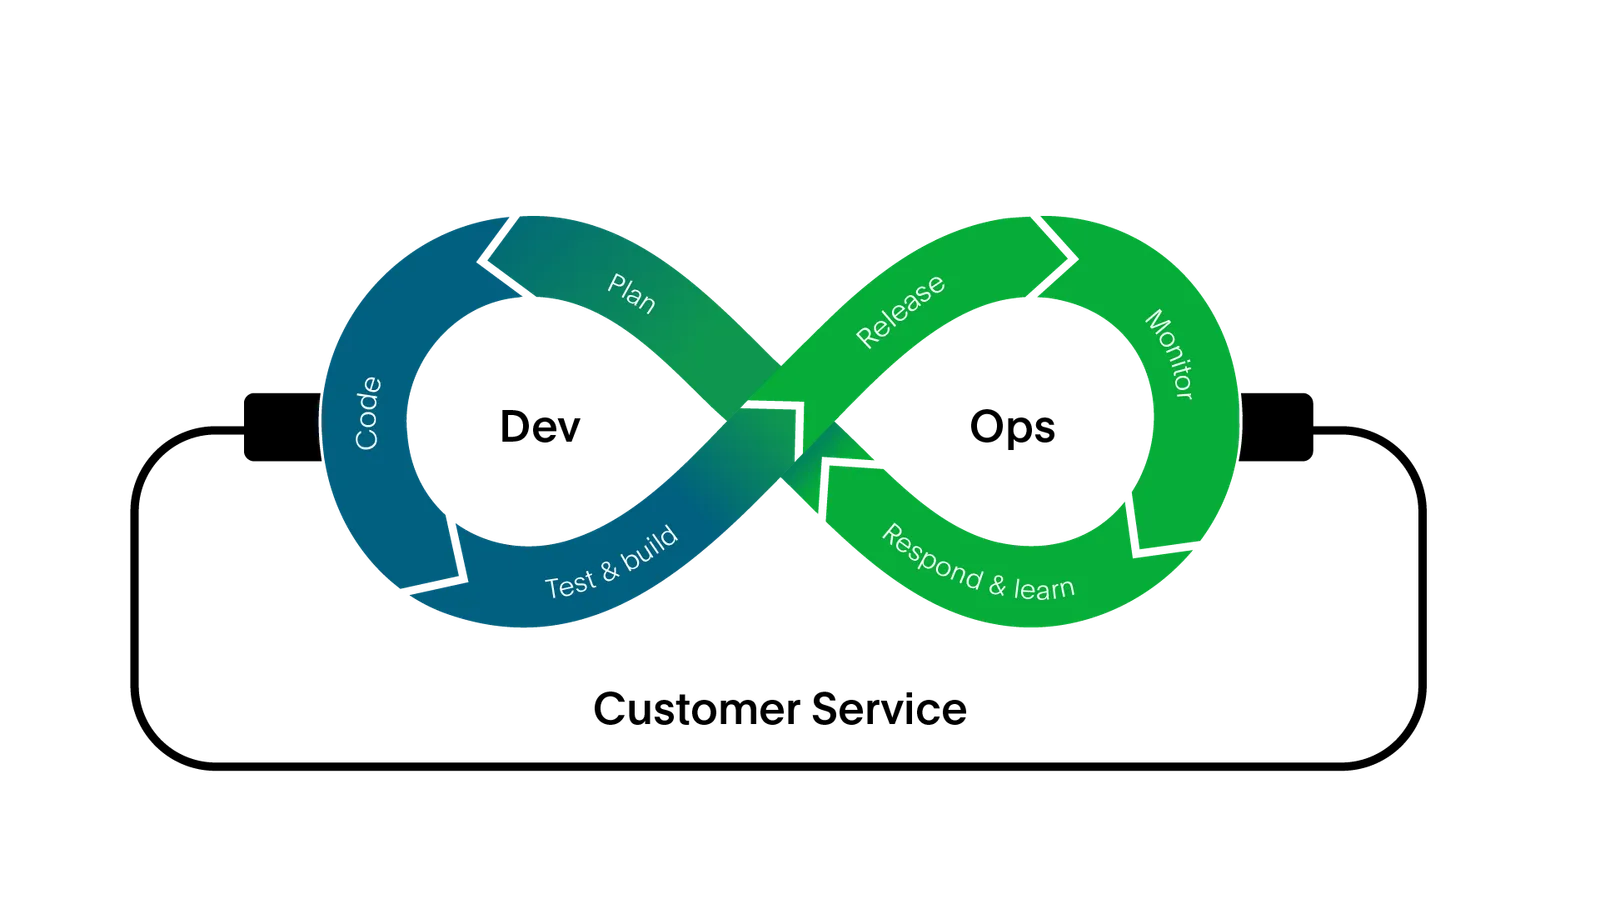 The modern software development life cycle doesn’t end when code is checked into a repository and all the tests turn green. The constant feedback loop from users back into development planning links user requirements directly to the product management phase of the cycle. In real-time, digital organizations, it is easy for customer service teams to be overwhelmed with the amount of feedback, and the channels that feedback is collected from. Monitoring support forums, watching email threads, ticket queues, social media accounts, and collating reports from all those channels require modern tooling and automated tasks so data isn’t lost. Customer service teams have their own tooling and workflows, often disjointed from the tools that application developers use. Digital organizations are starting to see the rewards possible when customer service tools and development tools are more closely integrated. Customer service teams serve a key function for your organization, collecting and collating customer information and feedback. This data should help inform product decisions, prioritize improvements and new features, and help technical teams focus on work that will have the greatest impact. Integrating customer service tools with software development tools such as Jira helps to shorten the feedback loop and allows customer service teams to advocate for the customer’s needs in the planning stages of the software development lifecycle. Development teams that are in close contact with their customer service teams benefit from having better, real-world user information that can be incorporated into new features and improvements. Automation will help customer service teams meet the needs of customers, even as more interactions are possible via digital channels. Team members using templated responses to common questions can still personalize the communication with the customer, providing an extra level of care where an automated response might alienate a frustrated user. Software integrations between sales tools, customer service tools, and development tools give all teams a 360-degree view of the needs of priority customers and escalate strategically. Organizations across various industries have seen the benefits of adopting shared goals and purposes across different teams. Including customer service teams in larger initiatives like DevOps transformations and automation projects will increase the effectiveness of customer-focused teams. --- URL: https://docs.pagerduty.com/ops-guides/customer-service-ops/customer-service-role-in-incidents # Customer Service Role in Incidents experience during the disruption of their service. Customers expect software to fail, but also expect that the experience the vendor provides them to be  > ...Customers don’t remember the actual incident, but rather the experience during the disruption of their service. Customers expect software to fail, but also expect that the experience the vendor provides them to be world-class.
-- Manjula Talreja, Chief Customer Officer, PagerDuty Customer service teams are a key participant in successful incident response. While digital organizations strive for proactive monitoring and telemetry collection across services and applications, complexity and scale make being perfectly proactive all but impossible. End users may notice something is wrong before an alarm triggers sometimes. Providing a clear path for customer service teams to escalate customer-reported issues to the appropriate teams, and to participate in the remediation process, focuses incident resolution on the customer. Whether trouble is reported by end users and escalated via customer service, or reported by monitoring systems and reported to customer service, including customer service teams in incident response can strengthen customer relationships just when they are potentially weakened because of incidents. In the “old way of working,” customer service teams are left out of this workflow, exacerbating the chaos and confusion that occurs during an incident. When multiple disconnected customer service agents are hearing from customers, and creating duplicate tickets and reach outs, valuable time is wasted in both the identification and resolution of issues. > **Tip:** Make your customer service/support team part of delivering customer satisfaction instead of just reporting on it. ## Aggregation of Customer-Reported Issues When an incident triggers and a technical team is mobilized for response, they should know exactly what services are impacted, and hopefully know what the extent of the incident is. We refer to this as the “blast radius” of an incident. While this sounds scary, it is meant to be a measure of how much of the service is impacted, how many features, the depth to which they are affected, and discovering whether they are slow or completely offline. Today, it’s very hard for developers to determine customer impact. That's where customer service teams can help — they can help development understand customer impact by associating inbound customer complaints to technical incidents to help drive priorities. Complex meshes of interconnected microservices make determining the blast radius of an incident difficult. If your team also practices other methodologies, such as A/B testing or canary deployments, not all users may be experiencing the same issues in the same way. As a customer service team receives reports of issues during an incident, that data becomes part of the impact of the incident and should be incorporated into the resolution process. Some examples include: - **Geographic aggregation**: “We’re seeing increased reports of issues from customers in central and southern Europe, but not northern Europe.” - **Data partitioning**: “We’re seeing increased reports of issues for customers with account numbers starting with 1-4 only.” - **Product versioning**: “We’re seeing increased reports of issues for customers on version 5.1 of the client software” or “customers using Android are reporting more problems than customers using iOS.” - **Feature partitioning**: “Only accounts with the new Teapot Customization feature enabled are seeing issues.” This is all vitally important intelligence that can be difficult to dig out of the services themselves, especially when application teams are trying to remediate the incident. Even when some of the data points might be known (e.g., the datacenter in southern Europe is offline — customer reports verify that your failover to another datacenter for those customers has failed). Customer service teams will also have insight into whether an incident is improving or getting worse based on the number of customers reporting issues over time. This is important for cascading failures. For example, one geographic location failing may overload the next-closest location. It’s also vital information for identifying if a resolution is having the intended impact on the customer experience. ## Prioritization and SLAs Your customer service team is in a unique position to help confirm the impact of an incident with regards to your end users. This is especially important when you have a contractual service level agreement (SLA) with your users, particularly if different customers might have different SLAs. Your customer service team will have the insight to know when your services are reaching their SLA for certain customers and alert the responding team. This is an important piece of information to manage, and engineering teams might not have the visibility into those contractual agreements. Managing customer SLAs aids in the prioritization of issues during incidents, if restoring some services first will maintain an SLA for a customer or category of customers. Customer service can also advise on whether or not an incident should be escalated or have its severity increased based on the customer intelligence they are receiving. More customer impact could mean a higher severity level for the incident, more responders included in the triage, and more stakeholders informed. ## Customer Liaison and Stakeholder Communication We’ve written about communications during incidents in some of our other [ops guides](/ops-guides). In the [Incident Response guide](/ops-guides/incident-response-guide/customer-liaison) there is a section on the Customer Liaison, and communicating with customers. We also have the [Stakeholder Communications](/ops-guides/stakeholder-comms-guide) guide that delves deeper into the specifics of communicating during an incident. Your customer service team leaders are essential participants when it comes to codifying your communications practices for incidents. Customer service teams should be helping to create the messaging for customers, templatize responses, and manage communications channels. Not all of your customers will be watching your social media accounts for updates, or even to verify if there is an issue going on with your services, before reporting to your support team. Communications from your customer service team during an incident should be built into templates with clear information about the services impacted and where to go for more information. ## Post-Incident Follow Up Maintaining customer relationships after an incident is crucial. Incidents happen to everyone, all the time, and how your organization responds and communicates with customers afterwards will set you apart from other organizations. Many customers will figure out when a service is restored and things are back to normal when they try to access the service, or if they are watching your status page or status updates. For customers that report issues, and for customers with priority support or other white glove services, your customer service team is there to reach out personally and let users know that the incident is over. Depending on the nature of the services impacted and user interest, your customer service team may notify users when the services are verified to be restored, but they can also notify customers after the [postmortem](/ops-guides/postmortem-best-practices) is held. This gives the customer service team extra data to present to the users about the impact of the incident, the resolution, and the long-term plans for prevention. The customer service team follows the incident reports in a *full-case ownership* methodology, providing the customer with a consistent point of contact through issue resolution. An incident that violates a contractual SLA definitely warrants a personal response from your organization, particularly if refunds or credits are due to impacted users. Even if the contractual obligations aren’t broken, customer service teams can identify users that might need additional attention, assurances, or incentives after an incident. --- URL: https://docs.pagerduty.com/ops-guides/customer-service-ops/digital-organizations # Digital Organizations -- Forrester's Predictions 2020  > Consumers appreciate experiences that spark delight. They love experiences that spark hope.
-- Forrester's *Predictions 2020* Customers are increasingly interacting with retail, travel, and entertainment activities in digital-first and digital-only ways for everything — from the convenience of online banking, to hanging out at home binge-watching the newest hit show. Customer service teams are faced with more work than ever before and require tooling that will keep up with demand. As businesses focus more and more on customer experience, user-facing organizations like customer service and support are experiencing greater overlap with their technical counterparts when it comes to challenges and opportunities for real-time work. Both are learning that they need to transition from a reactive state to a more proactive, preventative posture in order to meet the growing expectations of the customer. For digital businesses, customer service teams provide more than just response to tickets or customer reports. They are the **customer’s perception of the company** when they experience problems, issues, or questions. In a digital-only environment, stress, confusion, and anger that might be met with a smiling face and a calm voice at a physical service desk are increasingly met with chatbots, confounding phone menus, and robotic voices. There is opportunity for organizations to set themselves apart from competitors by strengthening their commitment to empowered and knowledgeable customer service teams. Focusing on the customer experience builds brand loyalty and creates return customers, even when incidents happen. Organizations with rigorous commitment to their customers will center customer needs in every interaction. Amazon famously borrowed the “andon cord” concept from the Toyota Production System to enhance customer experience. Originally, the andon cord was implemented on manufacturing lines to empower any worker to stop the line if there was a problem with the products being manufactured. Amazon adapted the concept for their digital operations. When a customer service agent notices that a product has repeated problems, they “pull the cord” and place a hold on the item, rendering it unable to be sold until all issues are resolved. Your customer service teams should be empowered to pull the cord in your organizations as well. Customer service agents see issues just as the users see them, are able to aggregate and correlate reports, and gather additional information from reporting users to enhance the response process. They should be encouraged to escalate issues to the appropriate technical teams when the user experience is jeopardized. Creating a customer-first or customer-focused culture can provide more positive outcomes than any marketing campaign. The [now-legendary story](https://www.cbsnews.com/news/many-happy-returns/) of a Nordstrom store refunding a purchase of tires from the shop that had previously stood on the Nordstrom location is nearly 50 years old but still boosts Nordstrom’s reputation and customer loyalty. Providing exceptional customer service, customer support, and customer experience is a part of your product and increases its value. ## White-Glove Experiences Digital interactions change the available options to create exclusive experiences for your priority customers. What is the chef’s table or personal shopper experience in a digital-only world? Customers not constrained to regular business hours might have questions, problems, or other concerns about your products or services at any time of the day or night. Providing your key customers with the kind of responsiveness they deserve can be challenging if it means fully staffing a response desk 24x7 for just a few strategic accounts. Moving your customer service to a real-time response solution gives your organization the flexibility to provide personalized and creative solutions to your key customers. A specially trained team can be on call for your strategic accounts, empowered to solve problems, and make customers happy. Having a team that can be notified as-needed — rather than fully staffed at all times waiting for incoming requests — allows you to scale your customer experience more efficiently as the business grows. ## Customer Service Agent Experience Improving the day-to-day work of your customer service team improves the experience they can provide for your customers. It seems like everyone has a horror story about contacting a customer service department and being met with someone who is clearly miserable; that interaction does not create a positive experience for the customer. Customer service teams need the same management attention any team does, especially since their roles contribute so much to the customer experience. In a nutshell: *happy agents translate to happy customers*. Empowering customer service teams to reach out to other teams and advocate for customers creates new communications channels and opportunities. Your customer service team can serve as a gateway into your organization for technical personnel who are still building skills; a close relationship with engineering supports their career growth. Customer service agents who transition to other departments bring with them their customer focus and dedication to the customer experience — a valuable addition to teams in your organization. --- URL: https://docs.pagerduty.com/ops-guides/customer-service-ops/introduction # Introduction The way we live and work has become fully digitalized, and this means consumers now expect flawless digital experiences in real time. When things don’t work,  The way we live and work has become fully digitalized, and this means consumers now expect flawless digital experiences in real time. When things don’t work, they look for options elsewhere. Having solely digital experiences makes building loyalty much more difficult, but when customers have a great customer service experience, it can have a huge impact on their trust and satisfaction with the brand. It can also mitigate the pain customers feel during incidents. Digital-first, digital-only, and omnichannel businesses face the same challenges for the always-on, real-time responsiveness digital customers have come to expect. Customer feedback is more immediately available than ever before. Some customers are anxious to provide it through whatever channels they have access to. The increased volume of feedback puts customer service teams at a disadvantage as they aim to collect and collate feedback and provide it to product teams in a timely and effective manner. Feedback and customer reports can then increase dramatically when something goes wrong with your service(s). Incidents and unplanned work that occur within your digital platforms can strain your customer relationships. Even planned work can cause strife for some users who happen to stumble across some downtime needed to keep your platform running. Customer service teams play a crucial role managing customer communications during issues. > 51% of companies only become aware of an issue - such as a failed shopping cart or cable service outage - when customers complain.
-- [State of Unplanned Work report](https://www.pagerduty.com/resources/reports/unplanned-work/) Getting ahead of problems and incidents before they impact users is a goal every organization strives to achieve. As systems increase in complexity, though, it is more and more difficult to get to that preventative point. When an incident happens, your customers might be the first to notice, especially, for example, in an environment where not all users are impacted. When your customers have issues with your services — even if the experience is limited to only their environment — a strong customer service practice strengthens customer and brand loyalty. Poor customer experiences can be amplified in the current social media landscape through outlets like Twitter, Facebook, and Yelp that make it easy for dissatisfied customers to air their grievances publicly. > In today’s always on world, 80% of people will stop doing business with a company because of a poor experience.
-- Michael Redbord, [The Hard Truth About Acquisition Costs (and How Your Customers Can Save You)](https://blog.hubspot.com/service/customer-acquisition-study) Transforming customer service tooling and workflows will help your organization provide better customer experiences in a digital world. Using tools with powerful integrations will allow your customer service team to collaborate with technical and sales teams to provide exemplary customer experiences. Customer service teams are your first point of contact and a friendly face when your services are impacted by incidents. Automating your customer service processes will allow your teams to provide better service to more customers, setting your organization apart from the competition. Similar to [full-service ownership](/ops-guides/service-ownership), where engineers are empowered to own their code in production, this is accomplished through ***full-case ownership***. ## Full-Case Ownership Full-case ownership is an operating model where customer service/support teams are empowered to own issues from first report to close. Agents have real-time visibility, context, and the direct ability to mobilize the right technical and operational teams to solve customer issues — all while proactively communicating with customers. The benefits of full-case ownership extend throughout the business by: - Giving service agents a direct line to management and engineering to ensure cases nearing / breaching SLAs (service level agreements) are escalated for attention and resolved - Giving engineers a direct line to customer service to gather more information and deliver the right customer response - Empowering agents to resolve cases end-to-end with direct lines of escalation to the teams who can actually help you fix the problem Without full-case ownership, customer service agents are unable to control their own destiny. Agents accountable to metrics like time to resolution (TTR) and customer satisfaction (CSAT) should be empowered to actually resolve cases and tickets end-to-end. --- URL: https://docs.pagerduty.com/ops-guides/customer-service-ops/metrics # Metrics Organizations that have gone through a digital transformation — or have embraced a technical operating model such as DevOps — have likely already worked  Organizations that have gone through a digital transformation — or have embraced a technical operating model such as DevOps — have likely already worked through realigning goals and incentives across many technical teams. This includes customer service teams and their goals, along with the goals of product teams, and opens the door to accelerate feedback and improvements for products and services. Technical teams that operate with customer-focused goals will find customer service teams invaluable for their access to customers and customer feedback. Customer service (and traditional operations) teams might find themselves at odds with the goals of application development teams. Lack of awareness, knowledge, and empowerment are the main things that contribute to teams feeling a disconnect. Change is often the cause of incidents and outages, leading to negative customer interactions. But change is also necessary for new features, bug fixes, and new customer experiences. Your teams should be working in sync to ensure there is awareness of changes and improvements and how those are improving the overall customer experience and satisfaction of your products. 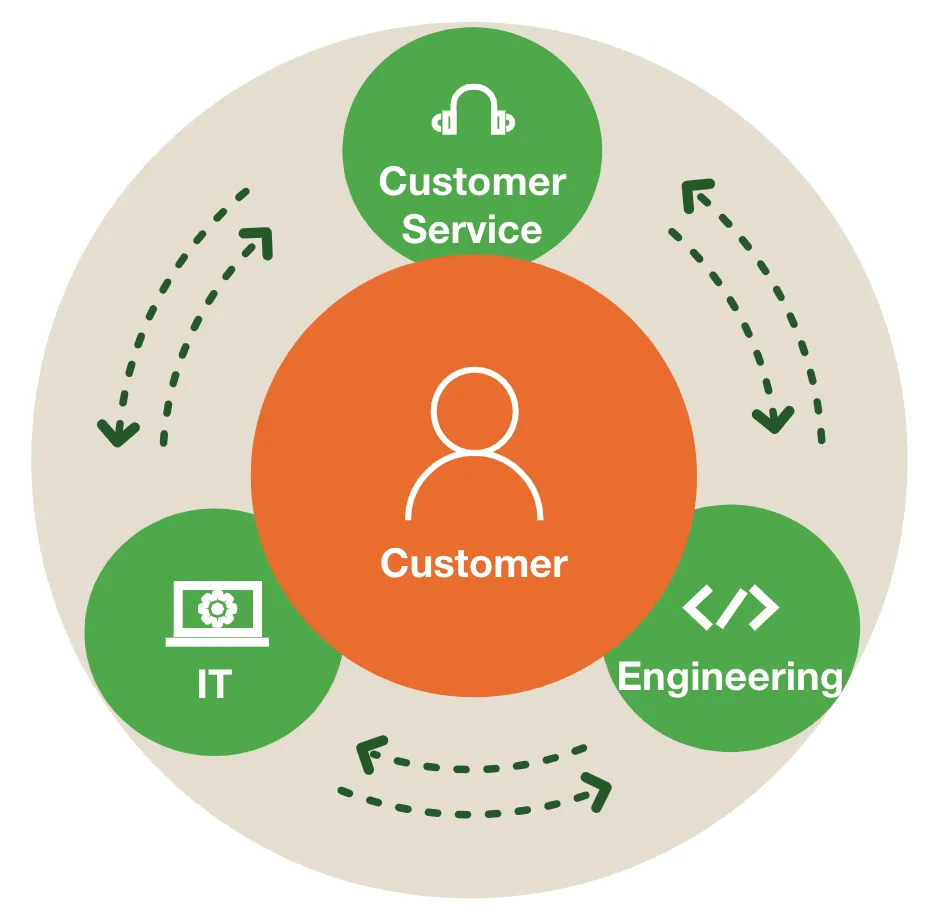 ## CSAT, NPS, and FCR Customer service plays a key role in improving customer satisfaction (CSAT). You may already be managing customer service functions via a CSAT survey after customers contact your customer service team. Giving your customer service teams more ways to be proactive around incidents can improve customer satisfaction. > **Tip:** Reach out proactively to VIP customers during incidents and escalate key accounts during triage. How your organization handles incidents can impact brand loyalty — both positively when things are handled well and negatively when things are handled poorly. Your team might be measuring this impact via the Net Promoter Score, or NPS. NPS differs from CSAT in that it is really asking your customers how likely they are to recommend your product or service to someone else. Providing good customer service and proactive communications during incidents makes a positive recommendation more likely. Customer service teams that are only incentivized to close tickets as fast as possible are less likely to measurably contribute to improvements in your organization’s overall goals. The feedback loop required for a mature software development life cycle needs the customer service team to operate effectively. Full-case ownership directly leads to higher CSAT scores by increasing First Contact Resolution (FCR). Customers don’t want multiple interactions, the expectation is increasingly becoming single call resolution. When agents have more visibility and context into whether backend systems are impacted, they are able to communicate with customers about the existing incident and the progress being made towards resolution — without the customer having to call back in or get escalated to the next tier. ## MTTA and MTTR Everyone in your organization should be incentivized to minimize the impact of incidents and outages across the digital product space. Teams working to improve their incident response capabilities often include two metrics: mean time to acknowledge (MTTA) and mean time to resolve (MTTR) in their goals. Reducing these two numbers means shortening the time it takes to recognize an incident and the time it takes to fully resolve the incident. Because these two measures can be somewhat blunt instruments, your teams may also consider looking at MTTA and MTTR based on the incident severity. This allows your teams to prioritize improving response times for the highest severity incidents first, having the greatest impact on overall customer experience. > Customer Success, Support, and Engineering have different metrics and that is the problem... so you never end up driving the customer experience...but what you really need is each team to be integrally measured on shared customer outward facing metrics vs. customer inward facing metrics, focused on delivering the right customer experience and customer outcomes.
-- Manjula Talreja, Chief Customer Officer, PagerDuty --- URL: https://docs.pagerduty.com/ops-guides/customer-service-ops/next-steps # Next Steps Improve customer experiences and increase internal team collaboration by integrating your customer service tools with the PagerDuty tools your engineering  ## Integrating Zendesk and PagerDuty Improve customer experiences and increase internal team collaboration by integrating your customer service tools with the PagerDuty tools your engineering teams are already using to monitor and respond to incidents on your platforms. Providing your customer service teams with powerful integrations from within their own apps gives them a powerful tool without leaving their workspace to find the right services or teams to alert when a customer reports an issue. PagerDuty for Zendesk facilitates cross-team communication between ITOps, DevOps, and your customer service teams. Communication silos are broken down, allowing you to mobilize the right resources across teams, in real time, every time. Find the full documentation to set up this integration in our [knowledge base](/integrations/zendesk-integration-guide) Once PagerDuty and Zendesk are linked, Zendesk users can interact with PagerDuty incidents, including creating, acknowledging, and resolving the incidents. Customer service team members can also add notes, such as additional customer data, or send a status update to internal users that might be subscribed to the incident. Zendesk users can also [trigger PagerDuty incidents from within Zendesk leveraging our new incident command console (pictured below) ](/integrations/zendesk-integration-guide#automatically-trigger-pagerduty-incidents-from-zendesk) as well. When creating a new service in PagerDuty, integrate the service with Zendesk. That service will then receive information via Zendesk Triggers. 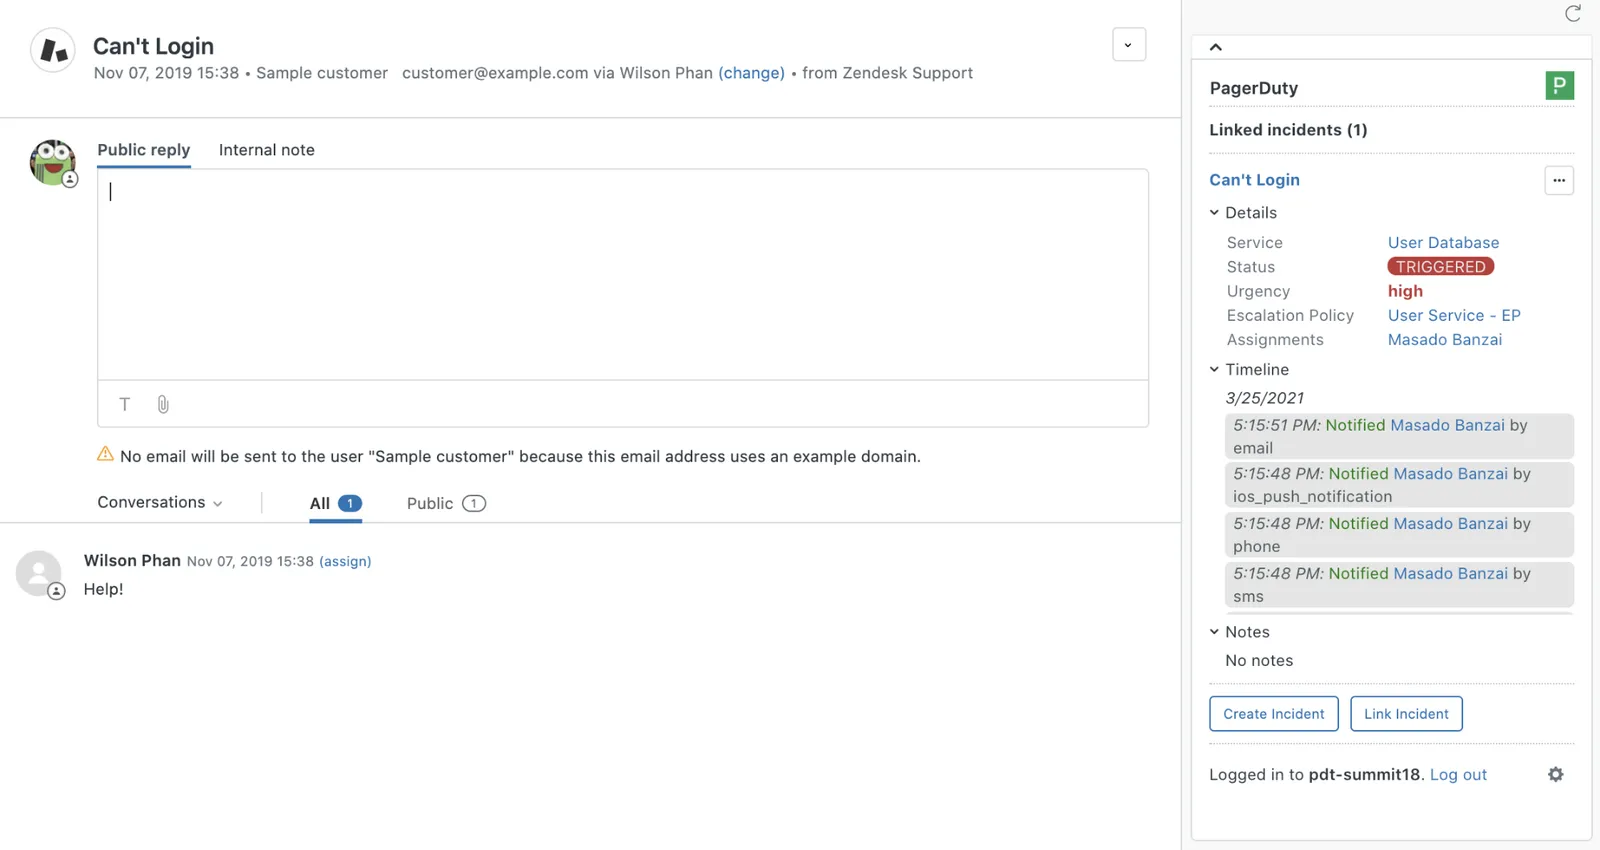 Our recent release of our integration with Zendesk includes a status dashboard and console to instantly make agents and key stakeholders aware of critical outages and issues impacting customers, while giving them the power to drive action immediately (pictured below). 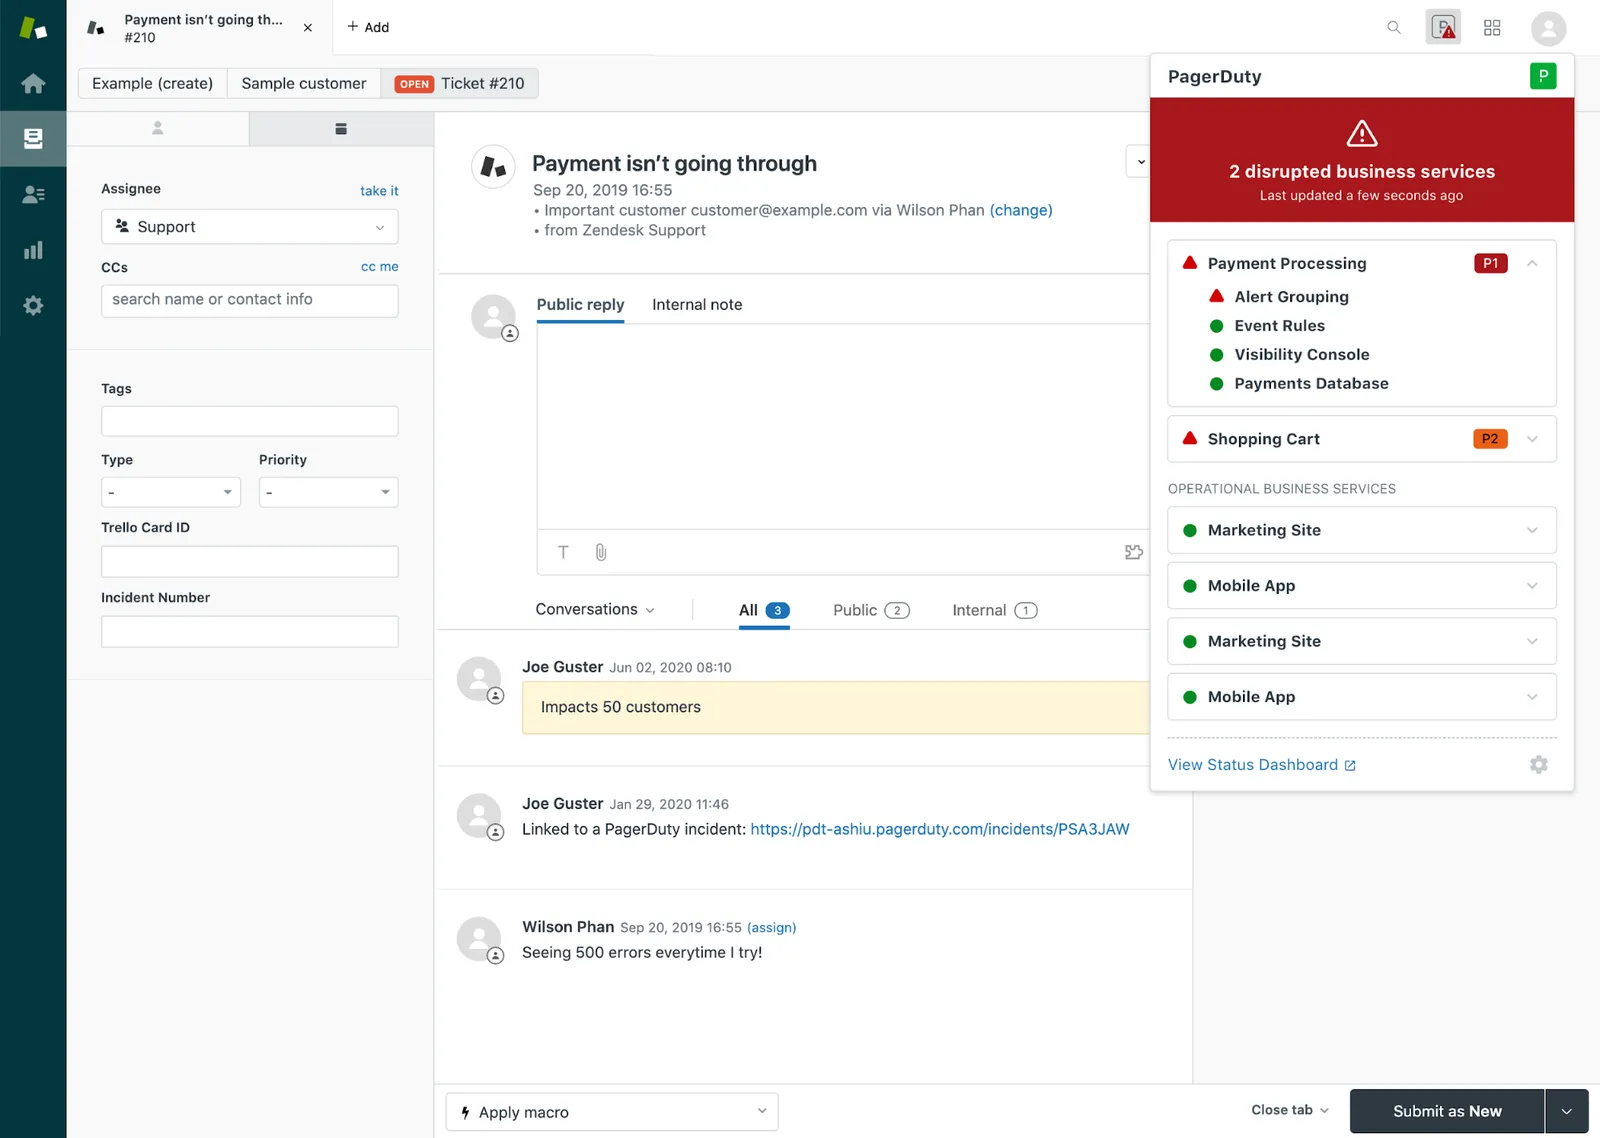 Integrated services are also able to [create tickets in Zendesk via the PagerDuty platform](/integrations/zendesk-integration-guide#create-a-zendesk-ticket-from-a-pagerduty-incident). ## Integrating Salesforce and PagerDuty With PagerDuty for Customer Service + Salesforce, organizations will have the context needed to deliver accurate solutions. This includes mobilizing the right teams and technical responders with customer service representatives to resolve issues quickly, and keep customers updated with the latest information. By implementing PagerDuty for Customer Service + Salesforce, technical responders can empower customer support teams to deliver amazing service around the clock to truly help customers by: - Improving ticket resolution times through grouping related tickets and automating alert routing - Enabling any customer support team member to reach on-call staff in real time with Live Call Routing - Providing ongoing incident resolution updates to build trust with customers  Once a Salesforce Cloud object is connected to your PagerDuty instance, new record creations and updates on that object are evaluated against rules that you predefine. If the rule criteria is met, PagerDuty will perform actions specified by those predefined rules. PagerDuty can also send information to Salesforce Cloud, where you can define the evaluation criteria against the updates made in PagerDuty and select an action to be performed in Salesforce Cloud. Find the full documentation to set up this integration in our [knowledge base](/integrations/salesforce-service-cloud-integration-guide). --- URL: https://docs.pagerduty.com/ops-guides/devsecops # DevSecOps This guide is written primarily for individual contributors who are not currently security engineers, but are interested in learning ways to improve how they  ## Who is This For? This guide is written primarily for individual contributors who are not currently security engineers, but are interested in learning ways to improve how they implement security practices in their code and how they interact with their security teams and/or consultants. The focus of this guide is to define DevSecOps and dive into ways to support it within an organization. ## What is Covered? ### Introduction - [What is DevSecOps, its benefits, and how to implement](/ops-guides/devsecops/introduction) - [Security Terminology](/ops-guides/devsecops/security-terminology) ### Cultural Changes #### Building Empathy & Team Interactions - [Walk A Mile: Shadowing](/ops-guides/devsecops/building-empathy#walk-a-mile-shadowing) - [Full-Service Ownership](/ops-guides/devsecops/building-empathy#full-service-ownership) - [Security Champions Program](/ops-guides/devsecops/building-empathy#security-champions-program) - [Meet Needs to Gain Momentum](/ops-guides/devsecops/building-empathy#meet-needs-to-gain-momentum) - [Team Interactions](/ops-guides/devsecops/team-interactions) ### Implementation #### Shift Left - [Identify Your Needs With a Security Assessment](/ops-guides/devsecops/shift-security-left#identify-your-needs-with-a-security-assessment) - [Assessment Frameworks](/ops-guides/devsecops/shift-security-left#assessment-frameworks) #### Training and Education - [Threat Modeling Exercises](/ops-guides/devsecops/training-and-education#threat-modeling-exercises) - [Capture the Flag Games](/ops-guides/devsecops/training-and-education#capture-the-flag-games) - [Establish Trust: Don't Do Gotchas](/ops-guides/devsecops/training-and-education#establish-trust-dont-do-gotchas) - [Socially Engineer Security Trainings](/ops-guides/devsecops/training-and-education#socially-engineer-security-trainings) ### Additional Information - [Secure Software Development Life Cycle](/ops-guides/devsecops/secure-sdlc) - [Resources and References](/ops-guides/devsecops/resources) ## License This documentation is provided under the Apache License 2.0. In plain English, that means you can use and modify this documentation and use it both commercially and for private use. However, you must include any original copyright notices and the original LICENSE file. Whether you are a PagerDuty customer or not, we want you to have the ability to use this documentation internally at your own company. You can view the source code for all of [this documentation](https://github.com/PagerDuty/devsecops-docs) on our [GitHub account](https://github.com/PagerDuty/). Feel free to fork the repository and use it as a base for your own internal documentation. --- URL: https://docs.pagerduty.com/ops-guides/devsecops/building-empathy # Building Empathy It’s hard to develop empathy for another person, team, or discipline when you haven’t “walked a mile in their shoes.” Unfortunately, this is quite common for  It’s hard to develop empathy for another person, team, or discipline when you haven’t “walked a mile in their shoes.” Unfortunately, this is quite common for developers, operations specialists, and security specialists—how many former security professionals are working in development or vice versa, for example? To compound the issue, when empathy isn’t present, people have a difficult time understanding each other, which can create a lot of friction in professional relationships. At the beginning of the DevOps transformation, there was a lot of friction that existed between the developer and operations teams that impeded their work, which compounded the delays caused by siloed workstreams. Much later, streamlined workflows and common understanding has greatly improved their working relationships; however, security teams have frequently been left out of the DevOps transformation. As a result, these relationships haven’t flourished as much as they could. DevSecOps is a new iteration of a familiar initiative, this time including security in the SDLC as opposed to finding themselves inundated with requests after all the code is written and likely needing to be changed. This initiative will also help developers and operators as well—just like DevOps required developers to be op-aware and operators to be dev-aware, DevSecOps requires all three groups to be aware of each other’s interdependencies and needs. The foundation of this transformation is all the people involved. To that end, when you are looking to shift to a DevSecOps culture, you’ll need to look to the people first and the processes that support them second. As such, this guide starts by covering how to support developers, operators, and security professionals working together in a way they have not before—by building relationships, empathy, and trust. Then, we will proceed to discuss the beginning knowledge for how to shift security left within the SDLC. ## Walk A Mile: Shadowing At PagerDuty, [we shadow extensively](https://thenewstack.io/on-call-heres-how-to-stay-healthy-while-carrying-the-pager/) for training purposes. In the context of DevSecOps, having each of the teams shadow with each other will similarly allow them to develop both empathy and understanding for what the workflow is like for the other teams. For security, shadowing can mean sitting in with the development and/or operations team for a sprint. This could happen on a rotation—so for every sprint, one person from the security team would sit in with development or operations. Make sure to configure this on a rotation that makes sense for both teams. In the event of an incident, the shadowee should continue to shadow for as long as it makes sense, as there is a lot to be learned when a team is in “crisis mode.” That being said, if the incident evolves in such a way that the shadowee’s subject matter expertise is needed, then they should resume that role. Similarly, developers and operations specialists can shadow security to learn more about their workflow. The important caveat here is that, typically, security team members have more access globally than most other teams, so it’s important when shadowing to ensure that the shadowee is not granted increased access or permissions unless it is appropriate. ## Full-Service Ownership Here at PagerDuty, we talk a lot about [Full-Service Ownership](/ops-guides/service-ownership) (FSO), and relatedly another way that security teams can learn about the production process to actually own a Tier 1 or 2 (critical) service that makes business sense. For example, if your business or organization uses a tool to manage secrets, tokens, etc., it might make sense for the security team to own that service. Under the FSO model, the security team would own the revision, upgrade/update, and release cycle for that service, as well as the on-call rotation for that service. Similarly, having a dev or ops team own a security service or process that will provide insight into how security works as well as have the team responsible for some of the same end goals as the security team. It is important to choose services in either scenario that is both feasible and makes good business sense. For example, development and/or operations should not own a service that would require an escalation in their privileges and security should not own a service that requires support that is outside of their expertise. Luckily, most architectures require multiple services so in these cases another, more prudent, service can and should be chosen. When choosing a service, make sure to avoid partial or shared service ownership as this can cause confusion or create gaps in process. For example, if Service A is owned by Teams 1 & 2, how are upgrades performed? Is approval needed from both? What happens if an update has a feature needed by one team, but has backwards breaking changes for the other? If both teams own the service, then it will be difficult to have a consensus. As a last example, which team is responsible for handling incidents and issues related to the service? If only one team is required for any of these tasks, then the other team may be caught off guard or resent not being included in the discussion and/or decision. When there is one owner, then while they still need to consider the needs of everyone using the service, there is still one team that needs to make the final decisions as well as handle issues. ## Security Champions Program Bottlenecks frequently cause friction between the development, operations, and security teams. In order to improve cross-team communication, these teams need a regularly scheduled time to discuss important issues and updates with each other. A Security Champions Program does just that. The program would be facilitated by members of the security team, but participants would come from development, operations, and any other teams that make sense. The meeting will allow the various participants to update each other about different messaging, changes, updates, and other topics that they want brought back to each department. Similar to other programs or resource groups that you might run in your company, you will need buy-in from different stakeholders to set the program up for success. In this case, you’ll be looking at not only the agreement for a few key people in various departments who will hopefully attend the meetings, but also executives and management. You’ll also need a good understanding of the security culture at your organization to facilitate the meetings, even if you are not a security specialist. For who should attend the meeting, start with your knowledge of your current culture. Use this to define what and who should be in the initial meetings to gain traction as well as show value to other people and teams that you’d like to include. In the meeting, you’ll want to make sure that there is adequate time for everyone to give the updates they need to give, ask the questions of each other that they need to ask. This can initially start with development, operations, and security but should eventually extend beyond these groups. For example, someone who works with customers directly would benefit from being able to handle some starter security questions before deferring to an expert on the security team itself. ## Meet Needs to Gain Momentum Depending on the existing company structure and culture, it is possible that security is viewed as a “necessary hindrance”. This could be for a variety of reasons, but some are at least partly due to the issues you’re here to solve: breaking down silos that can cause slowness and breakdowns in communication. Of course, the reality is that security, like development and operations, is an incredibly interesting and complex field that protects customers and users as well as gaining and maintaining their trust. If this is where you’re starting from, never fear! The first step here is to start to reverse this mindset. To begin: identify both the stakeholders and the teams that you’ll be working with the most. Start having meetings with people in these groups and look to identify their needs. The needs may not, at first, be immediately relevant to security but still overlap with your security team’s expertise. Have them work on the issues that are being raised by the other stakeholders and teams. This will start to build the human connections between the humans of security, operations, and development. While this work is ongoing, the security team can start to seed some better practices as they move forward. The idea here is to add value, especially where there are gaps. There is also an opportunity to “make it easy to do the right thing”. For example, if security is helping improve workflows while also making them more secure. The team that is implementing that change should see the benefit to themselves, but the new security layer(s) in the workflow should not add complexity. Building up these use cases, the team should be able to align their work with some combination of the company’s mission statement, goals, and/or KPIs. The caveat to this is to use good judgement: the security team can and should be empowered to take action with any current security incidents or any high risk vulnerabilities that need to be urgently addressed. --- URL: https://docs.pagerduty.com/ops-guides/devsecops/introduction # Introduction Simply put, DevSecOps is parallel to the changes that happened to development and operations as part of the DevOps transformation. In other words, the goal of  ## What is DevSecOps? Simply put, DevSecOps is parallel to the changes that happened to development and operations as part of the DevOps transformation. In other words, the goal of DevSecOps is to break down the security silo—similar to how DevOps breaks down the silos between development and operations. In a lot of organizations today, security is positioned at the “end of the line.” Products, features, and fixes are written, tested, built, tested again, and when they are ready for release, they are vaulted over the wall to security. At this point, any changes that security finds are expensive to make, largely due to all of the development time already invested. It’s also usually the case that the communications were not efficient while the issue was remedied. In this scenario, the security team needs to vault the situation(s) back over the wall to development and operations to resolve, and back and forth until whatever issue(s) are remedied and can then be released to production. At this juncture, DevSecOps and DevOps should feel very familiar. Just like DevOps, DevSecOps requires weaving together the seemingly disparate teams and workflows. Since there are security implications at every stage of the software development life cycle, or SDLC, (unlike DevOps, which was able to stitch two groups together), DevSecOps requires developer and operations to become more security aware. And in turn, security becomes more aware of the implications of releasing software in production. ## Benefits Implementing DevSecOps enables you to immediately see a reduction in security vulnerabilities found at the end of the SDLC as security is integrated more and earlier. Other improvements include: * Fewer security vulnerabilities that make it to production * Fewer security incidents * Less time resolving security incidents * Reduced human error as security checks and tests are included in build pipelines * Increased user trust * Builds empathy between teams and breaks down cross-team, adversarial relationships ## How to get there? There are two large pillars that support DevSecOps: 1) the cultural changes and 2) the supporting technical changes. The cultural changes that are covered in this guide are centered around improving cross-team communication, collaboration, awareness, and empathy. More specifically, there are activities that each of the development, operations, and security teams can do that will allow them to experience “a day in the life” and beyond for the other disciplines. The technical changes that support a DevSecOps culture involve integrating security in every aspect of the SDLC, a process called “shifting security left”. The purpose of this guide will not be prescriptive for how to shift left, but rather to provide the information necessary for development, operations, and security to meet their current challenges and build a path forward that best suits the current state and desired end state. --- URL: https://docs.pagerduty.com/ops-guides/devsecops/resources # Resources and References The goal of all of these exercises is to help development, operations, and security better understand how each group contributes to a secure SDLC. On the  The goal of all of these exercises is to help development, operations, and security better understand how each group contributes to a secure SDLC. On the development and operations side, doing exercises like Threat Modeling and Capture the Flag as mentioned previously, help them develop a better understanding of how to weave security into their processes. Similarly on the security side, exercises like owning a service through production and shadowing helps them understand why development and operations structure their workflows the way they do. As a reminder, make sure you have a firm understanding of where your gaps are so that as you begin to shift left you are doing so in a way that meets existing needs. As you continue your journey in security, there are several common resources that are used in the industry and went into the creation of this guide. ## External contributors * Patrick Debois, Director of Market Strategy, Snyk ([Twitter](https://twitter.com/patrickdebois)) * Brad Lhotsky, System and Security Administrator, craigslist ([Twitter](https://twitter.com/reyjrar)) ## Resources to Keep Handy * Websites * [OWASP](https://owasp.org/) * [NIST](https://www.nist.gov/) * [CVE database](https://cve.mitre.org/) (Common Vulnerabilities and Exposures by Mitre) * [CWE database](https://cwe.mitre.org/) (Common Weakness Enumeration by Mitre) * [NVD](https://nvd.nist.gov/) (National Vulnerability Database by NIST) * Books * [Alice and Bob Learn Application Security](https://www.wiley.com/en-us/Alice+and+Bob+Learn+Application+Security-p-9781119687405) by Tanya Janca * [Defensive Security Handbook](https://www.oreilly.com/library/view/defensive-security-handbook/9781491960370/) by Lee Brotherston, Amanda Berlin * [Tribe of Hackers Blue Team: Tribal Knowledge from the Best in Defensive Cybersecurity](https://www.wiley.com/en-us/Tribe+of+Hackers+Blue+Team%3A+Tribal+Knowledge+from+the+Best+in+Defensive+Cybersecurity-p-9781119643425) by Marcus J. Carey, Jennifer Jin ## How to Contribute to this Guide Contributors are always welcome to help us keep the guide complete and correct. Also, in order to expand the content of the guide, topics related to the following have been slated to be added over time. If you would like to contribute to these topics, make suggestions, correct any errors, etc. please feel free to reach out by submitting a pull request or issue on GitHub (repository link [here](https://github.com/PagerDuty/devsecops-docs) as well as the upper left). You can also reach out to us on our [Community Forums](https://community.pagerduty.com/). Some top level topics that we are looking at: * Compliance: Outlining what it is and isn’t and how it relates to DevSecOps * Organizational design: Within the DevSecOps context * Incentivization: How to align incentives between development, operations, and security so they are complementary and not oppositional * New Resources: Please feel free to submit common resources for people to grow their knowledge in security and DevSecOps. Intended audience is the same as the guide, technologists outside of security looking to be security aware. For these, we do not favor any particular vendor, rather we are looking for common introductory material (e.g. Alice and Bob) and/or frequently referenced material (e.g. OWASP). --- URL: https://docs.pagerduty.com/ops-guides/devsecops/secure-sdlc # Secure SDLC To help you in your security journey, there are several tests and other actions that can be performed at different stages of the software lifecycle. For an  To help you in your security journey, there are several tests and other actions that can be performed at different stages of the software lifecycle. For an idea of how and when certain tests and actions are performed, take a look at the following secure SDLC:  Figure from [Six Pillars of DevSecOps: Automation](https://cloudsecurityalliance.org/artifacts/devsecops-automation/) by the Cloud Security Alliance Threat modeling and security assessments were covered in the [Shift Left](/ops-guides/devsecops/shift-security-left) section of this guide, but what about the rest? For the breakdown, you’ll see each action is preceded by a trigger. For example, the static testing is not done at any point in the secure coding phase, but specifically should be done whenever there are changes to the codebase. As for the actions themselves, here’s a quick overview separated by stage. (For tests that are repeated in more than one stage, they are listed under the first stage they appear.) ## Secure Coding * **Static Application Security Testing (SAST)** * SAST, also referred to as Static Code Analysis, does not require a compiled application to run - so it can, and should, be run early in the SDLC. The test reveals vulnerabilities in the code, specifically those in the OWASP Top 10 like SQL injection. * **Software Composition Analysis (SCA)** * A software composition analysis scans software, as well as its dependencies, and displays a list of known vulnerabilities as well as licenses and noting any deprecated dependencies. * **Secure Code Review** * “A secure code review is a specialized task involving manual and/or automated review of an application's source code in an attempt to identify security-related weaknesses (flaws) in the code. It does not attempt to identify every issue in the code, but instead looks to provide insight into what types of security-related problems exist and help the application developer understand what classes of issues are present.” ([Mitre](https://www.mitre.org/publications/systems-engineering-guide/enterprise-engineering/systems-engineering-for-mission-assurance/secure-code-review)) ## Continuous Build, Integration, and Testing * **Container and Image Scan** * Checks the build process of your containers and images for vulnerabilities. This should be done to establish trust with the base image or container, as well as any composites. * **Dynamic Application Security Testing (DAST)** * DAST is for compiled code / a running application without knowledge of the environment, simulating a hacker. Since the code is running for the test, this test is good for identifying issues with the runtime environment as well. Note that DASTs are only run on web applications and services. * **Fuzzing** * Testing with unexpected inputs. This can be something like testing if a non-date is entered in a date field, or even (trying to) drop a binary file in a text field. The goal is to capture these cases and ensure that the application does not crash and gives a usable error message. * **Interactive Application Security Testing (IAST)** * An IAST tests the running application for vulnerabilities during use, similar to a DAST. Unlike a DAST, an IAST can identify the line of code that is the source of a particular vulnerability. ## Continuous Delivery and Deployment * **Sign** * Verifies both the signature of the code and that the code has not been tampered with. This can be done for local and/or remote signatures and uses a cryptographic hash. * **Artifacts and Image Repository Scan** * An artifact scan scans all the artifacts that were created during development for vulnerabilities, and an image repository scan scans images when they are pushed to a repository. Any images that fail the scan are not uploaded. * **Systems, Containers, and Network Vulnerability Scan** * Scans for known vulnerabilities in the systems, containers, and networks. ## Runtime Defense and Monitoring * **Systems, Containers, and Network Vulnerability Monitoring** * Monitoring systems, containers, and networks for known vulnerabilities with observability tools. * **Runtime Application Self-Protection (RASP)** * Briefly, RASP works by adding sensors into the code so that execution points to watch for exploits happening in real time. * **Penetration Testing** * Penetration testing, frequently referred to as pen testing, is a simulated attack to test for vulnerabilities. This type of testing can be done either [black box or white box](/terminology/#white-box-vs-black-box) and can be done on the applications, services, systems, networks, etc. --- URL: https://docs.pagerduty.com/ops-guides/devsecops/security-terminology # Security Terminology As you start your DevSecOps journey, it’s important to use common language and share common concepts with your security team. To help you get started, here are  As you start your DevSecOps journey, it’s important to use common language and share common concepts with your security team. To help you get started, here are some industry terms and concepts, some of which you’ll need in the guide directly, but all of which you’ll need as you broaden your knowledge. ## OWASP and NIST **OWASP** (Open Web Application Security Project) and **NIST** (National Institute for Standards and Technology, US Based) are two heavily used resources for security tools, resources, and research. ## Security posture An organization's **security posture** is the overall security status across your technical organization, including software, networking, data, vendor risk, dependency security, vulnerability management, and more. Knowing your security posture is vital to understanding how at risk you are to various types of security threats, such as data breaches, and will allow you to know what to remediate and with what urgency. ## Attack Vector and Attack Surface An **attack vector** is any method that an intruder can use to gain access to your systems and information. For example, if/when a key is committed to GitHub, if someone else used that key to access the service, that exposed credential would be considered an attack vector. The **attack surface** is all of the attack vectors. For example, the exposed credential, any unencrypted data, and so forth, would be your organization’s attack surface. ## Perimeter A **perimeter** is the barrier that prevents access, similar to what you would see with physical security where natural or built walls, etc., prevent access. In this case, the walls would be what separates public and private networks, firewalls, access controls, and so forth. ## Security Breach A **security breach** is whenever someone gains unauthorized access of any kind, including network or application access. ## Data Breach A **data breach** is any release of confidential information to public sources. Common examples are credit card numbers, government ID numbers, addresses, and other identifying information. The release may be unintentional or intentional. Note the difference between a security breach and a data breach: the security breach is the gaining of access (“breaking in”) and the data breach is taking information out from where it was secured (the “theft”, also referred to as **exfiltration**). ## Exploit An **exploit** is code that takes advantage of a vulnerability. ## Trust Establishing **trust** is the verification that a resource or user is who is claimed. An example of a trusted resource might be verifying that the application patch or update is from an intended source, or that the user who is attempting to access data is associated with the intended person or entity. ## Zero Trust Although there are other models, in recent years **zero trust** is a model for security that has become an industry standard. In fact, we practice it here at PagerDuty. Concisely, zero trust is a model for continuous authorization. It does not assume that, because a user is able to access certain data or devices, that that user should be there, so users are always prompted for their credentials for access. As an example, in a zero trust environment, the network a user is coming from does not grant assumed access, e.g. if the user is connecting via a company VPN—all access requests still need to be authenticated. ## Threat Actor **Threat actors** are the types of individuals or groups that you anticipate are most likely to try to breach your security measures. For example, you might find that you are most likely to be hit by scripts that are not targeting you directly, but instead are targeting a service that you are using or region you are in. ## Risk Management **Risk management** is the ongoing process of identifying what security risks you have in your organization and how to prevent, mitigate, and resolve them. It starts by identifying the risk associated with various assets, such as personal information, and determining both how likely they are to be the focus of an attack and what the impact of an attack would be if it were to happen. ## White Hat vs Black Hat Usually in reference to hacking, a **white hat** hacker is a person who hacks or tests the security of a system with the owner’s permission and informs the owner of all vulnerabilities found. Conversely, a **black hat** hacker is someone who tests the security of a system, usually with the intent to breach it, without the owner’s permission and does not inform them of vulnerabilities found. As an example, a white hat hacker or group might be a security consultancy brought in to run a pen test, whereas a black hat hacker might be trying to steal customer credit card information. As a quick note, you may also come across the term **grey hat**, which is someone who breaches security but without the malicious intent of a black hat attacker. ## White Box vs Black Box **Black box** is when a system is known only by its behavior, basically its inputs and outputs, without knowing anything about how it is built (e.g. AWS vs GCP). On the other hand, **white box** is when you know the architecture of a system. These terms are usually used in reference to testing, where black box testing is when you test an unknown system and white box testing is testing a known system. ## Red Team, Blue Team, Purple Team Similar to white hat hackers, **red teams** specialize in breaching security, with permission. Red team exercises are usually done by security teams to simulate what an external attacker is likely to do in order to obtain whatever they are targeting, e.g. secure data. On the opposite side is the **blue team**, which specializes in defensive security. Blue team exercises can be the defensive response to red team exercises, but they can also be other things like audits. When red teams and blue teams coordinate, it’s called **purple teaming**. --- URL: https://docs.pagerduty.com/ops-guides/devsecops/shift-security-left # Shift Security Left Simply put: shifting security left means integrating security earlier in the SDLC. This is a different approach to how security is currently implemented, where  Simply put: shifting security left means integrating security earlier in the SDLC. This is a different approach to how security is currently implemented, where their team is mostly reacting to a current incident, or being consulted as a last-step before something is released to production. Looking at the latter case first for a moment, that means that any insecure code that was designed and implemented has made it through the entire lifecycle before being reviewed. If security finds an issue, that means changes are likely to go back around the full cycle again before going live in production. When security issues are found they require not only modifications to the codebase, but also other changes elsewhere in the life cycle (e.g. updating tests, monitoring, etc.). Shifting security left allows teams to address security issues much earlier in the life cycle, rather than finding out after significant labor has already taken place. Shifting security left is a series of tasks—it is not meant to be something that you implement quickly. Just like all other changes in IT, the best way to proceed is with small changes, reviews, and iterations. You will need to start with a security assessment, perform organizational training and exercises to improve your security posture. For reference, there is also a list of security actions and tests at different phases (or stages) in the SDLC at the end of the section. ## Identify Your Needs With a Security Assessment Before you can begin shifting left, you need to know your current status. You might think of this as the “security health” of your org, and the industry term for this is your “security posture.” Specifically, security posture is defined as: * Security posture refers to an organization's overall cybersecurity strength and how well it can predict, prevent and respond to ever-changing cyberthreats. ([Source](https://searchsecurity.techtarget.com/definition/security-posture)) Why look at your security posture? The main goal is to provide some context for how you should proceed when you shift left. Should you move slowly from right to left across the SDLC, implementing tests and procedures as you go? Should you fix forward and choose a project that starts with security considerations from the design phase? Or should you choose an approach that is a hybrid of the above options? The answer is that it depends and can vary widely. The best way forward is to “meet yourself where you’re at.” The security assessment will provide information that you can use to determine your next steps. Specifically, the security assessment should inform you of any current security risks and their criticality. Some questions the assessment will need to address: * Have there been any security incidents? * What are your current risks? * How critical are they? Once you have this information, the first questions you should discuss with your security team are: * Which security incidents that are at risk of repeating can be resolved with changes to security procedures? * What critical risks can be mitigated or resolved by changing security procedures? Resolving current or likely security incidents should be the first priority as you shift left. After these are addressed, you’ll want to start focusing on ways that you can build momentum and show the value by choosing those courses of action that will be “high value, low lift.” Translated into something more actionable, this means the development, operations, and security teams will need to work together to find which changes in security procedure have a high impact by influencing multiple factors—while minimizing how much customization is required. As you build momentum and the benefit of shifting left is more tangible, you can iterate more changes to improve your overall security posture. ## Assessment Frameworks How to decide which assessment(s) to run, and executing them, is under the purview of your security team. That said, there are some frameworks that you can take a look at to have a better understanding of what goes into assessments in general to know what roughly to expect. These frameworks can also help establish a starting point for your own assessments, rather than your team customizing one from scratch. Some common frameworks include: * [DSOMM](https://owasp.org/www-project-devsecops-maturity-model/) (OWASP’s DevSecOps Maturity Model) * [BSIMM](https://www.bsimm.com/) (Building Security In Maturity Model) * [SAMM](https://owasp.org/www-project-samm/) (OWASP’s Software Assurance Maturity Model) * [NIST’s Infrastructure Security Framework](https://nvlpubs.nist.gov/nistpubs/CSWP/NIST.CSWP.04162018.pdf) If your company is part of a regulated industry, you’ll also want to verify if there are frameworks available that tailor to that industry. For example, Qualys is an approved vendor for PCI compliance and offers a web vulnerability scanner to help organizations become compliant. --- URL: https://docs.pagerduty.com/ops-guides/devsecops/team-interactions # Team Interactions Team interactions rely on common communication tools and techniques. In general, development, operations, and security teams should use as many common tools as  Team interactions rely on common communication tools and techniques. In general, development, operations, and security teams should use as many common tools as possible. This will help each team streamline communication with each other as well as keep all the various teams’ activities transparent to each other. Explicitly, as a minimum, make sure that the teams are using the same email, chat, and ticketing systems. Beyond tooling, there are a few standards of practice that the teams can implement that will improve not only communication but awareness of the different needs and expectations of each team. 1. **Meetings** * Have regular meetings between the teams, such as regular standups. Depending on the size of the teams, this might be everyone in one meeting or representatives from each of the teams in a separate meeting, bringing back what they learn to their respective teams. 1. **Rules for Tools** * Set expectations for how the different teams prefer to communicate and with what level of urgency. Again, it is best to keep these as similar between the teams as possible. This might be something like chat for when a quick response is needed, or email for a slower, less-urgent response. 1. **Rules of Engagement** * Including and beyond tools, there should also be a “Rules of Engagement.” This will help guide other situations including, but not limited to: when to have meetings, whether cameras are on or off, if and when people should mute, how to determine who the next speaker is, and so on. We have a template available for Rules of Engagement here to help you get started. **[Here is one of the templates we use at PagerDuty](https://docs.google.com/presentation/d/1N4mAtI9Yaw1ZX0AkkyStJ41HwDgj__Kg3tQQgMHo1SA/edit?usp=sharing)**. 1. **Documentation** * Documentation can help avoid a lot of communication breakdowns. Remember, most developers and operations specialists have not worked in security and vice versa. Since each group cannot necessarily intuit what the appropriate level of context to provide when sending requests back and forth, it is important for each group to document what they need with extra granularity for the most common requests to function as a template. This will provide all groups with a reference to send information to each other and prevent things from being forgotten, which can lead to mutual frustration. To get started with this, document the request flow for each request as it arises and each iteration as the process improves. 1. **Review and Iterate** * As you build new processes and procedures, always verify that they are working as intended and make changes as needed. This includes meetings, structures, documents, and so forth. This should be done at a frequency that makes sense—for example, if you’re reviewing a daily standup, you might want to review weekly; however, if you’re reviewing a bi-weekly sprint, you might want to do a quick process review at the end of each meeting. Even with the most robust communication process, there will still be communication breakdowns. This can be in either direction, typically either due to malformed or misrouted requests, and can be inflamed if there is a short deadline or active incident that needs to be resolved. When these situations happen, it’s best to try and resolve quickly, amicably, and without judgement. For more details around this communications approach, take a look at the [4-Part Nonviolent Communication Process](https://www.nonviolentcommunication.com/pdf_files/4part_nvc_process.pdf), which templates how to ask questions in a non-judgemental way. --- URL: https://docs.pagerduty.com/ops-guides/devsecops/training-and-education # Training and Education This is similar to the exercises that developers and operators do for production, such as running chaos experiments (at PagerDuty we’ve been doing Failure  ## Threat Modeling Exercises This is similar to the exercises that developers and operators do for production, such as running chaos experiments (at PagerDuty we’ve been doing [Failure Fridays](https://www.youtube.com/watch?v=rRIYkud4Im0) for [years](https://www.youtube.com/watch?v=XKl-7hB3paY). These exercises allow teams of both disciplines to really understand the interdependencies of our complex systems. Threat modeling is a similar idea. The goal of threat modeling is to consider the security implications of your environment, including but not limited to the code written, the services running, and overall test coverage. In the DevSecOps model, at a minimum, you’ll need all three teams—development, operations, and security—to gather and contribute within their areas of expertise. But how do you get started? Take a look at the [STRIDE](https://en.wikipedia.org/wiki/STRIDE_(security)) framework for threat modeling. The acronym stands for: * **Spoofed identity** * This is when someone who does not have an identity is able to access that identity, for example a sysadmin identity, usually to take advantage of resources and/or data that it has access to. * **Tampering with input** * Modifying data that has been sent to a system. * **Repudiation of action** * Non-repudiation is, generically, the inability to dispute who authored something, or who performed an action. In the context of IT,, this mostly comes up in signatures and audit trails. You want to ensure that logs cannot be tampered with, so you can always ensure that whatever entity is logged as performing an action, did that action, and that actions are logged. * **Information disclosure** * When someone is able to access information they should not be able to, like an individual customer’s address (e.g. spoofing as that customer) or payment information, among other things. * **Denial of service** * This is when a service, system, or application is flooded with traffic or information with the intent to bring it down (i.e. to deny service). * **Escalation of privilege** * When a user or account is able to gain more access to a service, system, or application than was intended by design. ThoughtWorks, a software consultancy, created cue cards and other materials to assist if you are interested in using STRIDE. You can find them on their Agile Threat Modeling site [here](https://thoughtworksinc.github.io/sensible-security-conversations/). It’s important to recognize, as mentioned above, that STRIDE is not a complete threat modeling framework, it is a starting point. Some points to consider not covered by STRIDE are how to handle the discovered vulnerabilities, how to rank their risk, how to ensure the resulting work is appropriately prioritized in the backlog, and so forth. To get started with all of these, you’ll be working with your security team and I also recommend leveraging OWASP and NIST materials for additional insight. Running a threat modeling session is a lot like other deep-dive meetings, like [postmortems](/ops-guides/postmortem-best-practices/postmortem-meeting) and [retrospectives](/ops-guides/retrospectives/planning). The goal is to have a meeting that is long enough, while avoiding running too long. Since these meetings are exercises to improve your security posture and mindset, you’ll also want to make sure that you have them on a regular basis. To get started with both, try one hour sessions every other week and iterate from there until you find what works best for your team. Remember that time boxing is important to help everyone retain and put into practice what they have learned. For pacing, make sure the meetings are close enough together that you can continue in the next meeting rather than be tempted to “go into overtime” in your current session. ## Capture the Flag Games The digital version of the grade school game! A quick recap of the land version for the unfamiliar: capture the flag (CTF) is a game where you capture an item (usually a piece of cloth representing a flag) from the opposite team. How does this work with computers? The assignment is usually to get through a vulnerability on a server, website, or similar technology asset to get a piece of information that is supposed to be “the flag.” As a quick example, you might need to access `flag.txt`in the root user’s home directory without being the root user or using sudo, with the file or its contents being “the flag.” Various types of CTF games cover a broad range of skills in security. For example: * **Forensics** * Recovering data that was not thoroughly deleted or was logged to a different location. * **Cryptography** * Decrypting encrypted data. * **Web Exploitation** * Using common exploits like SQL injection or cross site scripting. * **Reverse Engineering** * Converting compiled code into a human readable format. * **Binary Exploitation** * Using common exploits like buffer overflow or heap overflow. The goal of playing these games is to bridge the gap between “I understand this in theory” and “I understand this in application.” Thinking more like an attacker leads to more secure code and infrastructure, as you will be able to understand which attacks are more or less likely as well as how successful they are likely to be. ## Establish Trust: Don’t Do “Gotchas” We’ve all seen examples in the news of extraordinarily bad phishing tests done by companies to test their staff that range from humorous to hurtful. The intention is usually to use a socially engineered method that will tempt people to click on these emails similar to the way that attackers do. The result is often that people will open the emails and perhaps even click the links, but when they realize they’ve been internally duped, there’s a loss of trust between them and the security team that is trying to tell staff they’re there to help. Instead of tricking staff, educate staff. If certain types of socially engineered attacks are common—like preying on people’s financial, housing, or other vulnerabilities—teach them what those methods are and show them examples in your training sessions. By both showing what to recognize and being approachable, the security team is able to better improve the business’s security posture. For emphasis: > When staff **trusts** the security team, they are more likely to approach that team when something **does** happen. Here at PagerDuty, we have a ***policy not to trick staff, ever***. Common security exploits and methods, including socially engineered attacks, are included in our security trainings. Due to the trust that security has garnered in our organization, staff feel more comfortable approaching security whenever they do discover that they clicked a link from a phishing email or something similar. When things like that happen, security asks clarifying questions, runs a scan on their machine, lets them know of any indicators of compromised security, and then discusses those with them in an accessible way, so the person knows what to do next, if anything. Due to the high degree of trust in our organization, our security team has actually been able to automate a lot around staff reports of security risks, like phishing emails, that were found and reported. ## Socially Engineer Security Trainings Many of us have needed to sit through pre-recorded security trainings with the goal of improving our ability to navigate common traps in our digital world. That said, many people struggle with these training methods. It’s not uncommon for people to watch them while doing things in the background, or let them play in the background and answer the quiz at the end (if there is one). Instead, make your security training engaging. Present about common phishing techniques by showing them—as well as other exploits—but also do things that help engage attendees to keep the content interesting and interactive. In our past security trainings, we’ve shown examples of common passwords exploits in action (demo’ed), as well as “MFA or Not MFA” questions that are instructive for people not familiar with multi-factor authentication. For example: > MFA or Not MFA: Is it MFA when you answer a security question after entering your password? Building custom trainings can take a lot of time, but it also allows you to provide more information in areas where your organization is weaker, and be less specific in areas where your organization is stronger. To get started, take a look at our [Security Training Ops Guide](/ops-guides/security-training)—we have all of our public slides available for all the trainings on that page, as well as their Keynote files and PDF export. Our training materials are open source under the [Apache License](https://github.com/PagerDuty/security-training), so please feel free to use and repurpose to suit the needs of your organization. --- URL: https://docs.pagerduty.com/ops-guides/going-on-call # Going On-Call Guide The always-on, always-available expectations of digital services have increased the requirements of technical teams to provide response and readiness around  The always-on, always-available expectations of digital services have increased the requirements of technical teams to provide response and readiness around the clock. For teams new to this concept, introducing on-call ownership can be difficult and complex. On-call management is key to PagerDuty’s service, but the non-technical aspects are important for teams to consider. While on-call allows organizations to better meet increasing customer expectations, there are also potential impacts to the wellbeing of your on-call engineers. Change can always cause stress, but with on call responsibilities, engineers worry about being woken up in the middle of the night in addition to their normal workloads. Managers should keep an eye on responders for burnout. Meeting concerns head on, while you are setting up your on call practice, will help you manage the overall health of the team. This guide will give you some suggestions for setting good guidelines with your teams. In the most basic sense, on-call describes a state in which some employees are available to be notified for unplanned incidents, alerts, and issues for some number of systems, services, or applications. In the very early days of commercial internet—before many folks had access to reliable mobile data services—companies would provide their employees with a text-based, one-way, or two-way pager so they could be available around the clock in case they were needed. That’s where PagerDuty gets its [name](https://www.pagerduty.com/blog/decade-of-duty/). ## Who is This For? This guide is a resource for individuals, managers, and teams to use when evaluating or making the shift to an on-call culture. > **Tip:** For a fast overview of on-call, there is a short but broad introduction in the [Full Service Ownership Ops Guide](/ops-guides/service-ownership). ## What is Covered? ### Introduction - [Why Have On-Call?](/ops-guides/going-on-call/introduction#why-have-on-call) - [Who Goes On Call?](/ops-guides/going-on-call/introduction#who-goes-on-call) ### Technical Preparations - [Equipment](/ops-guides/going-on-call/technical-preparations#equipment) - [Accounts and Access](/ops-guides/going-on-call/technical-preparations#accounts-and-access) - [On-Call Platform](/ops-guides/going-on-call/technical-preparations#on-call-platform) ### Setting Team Norms - [Responsibilities](/ops-guides/going-on-call/setting-team-norms#responsibilities) - [Not Responsibilities](/ops-guides/going-on-call/setting-team-norms#not-responsibilities) - [Handoffs](/ops-guides/going-on-call/setting-team-norms#handoffs) - [On-Call and Life](/ops-guides/going-on-call/setting-team-norms#on-call-and-life) ### Building an On-Call Culture - [Empathy and Psychological Safety](/ops-guides/going-on-call/building-on-call-culture#empathy-and-psychological-safety) - [Onboarding](/ops-guides/going-on-call/building-on-call-culture#onboarding) - [Iteration and Improvement](/ops-guides/going-on-call/building-on-call-culture#iteration-and-improvement) - [Escalating Beyond Your Team](/ops-guides/going-on-call/building-on-call-culture#escalating-beyond-your-team) ### Recommendations for Managers - [Ettiquette and Setting Expectations](/ops-guides/going-on-call/recommendations-for-managers#etiquette-and-setting-expectations) - [Humane On-Call](/ops-guides/going-on-call/recommendations-for-managers#humane-on-call) - [Team Participation](/ops-guides/going-on-call/recommendations-for-managers#team-participation) - [Attrition](/ops-guides/going-on-call/recommendations-for-managers#attrition) - [Time Management](/ops-guides/going-on-call/recommendations-for-managers#time-management) - [Burnout](/ops-guides/going-on-call/recommendations-for-managers#burnout) - [Monitoring Team Health](/ops-guides/going-on-call/recommendations-for-managers#monitoring-team-health) - [Working on Systemic Improvement with Peers](/ops-guides/going-on-call/recommendations-for-managers#working-on-systematic-improvement-with-peers) ### Implementation Suggestions - [Take Stock of Your Alerts](/ops-guides/going-on-call/implementation-suggestions#take-stock-of-your-alerts) - [Prioritize Projects](/ops-guides/going-on-call/implementation-suggestions#prioritize-projects) - [Leverage Traditional NOCs](/ops-guides/going-on-call/implementation-suggestions#leverage-traditional-nocs) - [Be Flexible](/ops-guides/going-on-call/implementation-suggestions#be-flexible) - [Establish Good Behaviors](/ops-guides/going-on-call/implementation-suggestions#establish-good-behaviors) ### Next Steps - [On-Call in PagerDuty](/ops-guides/going-on-call/next-steps#on-call-in-pagerduty) ### Additional Resources - [PagerDuty Resources](/ops-guides/going-on-call/additional-resources#pagerduty-resources) - [Industry Resources](/ops-guides/going-on-call/additional-resources#industry-resources) ## License This documentation is provided under the Apache License 2.0. In plain English, that means you can use and modify this documentation and use it both commercially and for private use. However, you must include any original copyright notices and the original LICENSE file. Whether you are a PagerDuty customer or not, we want you to have the ability to use this documentation internally at your own company. You can view the source code for all of [this documentation](https://github.com/PagerDuty/goingoncall-docs) on our [GitHub account](https://github.com/PagerDuty/). Feel free to fork the repository and use it as a base for your own internal documentation. --- URL: https://docs.pagerduty.com/ops-guides/going-on-call/additional-resources # Additional Resources These other Ops Guides in our library will also be helpful if you are interested in learning more about any of the following topic:  These other [Ops Guides](/ops-guides) in our library will also be helpful if you are interested in learning more about any of the following topic: - [Full Service Ownership](/ops-guides/service-ownership) - [Incident Response](/ops-guides/incident-response-guide), particularly the section [Being On-Call](/ops-guides/incident-response-guide/being-oncall) - [Postmortems](/ops-guides/postmortem-best-practices) ## PagerDuty Resources - For step-by-step instructions for setting up your team in [PagerDuty](https://pagerduty.com), see this [On-Call Rotations and Schedules](https://www.pagerduty.com/resources/learn/call-rotations-schedules/) resources page - Sign up for our [e-book](https://www.pagerduty.com/resources/ebook/on-call-guide/) - Keep an eye on our [events page](https://www.pagerduty.com/events/) for meetups, webinars, PagerDuty Connects, and other opportunities - For in depth training check out [PagerDuty University](https://www.pagerduty.com/university/) - The [PagerDuty Community](https://community.pagerduty.com/) is a great way to connect with other folks, ask questions, find answers, hear about upcoming events, and much, much more! ## Industry Resources - *Increment*, a magazine published by [Stripe](https://stripe.com) published an issue about on-call as their [very first issue](https://increment.com/on-call/) - An *Ask Miss O11y* post from [Honeycomb](https://www.honeycomb.io) about [going on call for the first time](https://www.honeycomb.io/blog/going-on-call-first-time/). - Alice Goldfuss’s open source [on-call handbook](https://github.com/alicegoldfuss/oncall-handbook) - [New Relic](https://newrelic.com) shares some of their [best practices for on-call, as well as their incident response workflows](https://blog.newrelic.com/engineering/on-call-and-incident-response-new-relic-best-practices/) - This post from [Button](https://www.usebutton.com/) highlights the [power of an engineering on-call culture](https://blog.usebutton.com/fostering-a-strong-engineering-on-call-culture) - This article in *Sysadmin*, by Andrea Spadaccini and Kavita Guliani [describes being an on-call engineer from the Google SRE perspective](https://www.usenix.org/system/files/login/articles/login_oct15_08_spadaccini.pdf) - In this classic session from the Velocity conference, [Etsy’s](https://etsy.com) team talks about how they worked to quantify their on-call. [Mean Time to Sleep](https://www.youtube.com/watch?v=FLqucVb_et0&feature=youtu.be&ab_channel=LaurieDenness). --- URL: https://docs.pagerduty.com/ops-guides/going-on-call/building-on-call-culture # Building On-Call Culture Successfully implementing on-call for a new team requires team members and managers to think about team dynamics, trust, and communication. We see these same  Successfully implementing on-call for a new team requires team members and managers to think about team dynamics, trust, and communication. We see these same characteristics in teams that successfully run [postmortems](/ops-guides/postmortem-best-practices). Telling your team that they will have on-call responsibilities when they haven’t had them before can be difficult. On-call has an established reputation for being exhausting, wasteful, and even abusive in many organizations. Your team may have heard horror stories for their colleagues of missed events, wasted weekends, or ruined family holidays. For a while there was even a [podcast](https://podcasts.apple.com/us/podcast/on-call-nightmares-podcast/id1447430839) focusing on on-call “nightmares” in tech. Building a supportive culture and maintaining that culture long-term is a key responsibility for managers of on-call teams. It is worth noting that the goal of going on-call is to lower stress, bring the right people in at the beginning, spread the work across the team, and allow folks to know when they are OFF call. ## Empathy and Psychological Safety A key element of team dynamics in successful on-call teams is empathy. Teams and individuals need to feel empowered to make decisions quickly to remediate incidents without fear of reprisal. During an incident there is a mentality shift from “peacetime or OK” to “wartime or not OK,” this mentality shift changes the normal operating behaviors. From hierarchies to decision making, teams that have a high level of psychological safety will spend less time debating courses of action (which leads to decision paralysis) and more time working towards resolution. Additionally, empathy needs to extend beyond the incident to the day-to-day ways in which teammates interact. It is important to remember that a teammate may have been woken up at 4 a.m., and could use a little extra time to sleep in. Maybe a teammate has been having a rough week on call with a lot of incidents, would it make sense for someone on the team to take the rest of their shift? Psychological safety and creating a blameless culture is a key indicator of high-performing teams according to a study done by [Google](https://rework.withgoogle.com/blog/five-keys-to-a-successful-google-team/) . One of the most important actions that a business can have is to support learning. Supporting learning is action-based, and it is important that it’s modeled from leadership down the hierarchy so that all employees are psychologically safe to try new things. This is important to clarify as "do as I say, not as I do" can quickly become a stressful— even toxic—culture for people to grow in. In regard to on-call teams, teammates need to feel safe making decisions to resolve incidents, and that they can depend on each other to “answer the page.”  ## Onboarding Successful on-call teams spend the necessary time onboarding new team members. Give folks the time to learn the new systems, understand the dynamics of the team, and know who to call before throwing them in an on-call rotation. Shadow on-call rotations are an easy way to get new team members spun up on services they will be on call for. These rotations allow for people to listen into incident calls without having the responsibility of being the subject matter expert. Shadow responders receive the alerts and join the calls in a listen only mode. Once the new member has shadowed a few calls, they will be more confident in acting as a responder. The shadowee should then schedule time with the responder they shadowed after the incident call to answer any questions. Creating a shadow schedule is a fairly simple process for more information check out our [KB page](/incident-management/schedules/escalation-policies-and-schedules#on-call-shadowing). Beyond shadowing, make sure new users have contact methods (SMS, email, push, and call notifications) set up and staggered so they don’t miss alerts. For more information on how to set these up in PagerDuty, check out this [knowledge base information](/get-started/trial-account-onboarding). ## Iteration and Improvement For many teams that have incident response duties, some kind of metric like MTTA (mean time to acknowledge) or MTTR (mean time to resolve) is tracked to determine how fast the team is handling incidents. MTTA and MTTR are blunt instruments when taken at face value, and may not reflect exactly what is most important in your response plan. Neither metric differentiates among incidents of differing priority or importance. Your team may want to break down metrics based on priority, severity, or other categories. For a more detailed discussion of working with these metrics, [this Knowledge Base article](/incident-management/analytics/audit-trail). > **Tip:** MTTA and MTTR are also discussed in the [Full Service Ownership Ops Guide](/ops-guides/service-ownership/digital-transformation) > **Tip:** *Critical Incident Response Time*, or CIRT, is another emerging metric that might be interesting for your team. Learn more about it in [this article](https://opensource.com/article/19/7/measure-operational-performance). Other potential metrics relate to how fast fixes for incidents make their way into production. The longer a permanent fix takes to be deployed, the more likely it is that additional incidents will happen. When we think about getting new features into production, we might measure *mean time to market*. This is also a useful metric to keep an eye on when prioritizing fixes. When a bug or other error causes an incident, fixing it permanently increases the reliability of the system overall and decreases or eliminates the incidents arising from the original issue. ## Escalating Beyond Your Team Knowing who you're going to call is crucial to streamlining increasingly complicated communications. To ensure that you're reaching out to the correct group(s), you'll need to check that you have defined which areas need assistance. For example, did something start out looking like a network outage but turned out to be a database outage? In that case, you'd pull the on-call database administrators into the incident and allow the on-call NOC to drop off as needed. Cross team communication is also why it's very important to have as many common tools as possible. In the above example, the NOC will likely have their own network monitoring tools, but if they don't have a tool in common with the database admins, then the NOC won't be able to point to issues in a way the database admins can see. Relevantly, all teams should be in the incident management platform for hand-offs and reviewing what has been done thus far. When you are pulling in new teams, it's possible that people might be pinged who are not needed. To keep everyone focused on the active incident, make sure to only keep those on the call that have an active role. Before someone drops off, they should clear with the incident commander to ensure 1) that there's nothing left for them to do and 2) to keep communications and decisions centralized. For those who remain on the call, it is especially important to avoid the use of industry jargon, acronyms, or other short-hand references that could be confusing in the heat of the moment. Remember: not all disciplines use the same "shorthand," and it's better to be clear and up front. This will also help when doing the incident review and postmortem as there will be different skills present for those meetings and write ups as well. --- URL: https://docs.pagerduty.com/ops-guides/going-on-call/implementation-suggestions # Implementation Suggestions If you and your team are completely new to on-call, here are some suggestions of tasks to help guide you in the process.  If you and your team are completely new to on-call, here are some suggestions of tasks to help guide you in the process. ## Take Stock of Your Alerts - Manage Alert Fatigue! - [Understanding Alert Fatigue & How to Prevent it](https://www.pagerduty.com/resources/digital-operations/learn/alert-fatigue/) - Our [podcast episode on alert fatigue](https://www.pageittothelimit.com/alert-fatigue-with-boaz-barzel/) with Boaz Barzel - Make sure all of your alerts are actionable. - Verify that all alerts have documentation. - If any alerts indicate issues with external dependencies, liaise with your peers on those teams for shared responsibility. - Clear noisy alerts as much as possible. Prioritize permanent fixes for troublesome issues. - Disable alerts for issues that can’t be fixed and don’t have customer impact. > **Tip:** Ideally, every alert that comes through to your team should be something they can fix ## Prioritize Projects - Start your on-call journey with your most stable services. - Prioritize customer-facing services. - Decide which services require what level of response, and don’t over-assign high priorities to services that don’t require them. > **Tip:** When the pager goes off at 3am, it better be worth it. ## Leverage Traditional NOCs If your organization already relies on a 24x7 NOC for monitoring status and responding to alerts, you might migrate to your team on-call in phases. There are two major methods for doing this: - Assign your team as escalation or “Level 2” for your services and allow the NOC to respond as “Level 1.” - Divide common alerts into tasks that the NOC can easily manage and those which require your team’s access and expertise. You might make use of [PagerDuty Rundeck](https://rundeck.com), for example, to give the NOC team access to certain tasks in your environments. Over time, your team can then pick up more of the alerts as they get acclimated to being on call. ## Be Flexible - There’s no rule that on-call shifts need to be a full calendar week. Split things up in ways that make sense for your team. - If you have folks in different timezones, consider using a model that puts team members on-call most of their day time and limit their sleep-time duties. - If you don’t need coverage on weekends or evenings for certain services, don’t notify responders for those alerts. Leave them until work hours, and make it a practice for the primary on-call to clear the queue every morning. - Try to lengthen the time between shifts for any individual. If you have a small team, work with peers with similar services to determine if there is enough shared knowledge to share a rotation. ## Establish Good Behaviors Give your team members just a few guidelines to help them adjust to being on-call. This could include things like: - Setting standards for alert response times and work with your team to meet them. Using [MTTA and MTTR](/people/#responsibilities) will help. - Committing to being responsive, and communicate when assistance is needed. - Don’t hesitate to escalate. - Sober on-call. --- URL: https://docs.pagerduty.com/ops-guides/going-on-call/introduction # Introduction With the right approach, being on call doesn’t have to be a painful experience for your team. When you have a culture of collaboration, infrastructure insight,  With the right approach, being on call doesn’t have to be a painful experience for your team. When you have a culture of collaboration, infrastructure insight, and the right tools in place, deploying an on-call workflow will create some predictability around your production systems. A good on-call program will create some containment for disruptions, provide predictable paths for escalation and resolution of incidents, and encourage application teams to take on work to fix chronic issues in your ecosystem. We often think about on-call the way it is dramatized in television shows—doctors with beepers getting paged into Operating Theater 3 for emergency surgery, STAT. For technical teams, the reality is less life-threatening, but can still be a stressful experience, full of uncertainty. When something unexpected happens to a system, the people who know that system best are needed to investigate and fix whatever the problem is. Sometimes an individual can accomplish this by themselves. In other situations, more help is needed—maybe from the same team, maybe from another team. There could be some additional organizing or coordination, letting responders know to join a conference call. During work hours, these interruptions might pull folks away from work tasks or meetings. Outside of work hours, though, they could be eating dinner, or commuting, or sleeping. This disruption of personal time is a big concern for folks going on call for the first time. In this guide, we’ll go through some of the steps your team can take to alleviate these concerns and set your team up for success. ## Why Have On-Call? If your team is responsible for consumer-facing services, you probably know how unpredictable users can be. Did we really expect someone to be doing their banking or ordering groceries at 3 a.m. on a Wednesday, or using your service in a way it wasn’t intended? Your goal as a manager isn’t to punish teams for writing bad code; it’s to improve the overall reliability of your teams services and systems. Unfortunately, for many complex distributed systems, the best way to do that is in a production environment, exposed to whatever interesting things users might get up to. Customers now assume most services will be up and running all the time—not just during limited business hours. In addition to customer expectations, the increasing complexity of modern services makes it more and more difficult for general-purpose operations centers to effectively respond to all the idiosyncratic alerts that might be generated. So teams that would have traditionally been spared an on-call responsibility are increasingly expected to have some responsibility for their services during their off hours. Having a predictable on-call schedule can be beneficial for your team. For individuals, being on call creates a scheduled time when they know you will be the first person contacted if something happens. For teams with unstructured incident response, implementing a regular on-call rotation can decrease the amount of unplanned interruptions some team members receive. Instead of always being the person to be contacted for an issue, team members will have primary responsibility on a regular schedule. When someone is on-call, they can take fewer regular tasks during a sprint plan, knowing they will need some hours to deal with unplanned work. It’s possible that not every service your team works on needs to have a full-coverage, on-call schedule. You may have different uptime and reliability goals for different types of services. It’s common to need 24x7 response for customer-facing services, or those with strict SLO’s, but for internal applications, it might not be needed, especially for services that run periodically. If your team has some offline data processing that runs in the middle of the night, you might have some flexibility to say that the on-call doesn’t need to be alerted during off hours, but should be alerted at 9am. > **Tip:** For more on SLA, SLO, and SLI, check out [this blog post](https://www.pagerduty.com/blog/best-practices-service-monitoring/). > For an example, PagerDuty’s SLA is published [here](https://www.pagerduty.com/standard-service-level-agreement/). When you think about the services your team owns, be pragmatic, but also be ferocious about taking on responsibility for the things you are responsible for and the things that matter—you don’t have to be on-call for absolutely everything. ## Who Goes On Call? Prior to the emergence of cultural-technical philosophical shifts, like DevOps and SRE, on-call responsibilities were generally limited to teams considered “Operations” or “Systems Engineering.” This practice didn’t prevent developers from being contacted during their off hours, but it made that contact unpredictable, and the response times for those alerts longer than it needed to be, leading to unnecessarily extending service outages. With more teams exploring DevOps and SRE models, a wider range of individual contributors who would not have been on-call just a few years ago are finding themselves with on-call responsibilities. The most impactful change is that more application development teams are playing a larger role in taking care of the code they write when it reaches production. When organizations need to reduce the amount of time it takes to respond to and remedy a problem, having the folks who know the code best in the responder list is a huge benefit. One thing to keep in mind is that responders will have on-call responsibility for the areas of their expertise. We talk a lot about the concept of [full-service ownership (FSO)](/ops-guides/service-ownership), and the role application developers play in incident response for modern organizations. We have an entire ops guide dedicated to this [method](/ops-guides/incident-response-guide). Translating full-service ownership for your organization can look very different from another organization, and success with the FSO model may depend on how robust or sophisticated your service modeling and monitoring systems are. Adopting full-service ownership and an appropriate on-call rotation should focus your teams on the aspects of the production systems that they know, and applying the appropriate expertise to the response process. Different teams can be on call for different components of an application stack based on where their knowledge and strengths lie. Having an on-call rotation should ideally mean better on-call experiences for your team. Team members will know exactly when they need to be available to respond to incidents on a regular schedule. Explicit rotations and schedules take some of the unexpectedness out of unplanned work for responder teams. The best part is, team members know when they are not on call, when they can take a vacation, or when they can just put their phones in a drawer and run away. For managers, there is greater visibility into the health of the team; who is getting paged a lot, who is being woken up at 3am consistently? An on-call shift doesn’t necessarily need to be 24x7. Teams using platforms like PagerDuty can customize their rotations to best suit their requirements. Teams can limit the hours they support certain services. Internal applications might only require a 24x5 or even a 9-5x5 schedule for user support. Global teams have a particular advantage in that their schedules can use a “follow the sun” method. When teams are widely distributed, teams with 8-, 10-, or 12-hour time differences can be responsible for response during their daytime hours, with no one required to have an overnight shift. > **Tip:** For tips on follow-the-sun on-call schedules, check out PagerDuty’s recommendations [here](/incident-management/schedules/schedule-examples#example-6-follow-the-sun-schedule) Organizations new to FSO, DevOps, and [SRE](https://www.pagerduty.com/resources/engineering/webinar/building-and-scaling-sre-teams/) models might also take advantage of a hybrid model with a Network Operations Center (NOC). An established NOC can serve as first-level responders in any of these models. NOC responders can also take advantage of automated processes and [runbooks](https://www.pagerduty.com/resources/learn/what-is-a-runbook/) to alleviate the number of alerts that escalate to other teams. Overall, teams have a lot of flexibility for how on-call can be incorporated into their workflows. Choosing appropriate scheduling, assigning the services and alert types, and establishing best practices for escalations will all benefit the teams and individuals being asked to take on-call responsibilities. The rest of this guide will feature some recommendations around the mechanics of on-call as well as some guidance for building a supportive on-call culture for your team. --- URL: https://docs.pagerduty.com/ops-guides/going-on-call/next-steps # Next Steps This section is for teams using PagerDuty to help with everything from setting up your profile to where you can find advanced resources on topics ranging from  This section is for teams using PagerDuty to help with everything from setting up your profile to where you can find advanced resources on topics ranging from incident response to postmortems. ## On-Call in PagerDuty Successful on-call starts with setting up your profile correctly, including contact methods and staggered notifications. Once the profile has been set up, schedules and escalation policies are the next step. ### Setting Up Your Profile in PD To set up your profile in PagerDuty, start at the **My Profile** section under your user icon. You will find the **Contact Information** tab, where you can input your contact information. You also have the ability to test your notification methods in the setup section. Click [here](/account-admin/user-profile) for in-depth step-by-step How Tos on profile configuration. > **Tip:** Contact information should include SMS, push, phone, and email 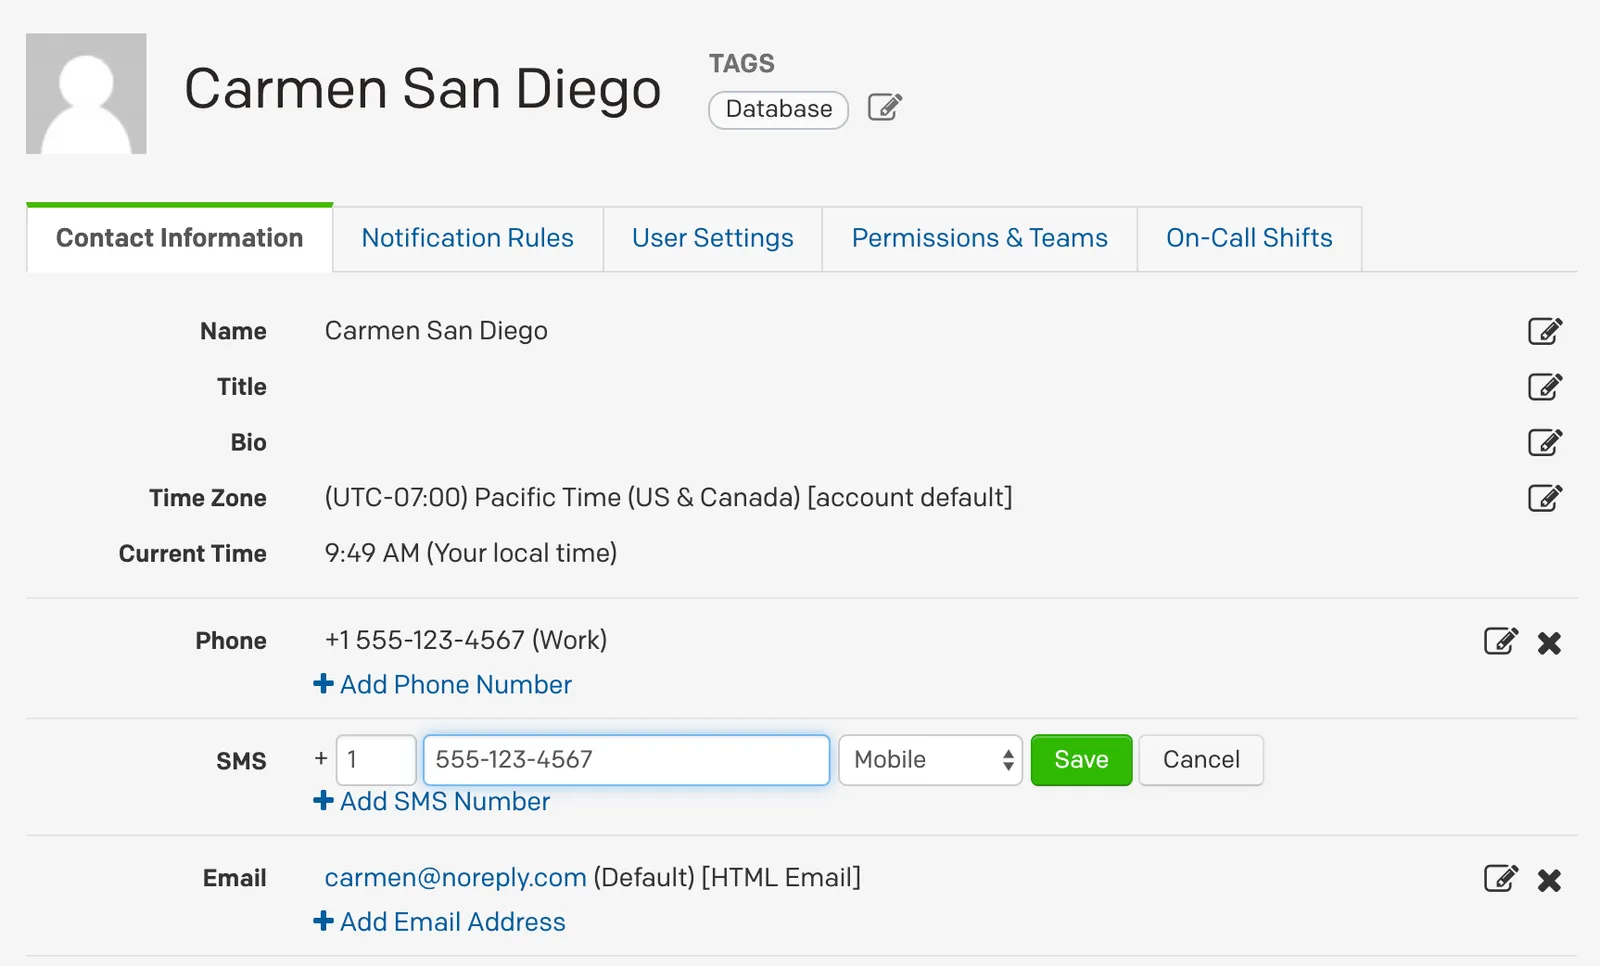 A best practice is to also download the PagerDuty vCard to add all phone and SMS notification numbers to your contacts. This will also enable you to bypass “Do Not Disturb” mode so that you never miss a page. For more information on how to download and automatically update the PagerDuty vCard, check out this [Knowledge Base](/incident-management/notifications/notification-phone-numbers) information. > **Tip:** Don't forget to download the PagerDuty vCard ### Setting Up Notifications Proper notification rules will protect you from missing high urgency alerts and also help avoid getting woken up in the middle of the night for a low urgency alert. > **Tip:** Set up staggered notifications so you don’t get them all at once To set up notifications, select the **Add Notification Rule** in your profile. This is where you can decide how you want to be notified for both high and low urgency alerts. You will choose the number of minutes between when the incident is assigned to you and when you receive the notification. 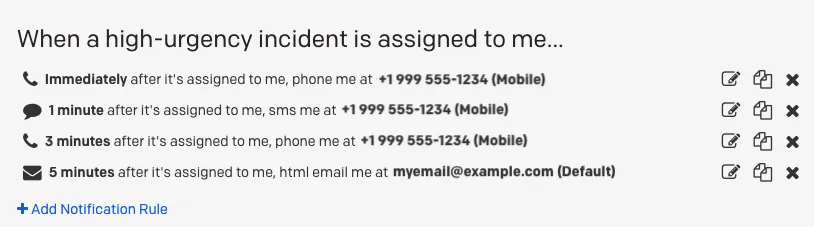 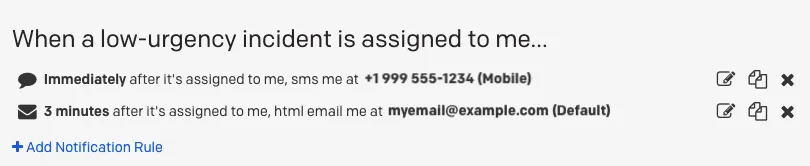 ### Schedules and Escalation Policies Escalation policies allow you to mobilize the right people at the right time by connecting services to on-call schedules. A best practice with any escalation policy is to have a multi-tiered approach; at PagerDuty, we have three tiers of escalation policies for services. > **Tip:** Individuals should never be assigned to an escalation policy; instead, a schedule should be assigned. For example, if your CEO is the final escalation point, put the CEO on an on-call schedule titled “CEO On-Call” and have that schedule be the final escalation path. Once the escalation policies are created, then services should be attached to those policies. A sample policy is below. 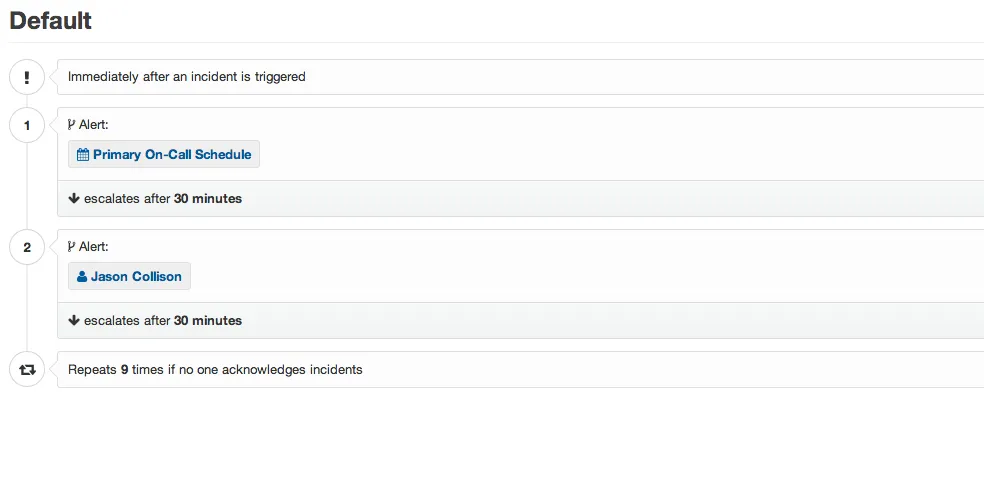 ### On-Call Readiness Reports in PagerDuty [On-Call Readiness Reports](/incident-management/schedules/readiness-reports) help you and your team manage notification rule configurations. Use the reports to ensure every member of your team has their contact information and notifications set appropriately in PagerDuty. These features are available in the [Business and Digital Operations](https://www.pagerduty.com/pricing/) plans. To create a report for your team, mouse over the **Analytics** header in PagerDuty, and then select **On-Call Readiness** from the menu. 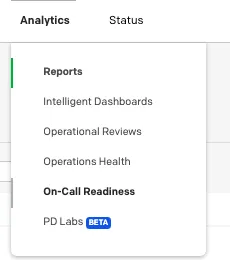 To build a new report, simply choose one of the options. The most basic is “Must include phone,” while “Never miss a page” will look for multiple contact methods as well as notification timing. 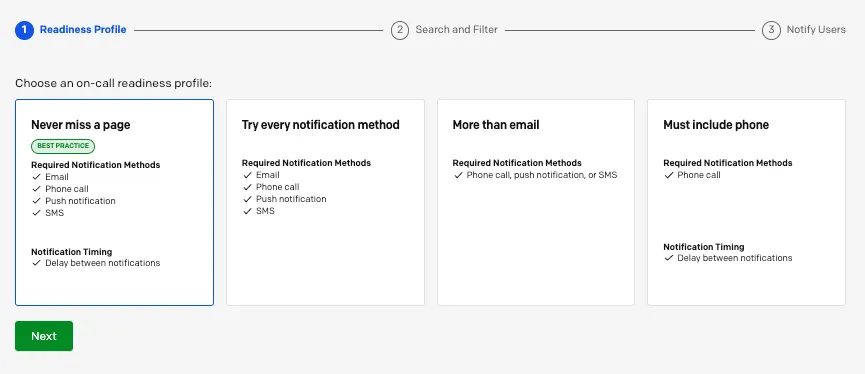 Select the level of notifications you want to report on for your team, and click Next. If you have multiple teams, select the team you’d like to report on in the summary screen. You’ll also see a preview in the “Readiness Details” panel. If any of your team members don’t meet the criteria, click Next. PagerDuty will send an email to all team members who haven’t configured their accounts to meet all of the requirements at the selected level. You can customize the settings for the email and include customized documentation if you’d like. 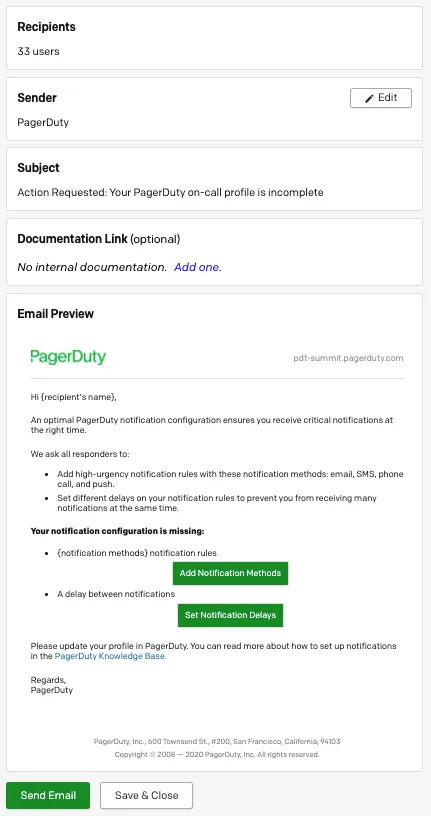 When you click “Send Email,” anyone on your team with an incomplete configuration will be notified. If your team is fully configured, you won’t have the option to send email. Pagey will let you know that you are good to go!  For more about the On-Call Readiness Reports, including descriptions of the available reporting levels, see this [Knowledge Base article](/incident-management/schedules/readiness-reports). --- URL: https://docs.pagerduty.com/ops-guides/going-on-call/recommendations-for-managers # Recommendations for Managers Your team will probably have concerns about starting an on-call rotation. When we look at on-call behaviors in more traditional organizations, the expectations  ## Etiquette and Setting Expectations ### Humane On-Call Your team will probably have concerns about starting an on-call rotation. When we look at on-call behaviors in more traditional organizations, the expectations and implementations often leave the team members in a bad place—lots of alerts, low context, and alerts for services they can’t access or work on. When establishing on-call for a new team, set the expectations and some ground rules for your team. You might consider things like: - Rescheduling around planned events at least a week in advance. No one wants to miss a child’s birthday party for on-call. - Letting the backup know if you will be temporarily unavailable during a shift for things like subway commutes. - Setting guidelines for folks to delay their workday if the responders were up overnight responding to alerts. - Thinking about a process for rolling folks off the primary if an on-call shift has been especially stressful. For example, if a large issue lasts for several days, or if there are a lot of overnight issues. - Erring on the side of creating more shifts of a shorter duration if your services are very noisy. Preserving the health and well being of your team should be high on your list. > **Tip:** The PagerDuty platform can help you monitor the number of alerts your responders are getting, including alerts during “sleeping” hours in the [Operational Reviews](/incident-management/analytics/operational-reviews) feature. ### Team Participation Part of avoiding burnout on your team and making on-call duties feel equitable is ensuring that all team members are participating equally. As a manager, you’ll want to keep an eye on how your team is managing things like shift swapping and schedule overrides. No one person should be taking a disproportionate amount of the on-call duties for any given team. It is also important to manage coverage for major holidays, and ensure that the same team members aren’t working every holiday or the same holiday year after year. Your on-call platform provider probably provides some reports and other insights into how many hours your team has been on call, how many incidents they have responded to, and how many times they have been paged during sleep hours to help you manage team health. You also might want to talk to your team about expectations for their off time behavior when they are on call. Team members should be sober enough to work when they receive alerts. It probably feels like an awkward conversation to have, but it’s common enough it’s been a topic on [Ask a Manager](https://www.askamanager.org/2016/08/i-think-my-on-call-coworker-was-high-when-i-contacted-him.html). ### Attrition It is absolutely possible that a new on-call team might lose some members. Changing responsibilities for any job will cause some employees to reevaluate whether the position is still something they want to be doing. Attrition has an impact on morale, and will also impact the workload of an on-call team as rotations are adjusted to cover the vacancies left. While you can’t prevent all attrition, setting your team up for success will help alleviate doubts. Following up on action items, prioritizing the fixing of repeated issues, and championing your team’s requests to other groups will also demonstrate that you support them. Ensuring that all team members understand the goals of the on-call effort, the metrics that will be measured, and the positive outcomes that are expected will go a long way. You’re likely to have detractors on your team, and vocal detractors can really have a negative effect on other team members. Firing folks who are destructive or refuse to participate should be a last resort; you can also look for methods like delaying a full on-call roll out, or setting a competition for improving key metrics with another team to motivate folks. Listen to people’s concerns with empathy. Many of the suggestions in this guide will help you build a supportive team. ## Time Management When application developers are part of an on-call rotation, there will be periods where they won’t be as productive in their normal planned workload. When working with your team on an on-call plan, include guidance around how to reduce planned work during on-call shifts. This will likely be easier for teams that work in short sprints, or with well-defined and well-groomed task backlogs. Teams that don’t have those types of methods in place can also be flexible about expectations during on-call shifts. For example, the primary on-call might work on bug fixing. They might also dedicate their time explicitly to making sure all issues that caused alerts have fixes created. ## Burnout Managing burnout on your team is a key to successfully handling on-call duties as well as normal feature work. Dealing with attrition due to burnout is one thing, but it can also be difficult to deal with a team member who is burning out but not yet willing to acknowledge the problem. ### Monitoring Team Health Replacing folks is expensive. Keep tabs on your team and how they’re doing. New on-call duties can also cause strife with family members who weren’t expecting to share their homes with noisy alerts in the middle of the night, so managing a humane on-call schedule and prioritizing permanent fixes for alerting issues is important. Maintaining the team you have in a healthy way is less disruptive and will be less expensive than hiring to replace team members. Knowing what to keep tabs on with your team can vary, and can be very specific to your organizational culture. ### Working on Systematic Improvement with Peers As we mentioned earlier, maintaining a humane on-call culture will go far to help with team health. Actively managing the issues and alerts, as well as setting appropriate priorities for incidents can reduce alert volumes for existing services over time. Maintaining appropriate, actionable alerts should become part of your development practice for all new services as well. When services managed by your team depend on other services that aren’t providing necessary reliability, your team may need to do more defensive coding to protect their services and their sanity during on-call. Planning for things like dependencies becoming slow or unavailable, and adding functionality to deal with them, might take more time to implement initially, but will help your service metrics over time in addition to saving your team alerts. --- URL: https://docs.pagerduty.com/ops-guides/going-on-call/setting-team-norms # Setting Team Norms While being available during an on-call schedule is one of the first responsibilities of being on-call, there are more obligations beyond just acknowledging  ## Responsibilities While being available during an on-call schedule is one of the first responsibilities of being on-call, there are more obligations beyond just acknowledging the alert. When an alert comes in, it will notify the on-call responder who will then acknowledge the incident (to stop any further escalation). One of the goals with having SMEs on call is to reduce [mean time to acknowledge](/get-started/introduction) (MTTA) and [mean time to resolution](/get-started/introduction) (MTTR). Driving down MTTA through quick acknowledgement of alerts is one of the behaviors on-call schedules reinforce. Once an incident is acknowledged, the on-call engineer has the responsibility of triaging the incident; is this something they can fix on their own? Do additional responders need to be notified? Do they need to reassign to another team? Is the severity increasing and does a major incident need to be kicked off? At PagerDuty we have a saying: “Never hesitate to escalate!”. Part of the triaging process is determining if you have the ability to fix the problem yourself. If the issue is not time sensitive, create a ticket, assign it to the right team, and work on it during business hours. However, for high [severity](/ops-guides/incident-response-guide/severity-levels) or incidents that are rapidly increasing, hesitating to escalate only increases the overall opportunity for related damage. Engineers should always feel empowered to involve other teams and team members as necessary. You will rarely know all of the contributing factors or *gasp* root cause at the beginning of an incident. As a first responder, the goal is to have a basic enough understanding to be able to determine what the causes might be, and who to bring into the response. Additionally, on-call engineers should look for ways to improve existing systems and processes. Take the time to tune alerting if there are alerts that aren’t actionable. Also, look for ways to improve on the system and ask questions like: - Was there enough context in the alert to make it meaningful? - Was the documentation up to date? - What can I do so that the next person who may deal with this will have an easier time? ## Not Responsibilities Every problem that arises across your platforms may not be your responsibility, even during an on-call shift. A single team within a larger organization should be able to escalate to other teams or to ask for additional support when the incident requires it. > **Tip:** “Never Hesitate to Escalate” It’s important to help responders manage their time well during their on-call shift in order to avoid burnout and maintain employee morale. A few other things to consider include: - Encourage responders to lighten their regular workload during an on-call shift - Remind responders that if they are not adding value to an incident, they should disengage from the incident or set their status to stakeholder for later announcements - When a responder is already engaged with an incident, additional and/or unrelated incidents should fall to other members of the team - If a responder has burned out during a shift, have a process for someone else on the team to help them pick up the part of, or the entire shift so they can sleep, eat, etc. It’s easy for some responders—especially if they are new to being on call—to feel obligated to solve all problems at any cost to themselves. This behavior won’t help your team in the long run. Folks can easily experience burn out and resentment. Additionally, it is important to remember that people are human, while there is the expectation an on-call responder be available to answer pages, life happens. Cell phones fall in pools, the internet goes out, dinners happen. Sometimes an alert gets missed, which is why there are escalation policies, because there is no expectation that a responder will be the first to answer every single page, every single time. ## Handoffs At the end of an on-call shift, it’s a good practice to have some kind of formal handoff. This can take the form of a team meeting, where the outgoing on-call responder summarizes the incidents for their shift. It can also take the form of an email, shared document, or saved query in your incident response platform that highlights the current and recent alerts and how they were handled, if they are closed, or the current status for those ongoing into the next shift. The purpose of the handoff is to make sure the incoming on-call responder has all of the information and context for the current state of the environment. Other items that might be helpful in your handoffs: - Recent deployments on key systems, including upstream dependencies and downstream consumers. - Any queued remediation work requests created after a postmortem meeting. - Any TODO action items to make documentation, context, alerting, or anything for the next person on call better. - Staff changes on other key teams. For example, if your team regularly reaches out to Ed in database engineering, but Ed is leaving your organization. Your team will likely find other key areas that are useful to share in shift handoffs. At PagerDuty we recommend the second layer of your escalation policy be the person from the prior week as they should still have context from any previous incidents. You can learn more about PagerDuty recommendations on escalation policies [here](/incident-management/schedules/escalation-policies-and-schedules). ## On-Call and Life For teams and individuals new to going on call, the mentality shift can be hard. One of the critical considerations is work-life balance when going on call. As previously mentioned, remembering that people are human is key to avoiding burnout and maintaining a people-centric culture. Things to consider with on-call life are: - Vacations and emergencies. When life happens, use the override function on schedules when you have something planned or unplanned occur (to learn more about how to user PagerDuty overrides [see this page](/incident-management/schedules/edit-schedules)). - Keep on-call schedules consistent. Think through how long the on-call rotation is; 3 days, 5 days, 7 days or 8, 12, or 24 hours? At PagerDuty, we recommend handing shifts off on Mondays to recap the week with minimal confusion and ensure shifts aren’t switched over the weekend. - Teams should work to find what is best for them and their applications. For tips and ideas to keep in mind when designing an on-call schedule, check out some of our [advice](https://www.pagerduty.com/resources/incident-management-response/learn/call-rotations-schedules/). --- URL: https://docs.pagerduty.com/ops-guides/going-on-call/technical-preparations # Technical Preparations In this section, we’ll take you through some of the preparational aspects of on-call to keep in mind when implementing on-call for a new team.  In this section, we’ll take you through some of the preparational aspects of on-call to keep in mind when implementing on-call for a new team. Prior to 2020, this step may have been more cumbersome for many organizations. The global COVID-19 pandemic created an opportunity for many teams that hadn’t normally had much ability to work from home to do so—necessitating laptops, secure connections, and better home internet access. ## Equipment All team members should have company-issued equipment to use at home. Usually this includes a laptop computer and other gear like monitors, spare chargers, docking stations, dongles, and connectors. Home access to the internet is also required with appropriate speeds and reliability. This will be easier in some areas than in others. Teams may also opt to provide team members with cellular wifi access points or other devices for response when team members are in transit, or their primary internet connection is unavailable. Your organization may already have established practices concerning reimbursement of costs like mobile phones and internet access for teams that are required to have an on-call rotation. This is a helpful benefit to provide for your team, if permitted. It can allow for service upgrades like increased bandwidth. If the company is unable to help cover costs, make sure to discuss with your team members the requirements, including availability and participation. Ideally, your entire team will be sharing in the on-call responsibilities, regardless of where they live. ## Accounts and Access Once your team has the correct equipment, team members will also need to have the correct access permissions to your platforms, knowledge base, and other resources. This may mean a VPN account and software, or access via other gateways. Create a checklist for your team to ensure that everyone has the access that they require, and make the checklist part of your onboarding process for new team members. Everyone should have their access needs verified before they are assigned to an on-call rotation. To start you on your path to thinking through a checklist, here are some common items to include: - [] Working local copy of repos - [] Configured environments - [] Current credentials for third-party services - [] VPN access - [] Passwords and permissions to appropriate environments - [] Access to monitoring and dashboards ## On-Call Platform Your on-call platform can also help you get your team ready for the technical aspects of going on call. Determine with your team what notification routes will be most effective—whether email, text message, phone calls, chat messages, or other methods. Then help your team configure their on-call accounts with the appropriate notifications to meet their needs and response requirements. > **Tip:** PagerDuty users can access the On-Call Readiness Report in their accounts. For more information on how to use this feature, see this article in the [knowledge base](/incident-management/schedules/readiness-reports). PagerDuty includes a report type called the “On-Call Readiness Report” that will help your team get organized around notification types. The Readiness Report will look at your team members in PagerDuty and determine if they have set up their notifications to meet certain standards, ranging from “More than email” to “Never miss a page”. Different teams may have different preferences for how their notifications are set up based on the services they support. Some organizations may set this as a top-down mandate, or it could be an individual team decision. However you set your standards, the On-Call Readiness Report is a useful tool to ensure standardization across the team.  --- URL: https://docs.pagerduty.com/ops-guides/howie-guide # Howie Guide The guide you’re about to read will provide you with an explanation of how to get the most out of your incidents. This process has been developed by a number
The Howie Guide to Post-Incident Investigations was originally published by Dr. Laura Maguire, Nora Jones, Vanessa Huerta Granda in collaboration with the Jeli team. PagerDuty acquired Jeli in 2023 and we're proud to rehome the Howie Guide as a part of the PagerDuty Ops Guide library.
## Welcome to the Howie Guide to post‑incident investigations!
The guide you’re about to read will provide you with an explanation of how to get the most out of your incidents. This process has been developed by a number of leading experts in the field and shows the steps to conduct an in-depth investigation.
We affectionately call this process the “how we got here process” (or “Howie process” for short), and it is applicable to companies of different sizes and stages of maturity with investigation programs.
### Why focus on learning from incidents?
Recent events have shown how critical digital services are to individuals, organizations and society as a whole. Now more than ever, learning from incidents is crucial to helping maintain service reliability requirements so companies can continue delivering on their commitments to clients and keep employees connected and productive
As Nora Jones notes:
> We’re at an age in software where learning from incidents is pivotal to our companies’ continued successes. There is a massive opportunity for Software Engineers to learn more about the applications of Resilience Engineering, Human Factors, and Systems Safety to their everyday work with the goal of learning how we can extract value and build expertise from incidents and surprises.[1](/ops-guides/howie-guide/authors#references)
When we think about learning from our incidents, we often don’t have a good framework for what we can get out of this work. As noted cognitive psychologist and researcher Gary Klein explains in his book on human performance in everyday work conditions.[2](/ops-guides/howie-guide/authors#references)
> **Tip:** Performance Improvement = Error Reduction + Insight Generation
So far, the industry has over-indexed in the “error reduction” part of the equation by emphasizing incident metrics like mean time to respond and not much on generating insights. By investing in learning and in generating quality insights from each individual incident, you will be able to provide context around your incident metrics and show a more complete picture of performance improvements.[3](/ops-guides/howie-guide/authors#references)
This guide provides some concrete strategies to help you begin to develop skills in generating insights and to help your company in developing an incident analysis program. It will start by walking you through the stages of an investigation: how to assign and accept an investigation, identify your incident data for analysis, prepare for interviews, and write a calibration document. As you wrap up your investigation, you will also learn how to lead a learning review meeting, complete an incident report, and integrate any additional findings and action items before you finalize and distribute your learnings within your organization.
While the steps outlined here represent a well-rounded way to review an investigation, our research shows that:
1. Every organization has different needs, strengths, limitations, and goals for their incident investigation process, so some of the steps may not be applicable to every organization.
2. Many investigators have constraints on how much time they can spend on an investigation, and some investigators are currently the only ones doing investigations, so it has to be efficient.
3. Incidents have differing levels of value for investigating incidents. Fundamentally, we believe you can learn from every incident but, realistically, we know that organizations are balancing tradeoffs between time spent in development or operations versus time spent in learning.
This means that an investigation process needs to be flexible and adaptable to the goals, interests and needs of the team or organization. We built Howie to be customizable for different sizes of organizations, skills of investigators, or levels of severity of incidents.
In this way, an investigator should think about this process as a set of tools in a toolbox. As you progress as an investigator and your company progresses with its incident investigation program, we encourage you to seek more tools to add! This will help you increase the number of insights gained in your investigations.
At the start of each investigation, you’ll consider how much time you have, the availability of participants, and how much value the findings from the investigation will have for the company. High severity, very public events, or substantial near misses would use more of the tools provided here. We encourage you to take the parts that make sense to you at this specific time.
What we hope you take away from this is how to structure your post-incident processes and train others on them. We believe our guide will set you up for success in helping your workplace become a learning organization, one investigation at a time.
—Your friends at Jeli
## A brief word about language in incident investigations
We introduce a number of terms in this guide that may be different from what is used in your organization. Generally speaking, we believe that getting the process right is more important than arguing over language. At the same time, many of the legacy terms used in the industry (such as “post-mortem,” “root-cause analysis,” etc.) come with a history of negativity. Using positive, specific language (such as “learning review” or “blame-aware”) is an important piece of building a culture of learning where folks are excited to be part of this transformation. We believe that language will always be evolving; in this guide we use a number of terms interchangeably (“incident investigation” and “incident analysis”) to reflect the way we use different terminology in our day-to-day work. We expect future iterations of this guide to present new terms and retire some of the ones we see here.
## Glossary
**Blame-aware** – An evolution from “blameless,” we recognize that everyone works with constraints and sometimes those don’t appear until after an incident; we acknowledge our tendency to blame and name names and move past it in order to be productive.
**Investigator** – The person who will own the responsibility for the investigation all the way through the process (from initial analysis through distribution of findings); we outline a number of recommendations for what makes someone a good candidate for this role.
**Knowledge elicitation** – The process of gathering an expert’s tacit knowledge (expertise and experience) underlying their performance. This is a sub-process of knowledge acquisition.
**Calibration document** – A document of initial findings put together by the investigator that will be shared prior to a review meeting to ensure proper alignment with interviewees and participants. This document should prevent any surprises from coming up during the review meeting. A calibration document can also be a draft to the final incident report.
**Incident report/ how we got here report** – A document to be sent out following the review meeting to all participants. This should be a learning document different from a post-mortem report in that its goal is learning. It is focused on the story of what happened and how events came to be.
**Review meeting** – A facilitated meeting where the investigator guides participants through the incident in order to uncover and share insights.
**Action items meeting** – A facilitated meeting or section of a meeting to focus on follow-up items uncovered during the investigation and where you can generate and assign any next steps.
---
URL: https://docs.pagerduty.com/ops-guides/howie-guide/analyze
# Analyze
Incident analysis is iterative. You move from a general awareness of the incident to having deep knowledge of the event as you work your way through

## Analyze incident data
Incident analysis is iterative. You move from a general awareness of the incident to having deep knowledge of the event as you work your way through incident-specific data and other artifacts. As you progress in your investigation, it will inform your understanding of the technology, participants, and progression. At times it may be necessary to circle back to data or people you’ve spoken with to confirm or clarify new details as they emerge.
As you prepare for conducting the initial analysis, the first step is to get yourself familiar with the event. Sometimes, this step is easy because you were already aware of the event, so you know what happened and who was involved. Other times you may just get a verbal report from someone who was either in the event or tracked it in some way along with the request that you investigate. Other times you may be asked to investigate the incident without any context. Regardless of how you become the investigator, our recommended approach to conducting the analysis includes:
1. Orienting yourself around the initial data you have aggregated (transcripts, people data, alert logs, on-call schedules, dashboards, etc.) by tagging to organize your analysis;
1. Creating a narrative and timelines of the event;
1. Making note of the emerging themes and key questions remaining to be answered
1. Identifying any additional data you need in order to answer the questions
1. (Optional) Identifying and preparing for interviewees (if conducting interviews)
1. Compiling the data collected and themes
1. Consolidating your analysis, supporting data, and themes into a calibration document for review and/or to guide your facilitation
1. Your analysis should be refined and deepened following discussions in post-mortems or after a review from participants.
Let’s look at each of these steps in more detail.
> **PD on PD:** Categorizing incidents starts before the Post-Incident Review. Incident Workflows, Incident Types, and Custom Fields help keep data aligned and focused and aids in later analysis. [Here's how we do it](https://www.pagerduty.com/ops-guides/using-pd/integrations-team/).
## Tagging
A useful way to orient yourself to the event is to read over the data you’ve collected. This helps orient you to the event itself and helps you begin to make sense of different parts of the incident. For example, how did the event get detected? Who was brought in to help? How did they react to what was going on? Most investigators will immediately begin looking for information to assess the nature and severity of the incident and any key moments in time to help develop a timeline.
To begin to deepen this process, we suggest flagging events of interest and we refer to this as tagging. We suggest tagging with a defined set of words that group similar parts of the data around important aspects of the incident and how it was handled. To prepare for tagging, we see investigators cut and paste ChatOps transcript data into a text editor or print out hard copies of the data. Find a method that works best for you and that is flexible enough to let you work with the data all the way through to the report or meeting facilitation.
To start, the investigator reads through the transcript, tags key events, and begins building the narrative of the event. We recommend having a standard set of tags for your organization that everyone involved in an investigation can reference. What tags you use, their definitions, and how many you have will depend on how deep of an analysis you conduct. We’ve seen teams that just use a few tags to help them build the timeline and identify key moments in time (for example: detection, diagnosing, repair completed) and other teams that tag extensively, identifying things like when hypotheses about the contributing factors are raised and proved/disproved, when updates are provided to external stakeholders, sudden changes in system behavior, or actions that were taken to minimize impacts.
> **Tagging is often an iterative process:** The goal is not to be comprehensive in your tagging at the start; that’s a lot of pressure to take on and may not be necessary. Instead, think of tagging as a way to organize and hone your investigation. As we’ve mentioned before, the extent of your tagging and annotating will depend on how much time you have, how many people are involved in the investigation, and how deeply you want to explore the event.
You may only have time for the first pass; if you’re able to spend more time tagging, you may be able to gather additional insights into your incident. There is no right or wrong—tagging is a process to help you see more in an incident. As you hone your skills as an investigator, you will improve your ability to draw out deeper insights from the data you collect.
Two basic tags that help support moving quickly to your next steps are marking any messages or events relating to how you’ll tell the story of what happened with “narrative” and tagging anywhere you have a question for someone who was a part of the event as “participant follow-up”
> **What is the narrative?:** A deeper analysis goes beyond simply recounting what happened in a basic chronological timeline. Instead, try to recreate the event as it happened, walking through the progression of the event and identifying what made it challenging or easy to diagnose and resolve.[6](/ops-guides/howie-guide/authors#references) Investigators who recreate the timeline by creating a narrative about what happened tell a story that allows for complexities and confusions to become apparent. This allows readers of a post-incident report (or participants in a learning review meeting) to get more actively engaged with the investigation since it tells a richer, more compelling account. Readers can imagine the situation the way it happened, not in hindsight when the outcome was known and it is easily understood what should have happened. Learning becomes clearer when you go beyond a simple timeline.
Here are some examples of things you as the investigator can ask yourself to focus your tagging and lay out the narrative to take an analysis deeper.
### Look at what was happening at the beginning of the incident by asking yourself:
1. What did the responders think was happening?
1. Who joined or was recruited to help?
1. What information is available? What’s uncertain/ambiguous? Who is asking? Who is answering?
### Examine how the group was diagnosing the problem they face by asking:
- What were the hypotheses being put forward? *During this time there will be multiple hypotheses put forward, some of which endure and some of which will be quickly discounted or ignored (these are all signals you want to pay attention to).*
- Who is proposing hypotheses about the potential sources of the outage? *Seeing who proposes a hypothesis can be useful to narrow in on formulating a potential interview question for that person.*
- Who is helping to prove or disprove these hypotheses? *Most hypotheses are supported or disproved by others who provide evidence in the form of dashboards, log files, or specialized knowledge about how a piece of software works.*
- What action was taken? By whom? *Some actions may be taken to safeguard the system from further deterioration, others can be to gather more information or try to prove or disprove a hypothesis.*
- Was there any ambiguity or confusion about what was happening? *This is very common and is often a signal about the difficulty or complexity of the failure, not about the knowledge or skills of the responders.*
### How was the team working together and with others during the incident?
- Where are examples of successful coordination between different parties involved? *Incidents test practices and procedures and can identify opportunities for improvement or revisions to workflows.*
- Does a team proactively anticipate who will be needed to help resolve the incident and are able to easily bring them in? *Recruiting specialized skill sets is crucial for speedy resolution, especially in hard problems. A key factor to reducing mean time to respond is smoothing out this coordination.*
- Where are communication breakdowns occurring? *Are the responders able to share information quickly and easily?*
## Creating timelines
Incident timelines provide a way to orient a reader or learning review participant to what happened during the incident. Going beyond a text-based timeline and creating a more visual representation of the timeline allows you to see your incident from different points of view, craft stories (based on said points of view), and enhance collaboration. We recommend developing multiple timelines when you have the time to do so. This can allow you to focus a timeline to see the false-starts, red herrings, and progression of the event that can move past the idea that the incidents display a clean, forward progression between “detect, diagnose, and repair.”[7](/ops-guides/howie-guide/authors#references) Many find that creating a timeline also gives them an initial structure for organizing the multiple data sources that can sometimes get messy. You can create timeline visualizations of events, keywords, specific participants, and different data types.
## Making notes
As you work through the initial review of the transcript, you will come up with questions. If the question is specific to a particular message, you should leave a note for yourself or co-analysts to come back to it later and note who you want to reach out to for follow-ups.
An example of this practice would be if you see a message from a responder saying, “I actually think $SOFTWARE is involved so rolling back those changes should help.” You might want to tag this as part of the narrative (since it was a proposed hypothesis about what was causing the issue, along with a suggestion about what would help), as well as a participant follow-up tag and add a note to yourself to ask that person, “How did you know it was $SOFTWARE? What did you notice that made that a likely culprit? Why did you suggest the rollback?” This way you can compile your timeline from your narrative tags and start to arrange the questions you’ll answer in your next steps.
Some other examples of questions you may have are:
- How does this piece of technology work? What is the history behind it at this organization?
- Where did this work start?
- What was the business reason behind it?
- How did we know to reach out to this subject matter expert?
- How did we find this information?
- What sorts of pressures were responders under?
- What does this (acronym, reactji, etc) mean?
- Who else knows this?
## Identifying interviewees during your initial analysis
Reviewing the available data serves as an orientation to the event and sets the investigator up for deeper analysis if time and resources allow. After orienting yourself to the event through your initial review and tagging, you will have a general sense of who might be good candidates to interview.
### If holding individual interviews is not feasible, it is still beneficial to identify key participants you might want to call upon in a review meeting or to aid with reviewing any reports that are generated.
We’ve said it before, and we’ll say it again: analysis is iterative! As you work through reconstructing what happened and talking to participants, new sources of information will become available. As you review this new information, it may drive more questions to be answered.
A great example of this comes from an incident review one of the authors was leading. In the review meeting the investigator asked a participant how they noticed the source of the problem. It turned out this engineer had dealt with the issue so many times before that they set up a dashboard to monitor it and ping them when there was trouble!
When this was shown to other engineers, it generated a detailed discussion about the piece of software and the variability of its performance, and it identified other “explody bits” that other engineers felt were unstable and monitored more closely. In this way, as new information becomes available you may need to return to previously interviewed participants to follow up.
---
URL: https://docs.pagerduty.com/ops-guides/howie-guide/appendices
# Appendices
As mentioned at the start of this guide, the Howie process can be adjusted depending on the specific context of your team, your organization and the goals for
## Appendix A: Using the Starter Guide to adjust the Howie process to fit your organization
As mentioned at the start of this guide, the Howie process can be adjusted depending on the specific context of your team, your organization and the goals for introducing or improving an incident analysis program. Here are two examples from companies that have adopted a Howie process:
### Large company developing their first company standard
BoomBox, Inc. was a large multinational company with a centralized dev tools team that sets the standard for how to do incident analysis within the company. While some individual development teams were already doing a brief root-cause analysis after an outage, the core group wanted to introduce a standardized incident review process to maximize the time spent in reviews. To give their dev teams some guidelines without being too prescriptive, they adapted the full Howie process to help their dev teams get started. They rolled out this adapted process to begin building the muscles of doing consistent reviews in a lightweight way.
As they get more buy-in, they plan to introduce more steps (the dotted lines) to their analysis process to get deeper insights, involve more of the company by interviewing, and focus on sharing the findings more broadly outside of involved teams.
### Mid-size company improving their existing practices
FastMover, Inc. is a growing company with a strong culture of continuous improvement among their many autonomous dev teams. The teams regularly hold post-incident reviews, but they wanted to get better at them by emphasizing collaboration and engagement. They adapted a Howie process to introduce analysis with Jeli, interviewing, and using the calibration document and training facilitator to make the most of their meetings.

## Appendix B: Introducing a new investigation process
Organizational change management is a critical aspect of introducing a new investigation process. Give your new process the best chance of adoption by communicating its intent, how it will impact the company and how the reader can provide support or get their questions answered. This aspect of introducing new practices could be its own guidebook! We encourage you to learn more about how to understand the needs of individuals and teams within your company, develop the practices to best support them, influence change and create sustainable performance improvements at your organization.
At a minimum, as you introduce this new process for the first time, have some verbiage and documentation ready to share, as folks may be unfamiliar with this new approach to incident analysis. We often use the following:
*We are improving the “after the incident” phase at $COMPANY and taking new approaches to the “after the incident” phase—specifically focusing on incident analysis (learning from incidents), and getting the most learnings we can out of incidents.*
*An important thing to remember is that we are at the beginning of how we handle the “after the incident” phase. What we’re doing with this phase now will help shed light on how we are doing as an organization and how we can improve.*
*As we roll out more comprehensive investigations, you’ll notice they have the title “X” to specifically focus on how we got to this specific incident, including digging into historical incidents and decisions made at $COMPANY.*
### Q: What are the components of a strong incident analysis?
1. Incident occurs
1. Investigation assigned
1. Investigation accepted
1. Initial analysis by investigator to identify interviewees and insight generation
1. Investigator analysis of disparate sources
1. Individual interviews
1. Calibration document (align with participants on the event)
1. Facilitated post-incident meeting
1. Report/incident dissemination
1. Action items meeting or document
*If you have any questions on what we’re doing/what the plan is (in the meantime), please reach out to @$PERSON and we can chat.*
## Appendix C: Handling Concerns & Objections
These are some frequently asked questions you might get when sending out any communications on your investigation process changes.You can edit and adjust these to match your company’s needs, then make this a pdf and attach it to an email or share it internally.
**This is a much more thorough and clearly interesting approach than what we have been doing, but how will this new approach to incident analysis scale? Doing this sort of investigation takes much more time than we’re used to—we can’t possibly spend this much time doing it for every incident we have!**
Yes, doing a strong incident analysis for each and every incident that occurs at $COMPANY wouldn’t be feasible! But there are two parts to this answer:
- Taking this different approach to analyzing incidents will get easier and more efficient over time because doing this involves expertise. Doing this work effectively is the same as with software development—a more experienced engineer can write more valuable code in less time than a novice engineer.
- Different incidents warrant different levels of analysis. Incidents are much more unique than they are typically understood to be. Therefore, the time/attention/effort to analyze them should be relative to their potential to reveal insights about $COMPANY’s practices, systems, history, expertise, etc.
In other words, we don’t want, nor need, to do the same level of analysis for every incident. The challenge we face is to develop the skills to recognize which incidents have a greater potential to reveal valuable insights and which ones don’t. For those that do, we’ll squeeze as much as we possibly can out of them. For those that don’t, we won’t.
**What are elements or qualities of an incident that signal high potential value and warrant a “stronger” investigation?**
There is no prescriptive formula for this, and we will get better at recognizing these as we become more experienced, but here are some examples of incidents that might deserve more attention (this is not a complete list!):
- There were multiple (> 2) teams involved
- A new service or interaction took part in the event
- It involved misuse of something that seemed simple or uninteresting (hint: there’s usually more to dig into here (e.g., expired certs)
- The event involved a use case that was never thought of—indication of a surprise
- The event was almost really bad
- It looks like a repeat incident
- There is a lot of discussion around the incident
- There was confusion in or around the event
- The incident took place during an important event (e.g., an earnings call)
- There is an interest in investigating it further (there is no prescriptive formula for this)
**What’s the story with follow-up/action items in this new way of doing things?**
All incidents produce an organizational drive for ‘improvement’ and our company is no exception to this. As Todd Conklin of The Pre-Accident Investigation podcast said, “The problems begin when the pressure to fix outweighs the pressure to learn.”
Research has shown that when action items generated in a post mortem meeting they can distract from exploring and understanding the event in a more valuable way and are often rushed and not fully thought out. As a result, many action items are either dismissed, completed but not valuable, or forever remain on a backlog because, upon some further reflection (“soak time”), people who initially suggested them may realize that they were not likely to produce the effect they intended when they came up with them.
After separating the creation of action items from the learning part of the meeting itself, the postmortem meeting is then dedicated to developing a deeper and better understanding of the incident, and attendees commit to taking some (short!) time to consider what countermeasures or action items are likely to be genuinely valuable. The collection/collation of these ideas can even be done asynchronously in a day or two after the group meeting.
It’s recommended to remind attendees at the beginning of meetings to keep a running list of notes about potential action items as the meeting unfolds and use these notes as fuel for dialogue with their teammates and consideration for formalizing them after the meeting.
**What happens if my team is involved in an incident that is chosen to be analyzed via this new way?**
All of the people involved in the incident will be engaged in both the preparation for the post-incident meeting and the resulting document based on that meeting. The people involved in the incident will still be involved in this process and will be actively consulted to ensure that the artifacts the investigators produce are technically accurate and that people involved in the incident are being well-represented. Generally speaking, what you can expect might happen includes:
- 1:1 interviews between an investigator and an incident responder (or someone related to the incident). The investigator might ask you questions like: What happened from your perspective? How was it noticed? How was it handled?
- All of these questions will be asked with the goal of understanding what happened and how we got here.
- All people involved in the incident or experts in a system involved in the incident will be contacted after the initial analysis from the investigators. This contact will be done prior to the postmortem meeting to ensure that what the investigators are understanding is technically correct.
- All people involved in the incident will be invited to the postmortem meeting and are encouraged to participate and contribute to the discussion—this is not a presentation, but rather an opportunity to learn more about the incident and develop a deeper understanding of the events leading up to it and the themes that the event brings up.
- The postmortem meeting provides a forum to discuss some of these themes.
- The investigators will come up with a report. The report will be shared with folks involved in the incident prior to sharing it more broadly—the folks involved have the opportunity to engage with the report, shape the report, and use the report as a way to stimulate discussion about potential action items that they may want to add (even after the report is published).
---
URL: https://docs.pagerduty.com/ops-guides/howie-guide/assign
# Assign
When your team or organization has had an incident it’s ideal to mobilize your investigation process as quickly as possible to extract as much learning as you

## Assign the investigation
When your team or organization has had an incident it’s ideal to mobilize your investigation process as quickly as possible to extract as much learning as you can from this unplanned event.[4](/ops-guides/howie-guide/appendices)
Investigations need to be assigned to someone in particular. Though they can be collaborative, it’s important that one person be responsible for moving the investigation forward. Assigning someone upfront also ensures that you’re picking someone who has the capacity to take on an investigation and is in a good position to do so.
First, assign an investigator who will own the responsibility for the investigation all the way through the process (from initial analysis through distribution of findings). While this step may seem straightforward, not everyone will be a good match for every investigation.
### This person:
| Should... | Shouldn't be... |
| :-------- | :-------------- |
| Have a foundational level of knowledge of the components involved in the system | Someone directly involved in the response and mitigation of the incident |
| Be trained on investigation techniques, interviewing, and facilitating post-incident learning reviews | Untrained, inexperienced, or completely new to the organization |
| Be committed to establishing or reinforcing a post-incident process where participants feel safe | In a position of authority over participants and interviewees |
| Be able to dedicate time and attention to driving the investigation through to completion | |
## Why these things?
Someone with a foundational level of knowledge will be able to understand the technical issues involved. That person also being trained in investigation techniques, including knowledge elicitation[5](/ops-guides/howie-guide/authors#references) allows them to better surface information and ask better questions. Without someone who is committed to helping people feel safe, it will be difficult to get their perspective.
It’s not recommended that someone who was directly involved in the incident investigate it because that can unintentionally bias them. Being directly involved can also prevent an investigator from being seen as a neutral third party. Similarly, the facilitator shouldn’t be someone with authority over the interviewees in order to not create a fear of reprimand, concerns about looking unsure in front of management, or doubts around admitting to doing “the wrong thing,” all of which can limit the learning that takes place.
We understand that every organization is different, and they may not be able to find investigators who meet all these requirements (some companies may only have one team doing incident reviews, or a smaller startup may have everyone involved in every incident). If this applies to you, make sure to remind your team to take a third-party perspective.
## Accepting an investigation
If you’ve been asked to lead an investigation, awesome! We’re here for you. A few things to consider when accepting an investigation are:
### Do you have the time to handle your colleagues’ potentially challenging experiences with care and attention
A clumsily executed investigation can make things worse in terms of people’s difficult emotions in the aftermath of an incident. In order to determine if you have the bandwidth necessary, think of the length of the incident and the conversation surrounding it because you will need to become acquainted with the whole thing prior to starting the incident investigation.
It’s also important to consider the impact. Incidents with higher impact (e.g., it made the news, led to a large monetary loss) may be emotionally and politically charged, which can have an impact on participants and you as the investigator. It’s important that you’re able to be impartial and empathetic to the situation.
### Can you meet the deadline being set, or are you able to manage your workload to finish the investigation in a timely manner?
Some incidents will take a long time to give due diligence, you will have to balance thoroughness with prompt interviews (while the incident is fresh on people’s minds).
---
URL: https://docs.pagerduty.com/ops-guides/howie-guide/authors
# Authors & Acknowledgements
Thank you to all the Jeli Beans that helped support the launch of this guide, with long days put into section rewrites, editing, and re-reading for continuity,
## Authors
| Dr. Laura Maguire | Nora Jones | Vanessa Huerta Granda |
| :------------: | :------------: | :------------: |
| \{.circular_portrait\} | \{.circular_portrait\} | \{.circular_portrait\} |
## Acknowledgements
Thank you to all the Jeli Beans that helped support the launch of this guide, with long days put into section rewrites, editing, and re-reading for continuity, especially Daniela Hurtado, Emily Ruppe, MacKenzie Wardwell, Thai Wood, and Will Gallego.
Finally, we appreciate the support of all those who worked on this guide for review and feedback, this Guide would not have been possible without you:
- Danesh Abeyratne
- John Allspaw
- Morgan Collins
- Jessica DeVita
- Alex Elman
- Dara Garvin
- Fred Hebert
- Lorin Hochstein
- Ryan Kitchens
- Duck Lawn
- Yanet Leon
- Chris Mitchell
- Courtney Nash
- Tim Nicholas
- Laura Nolan
- Paul Osman
- Nick Stenning
- Noah Sussman
- Chad Todd
## References
1. Nora Jones, “Introduction,” Learning from Incidents (blog), November 25, 2019, https://www.learningfromincidents.io/posts/learning-from-incidents-in-software (retired). Similar content [https://www.pagerduty.com/blog/incident-management-response/learning-from-major-incidents-the-opportunities-were-missing/](https://www.pagerduty.com/blog/incident-management-response/learning-from-major-incidents-the-opportunities-were-missing/).
1. Gary Klein, Seeing What Others Don’t: The Remarkable Ways We Gain Insights (New York: Public Affairs, 2015).
1. Vanessa Huerta Granda, “Making Sense out of Incident Metrics,” Learning from Incidents (blog), May 28, 2021, https://www.learningfromincidents.io/posts/looking-beyond-the-metrics (retired) partially summarized [here](https://www.thevoid.community/blog?recordId=rec64p02RXaptKxs7).
1. DD Woods, “Report from the SNAFUcatchers Workshop on Coping with Complexity.” Snafu Catchers (Columbus: The Ohio State University, 2017), [https://snafucatchers.github.io/](https://snafucatchers.github.io/).
1. Nancy Cooke, “Knowledge Elicitation,” (New Mexico State University).
1. Sidney Dekker, The Field Guide to Understanding “Human Error” (Farnham: Ashgate Publishing, 2016).
1. John Allspaw, “Incidents as We Imagine Them versus How They Actually Happen,” Adaptive Capacity Labs (blog), November 5, 2018, [https://www.adaptivecapacitylabs.com/blog/2018/11/05/incidents-as-we-imagine-them-versus-how-they-actually-are/](https://www.adaptivecapacitylabs.com/blog/2018/11/05/incidents-as-we-imagine-them-versus-how-they-actually-are/).
1. John C. Flanagan, “The Critical Incident Technique,” Psychological Bulletin 51, no. 4 (July 1954), [https://www.apa.org/pubs/databases/psycinfo/cit-article.pdf](https://www.apa.org/pubs/databases/psycinfo/cit-article.pdf).
1. Robert R. Hoffman, Beth Crandall, and Nigel Shadbolt, “Use of the Critical Decision Method to Elicit Expert Knowledge: A Case Study in the Methodology of Cognitive Task Analysis,” Human Factors 40, no. 2 (June 1, 1998): 254–276, [https://journals.sagepub.com/doi/10.1518/001872098779480442](https://journals.sagepub.com/doi/10.1518/001872098779480442).
1. J. Paul Reed, “‘Blameless’ Postmortems Don’t Work. Be Blame-Aware but Don’t go Negative,” TechBeacon, July 29, 2021, [https://techbeacon.com/app-dev-testing/blameless-postmortems-dont-work-heres-what-does](https://techbeacon.com/app-dev-testing/blameless-postmortems-dont-work-heres-what-does).
1. Sidney Dekker, The Field Guide to Understanding ‘Human Error’. (Boca Raton: CRC Press, 2014).
1. Diane Vaughan, The Challenger Launch Decision: Risky Technology, Culture, and Deviance at NASA (Chicago: The University of Chicago Press, 2016).
---
URL: https://docs.pagerduty.com/ops-guides/howie-guide/calibrate
# Calibrate
After you’ve consolidated all your incident and interview data, you’ll want to calibrate with your interviewees and incident participants to make sure you

## Calibrate on your analysis
After you’ve consolidated all your incident and interview data, you’ll want to calibrate with your interviewees and incident participants to make sure you captured their input properly and there are no surprises during your meeting. You may do this by sharing your initial findings through sharing of notes or documents (including a draft of the incident report; we call this a “calibration document”).
Doing this gives everyone a chance to clarify their mental models as well as make additions or corrections to your investigation.
## The incident write-up or “calibration document”
We use a calibration document as a way of aligning with participants of the facilitated meeting about the event. This is not a final report; it is an interim findings document for interviewees to give the investigators feedback on the analysis and themes so far and comment on other topics that they’d like to include in the incident review meeting. This document can be used to start the final report.
The calibration document contains some information about what data has been reviewed to date, who has been interviewed, and what themes have emerged from this effort.
It should be shared in advance of the facilitated learning review to participants to add their comments and questions, which can help focus the meeting.
As you go through the analysis process, you’ll have lots of different pieces of raw data. You might have transcripts from chat, some interviews, or maybe some service logs. By itself, raw data doesn’t tell the story of what happened. That’s where an investigator comes in—to consolidate the data. This is typically something you do while you’re also collecting data and interviewing. Ultimately, you’ll consolidate data in a few different ways. First, you’ll start by identifying key themes, then you’ll use what you’ve found to help build a visualization, and finally, you’ll be able to refine that into a written document that will contain your findings.
As you work through the initial review, you begin to form an idea of the event and important aspects of the technical or coordinative difficulties faced. You can begin consolidating key themes as soon as they emerge from the data.
## Consolidation of themes
Think of your themes as the topics of interest that surfaced throughout the investigation: what surprised you, what do you think others should know more about, what is shared among other incidents.
These can be aggregated in a collaboration document. You may find yourself with more themes than you will have time to review during the meeting; in this scenario, you can ask those involved in the incident ahead of time to help prioritize the top two to five themes to be discussed.
## Consolidation of data as visual representations
There doesn’t have to be just one timeline; in fact, you should create different timelines based on different points of view. For example, you might have different timelines that represent how different practitioners experienced the event.
In addition to point-of-view timelines, you should also build a narrative timeline. This timeline will show key moments in the event, which you can use to facilitate your incident review meeting. This timeline can include things like when the first alert happened, when the issue was escalated as a major incident, when experts were recruited, when troubleshooting steps were taken, when hypotheses were developed or disproved, when impacts were noticed or changed, and anything else that you feel helps tell the story of the incident. This will allow you to walk through that story while asking for feedback from those individuals involved.
## Consolidation of data in a write-up document
Many organizations use some form of incident write-up to communicate the findings of the investigations. These may be in a document or take place within another kind of software system (like JIRA or OpsGenie).
We see this as a two-part process: First, producing a calibration document, followed by a more complete “how we got here” document. The first document will be used to ensure folks are on a similar page coming to the learning review meeting, while the second document adds to it with the findings from it.
Make sure you give others sufficient time to review and reflect on the document so there are no surprises during the meeting itself. It may help to ask specific questions when sending out this document in order to prompt feedback (and avoid folks only briefly glancing at it before the review meeting). You may ask:
- I want to make sure I captured this part properly; will you please review and let me know your thoughts?
- Are there any items that are missing from this document that we should discuss?
- Is this technical detail correct?
---
URL: https://docs.pagerduty.com/ops-guides/howie-guide/closing-thoughts
# Closing Thoughts
At PagerDuty we believe in the power of taking a proactive approach to incident analysis to help you truly understand how you got here.
At PagerDuty we believe in the power of taking a proactive approach to incident analysis to help you truly understand how you got here.
We believe that incident analysis can be your organization’s secret weapon that will allow you to gain value from your incidents. We understand that good incident analysis is an investment, so we hope that this guide will help you push toward that change.
We also believe that the information laid out here will continue evolving. We will continue releasing additional materials to help you understand and apply the concepts in this guide as well as publishing revisions as the landscape changes.
## Thank you for reading!
---
URL: https://docs.pagerduty.com/ops-guides/howie-guide/continued-learning
# Continued Learning
Developing skills as an investigator and analyst is an ongoing process. Below are some resources to help you level-up your game.
## Continued Learning
Developing skills as an investigator and analyst is an ongoing process. Below are some resources to help you level-up your game.
[Etsy’s Debriefing Facilitation Guide](https://extfiles.etsy.com/DebriefingFacilitationGuide.pdf)
A comprehensive guide for facilitators developed by John Allspaw.
[Two Views on Human Error](https://www.youtube.com/watch?v=rHeukoWWtQ8)
Dr. Johan Bergstrom from Lund University discusses two views about human performance and error common in safety sciences today.
[The Three Traps in Accident Investigation](https://www.youtube.com/watch?v=TqaFT-0cY7U)
Dr. Johan Bergstrom from Lund University describes how investigators can misrepresent what really happened during an incident.
[Resilience Engineering Repo](https://github.com/lorin/resilience-engineering)
A well-curated repository of papers and talks associated with resilience engineering.
The [introductory guide](https://github.com/lorin/resilience-engineering) is a good place to start.
[How Complex Systems Fail](https://how.complexsystems.fail/)
[The Error of Counting “Errors”](https://pubmed.ncbi.nlm.nih.gov/18407373/)
[Laura Nolan’s Incident Review Catalog](https://slack.engineering/slacks-outage-on-january-4th-2021/)
---
URL: https://docs.pagerduty.com/ops-guides/howie-guide/distribute
# Distribute
Your work shouldn’t be completed to be filed. It should be completed so it can be read and shared across the business even after the learning review has taken

## Distribute the findings
Your work shouldn’t be completed to be filed. It should be completed so it can be read and shared across the business even after the learning review has taken place and the corrective actions have been taken.
The findings can be integrated into company newsletters, blog posts, or synopses presented at weekly or regularly scheduled team meetings. It’s important that people in different roles get a chance to learn from the incident as well. While your incident may have primarily involved folks from engineering, everyone can benefit from the knowledge uncovered in an investigation. Also, having it available in different venues creates more opportunities for learning. Unless the report is read and utilized, learning can’t occur; just writing doesn’t guarantee learning across the organization.
> **PD on PD:** [Read more](https://www.pagerduty.com/ops-guides/using-pd/ai-data-engineering-team/) on how PagerDuty uses our Insights Report and weekly on call hand-offs to look for patterns in incident data, and then adjust orchestration rules.
Analytics or time-stamped commenting processes can be used to watch how and when the document is utilized long past the initial event. Knowing how (or if) people engage with the items you produce can help inform future reports. It can also give you insight into the things people are seeking to learn.
> **Tip:** Investigation reports can become training documents, inform chaos experiments, serve as professional development and refresher training, and help enable meta-analysis across incidents.
## Is it ever done?
As you can see, there is a lot that goes into incident analysis and infinite learnings to uncover from a single incident. So, how do you know when to end your investigation?
In 1996, Diane Vaughan released a book titled The Challenger Launch Decision: Risky Technology, Culture, and Deviance at NASA.[12](/ops-guides/howie-guide/authors#references) This book centers around the 1986 space shuttle Challenger disaster and the normalization of deviance that led to that fateful decision to launch. Vaughan spent almost nine years researching, writing, and editing what some would call a manifesto; the pinnacle of incident reviews. She realized that a great analysis of an incident can be iterated upon and researched thoroughly over many years. The work is never truly done.
As a practitioner of incident analysis within your organization, you probably won’t have nine years to review your incident (even the one that took your entire web server down for hours!). At some point, you want to complete your investigation. The good news is that you can complete an investigation while letting others continue to contribute to it and learn from it. When closing your investigation and finishing your incident report, you want to ensure that it is read and, if needed, iterated upon in the future. As more people read the document, more information becomes available. Creating “living documents” that can continue to grow and represent new knowledge and experiences will maintain their relevance and value to your organization.
> **PD on PD:** The Post-Incident Review is probably not the end of many of your incidents. Link Action Items to the Post-Incident review for future readers to follow the progress of improvements. Read more on how PagerDuty's [Engineering team tracks Actions](https://www.pagerduty.com/ops-guides/using-pd/jeli-analysis-engineering-team/) and how our [Integrations team uses Workflows to promote continuous learning](https://www.pagerduty.com/ops-guides/using-pd/integrations-team/).
### So go ahead, hit send, and watch your investigation take a life of its own!
---
URL: https://docs.pagerduty.com/ops-guides/howie-guide/identify
# Identify
The first step is to collect incident data. Think of what data sources will give you contextual information to help you get started with your incident; chat

## Identify incident data
The first step is to collect incident data. Think of what data sources will give you contextual information to help you get started with your incident; chat transcripts, organizational charts, information about those individuals involved in the incident. Contextual information is the relevant background needed to make sense of the event. Things like: what teams are participants on? How long have they been at the organization? Who do they typically work with? What systems do they typically work on? How long have they been on-call for these systems? You may already be collecting this information in a document, pasting it into a Jira ticket, or keeping old-school printouts.
It’s common for incident data to be spread across multiple communication chat channels. Take a look at the main incident channel and keep track of key players and their roles. Scan any potentially relevant channels (shared user or on-call channels, general company channels, or specific component channels) to see if the incident is mentioned or search using keywords/ticket numbers. If you find something, make a note of the channel, and capture relevant messages.
> **How PagerDuty Does It:** Check out how PagerDuty Engineering [automatically pulls data into Post-Incident Reviews to learn from Major Incidents](https://www.pagerduty.com/ops-guides/using-pd/jeli-analysis-engineering-team/)
---
URL: https://docs.pagerduty.com/ops-guides/howie-guide/interview
# Interview
So far you have consolidated the existing data from tools used in everyday software engineering work to make it quick and easy for you to understand who was

## Interview incident participants
So far you have consolidated the existing data from tools used in everyday software engineering work to make it quick and easy for you to understand who was involved and what responders did during the incident. However, that data only tells part of the story. A lot of incident response happens offline: in direct messages, in face-to-face conversations, and, importantly, within the heads of those involved as they reason about what is happening and why!
Interviewing the participants involved can help elicit more details about what was confusing and why, the event, the response efforts, and surface important knowledge about the system (which includes the technical architecture but also teams, company culture, and communication patterns). Talking to different people involved one-on-one will expose the differences between what they believe happened and why. Often these deltas are used to run the most productive incident review.
This section is built on methods from critical incident technique[8](/ops-guides/howie-guide/authors#references) and critical decision method[9](/ops-guides/howie-guide/authors#references) for investigating incidents. It covers deciding who to interview, conducting the interviews, and working with the data collected after the interview.
## Deciding who to interview
We are rarely given unlimited time to conduct an investigation, as many organizations seek to complete their investigations within a given time window or require the findings from the investigation to inform immediate work. Therefore, you’ll need to decide how to use your time to provide the optimal insights for your investigation.
Who you will interview and how many people you will interview depends on several factors like interviewees’ availability, the time you have to complete the investigation, and the amount of relevant new information you get from each interview.
Your initial analysis will help you identify high-value interview subjects. As you work through chat or audio transcripts, you’ll notice key players. This often includes people who are leading the response (formally as incident commander or informally), who bring key insights (like relevant hypotheses about the problem), add important context (to validate/invalidate a hypothesis or to bring a broader perspective to the problem), or manages stakeholder relations that could impact response efforts (such as providing updates to leadership or customers to keep them in the loop). Don’t worry about compiling the most comprehensive list of participants right away. As you conduct the first batch of interviews, you will learn about additional participants that you’ll find are important to interview. Some suggestions for who could be interviewed are:
- Key players in the event – did they have a leading role or were they heavily involved in the detection, diagnosis, or resolution of the incident?
- People that might feel blamed – interviewing these participants can help alleviate fear and make sure their perspectives are accurately represented in the investigation.
- People that weren’t expected to be involved (people that weren’t on-call) – these participants can be critical sources of expertise and their involvement evidence of resilience within the system.
- People that were “lone wolves” (taking action independent of the group efforts) or exist on “islands of knowledge” (they were the only one who knew what was needed to resolve the incident).
- Owners (or former owners) of the impacted system.
- People who hold subject-matter expertise on the systems or components involved in the incident.
- Person that wrote the work ticket that prompted the person to write changes related to the incident.
- Person that wrote said change.
- People that are new to the organization – these participants can help surface hidden assumptions or contradictions.
You will find that interviews reveal interesting details about the system of work in general. You’ll gain context into organizational change efforts that may have contributed to the event, team dynamics that help or hinder coordination, or external forces that force tradeoff decisions in the moment. As an investigator, you will face important decisions about how to integrate these findings into your analysis. It’s necessary to include some of these details to place the decisions and actions into the broader context of how work happens in your organization. Manage your time constraints by stopping your interviewing when the amount of relevant new information drops off noticeably.
## Sequencing
Knowing who to interview can help you as an investigator in managing your time. It is also important to consider how to schedule your interviews. Start with the “high-value interview” participants—the ones you think will give you the greatest context or the highest signal-to-noise ratio. That way if you run short of time you’ve targeted the key players.
Investigators often struggle with trying to schedule participants for follow-up conversations, so it’s likely that availability of participants may drive your interview schedule, so be flexible and ready to ask your questions when a participant has time!
Some additional tips for sequencing interviews:
- **If two interviewees are related in some way (for example, an engineer recruited a customer service agent into the event) start with the person who had the higher involvement or will have the most knowledge about the event.**
- **It’s common to have to loop back to follow up with a participant after your interview if new information comes up in other interviews or during other parts of your data collection. You may wish to do this via direct message or email instead of a second interview to save time.**
## Length
How long you spend talking to a participant can vary depending on the interviewee’s role in the event. We recommend a minimum of twenty minutes, but don’t spend more than sixty minutes in a single session. In any case, you should respect your interviewee’s other commitments, and plan the duration accordingly—it’s better to finish early than run long.
## Approaching interviewees
Incidents can be emotionally charged events in an organization—especially if there was substantial impact or the event was very public. Be conscious of the fear of being blamed when reaching out to participants for follow-up. Some people may be defensive or avoidant.
We recommend sending an informal email or direct message first to introduce yourself and the purpose of your outreach and to let them know you’ll be sending an invite. Give them an opportunity to ask questions and, if you sense hesitation, reassure them the discussion will be confidential.
Send a calendar invite for a discussion or chat. Calling it an interview can be intimidating to some interviewees (it can come across as an interrogation or investigation). Include the details about the incident you are investigating and some information about how you are conducting the investigation (we’ve offered some guidance for what to say in the Appendix). Always give the option to opt out.
If the incident was contentious or difficult and you are not familiar with the interviewee, it can be useful to have someone who knows them (a colleague or manager) send an introductory message to help you build trust and rapport.
## Preparing for the interview
Your preparation begins with analyzing the full scope of all the communication channels used to conduct the incident response (these may include chat transcripts, call recordings, etc.).
Review the participant’s contributions in the channels, look at their team and tenure information, see who else from their team participated, and perhaps follow up on how they had participated in similar, previous incidents.
There are many different ways to conduct an interview. It may be informed by the nature of the event itself, personal preference, and the desired outcomes. As you develop more skills in interviewing, you will adjust your style. To start, consider the following:
- If you are new to interviewing, it helps to conduct interviews in pairs until you get more experience. It is cognitively demanding to be asking questions, listening for answers, capturing answers, and thinking of your follow-up questions simultaneously. Recording the interviews can help you revisit the answers, but shorthand notes will help you be more efficient in your analysis.
- Review your corporate policies about collecting and storing video and audio recordings of your colleagues.
- Pair with someone to scribe, who has also conducted interviews, to record the participants’ answers. Having access to scribe notes can help you as an interviewer review earlier discussion points as the interview progresses.
- Encourage the scribe to aid the lead investigator with follow-up questions (over chat) or to jump in directly with questions.
- If conducting a virtual interview, have the scribe turn their camera off and mute their microphone so it’s not distracting that they are taking notes. Conversely, the scribe can take notes by hand.
- If you do not have a scribe but are able to record the interview; make use of online transcription services to quickly and easily get a written record of the interview.
- Be mindful of time and your objectives with the interview. While open-ended questions give us broad context, they can run down your time, so if you have specific questions to ask make sure to leave enough time for them.
- Keep in mind that having a broad selection of threads to pull gives lots of places for insight during the learning review.
## Kick off the interview right
As you start off your interview, you will want to make sure you are ready and bring any materials you have analyzed, including notes and charts.
Here’s the pattern we always follow to get the conversation started smoothly:
1. When you start the discussion, introduce yourself and your scribe (if you have someone helping you take notes).
1. Explain what you are doing with the interview, that multiple perspectives help form a more coherent picture of what happened.
1. Say that you would like to record the interview so you can faithfully represent what they share with you.
1. Ask for the interviewee’s consent to be recorded, but make it clear who will be reviewing the recording and how long you plan on retaining it.
1. Let them know if they want something off-the-record, you can stop the recording. In this case, none of the materials should be attributed to the interviewee but may be used as a jumping-off point for further investigation.
1. Explain to them the broader process of the investigation so they know how they fit into the bigger picture (that this interview will be part of the broader analysis that will get developed and distributed for feedback as well as shared with a larger audience).
1. Ask them if they remember the incident. The interviewee may not recall it well if it was a long time ago or they’ve been in multiple incidents since then. Ask if they need a refresh on the incident (you can either give a brief synopsis or have them review the channel).
1. Highlight the qualities of the incident that made it an attractive target for investigation.
1. Explain this is not about corrective actions
1. Ask if they have any questions before you begin.
> **Tip:** Note: Productive interviews usually have a talking ratio of 5:1 (interviewee to interviewer). Your job as the interviewer is not to show knowledge of a situation (even if you do know about it), it is to extract what the responder knew about it.
To help interviewees feel comfortable with you and reorient themselves to the event, it is useful to start with general questions like:
- How did you first get brought into the event?
- What was your understanding of the situation as you were pulled in?
- From your perspective, can you explain what happened in the incident?
These questions can help get your interviewee talking in a natural way, allow you to find natural openings to ask about specific parts of the event, and can even provide you with a summarized point of view that is different from the one you arrived at during your initial analysis.
## Getting more specific
Use details of the incident that you noted in your review of the transcripts to drive your questions. These are often things like:
- How did you get notified of this incident?
- What did you mean by $X?
- Tell me about the ordering of events?
- At one point you said: “$X”— what did you mean by this?
- At what point did you discover $POTENTIAL_MITIGATOR OR $POTENTIAL_ TRIGGER?
- What dashboards were you looking at? What were you searching for in $logs $dashboards? Can you show us?
- What was your comfortability with assessing the situation? How long have you been here? How have you seen things done?
- Are you frequently on-call or responding to things like $X? Is anyone on-call for $X? How did you feel it went?
- What surprised you in this incident?
- How did the shape of the incident response take place?
- Have some specific questions ready (the ones you tagged as “participant follow- up”) but also allow the conversation to flow naturally.
- Ask for clarification as needed—better to have them over-explain something you know than to make an assumption.
- Ask for further clarification when interviewees share their opinions or counterfactuals.
## After the interview
Go back through the interview notes and tidy up any sentence fragments, add context, and clean up typos. Spend a few minutes reflecting on the themes that emerged for you. You may want to identify ones that seem strong and ones that were weaker or would need further follow up. This should include any questions that remain unanswered or aspects of the event that are still unclear to you. This will help narrow your follow-ups. Identify anyone you’d want to interview next or if there are further questions to a previous interview. Begin your outreach immediately to keep the investigation moving forward. Link any supporting materials (including video recordings or transcripts) to your interview notes or documents you’ve begun compiling. Distribute the interview notes to co-investigators (as appropriate; you will want to be careful to not violate the privacy of your interviewee). Touch base with the interviewee later the same day or shortly after with a casual note like: “Thanks, I appreciate your insight, it is clear you have a lot of expertise in $X. If any additional thoughts come up, please send them my way.” Continually provide updates to keep them in the loop and engaged in the process.
---
URL: https://docs.pagerduty.com/ops-guides/howie-guide/meet
# Meet
The incident review meeting is a facilitated opportunity to discuss, for the first time and as a group, how things happened, what unfolded, what was

## Meet to review learnings
The incident review meeting is a facilitated opportunity to discuss, for the first time and as a group, how things happened, what unfolded, what was surprising, themes identified, and what is unclear.
This meeting itself is data that will be used for the incident review report. Everyone that participated or was impacted by the incident should have a calendar invite for this and anyone else should be able to request an invite.
## Preparing for the meeting
To help the meeting go smoothly and to maximize learning in the time you’ll have, you’ll want to do a little bit of prep-work.
First, ensure any documents, screenshots, or materials you will use during the meeting have been reviewed by key participants and their feedback has been acknowledged and integrated.
Identify participants you’d like to speak with during the meeting. Remember that your role is to facilitate the sharing of knowledge and expertise among the group—use the experts themselves to describe what you learned. Reach out to them before the meeting and ask if you can call on them to explain something or describe their experience. Try not to catch people by surprise in the meeting, this can lead to defensiveness and limit learning.
Now you can lay out your agenda, circulate materials to all participants with sufficient time to review. This will allow everyone to come prepared, understanding how the meeting will flow and get a preview of what they’ll see.
After the meeting, you can generate a brief three-to-four-question survey to circulate in order to capture the participants’ experiences and suggestions for improvement.
## Who should come to this meeting?
It’s important for those who were involved in the incident to attend so they can share their perspective and recount their experiences where possible. Schedule the meeting to include as many key persons as you can.
That doesn’t mean that those are the only people who should attend, though. You can also invite other participants; for example:
- Dependent service teams
- Engineers from related (but unimpacted) parts of the business
- Impacted users
- Customer success/advocate roles
- Management
- Key stakeholders
Ultimately, you should invite whoever is interested! Multiple diverse perspectives are crucial to making the learning review as comprehensive as possible.
Folks attending an incident review for the first time may be unsure of their role. As you will be the facilitator, you’re in a unique position to be able to guide them! You should remind participants to be ready to:
- Communicate what happened from their point of view, how they experienced the incident, and how it impacted them.
- Listen to other parties; their experiences may be different from one another’s. That’s ok because it’s how we all learn.
- Be open to discussion and collaboration. Don’t assume any one answer or solution is the right one.
- Ask questions. If they don’t know something, odds are somebody else in the call feels the same way.
- Think of how this incident can tie in with other events at the organization; feel free to share these insights.
## Suggested agenda for the meeting
Here’s a sample agenda you can use as a guide to circulate prior to the meeting.
- Intro/opening remarks to set context
- Structure of the process
- Narrative—this should be an interactive summary of what happened (calibrate)
- Themes from the interviews/questions we still have (keep these to two to five themes per incident, even if the calibration document goes through more)
- What’s been done so far?
- Next steps—(or scheduling an action items meeting)
## Running the meeting
We’ve talked so far about getting ready, you’ve figured out who to invite, and sent them an agenda with materials in time for them to review it. Now you’re ready to actually facilitate the meeting.
We’ll walk you through the process step by step, starting with the introduction and some ways you’ll want to open the meeting.
### Intro and opening remarks
You’ll want to set expectations. If you’re recording the meeting, make that clear and explain why. As part of those expectations, you’ll want to explain the ground rules. Here are some we recommend, feel free to take or leave them as you see fit. We’ve included our recommendation as a script for you in order to make it easy; this way, if you need a reminder or are unsure, you can start by reading the following out loud:
“The meeting is intended to be blame-aware; we recognize that everyone works with constraints and sometimes those don’t appear until after an incident, we acknowledge our tendency to blame and name names and move past it in order to be productive.[10](/ops-guides/howie-guide/authors) We will avoid counterfactuals[11](/ops-guides/howie-guide/authors) and remain respectful of each other’s knowledge and experience.
The objective remains how to constructively help us get better at working together to solve the often-challenging problems we face.
One of the key discoveries in learning reviews is that different responders have different knowledge. A big part of this meeting is to have an open discussion that lets us share that knowledge and identify other potential knowledge gaps to increase learning.
We don’t want to get too into the weeds. If a very specific technical conversation is better suited for another meeting or time, I’ll gently take note of it and set it aside (also known as “steer it to the parking lot”).
This meeting is also not about corrective actions; again, these are important but will go to the parking lot for tracking to be dealt with in the action Items section.
Although this meeting is for sharing the findings, we will be asking different participants to recount their experiences or share the knowledge they contributed to the meeting. Because of this, the meeting may not follow the same structure you are used to.
You may wish to have participants write down the questions they have about the event and things they want addressed (and circle back to see if they got answered).
Start with an overview of artifacts studied (prior incident tickets, design review docs, meeting minutes) and methods (overview of the analysis process), number and scope of interviews, and how your analysis has been conducted.
Provide a narrative overview of the event. This is a short description of what happened and who was involved; include your interviewees in the narrative and have them explain from their perspective.
Next, you can address background knowledge gained during the investigation by having a subject matter expert provide some context on how the tech works so participants can learn about parts of the system they may be unfamiliar with and update their mental models.
After that, provide an overview of the themes, then ask for commentary from folks involved. Some themes may generate more commentary than others—that’s perfectly fine! Once you’ve gotten some commentary, you can choose some of the themes to take a closer look at.
As you wrap up, ask what questions may still be unresolved. If there are none from the group, you may wish to share some from the investigation. Ask the “naive” questions; while we encourage participants to do so, they may not always feel comfortable doing so.
Next, to help everyone get on the same page, state what has been done so far.
Finally, discuss the next steps. This may include scheduling an action-items meeting or moving to that section of the meeting.
### Priming the discussion
The aim in the meeting is to have participants talk more than facilitators. To do this you may need to prompt different participants (as noted previously, be sure they are aware in advance that you’ll call on them!).
Some ways to generate discussion are:
- Ask some of the responders to describe the incident narrative; you may use the timeline you created to prompt discussion.
- Call on some of the subject-matter experts to explain how different parts of the system work.
- Have some of the impacted stakeholders talk about what went well and what was difficult for them (where constructive).
### Closing remarks
- Get people excited about seeing the final write-up, let them know when to expect it and how they can help make it a living document!
- Invite participants who may not have previously seen the document to provide their input.
- Let them know what other events are being investigated with the Howie process.
- Solicit feedback to encourage participants to give their comments on the process. You may wish to reach out to individuals for feedback. Getting feedback from readers helps improve future write-ups, clarify any concerns, and engage participants. Some questions you may wish to ask are:
- Was there something in this that strikes you as different from the “expected” way you’ve seen post-incident write-ups?
- Is there any information we should add?
- Will we get pushback on things in there?
- Will we get pushback on things not in there?
- Anything in there that you didn’t know before about (team, component, business unit), and if so, what?
- Is it easy enough to read that it keeps your interest after the summary bits at the top? (If not, what might make it more compelling?)
- Does this writeup lead you to ask more/different questions about various bits that are involved? (If so, what are they?)
An alternative to a 1:1 follow-up is to circulate a brief [two-to-three-question survey](https://docs.google.com/forms/d/e/1FAIpQLScUzBjTNYg8Nny_wBZpV-ihGF6goRq07ZF-EmoovPShrUrK3w/viewform).
### Action items/countermeasures meeting
Some guides recommend splitting out the action items meeting from the learning review. The purpose of this second meeting is to review any next steps or follow-up items raised during the incident review or during the investigation itself. This meeting is where you generate your work tickets, assign that work to responsible parties, and track progression to help improve coordination of your teams and the components in your system. While we agree in theory that this is a useful practice, we’ve found that many organizations struggle to hold even just one meeting. Therefore, we offer a compromise for those who will only have one review meeting and need to include them.
An effective approach we’ve seen is when teams make the action items discussion the last section of their meeting. To avoid discussions of remediation creeping into your learning review, an important part of your role as a facilitator will be to keep each part of the meeting distinct by reminding participants that the primary goal is learning. When an action item is raised, thank the speaker, quickly make a note of it, and let them know you will refer back to it at the end of the meeting.
The key to quality action items is collaboration, ownership, and reflection. Sharing the calibration document in advance allows participants to consider the right next steps and who would be the right group of people to work on them. This approach allows time for greater forethought and more pertinent outcomes instead of shallow action items that will sit in a queue. Teams owning the work should be part of this meeting. We recommend inviting product owners, engineering managers, and project managers so that together you can all agree on the work required and the optimal time frame to achieve it.
> **Tip:** Folks often think of action items as the end of an incident. However, your system is always changing and the action items of today can be contributing factors to the incidents of tomorrow. Therefore, refinements and learning are ongoing. This idea may be a tough sell for some organizations who just want closure from an incident. However, we believe a shift to continuous learning, along with integrating steps from this guide will better prepare you to adapt and handle future surprises.
## Retro your retro!
Incident analysis is iterative, both you and your organization will get better with time and practice. Keep in mind that what works for other companies may not work for yours and that is ok!
We recommend you spend a few minutes reflecting on what went well, what could be improved, and how to handle next steps from the meeting, including follow-ups and integrating the feedback from the meeting.
If you circulated a survey, the responses can be a great starting point for this. Your own experience as a facilitator is important too! Was there a part of the meeting you felt went particularly well? Perhaps an area you felt could have gone better?
This is also when you’ll want to go over any follow-up items that you may have generated and take care of those now.
---
URL: https://docs.pagerduty.com/ops-guides/howie-guide/report
# Report
It’s time to generate a final report that will remain the organizational record of the event. If you’ve followed other processes before, like the “5 Whys” or

## Report your findings
It’s time to generate a final report that will remain the organizational record of the event. If you’ve followed other processes before, like the “5 Whys” or the Google SRE model, you may feel like you’ve already done this, but there’s a difference. Here, you’ll be putting together a report that tells the story of how things unfolded, or “how we got here.”
When reports are one-dimensional, just a set of facts from a single point of view, they can be hard to learn from. We take a narrative approach to presenting the contributing factors to the event, background on the technology involved—including important historical context—and details about how the incident coordination was handled. It describes both the technical failures and the social and organizational processes involved.
Going beyond what broke and taking a broader view can make the investigation relevant to more people across different roles in the organization. For example, customer support can learn about what information is useful to provide during an incident or new engineers can get valuable background as part of their onboarding.
## Generate your “how we got here” report
So far, you’ve gathered data from multiple sources, consolidated it by extracting themes, created a visualization, and possibly even done some interviews. You’ve created a calibration report that represents the story of how the event unfolded from multiple perspectives. Now is the time to finalize the findings from your investigations. Many organizations have a formal report they generate after an incident. We suggest creating a “how we got here” document that is sent out to all the participants.
A “how we got here” is different from a standard postmortem in that it is primarily focused on the story of what happened and how the events came to be. The goal with a “how we got here” report is to learn from the incident. This template was developed with our colleagues at Netflix, Slack and Adaptive Capacity labs.
You may choose to start this document from your calibration document and add to it after your meeting.
[You can find an example of the How We Got Here Investigation Report here](https://howie-guide.pagerduty.com/assets/HowWeGotHereReportGuide.pdf)
## Iterating on the report throughout the investigation
A key aspect of your role as an investigator and incident analyst is to ensure multiple perspectives are well represented in the finished product. This means integrating feedback from the calibration document and individual follow-ups so the comments are accounted for. Throughout your investigation you’ll be collecting information to continuously update the document to include clarifications, feedback, new information, and important learnings from the review meeting.
Some organizations focus more heavily on the meeting and less on a written report. If this is your organization, you will still want to include a short overview in the document and link to a recording of the meeting, if available, to leave a record of your work and the subsequent discussions.
In addition, the action items should be added to this document to provide a consolidated view of what follow-ups are needed and help future readers to follow the full scope of the event and its outcome.
We recommend tracking analytics for the document. Seeing who is reading it and how often or how long after the event can provide lots of valuable insight into what is useful for the organization. You’ll also be able to see where your distribution is working well and where it could be improved, which we’ll tackle in the next section.
---
URL: https://docs.pagerduty.com/ops-guides/incident-response-guide
# Incident Response Guide
This documentation covers parts of the PagerDuty Incident Response process. It is a cut-down version of our internal documentation used at PagerDuty for any
This documentation covers parts of the PagerDuty Incident Response process. It is a cut-down version of our internal documentation used at PagerDuty for any major incidents and to prepare new employees for on-call responsibilities. It provides information not only on preparing for an incident, but also what to do during and after the incident. It is intended to be used by on-call practitioners and those involved in an operational incident response process (or those wishing to enact a formal incident response process). See the [about page](/ops-guides/incident-response-guide/about) for more information on what this documentation is and why it exists.
> **Don't know where to start?:** If you're new to incident response and don't yet have a formal process in your organization, we recommend looking at our [Getting Started](/ops-guides/incident-response-guide/getting-started) page for a quick list of things you can do to begin. Additionally, you can check out our [Training Course](/ops-guides/incident-response-guide/incident-response-course) page for a more detailed overview of our process.
## Being On-Call
If you've never been on-call before, you might be wondering what it's all about. These pages describe what the expectations of being on-call are, along with some resources to help you.
* [Being On-Call](/ops-guides/incident-response-guide/being-oncall) - _A guide to being on-call, both what your responsibilities are, and what they are not._
* [Alerting Principles](/ops-guides/incident-response-guide/alerting-principles) - _The principles we use to determine what things page an engineer, and what time of day they page._
## Before an Incident
Reading material for things you probably want to know before an incident occurs. You likely don't want to be reading these during an actual incident.
* [What is an Incident?](/ops-guides/incident-response-guide/what-is-an-incident) - _Before we can talk about incident response, we need to define what an incident actually is._
* [Severity Levels](/ops-guides/incident-response-guide/severity-levels) - _Information on our severity level classification. What constitutes a SEV-3 vs SEV-1? What response do they get?_
* [Different Roles for Incidents](/ops-guides/incident-response-guide/different-roles) - _Information on the roles during an incident(i.e. Incident Commander (IC), Scribe, etc.)_
* [Incident Call Etiquette](/ops-guides/incident-response-guide/call-etiquette) - _Our etiquette guidelines for incident calls (before you find yourself in one)._
* [Complex Incidents](/ops-guides/incident-response-guide/complex-incidents) - _Our guide for handling larger, more complex incidents._
## During an Incident
Information and processes during a major incident.
* [During an Incident](/ops-guides/incident-response-guide/during-an-incident) - _Information on what to do during an incident and how to constructively contribute._
* [Security Incident Response](/ops-guides/incident-response-guide/security-incident) - _Security incidents are handled differently than normal operational incidents._
## After an Incident
Our followup-processes, how we make sure we don't repeat mistakes, and are always improving.
* [After an Incident](/ops-guides/incident-response-guide/after-an-incident) - _Information on what to do after an incident is resolved._
* [Postmortem Process](/ops-guides/incident-response-guide/postmortem-process) - _Information on our postmortem process, what's involved, and how to write or run a postmortem._
* [Postmortem Template](/ops-guides/incident-response-guide/postmortem-template) - _The template we use for writing our postmortems for major incidents._
* [Effective Postmortems](/ops-guides/incident-response-guide/effective-postmortems) - _A guide for writing effective postmortems._
## Crisis Response
Incident response is about more than dealing with technical incidents. A crisis can happen at any time. Are you ready for it? The way you handle your worst day will leave lasting impressions about your brand and its perceived value in the eyes of your current and potential customers.
* [Introduction](/ops-guides/incident-response-guide/crisis-intro) - _An introduction to crisis response and who this document is intended for._
* [Terminology](/ops-guides/incident-response-guide/terminology) - _A list of key terms and concepts used in this guide._
* [Crisis Leadership](/ops-guides/incident-response-guide/crisis-leadership) - _Incorporating basic principles and your values in your response._
* [Crisis Response Operations](/ops-guides/incident-response-guide/crisis-operations) - _Activating your crisis response plans._
* [Pre-crisis Phase](/ops-guides/incident-response-guide/pre-crisis-phase) - _Capitalizing on preparedness activities to keep your teams ready and engaged._
* [PagerDuty for CRMOps](/ops-guides/incident-response-guide/pagerduty-for-crmops) - _How PagerDuty leverages PagerDuty for crisis response management operations._
## Training
So you want to learn about incident response? You've come to the right place.
* [Training Overview](/ops-guides/incident-response-guide/training-overview) - _An overview of our training guides and additional training material from third parties._
* [Glossary of Incident Response Terms](/ops-guides/incident-response-guide/glossary) - _A collection of terms that you may hear being used along with their definitions._
### Training Guides
* [Incident Commander Training](/ops-guides/incident-response-guide/incident-commander) - _A guide to becoming an Incident Commander._
* [Deputy Training](/ops-guides/incident-response-guide/deputy) - _How to be a Deputy and back up the Incident Commander._
* [Scribe Training](/ops-guides/incident-response-guide/scribe) - _A guide to Scribing._
* [Subject Matter Expert Training](/ops-guides/incident-response-guide/subject-matter-expert) - _A guide on responsibilities and behavior for all participants in a major incident._
* [Customer Liaison Training](/ops-guides/incident-response-guide/customer-liaison) - _A guide on how to act as our public representative during an incident._
* [Internal Liaison Training](/ops-guides/incident-response-guide/internal-liaison) - _A guide on how to liaise with internal teams during an incident._
### Training Courses
* [Incident Response Training Course](/ops-guides/incident-response-guide/incident-response-course) - _An introductory course on incident response and the role of the Incident Commander (IC)._
## Additional Resources
Useful material and resources from external parties that are relevant to incident response.
* [Reading](/ops-guides/incident-response-guide/reading) - _Recommended reading material relevant to incident response._
* [ChatOps](/ops-guides/incident-response-guide/chatops) - _Description of the chat bot commands we've referenced in this documentation._
* [Anti-Patterns](/ops-guides/incident-response-guide/anti-patterns) - _List of things we've tried and then rejected - learn from our mistakes._
---
URL: https://docs.pagerduty.com/ops-guides/incident-response-guide/about
# About
This site documents parts of the PagerDuty Incident Response process. It is a cut-down version of our internal documentation, used at PagerDuty for any major
This site documents parts of the PagerDuty Incident Response process. It is a cut-down version of our internal documentation, used at PagerDuty for any major incidents, and to prepare new employees for on-call responsibilities. It provides information not only on preparing for an incident, but also what to do during and after.
Few companies seem to talk about their internal processes for dealing with major incidents. We would like to change that by opening up our documentation to the community, in the hopes that it proves useful to others who may want to formalize their own processes. Additionally, it provides an opportunity for others to suggest improvements, which ends up helping everyone.
## What is this?
A collection of pages detailing how to efficiently deal with any major incidents that might arise, along with information on how to go on-call effectively. It provides lessons learned the hard way, along with training material for getting you up to speed quickly.
## Who is this for?
It is intended for on-call practitioners and those involved in an operational incident response process, or those wishing to enact a formal incident response process.
## Why do I need it?
Incident response is something you hope to never need, but when you do, you want it to go smoothly and seamlessly. Normally the knowledge of how to handle incidents within your company will be built up over time, getting better with each incident. While tools such as [PagerDuty's Modern Incidents Response](https://www.pagerduty.com/platform/modern-incident-response/) can help you recover quickly, the process you follow is just as important. This documentation will allow you to learn from the start something which has taken us years to build up. Giving you a head start on how to deal with major incidents in a way which leads to the fastest possible recovery time.
## What is covered?
Anything from preparing to [go on-call](/ops-guides/incident-response-guide/being-oncall), definitions of [severities](/ops-guides/incident-response-guide/severity-levels), incident [call etiquette](/ops-guides/incident-response-guide/call-etiquette), all the way to how to run a [postmortem](/ops-guides/incident-response-guide/postmortem-process), and providing our [postmortem template](/ops-guides/incident-response-guide/postmortem-template). We even include our [security incident response process](/ops-guides/incident-response-guide/security-incident).
## What is missing?
This isn't an exact clone of our internal documentation, but instead has some information removed. Things such as our phone bridge numbers, names of internal tools and systems which are not (yet) open sourced, images of our dashboards, etc. Basically anything that is specific to PagerDuty or is too sensitive to share.
## License
This documentation is provided under the Apache License 2.0. In plain English that means you can use and modify this documentation and use it both commercially and for private use. However, you must include any original copyright notices, and the original LICENSE file.
Whether you are a PagerDuty customer or not, we want you to have the ability to use this documentation internally at your own company. You can view the source code for all of this documentation on our GitHub account, feel free to fork the repository and use it as a base for your own internal documentation.
---
URL: https://docs.pagerduty.com/ops-guides/incident-response-guide/after-an-incident
# After an Incident
Information on what to do after a major incident. Our followup and after action review procedures.
Information on what to do after a major incident. Our follow-up and after action review procedures.
## Follow-up Actions for Response Roles
In addition to any direct follow-up items generated from an incident, each of our response roles will have a few standard follow-up tasks. These are generally lightweight actions that ensure we organize information and followup with customers appropriately.
### Steps for Incident Commander
1. Update the incident in PagerDuty.
* Group any related incidents under the primary incident.
* Set the final severity of the incident.
* Resolve the incident.
1. Create the postmortem, and assign an owner to the postmortem for the incident.
1. Send out an internal email to the relevant stakeholders explaining that we had an incident, provide a link to the postmortem.
1. Occasionally check on the progress of the postmortem to ensure that it is completed within the desired time frame.
### Steps for Deputy
There are no additional steps after an incident is resolved. However, the IC may ask for your help with their steps.
### Steps for Scribe
1. Review the chat communications and extract any relevant items from key events.
1. Collect all `TODO` items and add them to the postmortem.
### Steps for Subject Matter Experts
1. Add any notes you think are relevant to the postmortem.
### Steps for Customer Liaison
1. Reply to any customer enquiries we received about the incident.
1. Follow the postmortem progress, and update our status page with the external message once it is available.
### Steps for Internal Liaison
There are no additional steps after an incident is resolved. However the IC may ask for your help with answering questions from internal stakeholders.
## Reviewing the Incident
It's important that we review the incident in detail to see exactly what went wrong, why it went wrong, and what we can do to make sure it doesn't happen again. These take many names; after-action reviews, incident review, follow-up review, etc. We use the term postmortem.
You can read all about our [postmortem process](/ops-guides/incident-response-guide/postmortem-process), which goes over this in more detail.
## Reviewing the Process
As well as reviewing the incident, it's important to review our process. Did we handle the incident well, or are there things we could have done better?
This review isn't very formal yet, and typically involves a few of the Incident Commanders getting together to discuss how we might have done things differently, or if there are any tweaks we can make to our incident response process.
If you're interested in joining these meetings, just let one of the Incident Commanders know and we'll be sure to invite you.
---
URL: https://docs.pagerduty.com/ops-guides/incident-response-guide/alerting-principles
# Alerting Principles
We manage how we get alerted based on a simple principle, an alert is something which requires a human to perform an action. Anything else is a notification,
We manage how we get alerted based on a simple principle. **An alert is something which requires a human to perform an action**. Anything else is a notification, which is something that we cannot control, and for which we cannot make any action to affect it. Notifications are useful, but they shouldn't be waking people up under any circumstance.
## Alert Priority
> **High Priority Alerts:** Anything that wakes up a human in the middle of the night should be **immediately human actionable**. If it is none of those things, then we need to adjust the alert to not page at those times.
| Priority | Alerts | Response |
| -------- | ------ | -------- |
| High | High-Priority PagerDuty Alert 24/7/365. | Requires **immediate human action**. |
| Medium | High-Priority PagerDuty Alert during **business hours only**. | Requires human action within 24 hours. |
| Low | Low-Priority PagerDuty Alert 24/7/365. | Requires human action at some point. |
| Notification | Suppressed PagerDuty Event. | No response required. Informational only. |
If you're setting up a new alert/notification, consider the chart above for how you want to alert people. Be mindful of not creating new high-priority alerts if they don't require an immediate response, for example.
## Priority Examples
### "Production service is failing for 75% of requests, automation is unable to resolve."_
This would be a **High** priority page, requiring immediate human action to resolve.

### "Production server disk space is filling, expected to be full in 48 hours. Log rotation is insufficient to resolve."
This would be a **Medium** priority page, requiring human action soon, but not immediately.
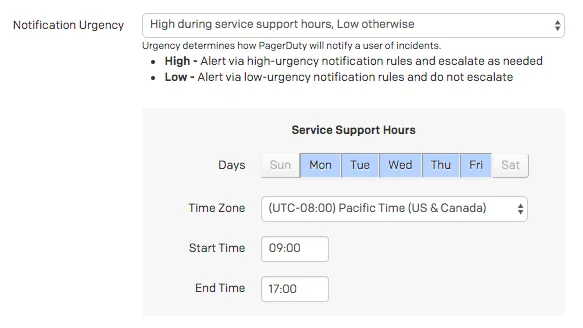
### "An SSL certificate is due to expire in one week."
This would be a **Low** priority page, requiring human action some time soon.

### "A deployment was successful."
This would be a **Notification**, and should be sent as a suppressed event. It provides useful context should an incident occur, but does not require notifying a human.

## Alert Content
We should ensure that alerts contain enough useful context to quickly identify the issue and any potential remediation steps. Alerts with generic titles or descriptions are not useful and can cause confusion. We have a set of guidelines for the content of alerts, which all our alerts should follow,
### Make the title/summary descriptive and concise.
* ALERT: Something went wrong.
* Disk is 80% full on `prod-web-loadbalancer-af5462ce`.
### Make sure to include the metric which triggered the alert somewhere in the body.
* Diskspace on a disk is filling.
* `avg(last_1h):max:system.disk.in_use{env:prod-web-loadbalancer} by {host} > 0.8`
### The body should also include a description of what the actual problem is, and why it's an issue.
* Disk is full.
* The disk on this host is at 80% capacity. If it becomes too full it could cause system instability as new files will not be able to be created and current files will not be written to.
### Provide clear steps to resolve the problem, or link to a run book. Alerts with neither of these things are useless.
* Fix it by deleting stuff.
* Follow the run book here for identifying and resolving disk space issues: https://example.com/runbook/disk. Additionally, you should investigate whether log rotation thresholds are sufficient to prevent this happening again, the following run book has the necessary steps: https://example.com/runbook/log-rotate
## Testing Your Alerts
> **Testing is Critical:** An untested alert is equivalent to not having an alert at all. You cannot be sure it will alert you when the time comes. Testing that your alerting actually works is critical to proper service health and should be included in any release planning / deployment efforts.
Make sure to test all new and modified alerts. This is usually covered as part of [Failure Friday](https://www.youtube.com/watch?v=XKl-7hB3paY) for any new service; however, you should manually test them if you need it more quickly. Some things to test:
* Test that the threshold is set appropriately. We don't want noisy alerts.
* Test that you get alerted for the "No Data" condition if applicable. Generally, receiving no data is the same as breaking your threshold.
* Test that the alert resolves automatically when the metric returns to normal.
---
URL: https://docs.pagerduty.com/ops-guides/incident-response-guide/anti-patterns
# Anti-Patterns
These are some processes that we've found do not work well. We've either tried them in the past and regretted it, or spent considerable time thinking about
> **Process Anti-Patterns:** These are some processes that we've found do not work well. We've either tried them in the past and regretted it, or spent considerable time thinking about them and ultimately rejected them. We want to document them to make sure we don't repeat mistakes or wonder why a decision was made later down the line. The list is in no particular order.
## Getting everyone on the call.
Believe it or not, we used to page every single engineer at PagerDuty when we had a SEV-2 incident. If a SEV-2 happened at 3am, then we'd be paging the entire engineering department at 3am. There a few reasons we went down this path,
1. When the company was smaller, there were only a few engineers. So this process worked well, since you really did need every engineer on the call.
1. Rather than triaging an incident and then having to page in additional people, if everyone is on the call to begin with then the thinking was that we'd get a faster response.
As we grew our engineer department, this did not scale well at all, and problems quickly became apparent,
1. Most of the people on the call had nothing to do. They'd been woken up for no reason.
1. Paging people has a cost impact. Both in employee health, and in finance. Waking up your entire engineering department at 3am means nothing productive is going to be done the next day, across the entire department.
1. People who weren't on-call would still get paged.
It's important to maintain an **effective span of control** on any incident response. If you have more than 7 or 8 people directly reporting to the [Incident Commander](/ops-guides/incident-response-guide/different-roles#incident-commander-ic) things can quickly get overwhelming. We now will only page the engineers who are on-call for a specific service, rather than the entire team. If more responders are required, then they will be mobilized by the [Internal Liaison](/ops-guides/incident-response-guide/different-roles#internal-liaison) to join the response. 9 times out of 10 we don't need additional responders, so the rest of the engineering department can get some rest without interference. This results in a happier engineering department and a more streamlined response process.
## Forcing everyone to stay on the call.
Our original thinking was that if you've been mobilized onto a response call, then we would need you to stick around until the end, since if you were needed at one point, chances are you'll be needed again before the incident is resolved. Unfortunately, we've since found that that's never really the case. Typically someone will be mobilized to investigate a specific system, or perform a specific action, after which time there would be nothing further required from them. We'd have a call full of people who weren't doing anything and could've gone back to sleep. This can also encourage 'hero' mentalities where individuals feel pressured that they have to stay on a call.
Now we ask people to leave the call if they're no longer needed. Once the Incident Commander has ascertained which systems are impacted, they let representatives for the other systems leave the call so they can get some rest. You can always mobilize them again if they're really needed. Most of the time they won't be needed again, so we're optimizing for the 99% case.
## Too frequent status updates.
Executives need to know what's going on and want to be provided status updates every 5 minutes to keep them in the loop. The problem with this is that you'll spend the entire time providing status updates rather than resolving the incident.
We've found that providing status updates every 20-30 minutes during a major incident is a typical cadence that works. This ensures we're not just providing updates for the sake of providing updates, but that they're more likely to have some actual useful information in them. That's not to say you can't provide updates more frequently if there really is new information to share, but it shouldn't be a requirement. We want to spend as much time fixing the incident as we can, but we also want to make sure we keep stakeholders in the loop. It's a delicate balance that's easy to get wrong.
## Assuming silence means no progress.
It can be common to assume silence on an incident call means that nothing is being done, however this is rarely the case. When joining a call, be aware that a chatterless session can be acceptable and reasonable. Silence usually means everyone is working on fixing the problem rather than talking and providing updates. We're not playing a game of "Keep Talking and Nobody gets Fired." The Incident Commander is the one who should be doing most of the talking on a call. They will typically fill silence with a status update if appropriate, but others within the organization need to be trained to know that silence on a call isn't a bad thing, and doesn't mean that progress has stalled. Making sure staff are aware of this ahead of time will prevent awkward conversations during an incident call, which would be ultimately distracting from resolving the incident.
## Litigating severities during the incident call.
The start of a lot of incident calls in PagerDuty's past consisted of a discussion around whether we were really in a SEV-2 situation, or whether it was a smaller issue that could be handled without an incident call. This discussion would usually take up quite a bit of time, as everyone wanted to weigh in. The problem was that while you're having this discussion, the incident is still going on behind the scenes, and by the time you've finished it has become a SEV-1 and you've just wasted 10 minutes discussing severities.
We now have a rule: **We do not discuss incident severity during an incident call**, we always assume it's the higher severity and treat it as such. So if we're not sure if it's a SEV-2 or SEV-3, we treat it like a SEV-2 and move on. We've already spun up the gears of incident response and paged responders, so even if it turns out to be a SEV-3, we may as well continue with the process and treat it as practice if nothing else.
## Hesitating to escalate to other responders.
If it's 3am and you're responding to an incident, we have had cases where a Subject Matter Expert (SME) would be stuck attempting to debug an issue, and they would be reluctant to involve another member of their team due to the time of day. This would end up causing our incident to last longer than it needed to.
**"Never hesitate to escalate"** is now one of our mantras. If you're stuck on a problem and it's 3am, don't hesitate to page someone more knowledgable to help resolve the situation. Don't go too far with this and page everyone, otherwise you fall into the earlier anti-pattern. But you should never feel like you can't page someone if you need help.
## Discussing process and policy decisions during the incident call.
There are occasions where responders don't agree with the incident response policies and processes we might use. Sometimes this will cause a discussion during the incident call, which ends up derailing the process for everyone and causing the underlying incident to last longer, hindering the response. It is absolutely OK to have disagreements with the process and to want to make changes (in fact, this is something we encourage, as it allows us to iteratively improve our process), however during an incident is not the time to have that discussion.
**Policy and processes should not be discussed during an incident**, just like with severities. The current process should be followed during an incident, and any concerns should be raised afterwards, either during a post-mortem or directly to the team managing the incident response process.
## Neglecting the postmortem and followup activities.
It's tempting once an incident is resolved to not bother with the postmortem. Either you feel like the cause is well known, or you don't feel that it's worth it. Don't fall into this trap! A postmortem is always worthwhile. People were mobilized to respond to an incident, which had a cost associated with it. We want to be sure that we understand why that happened, so we can avoid that cost in future.
Don't make the mistake of neglecting a postmortem after an incident. Without a postmortem you fail to recognize what you're doing right, where you could improve, and most importantly, how to avoid making the same exact mistakes next time around. A well-designed, blameless postmortem allows teams to continuously learn, and serves as a way to iteratively improve your infrastructure and incident response process.
If you mobilize responders and determine it's not a "real" incident, you should still conduct a post-mortem. Because the next time you're going to mobilize responders again and waste time. Find out why incident response was triggered when it may not have been needed, and fix that problem.
## Being too focussed on the problem in front of you.
As a responder to an incident, you would typically be focussed on the specific task in front of you. The Incident Commander generally being the person who has the bigger picture of what is going on. There can be a tendency for SME's to become too focussed on the problem they see in front of them, rather than taking the bigger picture into account. This usually presents itself on an incident call with an SME constantly bringing up the same issue without listening to instructions from the Incident Commander, and having tunnel vision for the specific issue on their system.
Instructions from the Incident Commander should always be followed, as they will typically have more overall context on what is going on. Try not to fall into the trap of being hyper-focused on the problem in front of you, so much so that you derail the process. We want to treat the cause, not a symptom of the incident.
## Being averse to policy and process changes.
Once a stable process is in place, and incidents are getting resolved, there can be lots of hesitation and resistance to changing that process. "If it ain't broke don't fix it", etc. As your company grows, your response will need to change. Holding on to your old processes and practices for too long can hinder your incident response going forward. Don't be reckless, of course, but try to introduce sensible changes and **don't be afraid to make changes which might slow things down in the short-term, but will make things faster in the long-run**. These are the hardest changes to make, but usually the most worthwhile.
## Trying to take on multiple roles.
In past PagerDuty incidents, we've had instances where the Incident Commander has started to assume the Subject Matter Expert role and attempted to solve the problem themselves. This usually happens when the IC is an engineer in their day-to-day role. They are in an incident where the cause appears to be a system they know very well and have the requisite knowledge to fix. Wanting to solve the incident quickly, the IC will start to try and solve the problem. Sometimes you might get lucky and it will resolve the incident, but most of the time the immediately visible issue isn't necessarily the underlying cause of the incident. By the time that becomes apparent, you have an Incident Commander who is not paying attention to the other systems and is just focussed on the one problem in front of them. This effectively means there's no Incident Commander, as they would be busy trying to fix the problem. Inevitably, the problem turns out to be much bigger than anticipated and the response has become completely derailed.
**You cannot take on another role at the same time as being an Incident Commander**. It can be a difficult to be an IC when you want to jump in as an SME, but you must resist the temptation to abandon the role of IC. If you really are the only person able to solve the problem, you should handover to another Incident Commander and then assume the role of SME. This ensures that the response process remains on track with a dedicated Incident Commander.
Remember that the job of an IC also includes preparing backup plans in case the current action doesn't resolve the incident. If you're acting as an SME fixing on a particular issue, you're not considering the backup plan.
## Trying to be a hero.
It can be tempting to try and solve every issue yourself if you're acting as a Subject Matter Expert. Every request that comes up, you want to jump on it and say you'll take care of it. You'll be the indispensable one who solves all the problems. As noble as the intent is, it rarely leads to an efficient outcome. You want to avoid as much multi-tasking as possible during an incident, and focus on one problem at a time. **Don't try to solve everything yourself**. If multiple requests are coming up for your area of expertise, delegate them to other experts, even paging backup responders if required.
Likewise, if another SME has been assigned a task, don't do the task on their behalf without consulting with them first. While you are trying to help, it will end up hindering the response as you'll have two people working on the same issue, and they may be interfering with each other in unexpected ways.
## Not disseminating policy changes to responders.
We've fallen into the trap in the past of making policy and process changes by simply updating our internal documentation (i.e. this), assuming everyone would read the documentation before an incident. Which of course, never happens.
**Any policy changes need to be appropriately disseminated to your responders ahead of time** so that there are no surprises during an incident. This can be in the form of an email, or an update into a chat room, but big policy changes should never be a surprise to responders.
## Requiring Incident Commanders to have deep technical knowledge.
This is a trap we fell into in our early days of incident response. We had several strong technical requirements for any new Incident Commanders, aiming to only have IC's with deep technical expertise, the intention being that they could diagnose issues very quickly. When it became apparent that we would need a large selection of IC's in order to maintain an effective on-call rotation, we soon realised that we had artificially restricted our pool of potential IC candidates.
**Incident Commanders can come from all across your organization, and don't need to be technical experts**. Since Incident Commanders only coordinate the response, they don't need deep technical knowledge of the system in order to perform their role. The Subject Matter Experts are the ones who need the deep technical knowledge. The Incident Commanders only require a high-level knowledge of how the system works. Where data flows in, how systems use it, and where data flows out. The technical details can be left to the SMEs, with the IC asking relevant questions.
By dropping our strong technical requirements for Incident Commanders, we've been able to dramatically increase our pool of IC's, maintain a high level of quality and efficiency in our response, and help spread empathy for on-call workload to a larger portion of the company.
---
URL: https://docs.pagerduty.com/ops-guides/incident-response-guide/being-oncall
# Being On-Call
A summary of the expectations and responsibilities of being on-call at PagerDuty, along with some best practice and etiquette recommendations.
A summary of expectations and helpful information for being on-call.
## What is On-Call?
Being on-call means that you are able to be contacted at any time in order to investigate and fix issues that may arise for the system you are responsible for. For example, if you are on-call for your service at PagerDuty, should any alarms be triggered for that service, you will receive a "page" (an alert on your mobile device, email, phone call, or SMS, etc.) giving you details on what is broken and how to fix it. You will be expected to take whatever actions are necessary in order to resolve the issue and return your service to a normal state.
On-call responsibilities extend beyond normal office hours, and if you are on-call, you are expected to be able to respond to issues - even at 2am. This sounds horrible (and it can be), but this is what our customers go through and is the problem that the PagerDuty product itself is trying to fix!
## Responsibilities
1. **Prepare**
* Have your laptop and Internet with you (office, home, a MiFi dongle, a phone with a tethering plan, etc).
* Have a way to charge your MiFi.
* Team alert escalation happens within 5 minutes, set/stagger your notification timeouts (push, SMS, phone, etc.) accordingly.
* Make sure PagerDuty texts and calls can [bypass your "Do Not Disturb" settings](/incident-management/notifications/notification-phone-numbers).
* Be prepared (environment is set up, a current working copy of the necessary repositories is local and functioning, you have configured and tested environments on workstations, your credentials for third-party services are current, etc.)
* Read our incident response documentation (that's this!) to understand how we handle serious incidents, what the different roles and methods of communication are, etc.
* Be aware of your upcoming on-call time (primary, backup) and arrange swaps around travel, vacations, appointments, etc.
1. **Triage**
* Acknowledge and act on alerts whenever you can (see the first "Not responsibilities" point below)
* Determine the urgency of the problem:
* Is it something that should be worked on right now or escalated into a major incident? (e.g. "production server on fire" situations. Security alerts) - do so.
* Is it some tactical work that doesn't have to happen during the night? For example, disk utilization high watermark, but there's plenty of space left and the trend is not indicating impending doom, etc. just snooze the alert until a more suitable time (working hours or the next morning) and get back to fixing it then.
* Check Slack for current activity. Oftentimes - but not always - actions that could potentially cause alerts will be announced there.
* Does the alert and your initial investigation indicate a general problem or an issue with a specific service that the relevant team should look into? If it does not look like a problem you are the expert for, then escalate to another team.
1. **Fix**
* You are empowered to dive into any problem and act to fix it.
* Involve other team members as necessary: Do not hesitate to escalate if you cannot figure out the cause within a reasonable timeframe, or if the service / alert is something you have not tackled before.
* If the issue is not time sensitive and you have other priority work, create a JIRA ticket to keep a track of it (with an appropriate severity).
1. **Improve**
* If a particular issue keeps happening; if an issue alerts often but turns out to be a preventable non-issue – perhaps improving this should be a longer-term task.
* Disks that fill up, logs that should be rotated, noisy alerts...
* If information is difficult / impossible to find, write it down. Constantly refactor and improve our knowledge base and documentation. Add redundant links and pointers if your mental model of the wiki / codebase does not match the way it is currently organized.
1. **Support**
* When your on-call "shift" ends, let the next on-call know about issues that have not been resolved yet and other experiences of note.
* If you are making a change that impacts the schedule (e.g. adding / removing yourself), let others know since many of us make arrangements around the on-call schedule well in advance.
* Support each other: When doing activities that might generate plenty of pages, it is courteous to "take the page" away from the on-call by notifying them and scheduling an override for the duration.
## Not Responsibilities
1. There should be no expectation to be the first to acknowledge _all_ of the alerts during the on-call period.
* Commutes (and other necessary distractions) are facts of life, and sometimes it is not possible to receive or act on an alert before it escalates. That's what we have the backup on-call and schedule for.
1. There's no expectation to fix all issues by yourself.
* No one knows everything. Your whole team is here to help. There is no shame, and much to be learned, by escalating issues you are not certain about. Our motto is "Never hesitate to escalate."
* Service owners will always know more about how their stuff works. Especially if our and their documentation is lacking, double checking with the relevant team can avoid mistakes. Measure twice, cut once – and it's often best to let the subject matter expert (SME) do the cutting.
## Recommendations
If your team is starting its own on-call rotation, here are some scheduling recommendations from the operations team.
* Always have a backup schedule. Yes, this means two people being on-call at the same time. This takes a lot of the stress off of the primary on-call if they know they have a specific backup they can contact, rather than trying to choose a random member of the team.
* A backup shift should generally come directly after a primary shift. It gives a chance for the previous primary to pass on additional context, which may have come up during their shift. It also helps to prevent people from sitting on issues with the intent of letting the next shift fix it.
* The third level of your escalation (after backup schedule) should probably be your entire team. This should hopefully never happen (it's happened once in the history of the operations team), but when it does, it's useful to be able to just get the next available person.
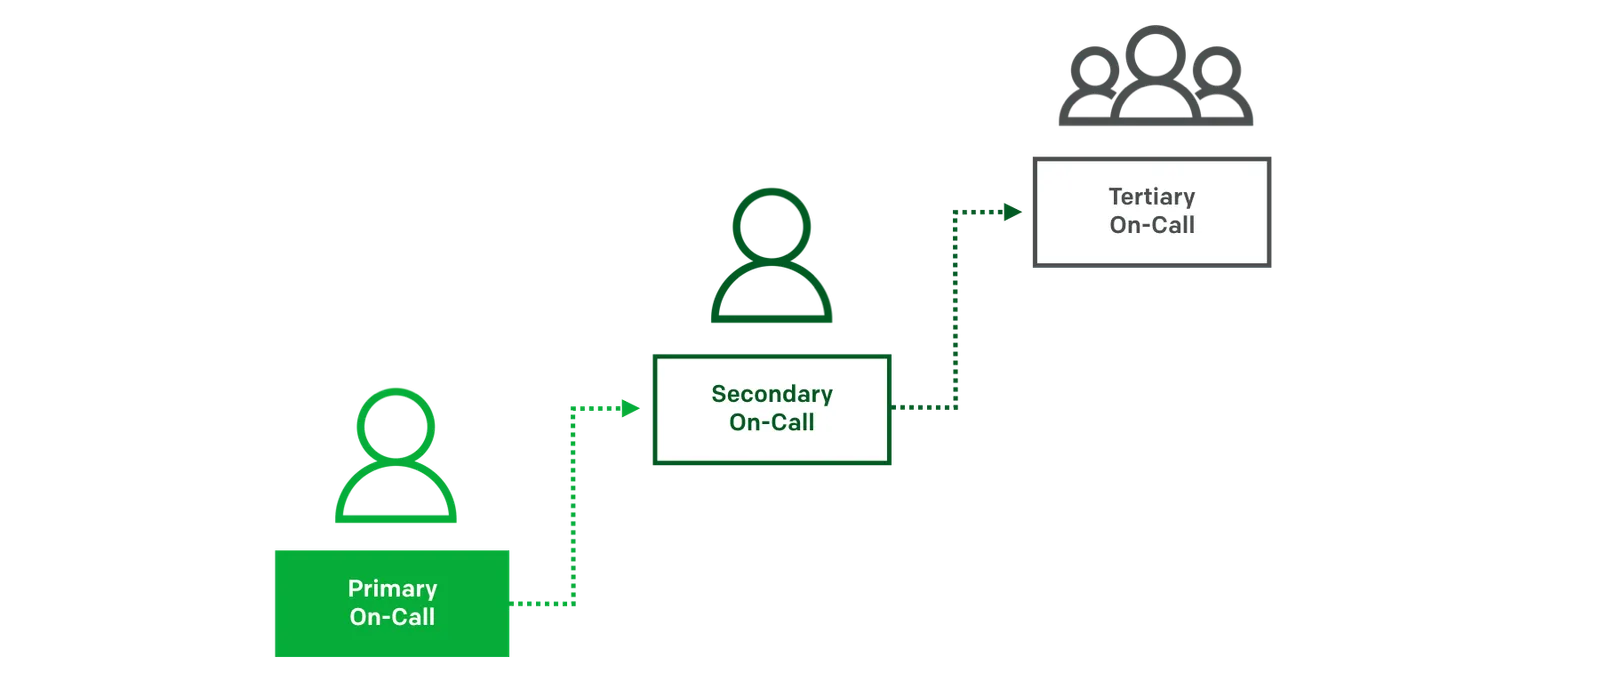
* Team managers can (and should) be part of your normal rotation. It gives a better insight into what has been going on.
* New members of the team should shadow your on-call rotation during the first few weeks. They should get all alerts and follow along with what you are doing. (All new employees shadow the operations team for one week of on-call, but it's useful to have new team members shadow your team rotations also. Just not at the same time).
* We recommend you set your escalation timeout to 5 minutes. This should be plenty of time for someone to acknowledge the incident if they're able to. If they're not able to within 5 minutes, then they're probably not in a good position to respond to the incident anyway.
* When going off-call, you should provide a quick summary to the next on-call about any issues that may come up during their shift. A service has been flapping, an issue is likely to reoccur, etc. If you want to be formal, this can be a written report via email, but generally a verbal summary is sufficient.
### Notification Method Recommendations
You are free to set up your notification rules as you see fit to match how you would like to best respond to incidents. If you're not sure how to configure them, the operations team has some recommendations.
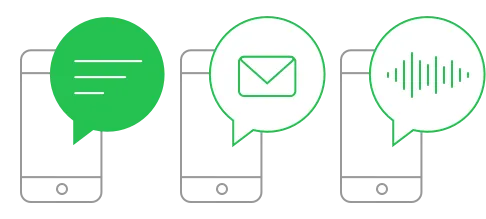
* Use push notifications and email as your first method of notification. Most of us have phones with us at all times, so this is a prudent first method and is usually sufficient.
* Use phone and/or SMS notification each minute after, until the escalation time. If push didn't work, then it's likely you need something stronger, like a phone call. Keep calling every minute until it's too late. If you don't pick up by the 3rd time, then it's unlikely you are able to respond, and the incident will get escalated away from you.
## Etiquette
* If the current on-call comes into the office at 12 p.m. looking tired, it's not because they're lazy. They probably got paged in the night. Cut them some slack and be nice.
* Don't acknowledge an incident out from under someone else. If you didn't get paged for the incident, then you shouldn't be acknowledging it. Add a comment with your notes instead.
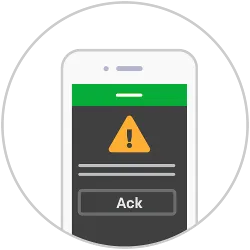
* If you are testing something or performing an action that you know will cause a page, it's customary to "take the pager" for the time during which you will be testing. Notify the person on-call that you are taking the pager for the next hour while you test.
* "Never hesitate to escalate." Never feel ashamed to rope in someone else if you're not sure how to resolve an issue. Likewise, never look down on someone else if they ask you for help.
* Always consider covering an hour or so of someone else's on-call time if they request it and you are able. We all have lives which might get in the way of on-call time, and one day it might be you who needs to swap their on-call time in order to have a night out with your friend from out of town.
* If an issue comes up during your on-call shift for which you got paged, you are responsible for resolving it. Even if it takes 3 hours and there's only 1 hour left of your shift. You can hand over to the next on-call if they agree, but you should never assume that's possible.
---
URL: https://docs.pagerduty.com/ops-guides/incident-response-guide/call-etiquette
# Call Etiquette
You've just joined an incident call, and you've never been on one before. You have no idea what's going on, or what you're supposed to be doing. This page will
You've just joined an incident call and you've never been on one before. You have no idea what's going on or what you're supposed to be doing. This page will help you through your first time on an incident call, and will provide a reference for future calls you may be a part of.
## First Steps
* If you intend on participating on the incident call you should join both the call, and Slack.
* Make sure you are in a quiet environment in order to participate on the call. Background noise should be kept to a minimum.
* Keep your microphone muted until you have something to say.
* Identify yourself when you join the call; state your name and the system you are the expert for.
* Speak up and speak clearly.
* Be direct and factual.
* Keep conversations/discussions short and to the point.
* Bring any concerns to the Incident Commander (IC) on the call.
* Respect time constraints given by the Incident Commander.
## Lingo
**Use clear terminology, and avoid using acronyms or abbreviations during a call. Clear and accurate communication is more important than quick communication.**
Standard radio [voice procedure](https://en.wikipedia.org/wiki/Radiotelephony_procedure#Procedure_words) does not need to be followed on calls. However, you should familiarize yourself with the terms, as you may hear them on a call (or need to use them yourself). The ones in more active use on major incident calls are,
* **Ack/Rog** - "I have received and understood"
* **Say Again** - "Repeat your last message"
* **Standby** - "Please wait a moment for the next response"
* **Wilco** - "Will comply"
Do not invent new abbreviations, and always favor being explicit rather than implicit. It is better to make things clearer than to try and save time by abbreviating, only to have a misunderstanding because others didn't know the abbreviation.
## The Commander
The Incident Commander (IC) is the leader of the incident response process and is responsible for bringing the incident to resolution. They will announce themselves at the start of the call and will generally be doing most of the talking.
* Follow all instructions from the Incident Commander - without exception.
* Do not perform any actions unless the Incident Commander has told you to do so.
* The Incident Commander will typically poll for any strong objections before performing a large action. This is your time to raise any objections if you have them.
* Once the Incident Commander has made a decision, that decision is final and should be followed, even if you disagreed during the poll.
* Answer any questions the Incident Commander asks you in a clear and concise way.
* Answering that you "don't know" something is perfectly acceptable. Do not try to guess.
* The Incident Commander may ask you to investigate something and get back to them in X minutes. Make sure you are ready with an answer within that time.
* Answering that you need more time is perfectly acceptable, but you need to give the Incident Commander an estimate of how much time.
## Problems?
### There's no incident commander on the call! I don't know what to do!
Ask on the call if an IC is present. If you have no response, type `!ic page` in Slack. This will page the primary and backup IC to the call.
### I can join the call or Slack, but not both, what should I do?
You're welcome to join only one of the channels, however you should not actively participate in the incident response if so as it causes disjointed communication. Liaise with someone who is both in Slack and on the call to provide any input you may have so that they can raise it.
---
URL: https://docs.pagerduty.com/ops-guides/incident-response-guide/chatops
# ChatOps
Throughout this documentation references are made to various chat commands, all starting with an exclamation (e.g. 'ic page'). We have bots running in our
Throughout this documentation, references are made to various chat commands, all starting with an exclamation (e.g. `!ic page`). We have bots running in our Slack rooms which watch for these commands and execute various actions for us when they're detected. This page gives an overview of the commands we've referenced in this documentation, and what they do behind the scenes.
> **Are these bots open-source?:** The chat plugins and bots we use are unfortunately not currently open-sourced, however we would like to eventually get them open-sourced so that you can all benefit from them. In the meantime, the hope is that the descriptions on this page can help you to reproduce similar functionality with your own tooling.
## Incident Response
Our `!ic` commands poll the PagerDuty API behind the scenes for various on-call schedules we specify. It caches the names and contact details for the current on-call users, so that if there's any issue in making API requests, the funtionality isn't impacted.
### `!ic`
This command lists out the current Incident Commanders on-call, their phone numbers, and a message telling users how to page them.
### `!ic page`
This is the command we use to manually trigger our incident response process. It uses the cached schedule information and will page all of the current Incident Commanders on-call (the primary, the backup, and any trainees who are shadowing). It will also notify into the room if it is unable to page them for any reason, and direct users to manually call the person using their contact information. Additionally, it will create a new PagerDuty incident and link users to it.
If for any reason we are unable to page the Incident Commanders automatically, the bot will let us know that it has failed, and give us the phone numbers for the relevant people so we can manually call them. Here is some example output from our test bot, where we have simulated being unable to page via PagerDuty due to an unresponsive API call.
### `!ic responders`
This works similarly to the `!ic` command, only it uses all our service team schedules instead of just the IC schedules. It will list out all the current people who are on-call for each engineering team. This is useful to also know who will likely be joining the incident call momentarily.
### `!ic page responders`
This works similarly to `!ic page`, only it pages the responders list instead of the Incident Commanders. This is rarely used, since generally only the relevant team will get paged. However, sometimes we require an "all hands on deck" response, and need the ability to quickly page all the current on-calls.
### `!ic who | Chat Room | >Video/Voice Bridge | >Phone Bridge | >
|---|---|---|
| #incident-chat | >https://a-voip-provider.com/incident-call | >+1 555 BIG FIRE (+1 555 244 3473) / PIN: 123456 | >
Need an IC? Do !ic page in Slack |
> ||
| For executive summary updates only, join #executive-summary-updates. | >||
If there is an "External Message," the Customer Support team will take the message and update our status page as appropriate. | | **Closed** | No further actions are needed on the postmortem (outstanding issues are tracked in JIRA).
If no "External Message," you can skip straight to this once the meeting is over.
If there's an "External Message", then the Support team will update it to this status once the message is posted. | ## Postmortem Once you've been designated as the owner of a postmortem, you should start creating one and updating it with all the relevant information. 1. (If not already done by the IC) Create a new postmortem for the incident. 1. Schedule a postmortem meeting for within **3 calendar days** for a SEV-1 and **5 business days** for a SEV-2. You should schedule this before filling in the postmortem, just so it's on the calendar. * Create the meeting on the "Incident Postmortem Meetings" shared calendar. 1. Begin populating the page with all of the information you have. * The timeline should be the main focus to begin with. * The timeline should include important changes in status/impact and key actions taken by responders. * Go through the history in Slack to identify the responders and add them to the page. * Identify the Incident Commander and Scribe in this list. 1. Populate the postmortem with more detailed information. * For each item in the timeline, identify a metric, or some third-party page where the data came from. This could be a link to a Datadog graph, a SumoLogic search, a post, etc. Anything which shows the data point you're trying to illustrate in the timeline. * Add a link to the incident call recording. 1. Perform an analysis of the incident. * Capture all available data regarding the incident. What caused it, how many customers were affected, etc. * Any commands or queries you use to look up data should be posted in the page so others can see how the data was gathered. * Capture the impact to customers (generally in terms of event submission, delayed processing, and slow notification delivery) * Identify the underlying cause of the incident (what happened and _why_ did it happen). 1. Write the external message that will be sent to customers. This will be reviewed during the postmortem meeting before it is sent out. * Avoid using the word "outage" unless it really was a full outage, use the word "incident" or "service degradation" instead. Customers generally see "outage" and assume the worst. * Look at other examples of previous postmortems to see the kind of thing you should send. 1. Post a link to the postmortem into Slack to be reviewed for style and content by internal parties, you should try to do this about **24 hours before** the meeting is scheduled. * Experienced postmortem writers will give you feedback on the level of detail and content of the postmortem. This avoids wasted time during the meeting. 1. Attend the postmortem meeting (see below section for more information). 1. Create any follow-up action JIRA tickets (or note down topics for discussion if we need to decide on a direction to go before creating tickets), * Go through the history in Slack to identify any TODO items. * Label all tickets with their severity level and date tags. * Any actions which can reduce reoccurrence of the incident. * (There may be some trade-off here, and that's fine. Sometimes the ROI isn't worth the effort that would go into it). * Identify any actions which can make our incident response process better. * Be careful with creating too many tickets. Generally we only want to create things that are P0/P1's. Things that absolutely should be dealt with. 1. Communicate internally so we can learn from the incident. * Send out an internal email to the relevant stakeholders describing the results and key learnings. * Include a link to the postmortem. ## Postmortem Meeting These meetings should generally last 15-30 minutes and are intended to be a wrap up of the postmortem process. We should discuss what happened, what we could've done better, and any follow-up actions that we need to take. The goal is to suss out any disagreement on the facts, analysis, or recommended actions, and to get some wider awareness of the problems that are causing reliability issues for us. You should invite the following people to the postmortem meeting, * Always * The Incident Commander. * The Incident Commander Shadowee (if there was one). * Service owners involved in the incident. * Key engineer(s)/responders involved in the incident. * Engineering manager for impacted systems. * Product manager for impacted systems. * Optional * Customer Liaison. (Only SEV-1 incidents) The Incident Commander will run the meeting, keeping the discussion focused and on track. However the postmortem owner will likely be doing most of the talking as they walk through the postmortem report. A general agenda for the meeting would be something like, 1. Recap the timeline, to make sure everyone agrees and is on the same page. 1. Recap important points, and any unusual items. 1. Discuss how the problem could've been caught. * Did it show up in [canary](https://martinfowler.com/bliki/CanaryRelease.html)? * Could it have been caught in tests, or loadtest environment? 1. Discuss customer impact. Any comments from customers, etc. 1. Review action items that have been created, discuss if appropriate, or if more are needed, etc. ## Examples Here are some examples of postmortems from other companies as a reference, * [LastPass](https://blog.lastpass.com/2015/06/lastpass-security-notice/) * [AWS](https://aws.amazon.com/message/5467D2/) * [Twilio](https://www.twilio.com/blog/2013/07/billing-incident-post-mortem-breakdown-analysis-and-root-cause.html) * [Heroku](https://status.heroku.com/incidents/151) * [Netflix](https://netflixtechblog.com/post-mortem-of-october-22-2012-aws-degradation-efcee3ab40d5) * [GOV.UK Rail Accident Investigation](https://www.gov.uk/government/publications/kyle-beck-safety-digest/near-miss-at-kyle-beck-3-august-2016) * [A List of Postmortems!](https://github.com/danluu/post-mortems) ## Useful Resources * [Advanced PostMortem Fu and Human Error 101 (Velocity 2011)](https://www.slideshare.net/jallspaw/advanced-postmortem-fu-and-human-error-101-velocity-2011) * [Blame. Language. Sharing.](https://fractio.nl/2015/10/30/blame-language-sharing/) --- URL: https://docs.pagerduty.com/ops-guides/incident-response-guide/postmortem-template # Postmortem Template PagerDuty's postmortem template, covering owner, meeting scheduling, overview, contributing factors, and resolution, used in the Incident Response Guide. This is a standard template we use for postmortems at PagerDuty. Each section describes the type of information you will want to put in that section. --- > **Guidelines:** This page is intended to be reviewed during a postmortem meeting that should be scheduled within 5 business days of any event. > Your first step should be to schedule the postmortem meeting in the shared calendar for within 5 business days after the incident. > Don't wait until you've filled in the info to schedule the meeting. Make sure the page is completed by the meeting. **Postmortem Owner:** _Your name goes here._ **Meeting Scheduled For:** _Schedule the meeting on the "Incident Postmortem Meetings" shared calendar, for within 5 business days after the incident. Put the date/time here._ **Call Recording:** _Link to the incident call recording._ ## Overview _Include a **short** sentence or two summarizing the contributing factors, timeline summary, and the impact. E.g. "On the morning of August 99th, we suffered a 1 minute SEV-1 due to a runaway process on our primary database machine. This slowness caused roughly 0.024% of alerts that had begun during this time to be delivered out of SLA."_ ## What Happened _Include a short description of what happened._ ## Contributing Factors _Include a description of any conditions that contributed to the issue. If there were any actions taken that exacerbated the issue, also include them here with the intention of learning from any mistakes made during the resolution process._ ## Resolution _Include a description of what solved the problem. If there was a temporary fix in place, describe that along with the long-term solution._ ## Impact _Be very specific here and include exact numbers._ | | | |-|-| | Time in SEV-1 | ?mins | | Time in SEV-2 | ?mins | | Notifications Delivered out of SLA | ??% (?? of ??) | | Events Dropped / Not Accepted | ??% (?? of ??) _Should usually be 0, but always check_ | | Accounts Affected | ?? | | Users Affected | ?? | | Support Requests Raised | ?? _Include any relevant links to tickets_ | ## Responders * _Who was the IC?_ * _Who was the scribe?_ * _Who else was involved?_ ## Timeline _Some important times to include: (1) time the contributing factor began, (2) time of the page, (3) time that the status page was updated (i.e. when the incident became public), (4) time of any significant actions, (5) time the SEV-2/1 ended, (6) links to tools/logs that show how the timestamp was arrived at._ | Time (UTC) | Event | Data Link | | ---------- | ----- | --------- | ## How'd We Do? ### What Went Well? * _List anything you did well and want to call out. It's OK to not list anything._ ### What Didn't Go So Well? * _List anything you think we didn't do very well. The intent is that we should follow up on all points here to improve our processes._ ## Action Items _Each action item should be in the form of a JIRA ticket, and each ticket should have the same set of two tags: “sev1_YYYYMMDD” (such as sev1_20150911) and simply “sev1”. Include action items such as: (1) any fixes required to prevent the contributing factor in the future, (2) any preparedness tasks that could help mitigate the problem if it came up again, (3) remaining postmortem steps, such as the internal email, as well as the status-page public post, (4) any improvements to our incident response process._ ## Messaging ### Internal Email _This is a follow-up for employees. It should be sent out right after the postmortem meeting is over. It only needs a short paragraph summarizing the incident and a link to this wiki page._ > Briefly summarize what happened and where the postmortem page (this page) can be found. ### External Message _This is what will be included on the status.pagerduty.com website regarding this incident. What are we telling customers, including an apology? (The apology should be genuine, not rote.)_ > Summary > What Happened? > What Are We Doing About This? --- URL: https://docs.pagerduty.com/ops-guides/incident-response-guide/pre-crisis-phase # Pre-crisis Phase Take the time to stress test your work before the real world does it for you. Practice and simulations are crucial for flagging any gaps or blindspots you want ## Pre-crisis You now have your Executive Crisis Leadership team, your crisis response management configured in PagerDuty, your 100-page crisis management plan and a shorter scenario-driven playbook for crisis response. Now what? This is the time to stress test your work before the real world does it for you. This step is crucial for flagging any gaps or blindspots you want to be aware of ahead of a crisis. This is also an opportunity to build strong leadership, reduce mean time to respond and develop good habits within your team. ## Crisis Simulations Conducting discussion-based tabletop exercises with your team is an ideal starting point. However, leveraging functional exercises to simulate your level of maturity with crisis coordination, and command and control is also important. Running a crisis simulation using PagerDuty is as simple as triggering an alert on your crisis service—randomly if you really want to simulate real life. You would then follow your typical process of getting the right people on a conference call or instant messaging channel through an integration and running through a scenario with your corresponding playbook. The PagerDuty platform will automatically track the length of the exercise and record any notes or status changes in the timeline which you can then use in your [postmortem](/ops-guides/postmortem-best-practices/what-is-a-postmortem) (i.e, after action report or hotwash) and in developing further tabletops or simulations. A biannual cadence for crisis simulations provides sufficient time for preparation and to review the findings in the postmortem. --- URL: https://docs.pagerduty.com/ops-guides/incident-response-guide/reading # Reading A curated list of books, talks, and official resources on incident response and crisis management, recommended as further study for this guide. This is a collection of additional reading on the topic of incident response that we've found useful. ## Books * [Incident Management for Operations](https://learning.oreilly.com/library/view/~/9781491917619/) (Rob Schnepp, Ron Vidal, Chris Hawley) * [Incident Response](https://learning.oreilly.com/library/view/~/0596001304/) (Kenneth R. van Wyk, Richard Forno) * [The Checklist Manifesto](http://atulgawande.com/book/the-checklist-manifesto/) (Atul Gawande) * [The Field Guide to Understanding Human Error](https://www.amazon.com/Field-Guide-Understanding-Human-Error/dp/0754648265) (Sidney Dekker) * [Normal Accidents: Living with High-Risk Technologies](https://www.amazon.com/Normal-Accidents-Living-High-Risk-Technologies/dp/0691004129) (Charles Perrow) * [Site Reliability Engineering](https://sre.google/sre-book/table-of-contents/) (Google) * [IT Disaster Response: Lessons Learned in the Field](https://www.amazon.com/Disaster-Response-Lessons-Learned-Field/dp/1484221834) (Greg D. Moore) ## Documents * [Debriefing Facilitation Guide](https://extfiles.etsy.com/DebriefingFacilitationGuide.pdf) (Etsy) ## Talks * [Every Minute Counts: Leading Heroku's Incident Response](https://www.heavybit.com/library/video/every-minute-counts-coordinating-herokus-incident-response/) (Blake Gentry) * [Three Analytical Traps in Accident Investigation](https://www.youtube.com/watch?v=TqaFT-0cY7U) (Dr. Johan Bergström) ## Official Resources * [US National Incident Management System (NIMS)](https://www.fema.gov/national-incident-management-system) (FEMA) * [UK Government Fire and Rescue Manual - Incident Command](https://assets.publishing.service.gov.uk/government/uploads/system/uploads/attachment_data/file/7643/incidentcommand.pdf) (UK.GOV) * [New Zealand Coordinated Incident Management System (CIMS)](https://www.civildefence.govt.nz/resources/coordinated-incident-management-system-cims-third-edition/) (NZCDEM) ## Other Useful Resources * [Informed's NIMS Incident Command System Field Guide](https://www.amazon.com/gp/product/1284038408) (Michael J. Ward) * [Linkedin's School Of SRE](https://linkedin.github.io/school-of-sre/) (LinkedIn) --- URL: https://docs.pagerduty.com/ops-guides/incident-response-guide/scribe # Scribe So you want to be a scribe? You've come to the right place! You don't need to be a senior team member to become a Deputy or Scribe, anyone can do it providing So you want to be a Scribe? You've come to the right place! You don't need to be a senior team member to become a Deputy or Scribe, anyone can do it providing you have the requisite knowledge! ## Purpose The purpose of the Scribe is to maintain a timeline of key events during an incident. Documenting actions, and keeping track of any follow-up items that will need to be addressed. It's important for the rest of the command staff to be able to focus on the problem at hand, rather than worrying about documenting the steps. Your job as Scribe is to listen to the call and to watch the incident Slack room, keeping track of context and actions that need to be performed, documenting these in Slack as you go. **You should not be performing any remediations, checking graphs, or investigating logs.** Those tasks will be delegated to the subject matter experts (SME's) by the Incident Commander. ## Prerequisites Before you can be a Scribe, it is expected that you meet the following criteria. Don't worry if you don't meet them all yet, you can still continue with training! * Excellent verbal and written **communication skills**. ## Responsibilities Read up on our [Different Roles for Incidents](/ops-guides/incident-response-guide/different-roles) to see what is expected from a Scribe, as well as what we expect from the other roles you'll be interacting with. ## Training Process There is no formal training process for this role, reading this page should be sufficient for most tasks. Here's a list of things you can do to train though, * Read the rest of this page, particularly the sections below. * Participate in [Failure Friday](https://www.youtube.com/watch?v=XKl-7hB3paY) (FF). * Shadow a FF to see how it's run. * Be the Scribe for multiple FF's. ## Scribing Scribing is more art than science. The objective is to keep an accurate record of important events that occurred on the call, so that we can look back at the timeline to see what happened. But what exactly is important? There's no overwhelming answer, and it really comes down the judgement and experience. But here are some general things you most definitely want to capture as Scribe. * The result of any polling decisions. * This is not "9 people voted yay, 3 voted nay". * It is "Polled for if we should do rolling restart. <USER_A> is proceeding with restart." * Any follow-up items that are called out as "We should do this..", "Why didn't this?..", etc. * This is not "Why isn't the Support representative on the call?" * This is "TODO: Why didn't we get paged for this earlier?" ## Incident Call Procedures and Lingo The [Steps for Scribe](/ops-guides/incident-response-guide/during-an-incident#steps-for-scribe) provide a detailed description of what you should be doing during an incident. Here are some examples of phrases and patterns you should use during incident calls. ### Status Stalking At the start of any major incident call, you should start our status stalking bot, so that it will post to the room an update automatically. > !status stalk This will provide the update and allow the IC to see the status without having to keep asking. ### Note Important Actions During a call, you will hear lots of discussion happening, you should not be documenting all of this in the chat room. You only want to document things which will be important for the final timeline. It's not always obvious what this might be, and it's usually a matter of judgement. You generally want to note any actions the IC has asked someone to perform, along with the result of any polling decisions. > Polled for decision on whether to perform rolling restart. We are proceeding with restart. [USER_A] to execute. Some actions might seem important at the time, but end up not being. That's OK. It's better to have more info than not enough, but don't go overboard. ### Note Follow-up Actions Sometimes during the call, someone will either mention something we "should fix", or the IC will specifically ask you to note a followup item. You can do this in Slack by simply prefixing with "TODO", this will make it easier to search for later. > TODO: Why did we not get paged for the fall in traffic on [X] cluster? The postmortem owner will find these after and raise tasks for them. ### End of Call Notification When the IC ends the call, you should post a message into Slack to let everyone know the call is over, and that they should continue discussion elsewhere. > Call is over, thanks everyone. Follow up in Slack. Don't forget to also stop the status stalking. > !status unstalk --- URL: https://docs.pagerduty.com/ops-guides/incident-response-guide/security-incident # Security Incident Checklist of actions for responding to a security incident at PagerDuty.
Last Reviewed: YYYY-MM-DD
Last Tested: YYYY-MM-DD
> **Incident Commander Required:** As with all major incidents at PagerDuty, security incidents will also involve an Incident Commander who will delegate the tasks to relevant responders. Tasks may be performed in parallel as assigned by the IC. Page one at the earliest possible opportunity `!ic page`.
> **Not Sure it's a Security Incident?:** Trigger the process anyway. It's better to be safe than sorry. The Incident Commander will make a determination on if response is needed.
## Checklist
Details for each of these items are available in the next section.
1. Stop the attack in progress.
1. Cut off the attack vector.
1. Assemble the response team.
1. Isolate affected instances.
1. Identify timeline of attack.
1. Identify compromised data.
1. Assess risk to other systems.
1. Assess risk of re-attack.
1. Apply additional mitigations, additions to monitoring, etc.
1. Forensic analysis of compromised systems.
1. Internal communication.
1. Involve law enforcement.
1. Reach out to external parties that may have been used as vector for attack.
1. External communication.
---
## Attack Mitigation
Stop the attack as quickly as you can, via any means necessary. Shut down servers, network isolate them, turn off a data center if you have to. Some common things to try,
* Shutdown the instance from the provider console (do not delete or terminate if you can help it, as we'll need to do forensics).
* If you happen to be logged into the box you can try to,
* Reinstate our default iptables rules to restrict traffic.
* `kill -9` any active session you think is an attacker.
* Change root password and update /etc/shadow to lock out all other users.
* `sudo shutdown now`
## Cut Off Attack Vector
Identify the likely attack vectors and path/fix them so they cannot be re-exploited immediately after stopping the attack.
* If you suspect a third-party provider is compromised, delete all accounts except your own (and those of others who are physically present) and immediately rotate your password and MFA tokens.
* If you suspect a service application was an attack vector, disable any relevant code paths, or shut down the service entirely.
## Assemble Response Team
Identify the key responders for the security incident and keep them all in the loop. Set up a secure method of communicating all information associated with the incident. Details on the incident (or even the fact that an incident has occurred) should be kept private to the responders until you are confident the attack is not being triggered internally.
* Page an Incident Commander if not already done so. They will also appoint the usual incident command roles. The incident command team will be responsible for keeping documentation of actions taken, and for notifying internal stakeholders as appropriate.
* Give the project an innocuous codename that can be used for chats/documents so if anyone overhears they don't realize it's a security incident. (e.g. sapphire-unicorn).
* Start the voice call if not already in progress.
* Setup chat room using the codename of the incident.
* Invite all responders to the voice call and chat room.
1. The **security team should always be included**.
1. A representative for any affected services should be included.
1. Executive stakeholders and legal counsel should be invited at earliest possible opportunity, but prioritize operational responders first.
* Do not communicate with anyone not on the response team about the incident until forensics have been performed. The attack could be happening internally.
* Prefix all emails, and chat topics with "Attorney Work Project".
## Isolate Affected Instances
Any instances which were affected by the attack should be immediately isolated from any other instances. As soon as possible, an image of the system should be taken and put into a read-only cold storage for later forensic analysis.
* Blacklist the IP addresses for any affected instances from all other hosts.
* Turn off and shutdown the instances immediately if you didn't do that to stop the attack.
* Take a disk image for any disks attached to the instances, and ship them to an off-site cold storage location. You should make sure these images are read-only and cannot be tampered with.
## Identify Timeline of Attack
Work with all tools at your disposal to identify the timeline of the attack, along with exactly what the attacker did.
* Any reconnaissance the attacker performed on the system before the attack started.
* When the attacker gained access to the system.
* What actions the attacker performed on the system, and when.
* Identify how long the attacker had access to the system before they were detected, and before they were kicked out.
* Identify any queries the attacker ran on databases.
* Try to identify if the attacker still has access to the system via another back door. Monitor logs for unusual activity, etc.
## Compromised Data
Using forensic analysis of log files, time-series graphs, and any other information/tools at your disposal, attempt to identify what information was compromised (if any),
* Identify any data that was compromised during the attack.
* Was any data exfiltrated from a database?
* What keys were on the system that are now considered compromised?
* Was the attacker able to identify other components of the system (map out the network, etc)?
* Find exactly what customer data has been compromised, if any.
## Assess Risk
Based on the data that was compromised, assess the risk to other systems.
* Does the attacker have enough information to find another way in?
* Were any passwords or keys stored on the host? If so, they should be considered compromised regardless of how they were stored.
* Any user accounts that were used in the initial attack should rotate all of their keys and passwords on every other system they have an account.
## Apply Additional Mitigations
Start applying mitigations to other parts of your system.
* Rotate any compromised data.
* Identify any new alerting which is needed to notify of a similar breach.
* Block any IP addresses associated with the attack.
* Identify any keys/credentials that are compromised and revoke their access immediately.
## Forensic Analysis
Once you are confident the systems are secured, and enough monitoring is in place to detect another attack, you can move onto the forensic analysis stage.
* Take any read-only images you created, any access logs you have, and comb through them for more information about the attack.
* Identify exactly what happened, how it happened, and how to prevent it in future.
* Keep track of all IP addresses involved in the attack.
* Monitor logs for any attempt to regain access to the system by the attacker.
## Internal Communication
**Delegate to:** VP or Director of Engineering
Communicate internally only once you are confident (via forensic analysis) that the attack was not sourced internally.
* Don't go into too much detail.
* Overview the timeline.
* Discuss mitigation steps taken.
* Follow up with more information once it is known.
## Liaise With Law Enforcement / External Actors
**Delegate to:** VP or Director of Engineering
Work with law enforcement to identify the source of the attack, letting any system owners know that systems under their control may be compromised, etc.
* Contact local law enforcement.
* Contact the FBI.
* Contact operators for any systems used in the attack, their systems may also have been compromised.
* Contact security companies to help in assessing risk and any PR next steps.
* Contact your cyber insurance provider.
## External Communication
**Delegate to:** Marketing Team
Once you have validated all of the information you have is accurate, have a timeline of events, and know exactly what information was compromised, how it was compromised, and sure that it won't happen again. Only then should you prepare and release a public statement to customers informing them of the compromised information and any steps they need to take.
* Include the date in the title of any announcement so that it's never confused for a potential new breach.
* Don't say "We take security very seriously." It makes everyone cringe when they read it.
* Be honest, accept responsibility, and present the facts, along with exactly how we plan to prevent such things in future.
* Be as detailed as possible with the timeline.
* Be as detailed as possible in what information was compromised and how it affects customers. If we were storing something we shouldn't have been, be honest about it. It'll come out later and it'll be much worse.
* Don't name and shame any external parties that might have caused the compromise. It's bad form. (Unless they've already publicly disclosed, in which case we can link to their disclosure).
* Release the external communication as soon as possible, preferably within a few days of the compromise. The longer you wait, the worse it will be.
* If possible, get in touch with customers' internal security teams before the general public notice is sent.
---
## Communicating During an Incident
* Prefer voice call and Slack over any other methods.
* Avoid email, but if you absolutely need to for some reason,
* Subject of emails should be "Attorney Work Project" and nothing else.
* If the email chain has **ANY** contacts **not with the @pagerduty.com domain**, make sure your emails are encrypted.
* Do not use SMS to communicate about the incident.
* The only exception is to tell someone to move to a more secure channel. e.g. "Please join Slack ASAP."
* Do not disseminate anything about the incident to those outside the response team until you have approval to do so.
---
## Additional Reading
* [Computer Security Incident Handling Guide](https://nvlpubs.nist.gov/nistpubs/SpecialPublications/NIST.SP.800-61r2.pdf) (NIST)
* [Incident Handler's Handbook](https://www.sans.org/reading-room/whitepapers/incident/incident-handlers-handbook-33901) (SANS)
* [Responding to IT Security Incidents](https://docs.microsoft.com/en-us/previous-versions/tn-archive/cc700825(v=technet.10)) (Microsoft)
* [Defining Incident Management Processes for CSIRTs: A Work in Progress](https://resources.sei.cmu.edu/library/asset-view.cfm?assetid=7153) (CMU)
* [Creating and Managing Computer Security Incident Handling Teams (CSIRTS)](https://www.first.org/conference/2008/papers/killcrece-georgia-slides.pdf) (CERT)
---
URL: https://docs.pagerduty.com/ops-guides/incident-response-guide/severity-levels
# Severity Levels
Incidents are typically classified by severity or priority. At PagerDuty we use 'SEV' levels, with lower numbered severities being more urgent. Operational
The first step in any incident response process is to determine what actually [constitutes an incident](/ops-guides/incident-response-guide/what-is-an-incident). Incidents can then be classified by severity, usually done by using "SEV" definitions, with the lower numbered severities being more urgent. Operational issues can be classified at one of these severity levels, and in general you are able to take more risky moves to resolve a higher severity issue. Anything above a SEV-3 is automatically considered a "major incident" and gets a more intensive response than a normal incident.
> **Always Assume The Worst:** If you are unsure which level an incident is (e.g. not sure if SEV-2 or SEV-1), **treat it as the higher one**. During an incident is not the time to discuss or litigate severities, just assume the highest and review during a postmortem.
> **Can a SEV-3 be a major incident?:** All SEV-2's are major incidents, but not all major incidents need to be SEV-2's. If you require coordinated response, even for lower severity issues, trigger our incident response process. The Incident Commander can make a determination on whether full incident response is necessary.
| Severity | Description | Typical Response |
|---|---|---|
| SEV-1 |
Critical issue that warrants public notification and liaison with executive teams.
|
Major incident response.
|
| SEV-2 |
Critical system issue actively impacting many customers' ability to use the product.
|
Major incident response.
|
| Anything above this line is considered a "Major Incident". Our incident response process should be triggered for any major incidents. | ||
| SEV-3 |
Stability or minor customer-impacting issues that require immediate attention from service owners.
|
High-Urgency page to service team.
|
| SEV-4 |
Minor issues requiring action, but not affecting customer ability to use the product.
|
Low-Urgency page to service team.
|
| SEV-5 |
Cosmetic issues or bugs, not affecting customer ability to use the product.
|
JIRA ticket.
|
| Cues |
|
| Previous Knowledge/Experience |
|
| Goals |
|
| Assessment |
|
| Taking Action |
|
| Help |
|
| Process |
|
If there is an "External Message", the Customer Support team will take the message and update our status page as appropriate. | | **Closed** | No further actions are needed on the postmortem (outstanding issues are tracked in JIRA).
If no "External Message", you can skip straight to this once the meeting is over.
If there's an "External Message", then the Support team will update it to this status once the message is posted. | ## Create a Timeline  Begin by focusing on the timeline. Document the facts of what happened during the incident. Avoid evaluating what should or should not have been done and coming to conclusions about what caused the incident. Presenting only the facts here will help avoid blame and supports a deeper analysis. Note the incident may have started before responders became aware of it and began the response effort. The timeline includes important changes in status/impact and key actions taken by responders. To avoid hindsight bias, start your timeline at a point before the incident and work your way forward instead of backwards from resolution. Review the incident log in Slack to find key decisions made and actions taken during the response effort. Also include information the team didn't know during the incident that, in hindsight, you wish you would have. Find this additional information by looking at monitoring, logs, and deployments related to the affected services. You'll take a deeper look at monitoring during the analysis step, but start here by adding key events related to the incident, and include changes to incident status and the impact to the timeline. For each item in the timeline, identify a metric or some third-party page where the data came from. This helps illustrate each point clearly and ensures you remain rooted in fact rather than opinions. This could be a link to a monitoring graph, a log search, a tweet, etc.—anything that shows the data point you're trying to illustrate in the timeline. > **Key Takeaways:** * Stick to the facts. > * Include changes to incident status and impact. > * Include key decisions and actions taken by responders. > * Illustrate each point with a metric. ## Document Impact  Impact should be described from a few perspectives: - How long was the impact visible? In other words, what was the length of time users/customers were affected? - Note the length of impact may differ from the length of the response effort. Impact may have started some time before it was detected and incident response began. - How many customers were affected? - Support may need a list of all affected customers so they can reach out individually. - How many customers wrote or called support about the incident? - What functionality was affected and how severely? - Quantify impact with a business metric specific to your product. For PagerDuty this includes event submission, delayed processing, slow notification delivery, etc. ## Analyze the Incident  Now that you have an understanding of what happened during the incident, look further back in time to find the contributing factors that led to the incident. Technology is a complex system with a network of relationships (organizational, human, technical) that is continuously changing. In his paper, "[How Complex Systems Fail](http://web.mit.edu/2.75/resources/random/How%20Complex%20Systems%20Fail.pdf)," Dr. Richard Cook says that because complex systems are heavily defended against failure, it is a unique combination of apparently innocuous failures that join to create catastrophic failure. Furthermore, because overt failure requires multiple faults, attributing a "root cause" is fundamentally wrong. **There is no single root cause of major failure in complex systems, but a combination of contributing factors that together lead to failure.** The postmortem owner's goal in analyzing the incident is not to identify the root cause, but to understand the multiple factors that created an environment where this failure became possible. Cook also says the effort to find the "root cause" does not reflect an understanding of the system, but rather the cultural need to blame specific, localized forces for events. Blamelessness is essential for an effective postmortem. **An individual's action should never be considered a root cause.** Effective analysis goes deeper than human action. In the cases where someone's mistake did contribute to a failure, it is worth anonymizing this in your analysis to avoid attaching blame to any individual. Assume any team member could have made the same mistake. According to Cook, "all practitioner actions are actually gambles, that is, acts that take place in the face of uncertain outcomes." The postmortem owner should start their analysis by looking at the monitoring for the affected services. Search for irregularities like sudden spikes or flatlining when the incident began and leading up to the incident. Include any commands or queries used to look up data, graph images, or links from monitoring tooling alongside this analysis so others can see how the data was gathered. If there is not monitoring for this service or behavior, make building monitoring an action item for this postmortem. More on [writing action items](#followup) below. > **Importance of Monitoring:** Puppet's 2018 State of DevOps Report highlights making monitoring configurable by the team operating the service as a foundational practice for successful DevOps. Empowering teams to define, manage, and share their own measurement of performance contributes to a culture of continuous improvement. Another helpful strategy for targeting what caused an incident is reproducing it in a non-production environment. Experiment by modifying variables to isolate the phenomenon. If you modify or remove some input does the incident still occur? This level of analysis will uncover the superficial causes of the incident. Next, ask why the system was designed in a way to make this possible. Why did those design decisions seem to be the best decisions at the time? Answering these questions will help you uncover root causes. Here are some questions to help the postmortem owner identify the class of a particular problem: - Is it an isolated incident or part of a trend? - Was this a specific bug, a failure in a class of problem we anticipated, or did it uncover a class of issue we did not architecturally anticipate? - Was there work the team chose not to do in the past that contributed to this incident? - Research if there were any similar or related incidents in the past. Does this incident demonstrate a larger trend in your system? - Will this class of issue get worse/more likely as you continue to grow and scale the use of the service? > **Tip:** At PagerDuty, we have a separate process for analyzing larger trends across multiple incidents to inform technical and organizational planning. Learn more in our guide on [Operational Reviews](/ops-guides/operational-reviews-guide). Though it may not be a root cause, consider the process in your analysis. Did the way that people collaborate, communicate, and/or review work contribute to the incident? This is also an opportunity to evaluate and improve the incident response process. Consider what worked well and didn't work well within the incident response process during the incident. Write a summary of the findings in the postmortem. The team may find further learnings and identify additional causes through discussion in the meeting, but the owner should do as much pre-work and documentation as possible to ensure a productive discussion. ### Questions to Ask Below is a non-exhaustive list to help stimulate deep analysis. Ask "how" and "what" questions rather than "who" or "why" to discourage blame and encourage learning.
| Cues |
|
| Previous Knowledge/Experience |
|
| Goals |
|
| Assessment |
|
| Taking Action |
|
| Help |
|
| Process |
|