# Amazon CloudWatch Integration Guide | PagerDuty
Configure the Amazon Cloudwatch integration
## Amazon CloudWatch + PagerDuty Benefits
- Amazon CloudWatch provides monitoring for AWS resources and customer-run applications. The service can collect data, gain insight, and alert users to fix problems within applications and organizations.
- Amazon CloudWatch gives system-wide visibility into resource utilization, and notifications can be set for metrics that cross specified thresholds. These notifications can be automatically sent to PagerDuty, which reliably alerts the correct on-call responder through their preferred contact methods.
## Requirements
**General**:
- The integration expects to find a nested JSON-encoded object in the `Message` property. If PagerDuty does not receive it, an alert does not trigger.
**To Configure the Integration**:
- **In PagerDuty**: Managers, Admins, Global Admins, and the Account Owner can configure the integration.
> **Compatibility:** This integration is available for Amazon CloudWatch on AWS Cloud or AWS Outposts.
## How it Works
- When an AWS service metric goes beyond a predefined threshold, a CloudWatch alert sends a notification to a PagerDuty endpoint and triggers an incident.
- When the AWS service metric returns to an OK state below the predefined threshold, a resolve event is sent to the same endpoint, and the PagerDuty incident resolves.
## Version
This guide details configuration of the **Amazon CloudWatch V1** integration.
## Integration Walkthrough
### In PagerDuty
There are two ways to integrate Amazon CloudWatch with PagerDuty:
- [Integrate With Event Orchestration](#integrate-with-event-orchestration): Integrating with [Event Orchestration](/ai-automation/aiops/event-orchestration) may be beneficial if you want to build nested rules based on the payload coming from AWS.
- [Integrate With a PagerDuty Service](#integrate-with-a-pagerduty-service): Integrating directly with a [PagerDuty service](/incident-management/services/services-and-integrations) can be beneficial if you do not need to route alerts from AWS to different responders based on the event payload. You can still use service-level [Event Orchestration](/ai-automation/aiops/event-orchestration#incident-data) to perform actions such as alert suppression.
#### Integrate With Event Orchestration
##### Configure a Global Orchestration Integration
1. [Configure a Global Orchestration](/ai-automation/aiops/event-orchestration#global-orchestrations) in your PagerDuty account.
2. Navigate to **AIOps** → **Event Orchestration** → click the **name** of your Global Orchestration.
3. Click the **Global Orchestration Key** dropdown and then copy the **Integration Key**.
4. Once you have your **Integration Key**, the **Integration URL** is:
`https://events.pagerduty.com/x-ere/[YOUR_INTEGRATION_KEY_HERE]`
You can now proceed to the [In the AWS Management Console](#in-the-aws-management-console) section below.
##### Configure a Service Orchestration Integration
1. [Configure a Service Orchestration](/ai-automation/aiops/event-orchestration#service-orchestrations) in your PagerDuty account.
2. Create a [Generic Events API integration](/incident-management/services/services-and-integrations#create-a-generic-events-api-integration) on the same service.
3. Once complete, copy the **Integration Key** and paste it into the following URL:
`https://events.pagerduty.com/x-ere/[YOUR_INTEGRATION_KEY_HERE]`
You can now proceed to the [In the AWS Management Console](#in-the-aws-management-console) section below.
#### Integrate With a PagerDuty Service
##### Add to a New Service
1. To [add the integration to a new service](/incident-management/services/services-and-integrations#create-a-new-service), navigate to **Services** → **Service Directory** and click **New Service**.
2. Follow the prompts and [configure the service](/incident-management/services/services-and-integrations#create-a-new-service) to your preferences. On the Integrations screen, select **Amazon CloudWatch** from the search bar dropdown, or from the most popular integrations list.
3. Once you are done entering your service settings, click **Create Service**.
4. You will now be in the service's Integrations tab. Find your integration in the list and click the to view and copy your **Integration URL**. Keep it in a safe place for later use.
5. You can now proceed to the [In the AWS Management Console](#in-the-aws-management-console) section below.
##### Add to an Existing Service
1. To [add an integration to an existing service](/incident-management/services/services-and-integrations#add-integrations-to-an-existing-service), go to **Services** → **Service Directory** and select the **service** where you would like to configure the integration. Select the **Integrations** tab and click **Add another integration**.
2. Select **Amazon CloudWatch** from the search bar dropdown, or from the most popular integrations list.
3. Click **Add**. Find your integration in the list and click the to the right to view and copy your **Integration URL**. Keep it in a safe place for later use.
4. You can now proceed to the [In the AWS Management Console](#in-the-aws-management-console) section below.
### In the AWS Management Console
1. In the Services search bar, search and select **Simple Notification Service**. In the SNS dashboard left menu, select **Topics** and click **Create Topic** on the right. This topic is used to route alerts to PagerDuty from AWS.
2. Select the **Standard** Topic **Type**.
3. Next, perform the following:
- **Name**: Enter a **name** for your topic. You may want to name your topic after your PagerDuty service's name.
- **Display name** (_optional_): Enter an optional **display name**.
- Click **Create topic**.
4. Next, select **Subscriptions** in the left menu and click **Create Subscription**.
5. Perform the following:
- **Topic ARN**: Select the **Topic ARN** of the topic you just created.
- **Protocol**: Select **HTTPS**.
- **Endpoint**: Paste your **Integration URL** (generated in steps above).
- Ensure that the **Enable raw message delivery** checkbox is **unchecked**.
- Click **Create Subscription**.
6. Your subscription should be automatically confirmed. Refresh the page to make sure the **Status** is `Confirmed` and not `PendingConfirmation`.
7. Next, you will create a CloudWatch alarm that sends notifications to your SNS topic when a metric falls outside of a predefined threshold.
8. In the Services search bar, search and select **Cloudwatch**. Select **Alarms** → **All Alarms** and then click **Create Alarm** on the right.
9. Click **Select metric**. Select your [metric](https://docs.aws.amazon.com/AmazonCloudWatch/latest/monitoring/working_with_metrics.html) using either of the following methods:
- Select the **service namespace** that contains the metric. Continue selecting your preferred options, which narrows down your choices until a list of metrics appears. Select the **check box** next to your desired **Metric Name**.
- In the search field, enter the name of a metric, dimension, or resource ID and hit **Enter**. Then select your desired results and continue selecting your preferred options until a list of metrics appears. Select the **check box** next to your desired metric.
[Read more about commonly used metrics](#commonly-used-metrics).
10. Next, select the **Graphed metrics** tab. Under **Statistic**, select one of the statistics or predefined percentiles, or specify a custom percentile (for example, p95.45). Under **Period**, select the evaluation period for the alarm. Click **Select metric** to continue.
11. On the next page under Conditions, select from the following **Threshold types**:
| Threshold Type | Instructions |
| :---------------------------------------------------------------------------------------------------------------------- | :------------------------------------------------------------------------------------------------------------------------------------------------------------------------------------------------------------ |
| [Static](https://docs.aws.amazon.com/AmazonCloudWatch/latest/monitoring/ConsoleAlarms.html) | a) Under **Whenever NumberOfObjects is…**, select **Greater**, **Greater/Equal**, **Lower/Equal**, or **Lower**.
b) Under **than…** enter your desired **threshold value**. |
| [Anomaly detection](https://docs.aws.amazon.com/AmazonCloudWatch/latest/monitoring/Create_Anomaly_Detection_Alarm.html) | a) Under **Whenever BucketSizeBytes is…** select **Outside of the band**, **Greater than the band**, or **Lower than the band**.
b) Under **Anomaly detection threshold**, set your **threshold value**. |
Click **Next** to continue.
12. First, you will configure the **In alarm** state notification, which triggers a PagerDuty incident when the metric has met your predefined threshold. Select the **In alarm** and **Select an existing SNS topic** radio buttons, and then select the **SNS Topic** (created above) from the **Send a notification to…** field.
13. Next, you will configure the **OK** state notification, which automatically resolves the PagerDuty incident if the metric has fallen back into an OK state (not meeting or exceeding the threshold). Click **Add Notification**. Select the **OK** and **Select an existing SNS topic** radio buttons, and then select the **SNS Topic** (created above) from the **Send a notification to…** field. Click **Next** to continue.
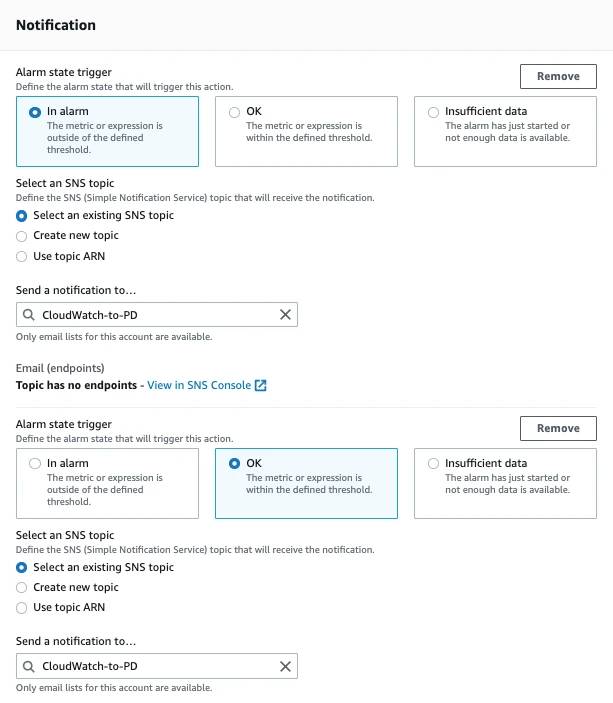
*Notification settings*
14. On the next page, enter an **Alarm name** and **Alarm description**. Click **Next** to continue.
15. On the Preview and Create screen, review your alarm's details. If you need to edit any details, click **Edit** to the right of each step. Once you have confirmed all details, click **Create alarm**.
16. You should then see a confirmation modal that your alarm was saved successfully.
17. The integration is now complete. When your alarm threshold is met, it will trigger an incident in PagerDuty. Once that alarm is back in an OK state, the incident automatically resolves in PagerDuty.

*Resolved incident*
## Commonly Used Metrics
[Metrics](https://docs.aws.amazon.com/AmazonCloudWatch/latest/monitoring/working_with_metrics.html) that are commonly used with the Amazon CloudWatch integration include, but are _not limited to_:
### EC2
To use the CloudWatch integration with [EC2](https://docs.aws.amazon.com/ec2/?id=docs_gateway) instance metrics, follow the instructions in the Integration Walkthrough and perform the following when you [Create a CloudWatch Alarm](#in-the-aws-management-console):
1. In step 9 above, select **EC2** → **Per instance metrics**.
2. Check the **checkbox** next to the **Instance Name** with your preferred **Metric Name** on the right. Commonly used metrics are **CPU Utilization** and **Status Check Failed**. Read [AWS' documentation](https://docs.aws.amazon.com/AWSEC2/latest/UserGuide/viewing_metrics_with_cloudwatch.html) for more information on EC2 metrics.
3. Continue with the instructions in steps 10-17.
### S3 Storage Lens
To use the CloudWatch integration with [S3 Storage Lens](https://docs.aws.amazon.com/AmazonS3/latest/userguide/storage_lens.html) metrics, follow the instructions in the Integration Walkthrough and perform the following when you [Create a CloudWatch Alarm](#in-the-aws-management-console):
1. In step 9 above, select **S3** → **Storage Metrics**.
2. Check the **checkbox** next to the **BucketName** with your preferred **Metric Name** on the right. Commonly used metrics are **Incomplete Multipart Upload Storage Bytes**, **Unencrypted Storage Bytes**, and **Non-Current Version Storage Bytes**. Read [AWS' documentation](https://docs.aws.amazon.com/AmazonS3/latest/userguide/storage_lens_metrics_glossary.html) for more information on S3 Storage Lens metrics.
3. Continue with the instructions in steps 10-17.
### EKS
To use the CloudWatch integration with [EKS](https://docs.aws.amazon.com/eks/?id=docs_gateway) metrics, follow the instructions in the Integration Walkthrough and perform the following when you [Create a CloudWatch Alarm](#in-the-aws-management-console):
1. In step 9, select **EKS** → **Container Insights**.
2. Check the **checkbox** next to your preferred **Metric Name** on the right. Commonly used metrics are **cluster\_failed\_node\_count** and **node\_cpu\_utilization**. Read [AWS' documentation](https://docs.aws.amazon.com/AmazonCloudWatch/latest/monitoring/Container-Insights-metrics-EKS.html) for more information on EKS metrics.
3. Continue with the instructions in steps 10-17.
## FAQ
**What alarm statuses affect PagerDuty incidents?**
An alarm with status `ALARM` triggers incidents, and status `OK` resolves them. Alarms with status `INSUFFICIENT_DATA` **only** trigger PagerDuty incidents. If you need `INSUFFICIENT_DATA` to resolve an incident, PagerDuty recommends using an [email integration](/integrations/email-integration-guide) instead.
**If I use an email integration, how can I verify my PagerDuty service's email address?**
If you send a confirmation email to your service's PagerDuty address, you can view the message body and verify that address from the PagerDuty console. To do so, find the incident that is created by the email and view its details to verify the email address.
The link to verify will be in the incident details. The SNS confirmation page requires JavaScript, which cannot be executed in the iframe the message is rendered in. To confirm your subscription, open the confirmation link in a new tab or window by right-clicking on the link and choosing **Open Link in New Tab/Window**.
**How can I change how events from CloudWatch are deduplicated into PagerDuty?**
By default, CloudWatch events are deduplicated based on `AlarmName`. This value may not be unique across regions, so you may want to change how your events are deduplicated. Navigate to your PagerDuty **Service** → click the **Integrations** tab → click to the right of your Amazon CloudWatch integration → click **Edit** → change the value for the **Correlate events by** option.
**Why are my CloudWatch events not triggering incidents in PagerDuty?**
Events that are not sent properly from CloudWatch are dropped and do not trigger alerts in PagerDuty. This integration expects to find a nested JSON-encoded object in the `Message` property, from which meaningful data about the alert can be extracted to compose the PagerDuty incident. You can find details on [Amazon's SNS Message attributes here](https://docs.aws.amazon.com/sns/latest/dg/sns-message-attributes.html).
AWS also offers a [troubleshooting guide](https://docs.aws.amazon.com/AmazonCloudWatch/latest/events/CWE_Troubleshooting.html#NeverDeliveredToTarget).
**Why is my CloudWatch event triggering duplicate incidents or automatically resolving an incident?**
If you have Event Orchestration rules that override event actions or `dedup_key`, they may unexpectedly interact with how PagerDuty handles `INSUFFICIENT_DATA` alarm states from CloudWatch.
When CloudWatch sends an `ALARM` type event, AWS may first send an `INSUFFICIENT_DATA` event (before the alarm has collected enough data) followed by a second event once sufficient data is available. To ensure you are notified promptly, PagerDuty triggers an incident on the `INSUFFICIENT_DATA` event. When the subsequent sufficient-data event arrives, PagerDuty automatically sends a resolve event for the `INSUFFICIENT_DATA` incident and triggers a new incident with the full alarm details. This prevents duplicate incidents from being triggered for the same alarm while still alerting you to the initial irregularity.
Event Orchestration rules that are applied to all incoming events, without accounting for `INSUFFICIENT_DATA` events, can disrupt this process in two ways:
- A rule that forces a trigger action on all events also applies to the resolve `INSUFFICIENT_DATA` event, causing a duplicate incident to be triggered unintentionally.
- A rule that overrides the `dedup_key` on all events causes the resolve `INSUFFICIENT_DATA` event to share the same key as the subsequent alarm incident, resulting in that incident being unexpectedly auto-resolved.
To prevent this unexpected behavior, add an Event Orchestration rule condition that excludes `INSUFFICIENT_DATA` events. For example, add a condition `event.summary does not match part Insufficient data`, so that the rule does not apply to these events.
For more details on configuring conditions in Event Orchestration, see [Event Orchestration](/ai-automation/aiops/event-orchestration).