# Common Event Format (PD-CEF)
Overview of the PagerDuty Common Event Format that is used to correlate similar items across integrations
The PagerDuty Common Event Format (PD-CEF) is a standardized alert format that allows PagerDuty to correlate similar items across integrations and better understand the events from your environment. PD-CEF also allows you to view alert and incident data in a cleaner, more normalized way. You can also use PD-CEF to dynamically suppress non-actionable alerts with [Event Orchestration](/ai-automation/aiops/event-orchestration).
PD-CEF details display at the top of alert and incident detail pages. They express common event concepts in a normalized, readable way.
## PD-CEF Fields
The table below outlines the name, type and description of each PD-CEF field, as well as an example value for each.
| Name | Description | Type | Required? | Example Value |
| --- | --- | --- | --- | --- |
| **Summary** | A high-level, text summary message of the event. Will be used to construct an alert's summary. | String | Required | `"PING OK - Packet loss = 0%, RTA = 1.41 ms"`
`"Host 'acme-andromeda-sv1-c40 :: 179.21.24.50' is DOWN"` |
| **Severity** | Indicates the severity of the impact to the affected system. | Enum | Required | `{Info, Warning, Error, Critical}` |
| **Source** | Specific human-readable unique identifier, such as a hostname, for the system having the problem. | String | Required | `"prod05.theseus.acme-widgets.com"`
`"171.26.23.22"`
`"aws:elasticache:us-east-1:852511987:cluster/api-stats-prod-003"`
`"9c09acd49a25"` |
| **Timestamp** | When the upstream system detected / created the event. This is useful if a system batches or holds events before sending them to PagerDuty. | Timestamp | Optional - Will be auto-generated by PagerDuty if not provided. | `2015-07-17T08:42:58.315+0000` |
| **Component** | The part or component of the affected system that is broken. | String | Optional | `"keepalive"`
`"webping"`
`"mysql"`
`"wqueue"`
`"LOAD_AVERAGE"` |
| **Group** | A cluster or grouping of sources. For example, sources “prod-datapipe-02” and “prod-datapipe-03” might both be part of “prod-datapipe” | String | Optional | `["production-app-stack"]`
`"prod-datapipe"`
`"www"`
`"web_stack"` |
| **Class** | The class/type of the event. | String | Optional | `"High CPU"`
`"Latency"`
`"500 Error"` |
| **Custom Details** | Free-form details from the event. | Object | Optional | `{"ping time": "1500ms", "load avg": 0.75 }` |
### PD-CEF Fields on an Alert
Below is an example of what PD-CEF information on an alert might look like in the web app:
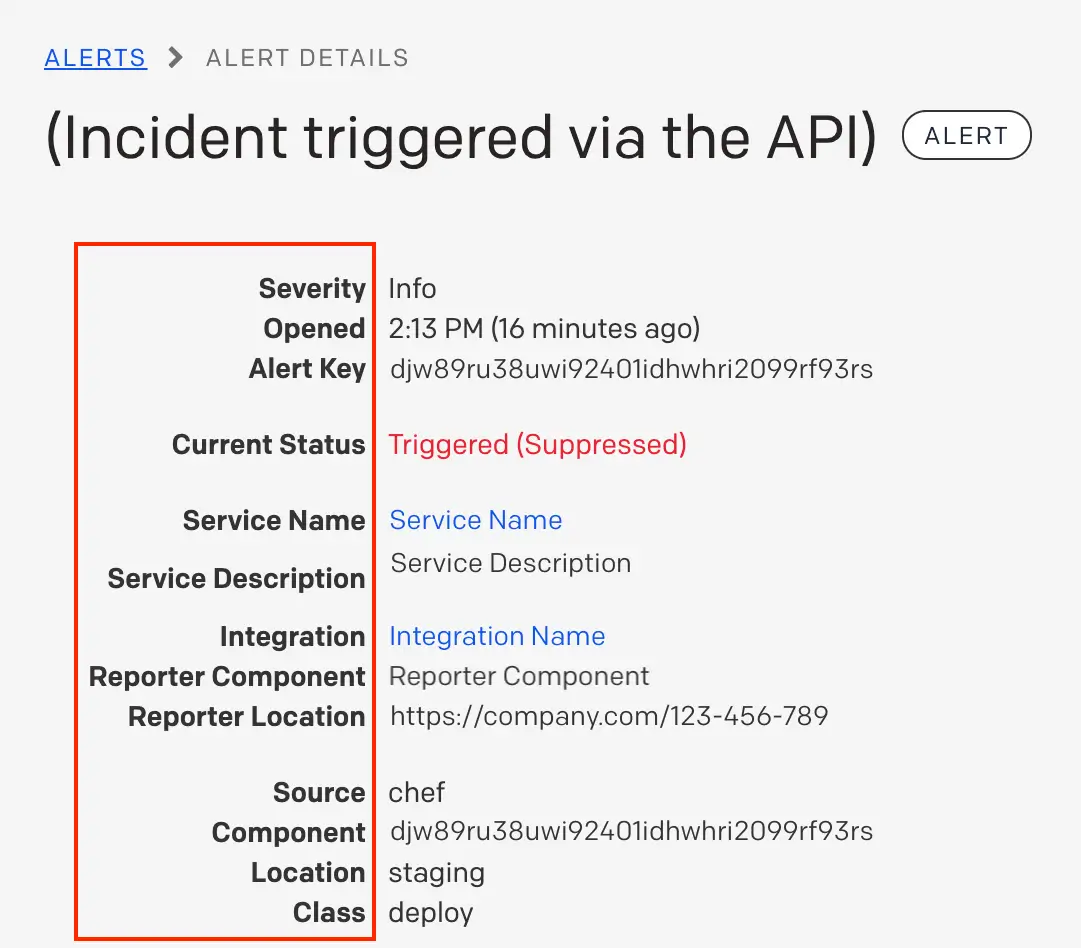
*PD-CEF Fields on an Alert*
### PD-CEF in the Alerts Table
The [alerts table](/incident-management/incidents/alerts#section-alerts-table) highlights PD-CEF fields in your alerts: **Severity**, **Summary**, **Source**, **Class**, **Component**, and **Group**. To customize the fields shown on the Alerts table, navigate to **Incidents** → **Alerts** and click **Customize Columns** on the right side.
## Events API v2
The Events API v2 offers a streamlined way to use PD-CEF fields in your alerts. Monitoring partners can now directly send events in the PD-CEF format, giving you the benefit of the format without the need to manually convert your events. Custom monitoring can also use this format to take advantage of the PD-CEF display and workflow features in PagerDuty.
Review our [developer documentation](/developer/events-api-v2-overview) for more information about the Events API v2 and how to use it.
### Example PD-CEF Payload
The following example shows PD-CEF fields inside an Events API v2 [trigger event's payload](/developer/send-alert-event#example-request-payloads):
```json
{
"payload": {
"summary": "Example alert on host1.example.com",
"timestamp": "2015-07-17T08:42:58.315+0000",
"source": "monitoringtool:cloudvendor:central-region-dc-01:852559987:cluster/api-stats-prod-003",
"severity": "info",
"component": "postgres",
"group": "prod-datapipe",
"class": "deploy",
"custom_details": {
"ping time": "1500ms",
"load avg": 0.75
}
} ...
}
```